Sustainable Freight Pathways to Zero and Near-Zero Emissions - California Air Resources Board
←
→
Page content transcription
If your browser does not render page correctly, please read the page content below
April 2015

                                                          AF T
    R
                                                          California Air Resources Board

   D
                                Sustainable Freight
                                                          Pathways to Zero and
                                                           Near-Zero Emissions
                                                                  DISCUSSION DOCUMENT

Sustainable Freight: A path to zero/near-zero emissions                                         1
This page intentionally blank.
Discussion Document

   Sustainable Freight: Pathways to Zero and Near-Zero Emissions
                     – A Discussion Document –

                    AIR RESOURCES BOARD (ARB) DISCUSSION
The Board will hear an update and public testimony on development of the Sustainable
Freight Strategy, and will discuss this document, at its regular April 23, 2015, meeting at
  1001 “I” Street, Sacramento, California, 95814. The Board agenda will be available
 10 days prior to the meeting at: http://www.arb.ca.gov/board/ma/2015/ma042315.pdf
                      Comments can be submitted electronically at:
                      http://www.arb.ca.gov/lispub/comm/bclist.php

                                 PROGRAM WEBPAGE
               For more information on this topic and upcoming meetings,
                           please see the program website at:
                         http://www.arb.ca.gov/gmp/sfti/sfti.htm

                              DOCUMENT AVAILABILITY
Electronic copies of this document and related materials can be found at:
http://www.arb.ca.gov/gmp/sfti/sfti.htm . Alternatively, paper copies may be obtained
from ARB’s Public Information Office, 1001 I Street, 1st Floor, Visitors and
Environmental Services Center, Sacramento, California, 95814, (916) 322-2990.

For individuals with sensory disabilities, this document is available in Braille, large print,
audiocassette or computer disk. Please contact the Air Resources Board's Disability
Coordinator at (916) 323-4916 by voice or through the California Relay Services at 711,
to place your request for disability services. If you are a person with limited English and
would like to request interpreter services, please contact the Air Resources Board's
Bilingual Manager at (916) 323-7053.

                                      QUESTIONS
                                   Ms. Heather Arias
                                Freight Transport Branch
                                  Air Resources Board
                    (916) 322-8382 or via email at: freight@arb.ca.gov

                                       DISCLAIMER
This report has been prepared by the staff of the Air Resources Board. Publication
does not signify that the contents reflect the views and policies of the Air Resources
Board, nor does mention of trade names or commercial products constitute
endorsement or recommendation for use.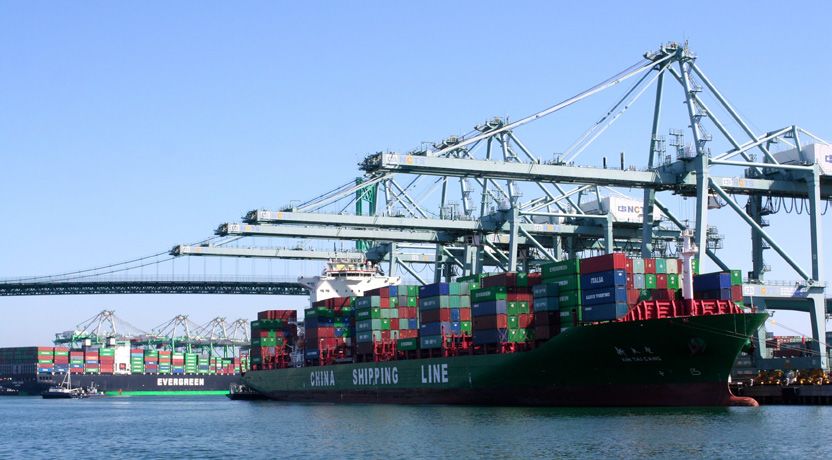
Discussion Document

                      This page deliberately blank.
Forward

In 2012, the California Air Resources Board (ARB or Board) directed staff to identify and
implement actions to quickly reduce health risk from diesel particulate matter.

The Sustainable Freight Pathways to Zero and Near-Zero Discussion Document
(Discussion Document) describes actions that respond to the Board’s direction to
Identify, prioritize, and recommend specific measures and actions to meet the State’s
air quality attainment and climate needs. The Board heard an informational update on
the Discussion Document, considered testimony, and adopted Resolution 15-22 in April
2015. Board Resolution 15-22, as adopted, is on the following page. The April 2015
Board meeting transcripts and written public comments can be found at the following
links:

   •   April 23 Board Meeting Transcript.
       http://www.arb.ca.gov/board/mt/2015/mt042315.pdf
   •   Written public comments on the Discussion Draft.
       http://www.arb.ca.gov/lispub/comm/bccommlog.php?listname=freight2015

As part of Resolution 15-22, the Board directed staff to develop a comprehensive,
integrated sustainable freight plan, in partnership with other State and local agencies -
the California Sustainable Freight Strategy. The Board considers the development of
the California Sustainable Freight Strategy a high priority to address localized health
impacts, attainment of air quality standards, and achieving climate goals. The
Discussion Document describes ARB’s initial air quality policy contribution to this effort.

Moving forward, staff will work to incorporate direction received via Board Resolution
15-22 and anticipates coming back to the Board with an update in late 2015.

In addition, the following clarifications were made to the draft version of the Discussion
Document:
    • Table numbering (throughout the document)
    • Updates to the following text:
         o Freight-dependent industries accounted for over $650 700 billion or
            32 percent of the California economy in 2013, and over 5 million or
            33 percent of California jobs. (pg. 10)
         o However, freight-related sulfate formation is expected and to be relatively
            low because of the successful implementation of low-sulfur fuels throughout
            the California freight transport system. (pg. 15)
         o Additionally, such studies, along with baseline incidence rates promote the
            ability to develop allow the calculation of quantitative health risk estimates.
            (pg. 16)
         o The costs economic valuation associated with health impacts discussed here
            are is high. (pg. 16)
         o Develop an ocean-going vessel renewable biofuels market through proposal
            of an amendment allowing that allows renewable biofuels suppliers to opt-in
the option of such fuels into the Low Carbon Fuel Standard if it is the
amendment is adopted, or inclusion in Cap and Trade (pg. 37).
State of California
                               AIR RESOURCES BOARD

                       Update on Sustainable Freight Strategy

                                    Resolution 15-22

                                      April 23, 2015

                                                                 Agenda Item No.: 15-3-4

WHEREAS, section 39003 of the Health and Safety Code charges the Air Resources
Board (ARB or Board) with coordinating efforts to attain and maintain ambient air quality
standards, to conduct research into the causes of and solution to air pollution, and to
systematically attack the serious problem caused by motor vehicles;

WHEREAS, sections 39600 and 39601 of the Health and Safety Code authorize the
Board to adopt standards, rules, and regulations and to do such acts as may be
necessary for the proper execution of the powers and duties granted to and imposed
upon the Board by law;

WHEREAS, sections 39666 and 39667 of the Health and Safety Code authorize the
Board to regulate emissions of toxic air contaminants from non-vehicular and vehicular
sources;

WHEREAS, sections 39666 and 39667 of the Health and Safety Code require an
airborne toxic control measure for an existing source for which the Board has not
specified a threshold exposure level, including a mobile source, be based on application
or utilization of the best available control technologies or more effective control
methods, unless the Board determines, based on an assessment of risk, that an
alternative level of emission reduction is adequate or necessary to prevent an
endangerment of public health;

WHEREAS, on August 27, 1998, the Board identified diesel particulate matter (PM) as a
toxic air contaminant pursuant to article 1 (commencing with section 39650), chapter
3.5, part 2, division 26 of the Health and Safety Code;

WHEREAS, the trucks, ships, locomotives, aircraft, harbor craft, and equipment that
move freight in California currently contribute about half of the total statewide diesel PM
emissions;

WHEREAS, sections 43013 and 43018 of the Health and Safety Code authorize the
Board to adopt and implement regulations, to control air pollution from motor vehicles
and off-road or non-vehicle engine categories, which the Board has found to be
necessary, cost-effective, and technologically feasible;
Resolution 15-22                         2

WHEREAS, the federal Clean Air Act requires the Board and local air districts to
prepare State Implementation Plans (SIPs) demonstrating how each nonattainment
region will attain the national 8-hour ozone and fine particulate matter (PM2.5)
standards, with plans due in 2016;

WHEREAS, freight equipment currently accounts for 45 percent of the statewide oxides
of nitrogen (NOx) emissions that react in the atmosphere to form ozone and PM2.5;

WHEREAS, the California Global Warming Solutions Act of 2006 (Assembly Bill 32;
Chapter 488 Statutes of 2006; Health & Safety Code section 38500 et seq.) declares ·
that global warming poses a serious threat to the economic well-being, public health,
natural resources, and environment of California; it granted ARB the authority to monitor
and regulate greenhouse gas emissions from all sources, and provided initial direction
on creating a comprehensive multi-year program to reduce California's greenhouse gas
emissions to 1990 levels by 2020, maintain and continue reductions beyond 2020, and
initiate the transformations required to achieve the State's long range climate goals;

WHEREAS, Executive Order S-3-05 established a California greenhouse gas emission
reduction target of 80 percent below 1990 levels by 2050; this target was reaffirmed in
Executive Order B-16-2012, which established a California target for the reduction of
greenhouse gas emissions from the transportation sector of 80 percent below 1990
levels by 2050;

WHEREAS, Assembly Bill 32 added section 38501 to the Health and Safety Code,
which expresses the Legislature's intent that ARB coordinate with State agencies and
consult with the environmental justice community, industry sectors, business groups,
academic institutions, environmental organizations, and other stakeholders in
implementing AB 32, and that ARB design emissions reduction measures in a manner
that minimizes costs and maximizes benefits for California's economy, maximizes
additional environmental and economic co-benefits for California, and complements the
State's efforts to improve air quality;

WHEREAS, section 38560 of the Health and Safety Code directs the Board to adopt
rules and regulations in an open public process to achieve the maximum technologically
feasible and cost-effective greenhouse gas emissions reductions from sources or
categories of sources;

WHEREAS, freight equipment is a substantial contributor to black carbon emissions, a
potent short-lived climate pollutant, and currently accounts for 6 percent of the statewide
greenhouse gas emissions with growth projected in future years;

WHEREAS, local air districts, ports, transportation and energy agencies, cargo owners,
trucking firms, railroads, shipping lines, and terminal operators are initiating or
continuing activities to reduce freight-related emissions; these actions are integral to the
success of California's air quality and climate programs;

WHEREAS, Resolution 14-2 directs staff to work with stakeholders to identify and
implement near-term actions to reduce localized risk in communities near freight
facilities, identify and prioritize actions to move California towards a sustainable freight
Resolution 15-22                          3

transport system, and evaluate and implement opportunities to prioritize transformative
zero and near-zero emission technologies;

WHEREAS, implementation of a sustainable freight transport system that relies on zero
and near-zero emission equipment powered by renewable energy sources needs to
meet multiple goals, including: enhancing the economic competitiveness and efficiency
of California's ports and logistics industries, creating jobs, and increasing the safety and
livability of freight corridors;

WHEREAS, State environmental, energy, and transportation agencies, together with the
business development office, will be working with local partners and stakeholders to
develop a proposed comprehensive, integrated sustainable freight plan- the California
Sustainable Freight Strategy-that will include actions and milestones to transition
California to a sustainable freight transport system;

WHEREAS, on April 3, 2015, ARB staff released a document entitled "Sustainable
Freight: Pathways to Zero and Near-Zero Emissions, Discussion Draft" (Discussion
Draft) to seek input from the public and the Board; and

WHEREAS, the Board finds that the Discussion Draft advances the objectives identified
in Resolution 14-2 and:

   1. The Discussion Draft sets out ARB's vision of a clean freight system and
      immediate and potential near-term ARB actions that staff will develop for future
      Board consideration or Executive Officer implementation, as appropriate under
      State law, to address localized health impacts, attainment of air quality
      standards, and climate goals.

   2. The Discussion Draft outlines the immediate steps ARB intends to pursue, and
      potential near-term actions ARB will consider, to advance California towards a
      zero and near-zero emission freight transportation system.

   3. As described in the Discussion Draft, and consistent with the objectives outlined
      in Resolution 14-2, staff has initiated efforts to develop a proposed California
      Sustainable Freight Strategy for future consideration by the Board, in partnership
      with the California Transportation Agency, the California Environmental
      Protection Agency, the Office of Business and Economic Development, the
      California Department of Transportation, and the California Energy Commission.

   4. The Discussion Draft provides ARB's initial proposed air quality policy
      contribution to the broader California Sustainable Freight Strategy effort.

NOW, THEREFORE, BE IT RESOLVED that the Board directs staff to:

    1. Pursue development of the potential near-term actions described in the
       Discussion Draft for Board consideration or Executive Officer implementation, as
       appropriate under State law, as quickly as possible to meet public health and
       climate change needs.
Resolution 15-22 4
2. Evaluate the potential ARB levers described in the "Vision for the Future" section
of the Discussion Draft for inclusion in future planning documents that address
federal and State air quality and climate change goals.
3. Evaluate and consider both the potential ARB levers and the broad-based
approaches for freight facilities and systems described in the Discussion Draft,
especially the range of system efficiency improvements that depend on industry
participation and leadership, as part of the development of a proposed California
Sustainable Freight Strategy.
4. Work closely with local air districts in the preparation of the 2016 State
Implementation Plan, and give strong consideration to actions identified in the
Sustainable Freight Strategy in the development of that State Implementation
Plan.
BE IT FURTHER RESOLVED that the Board considers the development of a
comprehensive California Sustainable Freight Strategy to be a high priority for the
agency and directs staff to:
1. Continue engaging cargo owners; the logistics industry; labor; ports and airports;
utilities; business leaders; environmental and community groups; environmental
justice groups; academics; air districts; metropolitan planning organizations;
federal government agencies; and other interested stakeholders on development
of a proposed California Sustainable Freight Strategy.
2. Continue working with the identified State agencies, in addition to the California
Department of Food and Agriculture, and other affected Boards and
Commissions to develop a proposed California Sustainable Freight Strategy for
consideration that addresses the State's air quality, climate, energy,
transportation, and economic objectives.
3. Explore revenue opportunities to provide funding to the measures in a proposed
California Sustainable Freight Strategy.
BE IT FURTHER RESOLVED that the Board directs staff to incorporate revisions
identified by the Board into the Discussion Draft, return to the Board in late 2015 with an
informational update on the immediate actions and potential near-term actions
described in the Discussion Draft, and continue efforts to contribute to development of a
proposed California Sustainable Freight Strategy.
I hereby certify that the above is a true
and correct copy of Resolution 15-22 as
adopted by the Air Resources Board.
Tracy Jensen,lerDiscussion Document
Contents
Executive Summary ........................................................................................................ 1
I. Background ........................................................................................................... 8
A. Freight Transport System ................................................................................... 8
B. Emissions ......................................................................................................... 10
C. Health Impacts ................................................................................................. 14
D. Air Quality and Climate Goals .......................................................................... 20
II. ARB Strategies .................................................................................................... 22
A. Moving Towards Zero Emissions ..................................................................... 23
B. Accelerating Technology Development and Deployment ................................. 24
C. Near-Term NOx Reductions from Trucks ......................................................... 26
D. Immediate ARB Actions to Reduce Health Risk ............................................... 27
E. Near-Term ARB Measures ............................................................................... 29
F. Vision for the Future ......................................................................................... 34
III. Expanding Our Focus to Freight Facilities and Systems ..................................... 43
A. Facility Based Approach to Facilitate Transformation ...................................... 44
B. Land Use and Transportation Infrastructure Considerations ............................ 46
C. System Efficiency and Transformation ............................................................. 47
IV. Next Steps ........................................................................................................... 54
A. Sustainable Freight: Path to Zero/Near-Zero Emissions ................................. 54
B. California Sustainable Freight Strategy ............................................................ 54
Appendix A: Emissions.................................................................................................. 58
A. Emission Tables ............................................................................................... 58
B. Growth Assumptions ........................................................................................ 59
Appendix B: Stakeholder Engagement......................................................................... 63
Appendix C: Immediate ARB Actions ........................................................................... 66
A. Enforcement ..................................................................................................... 66
B. Incentives ......................................................................................................... 67
Appendix D: Near-Term ARB Actions .......................................................................... 69
A. Cleaner Combustion ........................................................................................ 69
B. Zero Emission Requirements ........................................................................... 77Executive Summary
To achieve its healthy air quality, climate, and sustainability goals, California must take
effective, well-coordinated actions to transition to a zero emission transportation system
for both passengers and freight.
The freight transport system is a major economic engine for our State, but also
accounts for about half of toxic diesel particulate matter (diesel PM), 45 percent of the
emissions of nitrogen oxides (NOx) that form ozone and fine particulate matter in the
atmosphere, and six percent of the greenhouse gas (GHG) emissions in California.
These statistics include emissions from trucks, ships, locomotives, aircraft, harborcraft,
and all types of equipment used to move freight at seaports, airports, railyards,
warehouses and distribution centers.
It is clear that in order to meet our public health mandates, climate goals, and economic
needs, the transition to a less-polluting, more efficient, modern freight transport system is a
preeminent policy objective for the State of California – and will continue to be so for several
decades to come. It will require us to make steady and continual progress in moving both
domestic and international cargo in California more efficiently, with zero emissions
everywhere feasible, and near-zero emissions with renewable fuels everywhere else.
The transition to this modern freight system will rely on public and private funds invested in
infrastructure projects, vehicle and equipment purchases, technology applications, and
system management approaches. It will also require regulatory and other programs to spur
zero emission and other clean technology development and deployment. Many of the
needed steps have happened already. Others must happen over the coming years. In
some cases, the move to zero emission technology can happen immediately. In other
cases, the technology needs to be further developed, and intermediate steps to ever-
cleaner technologies will take us toward the ultimate goal of zero emissions.
California’s freight system is part of the vast interconnected national and global system.
As the global system changes in response to economic forces, California’s system will
also evolve. This evolution presents a tremendous opportunity to make increased
system efficiency and zero emission technology mutually reinforcing. Computerized
logistics systems and technologies to physically move containers and trucks more
efficiently will reduce emissions, but can also benefit from the performance
characteristics and operation of modem zero emission drive systems. Approached this
way, California can move more goods, with less energy, and less pollution.
A more efficient, zero and near-zero emission freight system will demand not only new
equipment and fuels, but also new transportation infrastructure, communications, and
industry operating practices. We will need workers trained to build, maintain, and
operate this advanced equipment and communications systems. To help fund these
efforts, California’s logistics industry must remain profitable in the face of increasing
competition from other North American seaports and supply chains. The ability to
readily adapt to changing trends and expand operations is key to improving the
1Discussion Document
competitiveness of the system. Community acceptance of industry expansion often
depends on the prospects for new local jobs, clean air, and safe operations.
The California Air Resources Board (ARB or Board) is working with the State’s
transportation and energy agencies, as well as its economic development office, local
partners, and stakeholders to develop a comprehensive, integrated plan—the California
Sustainable Freight Strategy. A sustainable freight system is one that meets
California’s environmental, energy, mobility, safety, and economic needs by: enhancing
system efficiency; deploying zero and near-zero emission freight equipment powered by
renewable energy sources; providing reliable velocity while increasing safety, mobility
and capacity; and improving the competitiveness of our logistics system.
To inform that effort, this report sets out ARB’s vision of a clean freight system, together
with the immediate and near-term steps that ARB will take to support use of zero and
near-zero emission technology.
Need to Accelerate Progress
Together with our local and federal government partners, we have motivated and
required extensive changes across the State. Truck owners, ocean carriers, terminal
operators, and railroads have made substantial investments to transition their diesel-
fueled freight equipment to cleaner models, while refineries retooled to produce cleaner
diesel fuels. We are seeing the real-world benefits of those investments—measurably
cleaner air in communities near seaports, railyards, and freeways over the last decade.
For example, these combined actions have cut toxic diesel PM at the State’s largest
ports by 80 percent over the last decade.
However, the need to accelerate air quality progress for public health is urgent and the
scope of emission reductions required to meet our mandates is vast. California must
pursue immediate actions to reduce the unacceptably high risk from freight sources,
and re-orient our freight system to meet our State Implementation Plan, and ultimately
reshape the freight system to meet our long-term climate goals. This presents
California with some notable challenges:
• Health risks: Despite substantial progress over the last decade, the remaining
localized risks of cancer and other adverse effects near major freight hubs is not
acceptable and must be significantly reduced. New health science tells us that
infants and children are 1.5 to three times more sensitive to the harmful effects of
exposure to air toxics, like those emitted from freight equipment, than we
previously understood, which heightens the need for further risk reduction.
• More protective air quality standards: Current control programs will reduce
NOx and PM2.5 emissions over 50 percent by 2030, but the next State
Implementation Plans required by federal law to demonstrate our path to attain
ozone and diesel PM air quality standards will compel significant additional
emission reductions in the South Coast and San Joaquin Valley.
2Discussion Document
• Climate change goals: New efforts in response to climate change are ramping
up the pressure for further progress in the 2030 and 2050 timeframes to reduce
GHG and short-lived climate pollutants, like black carbon from diesel equipment.
Actions to Further Reduce Emissions from Freight Operations
At two meetings in 2014, the Board directed ARB staff to identify and implement actions
to quickly reduce the health risk from diesel PM in the most impacted communities
around freight hubs. This report describes near-term actions that respond to the
Board’s direction, as well as the potential new measures and other approaches we are
evaluating to meet all of our air quality and climate goals. These actions build on the
conclusions of a companion document entitled Draft Heavy-Duty Technology and Fuels
Assessment Overview, April 2015, developed by ARB staff with agency partners.
Immediate ARB Actions. ARB staff is initiating actions now to enhance enforcement
and deploy incentives to deliver new emission reductions and further reduce health risks
in impacted communities in 2015.
• We are expanding enforcement at or near freight hubs through several
mechanisms:
o First, ARB is reassigning existing personnel to assist with these focused
enforcement efforts and continuing to seek additional air district and port
partners that can enforce ARB regulations in their jurisdictions.
o Second, staff will maximize compliance and enforcement efforts at freight
hubs by: conducting over 50 percent of heavy-duty diesel truck inspections at
seaports, intermodal railyards, and distribution centers in or near
disadvantaged communities.
o Third, to increase the efficiency of our enforcement of the Statewide Truck
and Bus Rule, we are focusing on larger truck fleets and brokers first.
o And fourth, staff is developing a pilot program to use remote imaging and
sensing to identify non-compliant trucks and target them for compliance
assistance.
• Through the State-funded incentive programs administered by ARB and the local
air districts, we expect that 1,500-1,700 new trucks and other freight equipment
will be put into service in 2015. These include zero emission and hybrid trucks,
as well as diesel and natural gas trucks, locomotives, and marine vessels that
are replacing older, higher-emitting models.
Near-Term ARB Measures. ARB staff has identified a range of measures that we
intend to begin developing in 2015-2016 for Board consideration within the next few
years (or near-term implementation for steps that do not require Board action). These
focus on both cleaner combustion technologies and introduction of zero emission
equipment.
3Discussion Document
Summary of Near-Term ARB Measures
ARB
ARB
Near-Term ARB Measures Implemen-
Action
tation
Cleaner Combustion
Trucks
Trucks Action 1: Develop and propose strategies to ensure durability
and in-use performance. Such strategies may include:
• Reduced exhaust opacity limits for PM filter-equipped trucks.
• New certification and warranty requirements for low in-use emissions.
2015-
• Strengthen existing emission warranty information reporting and 2017
2017+
enable corrective action based on high warranty repair rates.
• Clarification on the State’s authority to inspect heavy-duty warranty
repair facilities to ensure proper emission warranty repairs are being
conducted.
Trucks Action 2: Develop and propose increasing flexibility for
manufacturers to certify advanced innovative truck engine and vehicle
2015 2016
systems in heavy-duty applications. Enables accelerated introduction
of new technologies to market.
Trucks Action 3: Develop and propose new, stringent California
2016-
Phase 2 GHG requirements to reduce emissions from trucks and 2018+
2017
trailers, and provide fuel savings.
Trucks Action 4: Petition U.S. EPA to develop lower NOx standards
for new heavy-duty truck engines for rulemaking in 2018.
2015 --
Trucks Action 5: (if U.S. EPA does not complete Trucks Action 4):
Develop and propose California specific standards for new heavy-duty 2018 2023+
truck engines to provide benefits above national standards.
Ocean-Going Vessels
Ocean-Going Vessels Action 1: Advocate with international partners
for new International Maritime Organization Tier 4 NOx/PM standards,
and efficiency targets for existing vessels in Ship Energy Efficiency 2015 --
Management Plans for International Maritime Organization action 2018-
2020.
Ocean-Going Vessels Action 2: Define criteria for “Super Low
Emission Efficient Ship” and achieve early implementation of clean
technologies (liquefied natural gas, Tier 3, or better) for newer vessels 2016 2018
via existing and enhanced seaport incentive programs (e.g. Green
Ship, Ship Index, etc.).
Ocean-Going Vessels Action 3: Develop and propose amendments
to the At-Berth Regulation to include other vessel fleets and types to 2016 2020+
achieve additional emission reductions.
4Discussion Document
Summary of Near-Term ARB Measures, continued
ARB
ARB
Near-Term ARB Measures Implemen-
Action
tation
Locomotives
Locomotives Action 1: Petition U.S. EPA to develop a Tier 5 national
locomotive emissions standard for criteria pollutants and GHG (based
2015 --
on aftertreatment, liquefied natural gas, and/or zero emission track
miles) for rulemaking in 2018 and introduction in 2025 and beyond.
Locomotives Action 2: Petition U.S. EPA to amend its regulations that
define a preempted “new” locomotive engine for rulemaking in 2017.
2015 --
The desired outcome is to limit federal preemption to the initial useful
life (typically seven to ten years) of the locomotive engine.
Locomotives Action 3 (contingent on Locomotives Action 2):
Develop and propose a regulation applicable to all non-new locomotives
to maximize the use of Tier 4 engines, liquefied natural gas, or better 2018 2020-2030
line-haul, medium horsepower, and switch locomotives (provide credit
for zero emission track miles and zero emission locomotives).
All sectors/freight hubs
All sectors/freight hubs: Collect data (such as facility location,
equipment, activity, and proximity to sensitive receptors) from seaports,
airports, railyards, warehouse and distribution centers, truck stops, etc.
2015 2015-2016
to identify and support proposal of facility-based approach and/or
sector-specific actions to reduce emissions and health risk, as well as
efficiency improvements.
Zero Emissions
Delivery Vans/Small Trucks: Develop proposal to accelerate
penetration of zero emission trucks in last mile freight delivery 2017 2020
applications, with potential incentive support.
Large Spark-Ignition Equipment (forklifts, etc): Develop proposal to
2016-
establish purchase requirements to support broad scale deployment of 2020
2018
zero emissions equipment.
Transit Buses: Develop proposal to deploy commercially available
zero emission buses in transit, and other applications, beginning with
incentives for pilot programs and expanding purchase requirements, as 2016 2018
appropriate, to further support market development of zero emission
technologies in the heavy-duty sector with potential incentive support.
Airport Shuttles: Develop proposal to deploy zero emission airport
2017-
shuttles to further support market development of zero emission 2020
2018
technologies in the heavy-duty sector, with potential incentive support.
Transport Refrigeration Units: Develop and propose a regulatory
requirement to prohibit the use of fossil-fueled transport refrigeration 2016 2020+
units for cold storage in phases, with incentive support for infrastructure.
Incentive programs: Develop modifications to existing incentive
programs to increase the emphasis on and support for zero and near- 2015-
2016-2020
zero equipment used in freight operations, including introduction of truck 2016
engines certified to optional low-NOx standards.
5Discussion Document
Vision for the Future
Although the time horizon to commercialize and introduce zero emission technology
may be long-term for some equipment categories and applications, the potential levers
that ARB could exercise to accelerate that introduction cover the time spectrum from
2015 through the next several decades. They also include actions to achieve interim
progress through use of near-zero emission technologies powered by low-carbon
energy sources.
The report includes summary tables that describe the prospects to accelerate progress
toward zero emissions for trucks, ocean-going vessels, locomotives, transport
refrigeration units, cargo/industrial/ground service equipment, commercial harbor craft,
and aircraft. These tables reflect ARB staff’s current vision for each equipment
category, list key challenges to the development and widespread deployment of zero
and near-zero emission technologies, and identify potential levers available to ARB.
After the April 2015 Board meeting, ARB staff will further evaluate and develop, as
appropriate, a subset of the potential levers identified in this section in partnership with
other agencies and in consultation with stakeholders. These may become additional
near-term measures, or new mid-term measures, that support the State Implementation
Plan, the Climate Change Scoping Plan, and other efforts.
Additional Approaches to Support System Transformation and Efficiency
In addition to the specific ARB levers and actions discussed above, the report discusses
other approaches for the freight industry to reduce emissions, through a facility-based
emissions cap, use of land use and transportation planning mechanisms, and
systemwide efficiency improvements.
Next Steps
This report is an outline of the initial steps ARB intends to take to achieve a zero and
near-zero emissions freight system. We will be working with our State, local, and
federal agency partners on the Sustainable Freight Strategy, in consultation with all
interested stakeholders over the next year. ARB staff expects to bring a proposal to the
Board for consideration in the first half of 2016 that includes the strategies, as well as
the required environmental and economic analyses.
Work is also underway on the development of State Implementation Plans and the
Climate Change Scoping Plan that will draw from the immediate actions and near-term
measures described in this report, as well as additional measures (regulatory or
voluntary) and partnerships to be identified in the Sustainable Freight Strategy. This
document and the Sustainable Freight Strategy are part of a comprehensive step-wise
planning and implementation effort to meet the State’s multiple environmental and
public heath goals.
6Discussion Document
Following public comment and Board direction at its April 23, 2015 meeting, staff will
finalize this report and focus on the integrated Sustainable Freight Strategy. The full
Strategy will include additional measures to reduce emissions to meet the State
Implementation Plan and Climate Change Scoping Plan needs as well as other
objectives. We expect to provide an update to the Board in late 2015 on both the near-
term ARB actions and planning underway. Staff anticipates bringing a proposed
Sustainable Freight Strategy to the Board for consideration in the first half of 2016.
7Discussion Document
I. Background
This section provides background on the framework of the freight system, air pollutant
emissions and health impacts, and our air quality and climate goals.
A. Freight Transport System
The smooth functioning of California’s freight transport system depends on the
interactions between equipment, infrastructure, and facilities. The vehicles and
equipment that move freight range from aircraft and ocean-going vessels for
international transport, to locomotives and trucks for interstate transport, and smaller
trucks/vans and harborcraft for in-state operations. A wide variety of cargo handling,
industrial, and ground service equipment is used at freight hubs like seaports, railyards,
airports, distribution centers, warehouses, and truck stops. Also, moving perishable
products requires transport refrigeration units to provide the necessary cooling.
We consider all of the freight hubs to be freight facilities, along with the network of
roads, land ports of entry (border crossings), railways, and waterways that provide the
transportation infrastructure.
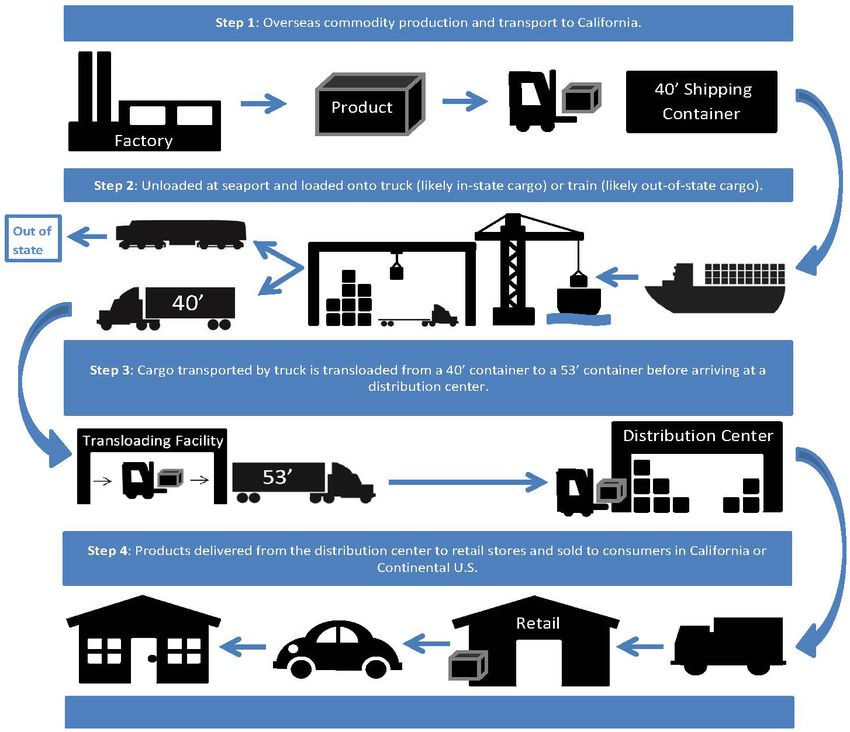
For illustrative purposes, Figure 1 shows the key steps in one example of an import
supply chain for an international product purchased at a retail location by a consumer.
It is a simplistic depiction of the transport modes, equipment, and facilities often used to
move imports from the manufacturer to the destination market, whether in California or
elsewhere in the U.S.
8Discussion Document
FIGURE 1: Import Supply Chain Example
California’s economy is supported by commerce and trade-related activities that rely on
a complex freight transport system. In 2013, California’s $2.2 trillion economy was the
world’s eighth largest, as measured by gross domestic product, the value of all goods
and services produced in the State. California also accounted for 13 percent of the
nation's gross domestic product ($16.8 trillion) in 2013, while accounting for 12 percent
of the population. 1,2,3 California’s diverse economy and prosperity are tied to the export
1
United States Department of Commerce, Bureau of Economic Analysis, “Current-
Dollar and ‘Real’ Gross Domestic Product,” January 2015,
, accessed March 17, 2015.
2
United States Department of Commerce, Bureau of Economic Analysis, “Widespread
but Slower Growth in 2013: Advance 2013 and Revised 1997–2012 Statistics of GDP
9Discussion Document
and import of freight moving throughout the State, and are dependent on an integrated
freight transport system.
Freight-dependent industries are defined in this report as those industries where freight
transport is of high-level importance to their operations. These industries rely heavily on
the transport of raw materials, intermediate goods, and finished products. They also
typically include transportation, warehousing and utilities, wholesale and retail trade,
manufacturing, agriculture, and mining. Freight-dependent industries accounted for
over $700 billion or 32 percent of the California economy in 2013, and over 5 million or
33 percent of California jobs.
Job metrics are frequently used to measure the economic impacts of
transportation. Determining the number of freight-transportation related jobs requires
identifying industries that are interlinked with the freight transport system; a narrow
application would only include jobs that are directly affected by freight. However,
considering the extensive supply-chain activities that the freight transport system
connects, it is reasonable to include industries that are freight-dependent in job
calculations. This approach is consistent with recent reports prepared for California
agencies.
Throughout the freight transport system, jobs are created in the manufacturing, retailing,
wholesaling, construction, transportation, and warehousing sectors. The freight
transport system is also interlinked with regional and national economies.
Understanding the relationships between the freight transport system, economic
indicators (including employment, number of establishments, and gross state product),
and funding needs is critical.
B. Emissions
The engines that move freight in California contribute to our primary air pollutants. In
response, ARB and its partners have motivated and required extensive changes across
the State focused on the use of cleaner technologies. Industry has made substantial
investments to transition its mostly diesel-fueled freight equipment to cleaner models,
while refineries retooled to produce cleaner fuels.
ARB has adopted and implemented over a dozen regulations, as well as agreements
with industry and incentive programs, to reduce freight emissions. We are seeing the
real-world benefits of those investments—measurably cleaner air in communities near
seaports, railyards, and freeways. Since 2005, the Port of Los Angeles and Port of
Long Beach have achieved an 80 percent reduction in diesel PM emissions based on
by State,” June 11, 2014,
, accessed
March 18, 2015.
3
The World Bank, “GDP (current US$),” 2015,
http://data.worldbank.org/indicator/NY.GDP.MKTP.CD?order=wbapi_data_value_2012+
wbapi_data_value&sort=desc, accessed March 18, 2015.
10Discussion Document
ARB rules and port initiatives. Figures 2-5 show how these regulations and investments
have cut statewide freight emissions of NOx, sulfur oxides (SOx), particulate matter 2.5
microns or less in diameter (PM2.5), GHG, and the expected future reductions.
FIGURE 2: Statewide NOx Emissions FIGURE 3: Statewide SOx Emissions
from Freight Sources from Freight Sources
(tons per day) (tons per day)
2000 200
1500
NOx 150
SOx
1000 100
500 50
0 0
2000 2005 2010 2015 2020 2025 2000 2005 2010 2015 2020 2025
FIGURE 4: Statewide PM2.5 Emissions FIGURE 5: Statewide GHG
from Freight Sources Emissions from Freight Sources
(tons per day) (million metric tons CO2-e per year)
60 40
50 PM2.5
30
40
30 20
GHG
20
10
10
0
0
2000 2005 2010 2015 2020 2025
2000 2005 2010 2015 2020 2025
Despite the progress made, freight transport emissions remain a large contributor to air
pollution. Freight equipment currently accounts for about half of the statewide diesel
PM emissions, which are both a toxic air contaminant and a contributor to black carbon,
a powerful short-lived climate pollutant. Freight operations also account for
approximately 45 percent of the statewide NOx emissions and six percent of the
statewide GHG emissions.
Looking ahead, emissions from some categories, like trucks, continue to decline over
the next decade as adopted controls are fully implemented, then begin to increase as
growth in activity overcomes the benefits of the existing controls. For other categories
like ships and aircraft, that are subject to fewer controls, the emissions continue to
steadily grow. Appendix A provides additional information regarding emissions and
growth assumptions.
11Discussion Document
Figures 6 and 7 show projected statewide PM2.5 and NOx emissions by sector from
2012 through 2050. Projected emissions reflect anticipated increases in cargo activity,
along with the benefits of existing control programs. Eventually, growth in freight activity
overcomes the benefits of adopted controls. The single largest contributor in 2012 is
the trucking sector. In later years after implementation of the existing truck regulations
is complete, the ocean-going vessel sector replaces it as the largest contributor.
FIGURE 6: Statewide PM2.5 Emissions from Freight Sources
with Existing Control Program*
30
Aircraft
PM2.5 Emissions Tons per Day
25
Commercial
20 Harbor Craft
Locomotives
15
Equipment
10
Ocean Going
5
Vessels
Trucks
0
2012 2020 2030 2040 2050
Year
*Ocean-going vessels out to 24 nautical miles. Aircraft up to 3,000 feet.
FIGURE 7: Statewide NOx Emissions from Freight Sources
with Existing Control Program*
1,000
Aircraft
900
NOx Emissions Tons per Day
800 Commercial
700 Harbor Craft
600 Equipment
500
400 Locomotives
300
Ocean Going
200
Vessels
100
Trucks
0
2012 2020 2030 2040 2050
Year
*Ocean-going vessels out to 24 nautical miles. Aircraft up to 3,000 feet.
12Discussion Document
Figure 8 reflects increasing GHG emissions by sector through 2050. Unlike other
pollutants, total freight GHG emissions continually increase because existing control
strategies for this industry have primarily focused on reducing toxic and criteria
pollutants. The largest contributors are the trucks, ocean-going vessels, and
locomotives sectors. Existing programs targeted at reducing GHG from the trucking
sector include the federal Phase I rule for trucks and ARB’s Tractor-Trailer GHG
Reduction Regulation. Development of federal and California-specific Phase 2 GHG
rules are underway; both aim to achieve further reductions after 2018. ARB’s
shorepower regulation for ships at berth is eliminating GHGs and other pollutants
through the use of grid-based electrical power.
FIGURE 8: Statewide GHG Emissions from Freight Sources
with Existing Control Program*
60
Commercial
CO2E Emissions Million Metric Tons per Year
50 Harbor Craft
Aircraft
40
Equipment
30
Locomotives
20
Ocean Going
10
Vessels
0
Trucks
2012 2020 2030 2040 2050
Year
*Ocean-going vessels out to 24 nautical miles.
Figures 9 and 10 show PM2.5 and NOx emissions for major freight corridors. Both
pollutants show dramatic near-term reductions with longer-term increases as growth in
cargo activity overcomes the benefits of adopted controls. All areas of California
experience benefits from reduced PM2.5 emissions and the associated health risk.
Current control programs will reduce NOx and PM2.5emissions by over 50 percent by
2030. However, meeting federal ozone and PM2.5 standards in the South Coast and
San Joaquin Valley will require significant further reductions over the next fifteen
years. This includes meeting the 80 parts per billion 8-hour ozone standard by 2023,
and the 75 parts per billion 8-hour ozone standard by 2031, as well as the
12 micrograms per cubic meter annual PM2.5 standard by 2021 to 2025. Efforts to
achieve further near-term emission reductions are essential in meeting these air quality
standards.
13Discussion Document
FIGURE 9: Regional PM2.5 Emissions from Freight Sources
with Existing Control Program*
30
PM2.5 Emissions Tons per Day
25
Sacramento Valley
20
Border
15
Bay Area
10
San Joaquin Valley
5
South Coast
0 Rest of State
2012 2020 2030 2040 2050
Year
*Ocean-going vessels out to 24 nautical miles. Aircraft up to 3,000 feet.
FIGURE 10: Regional NOx Emissions from Freight Sources
with Existing Control Program*
1000
900
NOx Emssions Tons per Day
800 Sacramento Valley
700
600 Border
500
400
Bay Area
300 San Joaquin Valley
200
100 South Coast
0 Rest of State
2012 2020 2030 2040 2050
Year
*Ocean-going vessels out to 24 nautical miles. Aircraft up to 3,000 feet.
C. Health Impacts
The emissions from the heavy equipment that transports freight within and through
California contributes to both elevated ambient levels of criteria pollutants such as
PM2.5 and ozone, as well as localized impacts near freight hubs and facilities. This
section summarizes our current understanding of the effect of freight emissions on both
the statewide health effects and valuation due to ambient PM2.5 levels, as well as the
excess cancer risk from near-source exposure to PM2.5.
14Discussion Document
1. Statewide Health Impacts
The estimation of premature deaths, hospitalizations, and emergency room visits
related to PM2.5 exposure presented below is based on a peer-reviewed methodology
developed by the U.S. Environmental Protection Agency (U.S. EPA), updated with
observed relationships between emissions and exposure, and California-specific
demographic and baseline health incidence rate data. 4 Table 2 shows the premature
deaths, hospitalizations, and emergency room visits associated with freight emissions of
both primary PM2.5 and secondary PM2.5 (particle nitrates formed from photochemical
reactions of the precursor NOx).
ARB staff updated its estimates of the health impacts from ambient PM2.5 pollution
attributable to direct PM and NOx emissions from freight sources in each region of
California. These estimates do not include the health impacts of ozone pollution from
freight emissions, or the component of PM2.5 due to secondary sulfate from freight
emissions.
Freight emissions also contribute to ozone formation in California. Because ozone
formation is a complex, non-linear process, photochemical modeling of freight-related
emissions is needed in order to estimate the health impacts associated with ozone
exposure. This modeling is planned for the summer of 2015, and the health impacts of
freight-related ozone exposure will be estimated at that time. Ozone-related premature
deaths are likely to be relatively small compared to those associated with freight-related
PM2.5 exposures because of the approximately order of magnitude lower
concentration-response function for ozone, while hospitalizations are expected to be
higher.
Emissions for SOx from freight sources are another contributor to secondary PM2.5
(particle sulfates). However, freight-related sulfate formation is expected to be relatively
low because of the successful implementation of low-sulfur fuels throughout the
California freight transport system. It was not possible to establish a relationship
between SOx emissions and sulfate formation because of the relatively high
contribution of poorly quantified non-local sources such as intercontinental transport and
biogenic formation.
The health endpoints selected are the same as those used by the U.S. EPA
Quantitative Risk Assessment for Particulate Matter as part of the National Ambient Air
Quality Standard setting process. 5 U.S. EPA chose premature deaths, hospitalizations,
and asthma and respiratory emergency room visits as endpoints. These endpoints
were chosen because the U.S. EPA has determined that a variety of studies have
4
ARB, “Initial Statement of Reasons, Appendix J, Regulation to Reduce Emissions of
Diesel Particulate Matter, Oxides of Nitrogen and Other Criteria Pollutants from In-Use
Heavy-Duty Diesel-Fueled Vehicles,” 2010.
5
U.S. EPA, “Quantitative Health Risk Assessment for Particulate Matter - Final Report
Publication No. EPA-452/R-10-005,” 2010.
15Discussion Document
shown evidence that there is a causal relationship between these end points and
PM2.5. Additionally, such studies, along with baseline incidence rates allow the
calculation of quantitative health risk estimates.
ARB staff used a methodology that relates the observed association between emissions
and pollutant concentrations to quantify health benefits. This method is similar in
concept to the methodology developed by the U.S. EPA for health benefit estimation
with the addition of California-specific population and health incidence rates. 6 Details of
ARB’s methodology can be found in Appendix J of the Regulation to Reduce Emissions
of Diesel Particulate Matter, Oxides of Nitrogen and other Criteria Pollutants from In-
Use Heavy-Duty Diesel-Fueled Vehicles. 7
a. Economic Valuation of Health Impacts
The economic valuation associated with health impacts discussed here is high. Over
99 percent of the economic impact is from premature death. U.S. EPA established the
value of mortality risk reduction as $7.4 million in 2006 dollars. Adjusted for real income
and inflation, the value of mortality risk reduction is equivalent to $8.9 million in 2013
dollars. Table 3 lists the economic value of avoiding the adverse health impacts
associated with freight emissions in 2013 dollars. The value of mortality risk reduction
is based on contingent valuation and wage-risk studies, which examine the willingness
to pay for a minor decrease in the risk of premature death. As real income increases,
people are willing to pay more to reduce their risk of premature death.
The economic values of respiratory and cardiovascular hospitalizations were drawn
from Chestnut, et al. (2006). 8 The authors of this study estimated the value of reducing
hospitalizations based on cost of illness and willingness to pay. The economic value of
emergency room visits for asthma was drawn from the U.S. EPA’s 2011 Regulatory
Impact Assessment for Ozone and PM2.5. 9 The values were adjusted for inflation to
2013 dollars using the U.S. Bureau of Labor Statistics Consumer Price Index for
medical care.
6
Neal Fann, Charles M. Fulcher, and Bryan J. Hubbell. “The influence of location,
source, and emission type in estimates of the human health benefits of reducing a ton of
air pollution,” Air Quality, Atmosphere and Health, Vol 2, 2009, pp. 169–176.
7
ARB, “Initial Statement of Reasons, Appendix J, Regulation to Reduce Emissions of
Diesel Particulate Matter, Oxides of Nitrogen and Other Criteria Pollutants from In-Use
Heavy-Duty Diesel-Fueled Vehicles,” 2010.
8
Lauraine G. Chestnut, Mark A. Thayer, Jeffery K. Lazo, ad Stephen K. Van Den
Eeden, “The Economic Value of Preventing Respiratory and Cardiovascular
Hospitalizations,” Contemporary Economic Policy, Vol. 24, 2006, pp. 127–143.
9
U.S. EPA, “Regulatory Impact Analysis for the Federal Implementation Plans to
Reduce Interstate Transport of Fine Particulate Matter and Ozone in 27 States;
Correction of SIP Approvals for 22 States Publication No. EPA-HQ-OAR-2009-0491,”
2011.
16Discussion Document
TABLE 1: Statewide Health Effects and Valuation (2013 $) Associated with
Freight Emissions Contributing to PM2.5—Midpoint Projections
2012 2030 2050
Mortality 2,200 980 1,100
Hospitalizations* 330 150 160
ER Visits† 950 420 450
Valuation (billions) $20 $9 $10
* Include respiratory and cardiovascular hospitalizations
† Includes asthma and cardiovascular emergency room visits
TABLE 2: Statewide Health Effects and Valuation (2013 $) Associated with
Freight Emissions Contributing to PM2.5—Uncertainty Ranges**
PM2.5 and NOx 2012 2030 2050
Mortality 1,700-2,700 770-1,200 830-1,300
Hospitalizations* 43-770 19-340 20-370
ER Visits† 600-1,300 260-570 280-620
Valuation (billions) $16-$24 $7-$11 $7-$12
* Include respiratory and cardiovascular hospitalizations
**Uncertainty ranges only reflect uncertainty in the concentration-response function, and do not reflect
uncertainty in emission projections, spatial interpolation, and aggregation.
† Includes asthma and cardiovascular emergency room visits
2. Localized Cancer Risks near Freight Hubs
The diesel equipment operating in and around freight hubs, such as seaports, railyards,
and warehouse and distribution centers, is a significant source of diesel PM, a toxic air
contaminant that can cause cancer and other health problems, including respiratory
illnesses, increased risk of heart disease, and premature death. Exposure to diesel PM
is a health hazard, particularly to children whose lungs are still developing and the
elderly, who may have other serious health problems.
The diesel PM emissions from freight operations impact communities located adjacent
to those operations, as well as residents living miles away. Between 2004 and 2008,
ARB staff conducted health risk assessments of 18 major railyards throughout the
State, 10 the Ports of Los Angeles and Long Beach, 11 and West Oakland. 12 The railyard
health risk assessments examined the increased cancer risk zones due to diesel PM
emissions from locomotives, cranes, and yard equipment within facility boundaries as
10
ARB, Railyard Health Risk Assessments and Mitigation Measures, 2004-2009,
.
11
ARB, “Diesel Particulate Matter Exposure Assessment Study for the Ports of Los
Angeles and Long Beach,” 2006,
.
12
ARB, “Diesel Particulate Matter Health Risk Assessment for the West Oakland
Community,” 2008,
.
17You can also read