2021 ARE WE MOVING TOWARDS AN ENERGY-EFFICIENT LOW-CARBON ECONOMY? AN INPUT-OUTPUT LMDI DECOMPOSITION OF CO2 EMISSIONS FOR SPAIN AND THE EU28
←
→
Page content transcription
If your browser does not render page correctly, please read the page content below
ARE WE MOVING TOWARDS AN
ENERGY-EFFICIENT LOW-CARBON
                                  2021
ECONOMY? AN INPUT-OUTPUT LMDI
DECOMPOSITION OF CO 2 EMISSIONS
FOR SPAIN AND THE EU28

Documentos de Trabajo
N.º 2104

Darío Serrano-Puente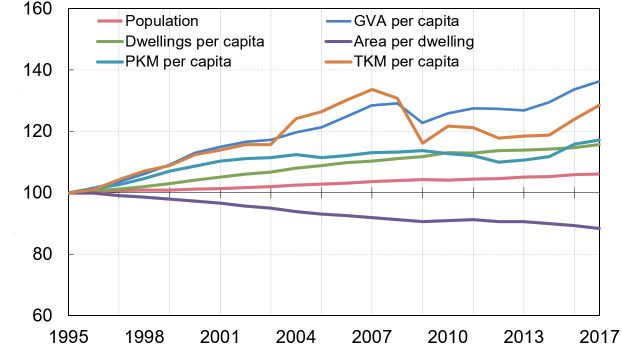
ARE WE MOVING TOWARDS AN ENERGY-EFFICIENT LOW-CARBON
ECONOMY? AN INPUT-OUTPUT LMDI DECOMPOSITION OF CO2 EMISSIONS
FOR SPAIN AND THE EU28
Are We Moving Towards An Energy-Efficient
Low-Carbon Economy? An Input-Output LMDI
Decomposition of CO2 Emissions for Spain
and The EU28 (*)

Darío Serrano-Puente (**)
Banco de España

(*) This manuscript is the Working Paper version of the published article by Darío Serrano-Puente «Are We
Moving Towards an Energy-Efficient Low-Carbon Economy? An Input-Output LMDI Decomposition of CO2
Emissions for Spain and the EU28». This article will be published in SERIEs - Journal of the Spanish Economic
Association, vol. 12(2), 2021. DOI: https://doi.org/10.1007/s13209-020-00227-z. It belongs to a special issue on
“The Economics of the Energy Transition” whose guest editors are Natalia Fabra (Universidad Carlos III de Madrid)
and Xavier Labandeira (Universidade de Vigo).

(**) Data sources are free for scholars and they are listed in the document. Stata replication files are available upon
request. Corresponding author: Darío Serrano Puente (darioserrapuente@gmail.com; https://sites.google.com/
view/darioserranopuente/; ORCID 0000-0002-5943-3332).

Documentos de Trabajo. N.º 2104
2021
The Working Paper Series seeks to disseminate original research in economics and finance. All papers
have been anonymously refereed. By publishing these papers, the Banco de España aims to contribute
to economic analysis and, in particular, to knowledge of the Spanish economy and its international
environment.

The opinions and analyses in the Working Paper Series are the responsibility of the authors and, therefore,
do not necessarily coincide with those of the Banco de España or the Eurosystem.

The Banco de España disseminates its main reports and most of its publications via the Internet at the
following website: http://www.bde.es.

Reproduction for educational and non-commercial purposes is permitted provided that the source is
acknowledged.

© BANCO DE ESPAÑA, Madrid, 2021

ISSN: 1579-8666 (on line)
Abstract

Spain is on a path towards the decarbonization of the economy. This is mainly due to
structural changes in the economy, where less energy-intensive sectors are gaining more
relevance, and due to a higher use of less carbon-intensive primary energy products.
This decarbonization trend is in fact more accentuated than that observed in the EU28,
but there is still much to be done in order to reverse the huge increases in emissions that
occurred in Spain prior to the 2007 crisis. The technical energy efficiency is improving
in the Spanish economy at a higher rate than in the EU28, although all these gains are
offset by the losses that the country suffers due to the inefficient use of the energy
equipment. There is an installed energy infrastructure (in the energy-consumer side)
in the Spanish economy that is not working at its maximum rated capacity, but which
has very high fixed energy costs that reduce the observed energy efficiency and puts
at risk the achievement of the emissions and energy consumption targets set by the
European institutions. We arrive to these findings by developing a hybrid decomposition
approach called «input-output logarithmic mean Divisia index» (IO-LMDI) decomposition
method. With this methodological approach, we can provide an allocation diagram
scheme for assigning the responsibility of primary energy requirements and carbon-
dioxide emissions to the end-use sectors, including both economic and non-productive
sectors. In addition, we analyze more potential influencing factors than those typically
examined, we proceed in a way that reconciles energy intensity and energy efficiency
metrics, and we are able to distinguish between technical and observed end-use energy
efficiency taking into account potential rebound effects and other factors.

Keywords: CO2 emissions, energy efficiency, decomposition analysis, input-output,
LMDI.

JEL classification: C67, O13, Q4, Q5.
Resumen

España se encuentra en una senda hacia la descarbonización de la economía. Esta
evolución se debe principalmente a cambios estructurales en la economía, donde los
sectores menos intensivos en el uso de energía están ganando peso, y a un mayor
uso de fuentes de energía primaria con menor contenido carbónico. De hecho, esta
tendencia hacia la descarbonización es más acentuada en España que en la UE-28,
pero queda mucho por hacer aún para revertir los grandes incrementos en las emisiones
que ocurrieron en España con anterioridad a la crisis de 2007. La eficiencia energética
técnica ha venido incrementándose a mayor velocidad en España que en la UE-28. Ahora
bien, estas ganancias en la eficiencia técnica no consiguen compensar las pérdidas
de eficiencia energética observada que el país sufre debido al uso ineficiente de los
equipos energéticos. Existe una infraestructura energética en la economía española (por
el lado de los consumidores de energía) que no está siendo usada a su capacidad
máxima, pero que tiene muy altos costes fijos energéticos. Esto reduce la eficiencia
energética observada en el país y pone en riesgo el cumplimiento de los objetivos de
emisiones y de eficiencia energética marcados por las instituciones europeas. Llegamos
a estos resultados desarrollando un método de descomposición híbrido denominado
input-output logarithmic mean Divisia index (IO-LMDI). Con este enfoque metodológico
podemos construir un esquema que nos permite asignar a cada sector consumidor final
de energía la responsabilidad que tiene en los requerimientos de energía primaria totales
y en las emisiones de dióxido de carbono, incluyendo tanto sectores económicos como
sectores no productivos. Además, podemos analizar muchos más factores que influyen
en la evolución de las emisiones que los típicamente analizados. También procedemos
de tal manera que reconciliamos las métricas de eficiencia energética e intensidad
energética, siendo capaces, además, de distinguir entre eficiencia energética técnica
y eficiencia energética observada de los sectores consumidores finales de energía,
teniendo en cuenta posibles efectos rebote y otros factores.

Palabras clave: emisiones de CO2, eficiencia energética, análisis de descomposición,
input-output, LMDI.

Códigos JEL: C67, O13, Q4, Q5.
1         Motivation

   There is huge evidence and consensus that global emissions of greenhouse gases are causing
global air temperatures to increase, resulting in climate change.1 At a global level, the potential
consequences include rising sea levels, increased frequency and intensity of floods and droughts,
changes in biota and food productivity, and upstream trends in diseases.2 Thus, climate change has
posed a severe threat to the sustainable development of the human society, the economy, and the
environment.

    At the particular level of the European Union (EU28, hereafter), conforming to the European
Environment Agency (2015), more than 80% of the total greenhouse gas emissions are encountered
to be a consequence of energy production and energy consumption by the end-use sectors (agricul-
ture, industry, commercial and public services, households, and transport).3 These energy-related
greenhouse gas emissions are mainly compounded by carbon dioxide (CO2 ) emissions, an essential
environmental pollutant that has greatly contributed to global climate change, as shown by Ozturk
and Acaravci (2010). 4 Despite not being the world’s largest emitter of energy-related CO2 , the EU28
contributes to the mentioned global emissions by 10%, which indicates that it has a non-insignificant
role in the global warming trends.5

    Hence, while efforts to mitigate the adverse effects of climate change are partly focused on limiting
the emissions of all greenhouse gases, particular attention is being also paid to energy production
and consumption due to its crucial importance for the evolution of the energy-related CO2 emissions.
There is a clear interrelationship between energy consumption, the share of low-carbon energy sources
in such consumption, energy efficiency, and greenhouse gas emissions. Therefore, the energy and
climate targets set by supranational bodies and national authorities approach all these elements. For
instance, at an United Nations conference in August 2007, it was agreed that an emission reduction
in the range of 25-40% with respect to 1990 levels is necessary to avoid the most catastrophic
forecasts. More recently, “doubling the global rate of improvement in energy efficiency” or “increasing
substantially the share of renewable energy in the global energy-mix” were set as key objectives by
the United Nations (2015) in their “2030 Agenda for Sustainable Development”.

   Turning again to the European sphere, together with the well-known targets established by the
European Comission (2012-10-25, later modified in 2013) in its Europe 2020 Strategy or Horizon

      1
      Greenhouse gas emissions are those covered by the Kyoto Protocol and include carbon dioxide (CO2 ), methane
(CH4 ), nitrous oxide (N2 O) and three fluorinated gases, hydrofluorocarbons (HFCs), perfluorocarbons (PFCs) and
sulphur hexafluoride (SF6 ).
    2
      See the report published by the Intergovenmental Panel on Climate Change (2007) for a more detailed description
of the causes of climate change and its adverse effects.
    3
      Emissions coming from energy consumption by international maritime bunkers and international aviation are
usually not included in national total emissions.
    4
      In 2017, according to the Air Emission Accounts published by Eurostat (2020a), more than 95% of the European
energy-related greenhouse gas emissions were anthropogenic emissions of CO2 .
    5
      According to Our World in Data (2020), China alone is responsible for 29% of the total energy-related CO2
emissions, United States for 15%, and Asia and Pacific Ocean for 14%.

BANCO DE ESPAÑA   7   DOCUMENTO DE TRABAJO N.º 2104
2020 (H2020, hereafter), the European Union authorities have defined an even more ambitious
climate scenario that is amongst their main priorities. For 2030, (1) greenhouse gas emissions must
be reduced by 40% with respect to 1990 levels (20% for H2020), (2) primary energy use must
experience a 32.5% reduction to be achieved by improving energy efficiency (20% for H2020), and
(3) a share of 32% in the final energy-mix in favor of renewable energies must be reached (20% for
H2020). Furthermore, the European Comission (2019-10-31) declared in a report to the European
Parliament and the Council that the objective is to achieve climate neutrality by 2050, i.e. net-zero
greenhouse gas emissions in 2050. This translates into a plan to decarbonize the European economy
by 80-95% with respect to the emission levels of 1990, accompanying this with a strong reduction
of energy consumption, which points out again the relevance of making progress towards energy
efficiency.
Within those forming the EU28, Spain is another country that, due to its geographical location
and socioeconomic characteristics, is also vulnerable to climate change, as shown by the Ministerio
de Medio Ambiente (2005). Conjointly with the rest of the EU28 member states, Spain faces strong
commitments derived from the ambitious European climate targets for 2020 and 2030. Each member
state can set its own targets as long as they match those defined at European level. In this sense,
according to the Ministerio de Turismo, Energı́a y Agenda Digital (2017) and the Ministerio de para
la Transición Ecológica (2017), the targets fixed by the Spanish authorities would entail (1) achieving
a 42% share of renewable energies in the final energy use for 2030 (20% for 2020)6 , (2) improving
the country’s energy efficiency by 39.5% for 2030 (20% for 2020), and (3) reducing greenhouse gas
emissions by 23% with respect to 1990 levels for 2030 (10% with respect to 2005 levels for 2020).7
Aiming to comply with the targets set by the European Union as well as by the national author-
ities, both Spain and the EU28 as a whole adopted different policies and measures. An overview
of these policy trends is recovered from the ODYSSEE database published by ODYSSEE-MURE
(2020b). Some of these measures are (1) the promotion of renewable energy (including electricity
from renewable sources), (2) the creation of the EU emissions trading scheme (a market for carbon
dioxide allowances to ensure that emissions reductions can be made where it is most economically
efficient), (3) the development of combined heat and power, (4) the improvement in the energy effi-
ciency performance of buildings, (5) the stimulus to use alternative fuels in transport (in particular
biofuels), (6) the reduction of the average CO2 emissions of new passenger cars, and (7) the taxation
of certain energy products and electricity.8
Following the implementation of these measures, mainly after the 2007 crisis, it can be noted
that both the EU28 and Spain were progressively moving towards meeting the H2020 targets in
recent years. This is shown in Figure 1. Further, in Figure 2 we observe that Spain has done a great
effort in reducing emission levels since 2005. However, this positive evolution cannot compensate the
huge increase of emissions occurred from 1995 to 2005, which still leaves Spain in 2017 with higher
6
For the case of electricity generation, the percentage of renewable energies in 2030 must be 74%.
7
The Spanish emission target translates into a reduction of 38% with respect to the 2017 levels for 2030.
8
See the report published by the Directorate-General for Climate Action (European Commission) et al. (2016) for
a detailed description of the main legislation developments on energy and climate issues.
BANCO DE ESPAÑA 8 DOCUMENTO DE TRABAJO N.º 2104emission levels than those observed in 1995. On the contrary, the EU28 has experienced a long-term
downward trend, but at a lower decreasing growth rate than the last years of the Spanish trend.
Considering the year 2017, the last year of analysis in this study, we recognize how greenhouse gas
emissions (in Panel A of Figure 1) are the only magnitude that meets its European target H2020
both in Spain and in the EU28. The other two H2020 targets (the share of renewables in the final
Figure 1
Compliance with H2020 Targets
A: Greenhouse Gas Emissions Panel B: Primary Energy Consumption Panel C: Share of Renewable Sources
120 120 120
% of Target Compliance
100 100 100
80 80 80
60 60 60
40 Spain EU28 40
40
2005 2007 2009 2011 2013 2015 2017 2005 2007 2009 2011 2013 2015 2017 2005 2007 2009 2011 2013 2015 2017
Note: Levels above 100 indicate target compliance.
energy-mix and the use of primary energy) are not met, either in Spain or in the EU28 (in Panels
B and C of Figure 1, respectively). We can only notice how the reduction target for primary energy
use was fulfilled in Spain during the years 2013 to 2015, but in the last two years the magnitude is
again not complying with the H2020 target.
Consequently, although the reduction of greenhouse gas emissions is on a positive trend that
leads Spain (in 2017) to accomplish the European target H2020 for such magnitude, both the EU28
and Spain have to continue making efforts to fulfill the rest of the 2020 targets. Furthermore, Spain
should be careful with the last developments of CO2 emissions, which experienced a slight increasing
trend that could lead to a deviation form the target compliance. In addition, both regions must
continue working vigorously in a direction that permits them to later satisfy the 2030 targets, which
are even more ambitious than those for 2020, as we have seen above. Besides, according to some
analyses published by the World Bank and ClimateWorks Foundation (2014), this line of work to
control the emissions can offer opportunities for the economic performance of the country, generate
new jobs, benefit agriculture, and boost the development of better technologies for the supply of
energy.
Obviously, one of the major areas to be addressed in order to effectively control emissions is the
efficient use of energy. Improving energy efficiency seems very handy to offer a win-win situation, as
it decreases energy costs, energy use, and at the same time, negative impacts related to such energy
use, like CO2 emissions. Further, using less energy for a certain task gives better possibilities to
use energy sources with a predictable price development, which in practice means domestic energy
sources, especially in countries that heavily depend on energy imports, like Spain. These arguments
BANCO DE ESPAÑA 9 DOCUMENTO DE TRABAJO N.º 2104clearly highlight the need to implement measures in this regard. However, not all the increase in
energy efficiency is translated into energy savings.
Some energy equipment could experience an efficiency increase, but if this equipment is not
utilized at its maximum rated capacity, sometimes the efficiency improvement is not translated
into energy savings. Moreover, technological or efficiency improvements generate cost savings, but
these savings could be devoted to new energy consumption and investment, which also requires
more energy services, which could consequently increase energy-related emissions. Both pathways
generate more activity and may reduce, and even eliminate, the environmentally positive effects of
the improvements. This is the so-called “rebound effect”. Indeed, this effect may be large enough to
exceed the maximum expected energy savings from technological or efficiency improvements. Hence,
for a better understanding of the impacts of efficiency improvements on our process of energy-
use reduction, rebound effects must be incorporated to our analyses. Therefore, care about these
rebound effects needs to be taken by policy-makers when calculating the energy saving potential of
different measures oriented to improve energy efficiency. Freire-González and Puig-Ventosa (2015)
argue that for energy-efficiency-improving policies to be effective, they must be accompanied by other
measures such as an effective communication and awareness of the citizens, regulatory instruments
and/or an appropriate taxation. An effective combination of traditional efficiency measures with new
policies oriented to tackle the rebound effect would maximize the effectiveness of the policy objective
of reducing energy consumption. For Vivanco et al. (2016), it is crucial to establish economic
instruments for the energy efficiency measures to be completely effective and deal with rebound
effect problems. These authors suggest that economy-wide cap-and-trade systems as well as energy
and carbon taxes, when designed appropriately, emerge as the most effective policies in setting a
ceiling for emissions and addressing energy use across the economy. In addition, these rebound
effects vary across end-use sectors. In this sense, Medina et al. (2016) intends to identify the Spanish
economic sectors where investment from energy-efficiency-improving measures should be allocated
in order to reach the targeted energy efficiency levels in the overall economic system.
Besides, only if these energy-efficiency-improving measures are always pursued alongside the
decarbonization of the energy system, the carbon-reducing potential of such measures can be guar-
anteed, as suggested by Malpede and Verdolini (2016). However, these efforts to develop an adequate
energy efficiency policy and to promote the use of a lower-carbon energy-mix should not damage
the domestic competitiveness of the economy. The relationship between economic growth, energy
consumption and CO2 emissions is an essential issue that we face in the 21st century, and it is of
far-reaching concern to scholars worldwide. To investigate this matter, several methodologies have
been traditionally applied. Zhang et al. (2018) list some of the main ones: the Kuznets curve the-
ory, the Granger causality analysis and co-integration tests, the vector auto-regressive models used
to analyze the long-term dynamics, and the decoupling models. The latter approach is followed
by Fernández-González et al. (2014), who show that there is a usually a coupling process between
energy consumption and economic growth in advanced economies. Therefore, in these economies
is more difficult to reduce energy consumption and alternative efforts should be made in order to
achieve the decarbonization of the economy, as suggested by Román-Collado et al. (2018).
BANCO DE ESPAÑA 10 DOCUMENTO DE TRABAJO N.º 2104Nevertheless, we must bear in mind that the above-mentioned measures to promote efficiency
do not explain or influence by themselves alone the evolution of the energy-related CO2 emissions.
There may be many potential factors underlying the progression observed both in Spain and in
the EU28 and their convergence to the established targets, irrespective of the impact of the energy
efficiency policies and measures, as suggested by Economidou and Román-Collado (2019). Some
of these factors could be the economic activity level, the efficiency of the conversion sector, the
demography, lifestyle changes, the weather, etc. For example, the 2007 crisis could have a profound
impact on the industrial sectors and services which in turn could affect energy consumption and
consequently energy-related CO2 emissions. Another example includes weather fluctuations, which
could affect the heating and air cooling demand provoking that, in a particular warm year, energy
consumption may simply drop due to lower heating demand in the residential and services sectors.
Figure 2
Energy-related CO2 emissions
160
Spain EU28
140
Index (base 1995)
120
100
80
1995 1998 2001 2004 2007 2010 2013 2017
Note: This figure is depicted using the estimation approach presented in this document. The energy-related CO2 emissions shown are
those associated to final energy consumption. This final energy consumption has been climate-adjusted in order to abstract from potential
weather effects, which results in a magnitude that is comparable across regions.
Therefore, in order to support the most appropriate energy policy decisions, an integrated ana-
lytical method to understand the driving forces behind the observed developments of energy-related
CO2 emissions, energy consumption and energy efficiency (the three main energy and climate targets
previously presented) is irremediably needed. It is precisely here where our work enhances the avail-
able related literature, since we develop a methodological framework to investigate the contributions
of various influencing factors to the evolution of the energy-related CO2 emissions between 1995
and 2017 both in Spain and in the EU28. With our proposed method, in addition to many macro
and efficiency influencing factors discussed before, we are able to capture the role that the primary
energy consumption and the share of renewable sources in the energy-mix play in the developments
of the energy-related CO2 emissions. This implies that all magnitudes for which the main energy and
climate targets are defined and their interrelationships can be monitored within one comprehensive
methodological framework. Our period of analysis, 1995-2017, is determined by the availability of
data. We should mention that for the findings about the changes that occurred between 1995 and
BANCO DE ESPAÑA 11 DOCUMENTO DE TRABAJO N.º 21042017 to be representative of what certainly happened, we must identify two clearly distinct sub-
periods, as shown in Figure 2. These sub-periods are delimited by the year 2007, since it marks the
end of a economic expansion period and the beginning of a deep recession followed by a posterior
recovery. In this way, we first analyze the 1995-2007 sub-period, and subsequently the 2007-2017
sub-period, both for the EU28 and for Spain. The results that we present give interesting informa-
tion related to the drivers and inhibitors of the energy-related CO2 emissions in both the Spanish
economy and the European economy as a whole. These results are useful not only for researchers,
but also for private utility companies and policy-makers, as they can contribute to construct and
implement the optimal saving and efficiency measures to achieve the mentioned climate and energy
targets. In fact, this paper speaks directly to Spanish and European authorities in the field of energy
and climate.
The remainder of the document is organized as follows. Section 2 sheds light on the relevance
of our analysis by reviewing the existing literature. Section 3 presents the methodology and the
databases utilized in our work. Section 4 reports the results. And finally, Section 5 concludes.
2 Conceptual and Empirical Framework
In this Section, we revise the existing literature and remark the contributions of our work. We
first introduce the rationale behind our hybrid approach in Subsection 2.1. Second, we propose an
allocation diagram scheme for assigning the responsibility of primary energy requirements and CO2
emissions to end-use sectors in Subsection 2.2. Third, we present the selected influencing factors to
be analyzed in Subsection 2.3. Fourth, we discuss about the differences between energy intensity and
energy efficiency metrics in Subsection 2.4. Fifth, we propose and describe a method to distinguish
between technical and apparent end-use energy efficiency in Subsection 2.5. Finally, we overview the
main contributions of this work in Subsection 2.6.
2.1 Hybrid Approach Mixing SDA and IDA
There are several methodologies to assess the developments of certain energy or environmental
magnitudes like emissions. Among others, in a very enriching survey work by Wang et al. (2017),
we find methods based on econometric models, system dynamics approaches, computable general
equilibrium (CGE) models, and decomposition analyses. Our work focuses on the latter, and more
precisely, on two different methods: the structural decomposition analysis (SDA, hereafter) and the
index decomposition analysis (IDA, hereafter). In recent times, many researchers are using SDA and
IDA techniques as tools for analyzing energy or environmental trends.
Both decomposition techniques have been compared in many survey papers, e.g. Su and Ang
(2012), Hoekstra and van den Bergh (2003), and Wang et al. (2017). The comparison encounters that
the IDA approach is more flexible in its formulation and has a relatively lower data requirement than
BANCO DE ESPAÑA 12 DOCUMENTO DE TRABAJO N.º 2104the SDA approach. However, the IDA method only provides information about the direct effects,
ignoring the indirect and final demand effects, as shown by Zeng et al. (2014). On the other hand,
the SDA, a framework based on the development of input-output models/tables, provides a wider
range of information regarding technical concerns, including final demand effects, and more detailed
explanation of the structural factors, such as the Leontief effect (or technical effect), as argued by
Cansino et al. (2016) and Xie (2014). Further, the SDA method can shape socioeconomic drivers
from both production (or supply) and final demand (or end-use) perspectives. When it particularly
comes to the IDA method, we find several decomposition techniques that are documented extensively
in a survey paper by Ang and Zhang (2004). Among others, we find the Laspeyres decomposition
method and the Divisia index decomposition method. The latter contains the logarithmic-mean
Divisia index (LMDI, hereafter) and the arithmetic mean Divisia index (AMDI), both in the additive
and multiplicative formulations (leading to redundant results). As suggested by Ang (2015), the
logarithmic-mean Divisia index in its additive formulation is the most recommended IDA approach
due to its theoretical foundation, robustness, adaptability, ease of use, and result interpretation. It
provides a perfect decomposition (i.e. the results do not contain any residual term), permits the
investigation of more than two factors, provides a simple and direct association between the additive
and the multiplicative decomposition form, and is consistent-in-aggregation (i.e. the estimates of an
effect at the subgroup level can be aggregated to give the corresponding effect at the group level).
Through these techniques, many research works attempt to identify quantitatively the contri-
butions of many influencing factors to the evolution of some energy or environmental aspects. For
example, an increasing proportion of the thermal power in the end-use sectors will increase the
energy-realted CO2 emissions, while increasing end-use energy efficiency will reduce them. These
driving forces can be analyzed within this type of methodologies, which have been widely used in
the literature. Focusing on the performance assessment, we can classify these research works into
three different types. The first type deals with assessments over time in a specific country, i.e.
single-country temporal analysis. This category accounts for most of the developed studies in the
literature. The second type gathers studies that analyze the performance of more than one country.
A temporal analysis like the one in the first type is here applied independently for several countries
or regions in a way that the results can be compared between countries, i.e. multi-country temporal
analysis. The third type of studies focuses on comparative analyses between countries using the data
of a specific year, i.e. single-year spatial or cross-country analysis.
The first type of studies comprises the conventional IDA and SDA studies applied to one single
country or region, where no further elaboration is required. When it particularly comes to apply-
ing SDA techniques for the Spanish case, we find different works. For instance, Butnar and Llop
(2007) investigate the composition of greenhouse gas emissions in Spain in an input–output fashion,
Cazcarro et al. (2013) use the same methodology to study the evolution of water consumption in
Spain, Alcántara and Roca (1995) propose a similar framework to examine the energy-related CO2
emissions and their relationship with energy consumption, and, finally, Cansino et al. (2016) use a
SDA approach to undercover the main drivers of changes in CO2 emissions in the Spanish economy.
On the other hand, we can also find thousands of studies following different IDA approaches for a
BANCO DE ESPAÑA 13 DOCUMENTO DE TRABAJO N.º 2104number of geographies in a single-country temporal fashion. More precisely, for the Spanish case, we
encounter Cansino et al. (2012), who analyze the greenhouse gas emissions in the Spanish economy,
and Cansino et al. (2015), who investigates the driving forces of Spain’s CO2 emissions. Finally, in a
recent work that makes use of both SDA and IDA methods separately, Román-Collado et al. (2018)
determine whether energy efficiency is a driver or an inhibitor of the energy consumption changes in
Spain.
The second category of studies is a direct extension of the first one. A requirement of these
works is that the same decomposition method and a consistent data format are used for every region
analyzed so that the results obtained can be meaningful compared. There are several papers applied
to very different geographies that use SDA and IDA methods to investigate such concerns in a multi-
country temporal fashion. When it comes to the SDA approach, there are studies that establish
a relationship between energy consumption in Spain and that of other countries of the European
Union, like Alcántara and Duarte (2004). On the other hand, we can encounter many research works
following different IDA approaches in a multi-country temporal way. Goh and Ang (2019) elaborates
a survey gathering the main studies that implement the LMDI method in recent years worldwide.
But more precisely, for the European and the Spanish case we find numerous papers applying the
LMDI methodology. Examples of it are Economidou and Román-Collado (2019), who assess the
progress towards energy and climate targets in the European Union, and Mendidulce et al. (2010),
who compare of the evolution of energy intensity in Spain and in Europe. Our work will contribute
to this second type of decomposition studies, since it assesses through SDA and IDA techniques the
evolution of energy-related CO2 emissions in Spain and in the EU28 applying to each region the
same temporal analysis separately. These studies, where our work is also framed, show the growing
popularity of researches where the main focus is to compare the development or performance of a
group of countries over time. However, one should note that the resulting comparisons are not direct
because mathematically there are no direct linkages between the results of the countries compared.
The third type of studies, single-year spatial, is very different from the first two ones explained
above. Using the data of a specific year, the spatial analysis conducted is static and the results
obtained are valid for the year of analysis. Ang et al. (2015) review the literature of the spatial
decomposition analysis, investigate the methodological issues, and propose a spatial decomposition
analysis framework for multi-region comparisons. Some examples applying this type of spatial anal-
ysis for the European and Spanish spheres are Sun (2000), who analyzes the CO2 emission intensity
for 15 European countries in 1995, and Bartoletto and del Mar Rubio-Varas (2008), who perform
a spatial analysis of the CO2 emissions for Spain and Italy in years 1861 and 2000, respectively.
However, with this third type of studies, changes in regional disparities over time cannot be traced
analytically since the spatial analyses conducted are different for different years. To address this
issue, Ang et al. (2016) develop an IDA procedure that integrates the key features of type 2 and type
3 studies, where both spatial differences between regions and temporal developments in individual
regions are captured simultaneously, i.e. spatial–temporal index decomposition analysis (ST-IDA).
This methodology essentially establishes formal linkages of the static spatial comparison results of a
group of regions for each year over a specific time period. The consolidated results of this new em-
BANCO DE ESPAÑA 14 DOCUMENTO DE TRABAJO N.º 2104pirical framework reveal each and every region’s performance over time as well as how it is compared
to those of other regions at any point in time on an equal footing. However, this methodology has
the disadvantage that the interpretation of its results is not as straightforward as in the second type
of studies presented in this Subsection, which may lead to less clearly understandable conclusions.
When listing typical influencing factors analyzed through decomposition methods, population,
income, economic structure, energy intensity and energy-mix are factors commonly encountered to be
analyzed through IDA techniques. On the other hand, the SDA approach examines contributions of
some technical influencing factors such as the efficiency of the energy conversion sector. Nevertheless,
according to the deep literature review of decomposition methods applied to environmental concerns
carried out by Ma et al. (2018), it is still difficult to find evaluations of all the previous factors
within a single and comprehensive methodology that combines both SDA and IDA approaches. One
of these examples is the mentioned work by Ma et al. (2018), who analyzes energy-related CO2
emissions in China using a hybrid approach that mixes an input-output model and some LMDI
decompositions.9 But, to the best of our knowledge, there is no work developing such a hybrid
approach for Spain and the EU28. This is where our paper adds value and contributes to the
literature, since we propose a method that takes into account jointly the effects that (1) technical
aspects of the physical energy system (analyzed through energy input-output models) and (2) macro-
level influencing factors traditionally employed (studied through IDA decomposition methods) have
in the evolution of energy-related CO2 emissions in Spain and in the EU28. Thus, we refer to this
hybrid integrated approach, which benefits from the advantages of both SDA and IDA techniques,
as input-output logarithmic mean Divisia index (IO-LMDI, hereafter) decomposition method.
2.2 Responsibility of Energy-Related CO2 Emissions
Key in this type of research work is to have a deep understanding of how the energy system works
in order to distribute the responsibility of the primary energy requirements and the energy-related
CO2 emissions. As an example of the energy flow in Spain and in the EU28, a graphical overview of
the process is depicted in Figures 13 and 14 of the Appendix. In a national energy system, primary
energy (mainly derived from domestic production and imports) is first processed, transported, and
converted into numerous types of secondary energy. This conversion process generates many emis-
sions, principally heat and electricity generation based on fossil fuels. The secondary energy is then
distributed to the end-use sectors, which are also emission generators (e.g. fuel burning). This shows
that both energy conversion and energy use by the end-use sectors greatly influence the emissions
from the energy system, thus an analytical method like that here proposed by us is needed to study
both sides of the energy system in a unified way. However, this kind of analyses requires a criteria
definition to determine who have the responsibility of the CO2 emissions derived from the energy
9
Patiño et al. (2019) undertake a similar exercise for Colombia, but they do not completely use both input-output
and LMDI analyses in a single theoretical framework. They just simply use the input-output models to estimate the
primary energy consumption.
BANCO DE ESPAÑA 15 DOCUMENTO DE TRABAJO N.º 2104transformation process (e.g. electricity generation). After a search of the literature, we encounter
two ways to allocate the responsibility of the primary energy requirements, and consequently the
CO2 emissions: (1) considered as direct energy consumption/emissions of the conversion process or
(2) considered as indirect consumption/emissions of the end-use sectors.
The first allocation criteria directly follows from the energy balances or the emission inventories,
where the reported amount of energy consumption/emissions of each sector is just the direct quantity.
This means that, for example, emissions from the transformation of primary fuels in thermal stations
to deliver heat and electricity to the residential sector are reported under energy industries, whereas
emissions from the burning of coal in a stove by a household would be reported as part of emissions
from the residential sector. Nonetheless, we opt for the second allocation way since it seems to be the
most appropriate to us, in as much as, for instance, the CO2 emitted from a coal fired power station
is not assigned to the electricity sector, but rather distributed among those who use the electricity
generated by such power plant. In this type of demand-side-oriented setup, the energy sector would
be included directly (as end-use sector) and indirectly. On the one hand, the energy used by the
conversion sector as input to produce final energy products would be considered as primary energy
requirement whose responsibility would lie with the end-use sectors. On the other hand, the final
energy consumed by the energy sector in the form of own-produced energy or energy purchased by
the producers to operate their installations would not be distributed to the end-use sectors. This
type of strategy permits a better understanding of the underpinning trends from an energy demand
perspective by linking final energy consumption and CO2 emissions. This could be useful from a
policy viewpoint, as for example, policies to improve the insulation of residential buildings could
reduce both direct and indirect emissions.
Aiming to perform this class of approach, we build an energy input-output table using the
observed energy flows of the system that will serve us to allocate the responsibility of primary
energy requirements and energy-related CO2 emissions to the end-use economic sectors (including
the energy branch as final-energy user), the different existing transport modes and the various
energy end-uses of households and services. This strategy is based on the allocation diagrams for
CO2 emissions developed by the European Environment Agency (2015), Alcántara and Roca (1995)
and Ma et al. (2018), and allows us to fully identify the responsibility of CO2 emissions of various
sectors in each stage of the energy system, which means that our analysis would depict a complete
figure of the energy system as it incorporates all sectors of the economy.10 In practice, in order to
implement the mentioned strategy, we first propose two parameters: (2) the derived primary energy
quantity conversion factor (KP EQ ) and (2) the primary carbon dioxide emission factor (KC ) of each
secondary energy.11 Both are key technical influencing factors obtained from an structural energy
input-output model. Second, we build a method using KP EQ and KC to calculate the equilibrium
10
It should be noted that, despite its potential relative importance, our approach abstracts from the effect of
cross-border trading of energy flows on the energy-related CO2 emissions.
11
The derived primary energy quantity conversion factor (KP EQ ) refers to what Sessler (1987) calls energy require-
ment for energy (ERE), which for any energy used by the sectors considered would necessarily have a value greater
than the unit.
BANCO DE ESPAÑA 16 DOCUMENTO DE TRABAJO N.º 2104data of energy and CO2 emissions for the whole physical process of energy use, i.e. we can trace the
primary energy and the derived CO2 emissions along the different energy flows from production (or
imports) to final use. Finally, we use this equilibrium data to allocate the responsibility of primary
energy requirements and CO2 emissions among the end-use sectors.
2.3 Influencing Factors Entering the Decomposition
In addition, making use of the mapping previously presented, we develop an improved LMDI
decomposition method to depict the contributions of many influencing factors to the evolution of
the energy-related CO2 emissions at the Spanish and the European level from 1995 to 2017. When
selecting the influential factors to be analyzed, a common starting point is the Kaya identity. Kaya
(1990), in his very influential work, applied the idea of an IPAT identity to identify the major
drivers of environmental impact (I) and CO2 emissions: the amount of population (P), the affluence
of that population (A), and the level of technology (T). Waggoner and Ausubel (2002) added a
new term, consumption (C), to the identity and called the result ImPACT identity. Based on such
body of literature, we propose to extend our defined expression for energy-related CO2 emissions
to include the impact of not only the aforementioned traditional factors, but also many novel ones
regarding technical and some other extra aspects. That is, we develop an augmented version of the
Kaya identity. More precisely, the following factors are included in our proposed decomposition:
(1) population; (2) income per capita level (in purchasing power parity form in order to make it
comparable across regions); (3) economic structure and (4) its intra-sectoral composition; (5) some
social and (6) living-standards factors; (7-8) final energy intensity; (9) different types of end-uses
of energy; (10) weather; (11) energy-mix (to study the influence of the share of renewable energy
sources, principally); (12) efficiency of the conversion sector; and (13) type of primary energy sources
(high- or low-carbon) used to make final energy consumption available.
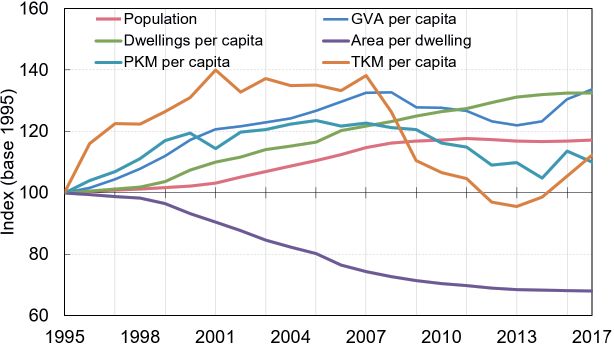
2.4 End-Use Energy Intensity vs. End-Use Energy Efficiency
Out of all the aforementioned factors, which will be explained in detail in the rest of the document,
the element related to energy intensity (the well-known energy consumption to monetary output
quotient) deserves a special consideration. This ratio has been traditionally understood as a key
driver of emission trends, as it was assumed to be a good indicator of changes in energy efficiency of
the end-use sectors (when final energy consumption was used as a measure) and changes in energy
efficiency of the transformation sector (when primary energy consumption was used as a measure).
In our particular case, as explained previously, the methodology that we use enables us to clearly
identify the aspects related to the efficiency of the energy transformation system through the primary
energy quantity conversion factor (KP EQ ). It means that, in our setup, the energy efficiency of the
conversion sector is measured by means of the SDA method through changes in the Leontief inverse
matrix. Therefore, once the energy efficiency of the transformation sector is addressed, one might
think that by including energy intensity (the ratio of final consumption to monetary output) as a
BANCO DE ESPAÑA 17 DOCUMENTO DE TRABAJO N.º 2104factor of the LMDI decomposition, we capture changes in the end-use energy efficiency. However,
we do not agree that this is the appropriate approach as, in our view, energy intensity is not a valid
proxy for end-use energy efficiency.
A few grounds for rejecting energy intensity as an efficiency metric are detailed in what follows.
Energy intensity, although it is undoubtedly affected to a greater or lesser extent by efficiency in
energy use, may be influenced by other factors such as the production structure, the degree of
vertical integration or the capital-labor ratio, the scale of operations, etc. For instance, a decrease in
energy intensity is not a synonym for energy savings, technical progress, reduction of energy waste
or lower energy consumption in absolute terms, but it may also occur if energy consumption grows
at a lower rate than the monetary output of what is produced with said energy. Moreover, apart
from the quantitative characteristics of economic sectors, energy efficiency is also influenced by the
requirements of the private residential and transport sectors. But to calculate energy intensity we
need to know the monetary value of the output of the energy-consuming sector, and this value cannot
be measured for non-productive sectors such as households and transport. Thus, energy intensity
would not be an appropriate measure of the end-use energy efficiency.
For all these reasons, an alternative factor seems to be necessary to provide a good measurement
of the end-use energy efficiency, since it is a determinant influence on CO2 emissions and occupies a
prominent place on the environmental policy agenda. However, since our formulation of the LMDI
identity is conducive to the presence of energy intensity as a contributing factor, the best method
to solve the above mentioned issue is to separate observed physical energy intensity from structural
changes affecting the energy intensity. In this sense, following the method proposed by Torrie et al.
(2018), what we do is to subject the energy intensity factor to further extension or factorisation that
allows us to identify to what extent the observed phyisical energy efficiency influences changes in
energy intensity, and therefore in CO2 emissions. This is done by decomposing the energy intensity
ratio between (1) consumption per physical unit of output (e.g. energy used per produced car) and
(2) the ratio of physical output to the monetary output (e.g. produced cars per monetary value
added of those cars). To this end, physical activity drivers have to be defined, which will vary
significantly between sectors. This irremediably implies an additional data requirement and relies
on a one-to-one correspondence between energy consumption data and physical activity data. An
additional strength of this strategy is the possibility to study in a consolidated manner the energy
efficiency of both productive and private sectors, as we can also define energy efficiency factors for
the transportation sector (e.g. energy use per passenger-kilometer) and the households (e.g. energy
consumption per m2 of dwelling). As a result, another contribution to the literature is made, as we
are able to reconcile the energy efficiency and energy intensity metrics within a refined decomposition
approach that is applied for the Spanish economy and the EU28 economy as whole.
2.5 Apparent vs. Technical End-Use Energy Efficiency
One must note that the observed physical end-use energy efficiency presented in the previous
Subsection need not be an accurate measure of the actual technological progress. That is, we must
BANCO DE ESPAÑA 18 DOCUMENTO DE TRABAJO N.º 2104differentiate between (i) observed or apparent physical end-use energy efficiency and (ii) technical
end-use energy efficiency. In our analysis, we assume that a technological advance cannot be reversed.
In other words, technical energy efficiency cannot decrease. Normally, we associate a fall in energy
consumption per physical unit, i.e., an increase in apparent energy efficiency, with an increase in
energy efficiency of the end-use sectors.
However, in certain cases, the observed or apparent energy efficiency of the end-use sectors
(the energy consumption per unit produced or per physical unit installed) is observed to decrease
(increase). In these scenarios, it cannot be deduced that it is due to a decrease in technical efficiency,
since we assume that technological progress cannot be reversed. What may be actually happening
when we observe a reduction in apparent energy efficiency is that the installed equipment is not
being used efficiently or that the improvement in technical efficiency, or technological advance, could
have lowered the costs or prices of certain energy causing an increase in the consumption of that
energy, i.e. the so-called rebound effect.
That is why it is necessary to discern between what is driving the apparent or observed energy
efficiency. To do so, as shown in Figure 3, we subject such observed end-use energy efficiency to a
further decomposition and we examine the role played by (1) technical energy efficiency or actual
energy savings, (2) rebound effects, and (3) other factors (where the infra-utilization of the installed
energy equipment can be a key contributor) in its developments. As a result, we will contribute to
the literature by reconciling observed and technical end-use energy efficiency metrics. We will review
the technical energy efficiency influences and the potential rebound effects in Subsection 2.5.1 and
the influence of other factors like the infra-utilization in Subsection 2.5.2.
2.5.1 Rebound Effect
It is not right to analyze the apparent end-use energy efficiency without a deep mention of the
induced rebound effect. Usually, one may think that technical efficiency improvements result in
providing the same amount of energy service to the consumer using less energy, what would induce
positive changes in the observed energy efficiency. However, by having equipment that uses less
energy, the energy service becomes less costly (effective price is reduced) for the user than before
the energy efficiency improvement happened. This decrease in the cost of the energy service could
provoke increases in energy consumption that can occur through a price-reduction or other behavioral
responses. In this way, the observed energy efficiency may not reflect actual changes in the technical
energy efficiency. This is one of the main reasons why it is unavoidable to separate the technical
efficiency from the observed (or apparent) energy efficiency.
Mathematically, as shown in Equation 1, we define the rebound effect (RE) as the fraction of
the potential energy savings (P ES) that is not translated into actual energy savings (AES).
AES
RE := 1 − (1)
P ES
BANCO DE ESPAÑA 19 DOCUMENTO DE TRABAJO N.º 2104Figure 3
Decomposition of apparent end-use energy efficiency
The P ES are given by the evolution of the technical energy efficiency, which is typically estimated
by engineering models that assume no economic responses to improved energy efficiency and non-
reversible improvements. The AES are usually depicted by observed changes in the apparent energy
efficiency once we have controlled for potential rebound effects and other factors like the infra-
utilization of the energy equipment installed. This formula could seem very simple and handy.
However, the price- or cost-induced rebound effect is a very complex element. It is the umbrella
term for a variety of economic mechanisms that comprises every reaction of the agents when they
face an effective price reduction. Every potential reaction can be identified as a different type of
rebound effect. Hence, the identification of every type of rebound effect is a a very complicated
process that depends on many aspects. Here, as shown in Figure 3 and explained as follows, we
provide a classification of the different types of price-induced rebound effect following the influential
works of Greening et al. (2000), Sorrell (2007), Azevedo (2014) and Freire-González et al. (2017).
1. Direct rebound effect. It was first defined by Khazzoom (1980) as the increase in the demand
of an energy service caused by improvements in the efficiency of that particular energy service.
It encompasses (1) pure substitution effects derived from the incentive to use more energy
input of the energy whose effective price has fallen. This effect is typically given by the
own-price elasticity of demand for a particular energy service. The direct rebound effect also
covers potential (2) income effects. The cost reduction derived from the technical efficiency
improvement may increase real incomes, which will positively impact on consumption of all
BANCO DE ESPAÑA 20 DOCUMENTO DE TRABAJO N.º 2104commodities, including that of the energy product whose effective price has fallen as a result
of the technical efficiency improvement.
2. Indirect rebound effect. It is usually defined as the increase in the demand for other goods and
services that also require energy for their production and distribution and that are affected
by the reduction in the effective cost of the energy service considered and the associated
increase in disposable income. This indirect rebound effect can originate from a number of
sources. As it can be observed in Figure 3, it covers: (1) output effects (producers may use the
cost savings from energy efficiency improvements to increase output, increasing consumption
of capital, labor and materials, which themselves require additional energy to provide); (2)
substitution effects (given by the cross-price elasticities of demand for non-energy services);
(3) income effects (increased real incomes will impact on consumption of all commodities,
which will indirectly enhance an increase in the energy consumption); (4) compositional effects
(relatively energy-intensive products benefit more from the fall in the effective energy prices);
(5) competitiveness effects (the fall in supply prices of commodities that use energy as an
input for production could stimulate their demand, increasing energy needs); and (6) embodied
energy, (energy needed to implement the technical efficiency measure that leads to the technical
change).
3. Economy-wide rebound effect. It accounts for every increase in the demand of energy services
caused by a higher economic growth and consumption at a macroeconomic level as a conse-
quence of a technical efficiency improvement of the energy service considered. It comprises all
sub types of rebound effects. The economy-wide rebound effect takes into account not only
direct and indirect rebound effects, but also general equilibrium rebound effects. The latter
effects account for the adjustments of prices and quantities of goods and services on the whole
economy after an energy efficiency improvement. As the technical efficiency improves, there
will be a reduction in the price of the energy services, which in turn will lead to a new overall
equilibrium of supply and demand for all goods and services in the economy.
There is a variety of interpretations of the rebound effect depending on the magnitude and sign
of the effect. (i) For values below zero, we encounter negative rebound effects or super-conservation
effects. It means that the technical energy efficiency improvement is over realized, i.e. the energy
consumption declines in a greater proportion than the extent to what the technical energy efficiency
improves. (ii) When the value of the rebound effect is zero, we can say that the technical energy
efficiency improvement is fully realized, i.e. the energy consumption drops in the same proportion
than the extent to what the technical energy efficiency improves. (iii) We find partial rebound effects
for values between zero and one hundred. In this case, the technical energy efficiency improvement
is partially offset by an increased demand for energy. Finally, (iv) for values of the rebound effect
greater than one hundred, we encounter the so-called backfire effect. In this particular case, the
technical energy efficiency improvement is outweighed by an increased demand for energy, i.e. the
energy consumption increases in a greater proportion than the extent to what the technical energy
efficiency improves.
BANCO DE ESPAÑA 21 DOCUMENTO DE TRABAJO N.º 2104You can also read