Value Chain Analysis Ethiopia Leather Products - Commissioned by The Centre for the Promotion of Imports from developing countries (CBI) AUSTRIAN ...
←
→
Page content transcription
If your browser does not render page correctly, please read the page content below

Value Chain Analysis
Ethiopia Leather Products
Commissioned by The Centre for the Promotion of Imports
from developing countries (CBI)
AUSTRIAN FOUNDATION FOR
DEVELOPMENT RESEARCH                       February 2019
ACKNOWLEDGEMENTS

This report has greatly profited from organizational support and incisive discussions with
Ms Henrique Postma-Hazelaar, Ms Melanie van der Baaren-Haga and Ms Vera Geling, all
from CBI Netherlands. Our sincere thanks also goes to the participants of a stakeholder
validation workshop held in Addis Ababa on 16 October 2018 for their valuable and
constructive feedback. Finally, we particularly appreciate the data support provided by LIDI
staff and the willingness of a large number of company executives, business
representatives, government stakeholders and experts from international donor
organizations, in particular from UNIDO, to share their sector knowledge and experience
with the team of consultants during field research in Ethiopia und in Europe. All remaining
errors and omissions are the sole responsibility of the authors.

           Research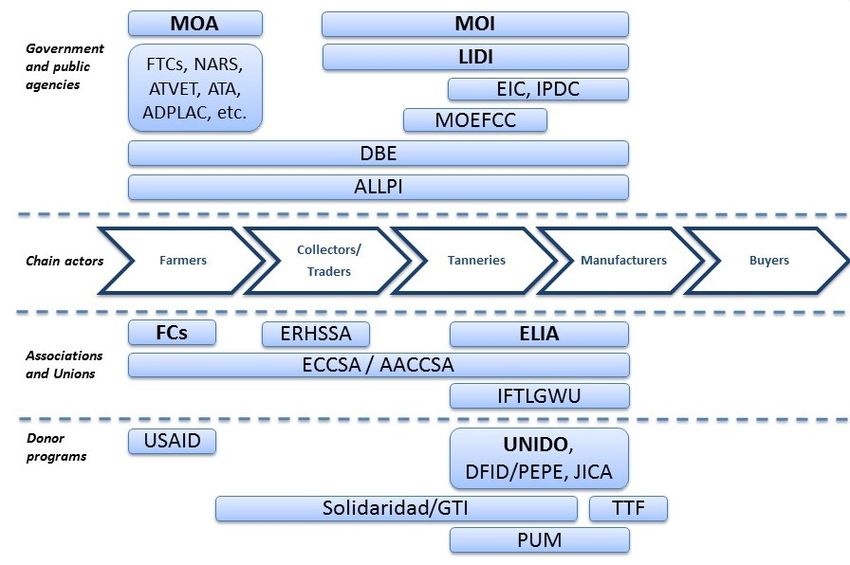
CONTENTS

LIST OF FIGURES AND TABLES .................................................................................. 3
EXECUTIVE SUMMARY ................................................................................................. 8
1.       INTRODUCTION ................................................................................................ 10
2.       THE LLP GVC .................................................................................................... 11
3.       MAPPING THE EUROPEAN UNION’S LLP VALUE CHAIN ............................. 14
3.1.     INTRODUCTION ...................................................................................................... 14
3.2.     EU’S INTEGRATION IN THE LLP GVC ....................................................................... 15
3.2.1.   Raw hides and skins and leather ..............................................................................15
3.2.2.   Leather manufacturing ..............................................................................................16
3.3.     TYPOLOGY OF LEATHER PRODUCTS’ VALUE CHAINS IN THE EU .................................... 31
3.3.1.   Luxury market ...........................................................................................................32
3.3.2.   Mid-high end market .................................................................................................33
3.3.3.   Branded mass market ...............................................................................................34
3.3.4.   Unbranded mass market ...........................................................................................36
3.4.     EUROPEAN MARKET REQUIREMENTS ........................................................................ 37
3.4.1.   Legal requirements and regulations ..........................................................................37
3.4.2.   Buyer requirements by market segment ....................................................................39
3.5.     TRENDS ................................................................................................................ 43
3.5.1.   General trends ..........................................................................................................43
3.5.2.   Product specific trends ..............................................................................................45
4.       MAPPING THE ETHIOPIAN LLP SECTOR ....................................................... 47
4.1.     INTRODUCTION ...................................................................................................... 47
4.2.     THE STRUCTURE OF THE ETHIOPIAN LLP SECTOR ..................................................... 48
4.3.     INDUSTRIAL POLICY DESIGN AND BUSINESS ENABLING ENVIRONMENT ........................... 53
4.3.1.   Industrial development plans and policies .................................................................53
4.3.2.   Institutional setup ......................................................................................................55
4.4.     SUSTAINABILITY ISSUES IN THE ETHIOPIAN LLP SECTOR ............................................ 59
4.4.1.   Livestock ...................................................................................................................59
4.4.2.   Raw hides and skins .................................................................................................59
4.4.3.   Tanneries ..................................................................................................................60
4.4.4.   Footwear and leather products ..................................................................................60
4.4.5.   Child Labor and Forced Labor...................................................................................61
4.4.6.   Summary of main sustainability issues ......................................................................61
5.       OPPORTUNITIES AND CHALLENGES IN THE ETHIOPIAN LLP SECTOR .... 64
5.1.     KEY CHALLENGES .................................................................................................. 64
5.1.1.   Systemic challenges .................................................................................................64
5.1.2.   Sustainability issues ..................................................................................................66
5.1.3.   Export-related challenges .........................................................................................67
5.2.     KEY OPPORTUNITIES .............................................................................................. 68
6.       POLICY RECOMMENDATIONS AND INTERVENTION AREAS ....................... 72
6.1.     KEY INTERVENTIONS THROUGHOUT THE ENTIRE VALUE CHAIN IN ETHIOPIA ................... 72
6.2.     KEY INTERVENTIONS FOR INCREASING THE EXPORT COMPETITIVENESS OF ETHIOPIAN
         LEATHER PRODUCTS MANUFACTURERS IN THE EU MARKET ......................................... 77
6.3.     ENSURING THE INSTITUTIONAL SUSTAINABILITY OF EXPORT PROMOTION ....................... 80
6.4.     NEXT STEPS ......................................................................................................... 81

               Research                                                                                                               1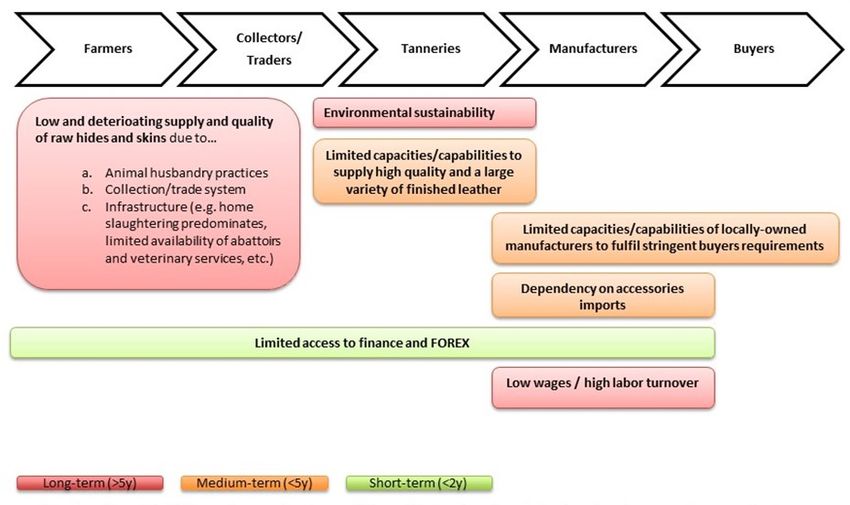
7.       CONCLUSION .................................................................................................... 83
REFERENCES .............................................................................................................. 84
ANNEX I – ADDITIONAL INFORMATION .................................................................... 87

               Research                                                                                                   2
LIST OF FIGURES AND TABLES
Figure 1: The LLP GVC ............................................................................................. 12
Figure 2: Global LLP trade (2000-2017, billion USD) ................................................ 13
Figure 3: EU’s imports of leather and leather products (2000-2017, billion USD) ...... 14
Figure 4: Key EU importers of leather products (USD billion, 2002-2017) ................. 17
Figure 5: China’s share in EU’s total leather product imports (%, 1994-2017)........... 18
Figure 6: EU‘s imports of leather footwear (2000-2017, USD billion)......................... 19
Figure 7: EU‘s imports of leather footwear by country (2000-2017, USD billion) ....... 20
Figure 8: Change in market share/unit value of top suppliers of leather shoes
to the EU (2007-2017) ................................................................................ 20
Figure 9: EU’s leather apparel imports (2000-2017, USD million) ............................. 23
Figure 10: EU’s leather apparel imports by country (2000-2017, USD million) ............ 23
Figure 11: Change in market share/unit value of top suppliers of leather apparel
to the EU (2007-2017) ................................................................................ 24
Figure 12: EU’s leather gloves imports (2000-2017, USD million) ............................... 25
Figure 13: European imports of leather gloves by market (2000-2017, USD million) .. 26
Figure 14: Change in market share/unit value of top suppliers of leather gloves
to the EU (2007-2017) ................................................................................ 26
Figure 15: European imports of leather belts (2000-2017, USD million) ...................... 27
Figure 16: European imports of leather belts by market (2000-2017, USD million) ..... 27
Figure 17: Change in market share/unit value of top suppliers of leather belts
to the EU (2007-2017) ................................................................................ 28
Figure 18: European imports of leather bags (2000-2017, USD billion)....................... 29
Figure 19: European imports of leather bags by market (2000-2017, USD million) ..... 30
Figure 20: Change in market share/unit value of top suppliers of leather bags
to the EU (2007-2017) ................................................................................ 30
Figure 21: Value chain for luxury brand OEM .............................................................. 32
Figure 22: Value chain for luxury brand OBM .............................................................. 33
Figure 23: Value chain for mid-high end OEM ............................................................. 34
Figure 24: Value chain for mid-high end OBM ............................................................. 34
Figure 25: Value chain for branded mass market OEM/CMT ...................................... 35
Figure 26: Branded mass market OBM ....................................................................... 36
Figure 27: Value chain for unbranded mass market .................................................... 36
Figure 28: Ethiopia’s leather and leather products exports (USD million,
1993-2017) ................................................................................................. 48
Figure 29: Employment in the Ethiopian LLP sector (2011/12-2017/18)...................... 48
Figure 30: Export share of leather skins and hides by markets and products
(%, 1994-2017) .......................................................................................... 50
Figure 31: Development of Ethiopia’s footwear exports by end-market
(2003-2017, USD million) ........................................................................... 52
Figure 32: Key actors in the Ethiopian LLP value chain .............................................. 58
Figure 33: Overview of key challenges in the Ethiopian LLP sector ............................ 64
Figure 34: Summary of key intervention areas ............................................................ 72
Figure 35: Detailed overview of the Ethiopian LLP value chain ................................... 87
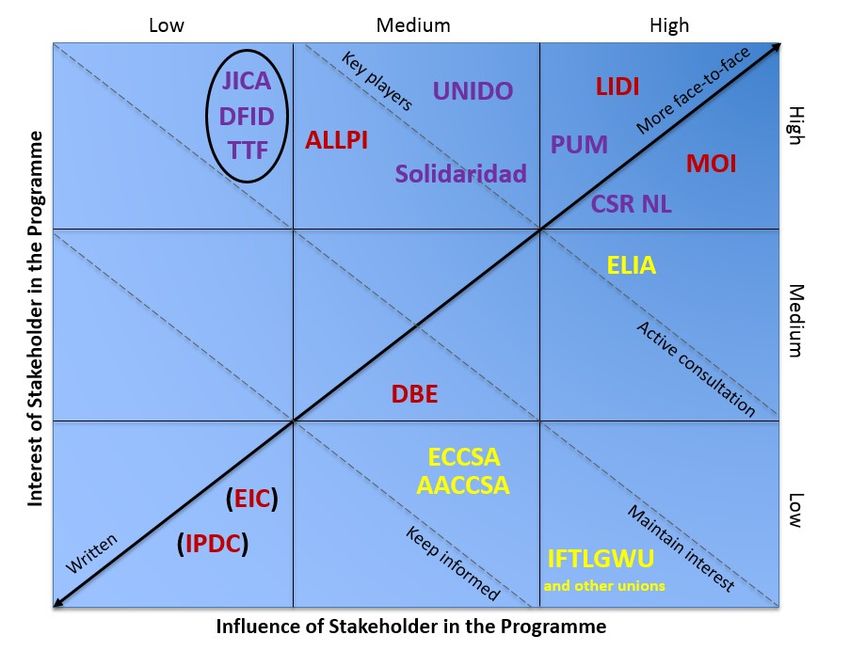
Figure 36: Stakeholder assessment grid ..................................................................... 88
Research 3
Table 1:     EU imports of hides and skins as well as leather by country (% of
             total EU imports) ........................................................................................ 15
Table 2:     Hides and skins as well as leather exporters to the EU (% of total
             EU imports) ................................................................................................ 16
Table 3:     EU imports of leather products by country (% of total EU imports) ............. 17
Table 4:     Leading suppliers of key EU leather products markets (2017, % share) .... 17
Table 5:     Top Western European Footwear Companies in 2017 ............................... 21
Table 6:     Top Western European Bag and Luggage Companies in 2011-2016......... 31
Table 7:     Value Chains for European Market ............................................................ 31
Table 8:     Key European tariff levels for LLP .............................................................. 39
Table 9:     Buyer types for each value chain model ..................................................... 39
Table 10:    Buyers’ product preferences and expectations overview ............................ 42
Table 11:    Product specific trends in the EU market.................................................... 46
Table 12:    Exports of leather products (HS42) by article (USD million, 2010-2017) .... 53
Table 13:    Exports of leather products by country (USD million, 2010-2017) .............. 53
Table 14:    Summary of sustainability issues in the Ethiopian LLP ............................... 63
Table 15:    EU import trends of key Ethiopian products (2005-2017, USD billion) ........ 70
Table 16:    Four models of institutional sustainability for export promotion .................. 81
Table 17:    Company list for CBI’s program ............ Fout! Bladwijzer niet gedefinieerd.
Table 18:    List of conducted interviews ................. Fout! Bladwijzer niet gedefinieerd.

            Research                                                                                                      4
ABBREVIATIONS
AAIT Addis Ababa Institute of Technology
ADLI Agricultural development led industrialization
ADPLAC Agriculture Development Partners Linkage Advisory Council
ALLPI African Leather and Leather Products Institute
ATA Agricultural Transformation Agency
ATVET Agricultural Technical and Vocational Education and Training
CAWEE Center for Accelerated Women's Economic Empowerment
CBI Center for the Promotion of Imports from Developing Countries
CITES Convention on International Trade in Endangered Species of Wild
Fauna and Flora
CMT Cut-make-trim
COMESA Common Market for Eastern and Southern Africa
CSR Corporate social responsibility
DBE Development Bank of Ethiopia
DFID U.K. Department for International Development
DOT Dioctyltin
EBA Everything But Arms Initiative
EC European Commission
ECBP Engineering Capacity Building Program
ECHA European Chemicals Agency
ECO2L Energy Controlled Leather
EDDC Ethiopian Domestic Distribution Corporation
EHL Ethiopia Highland Leather
EIC Ethiopian Investment Commission
EIFCOOS Ethio-International Footwear Cluster Cooperative Society
EIIDE Ethiopian Industrial Inputs Development Enterprise
ELIA Ethiopian Leather Industries Association
EPA Ethiopian Privatization Agency
ERCA Ethiopian Revenue & Customs Authority
ERHSSA Ethiopian Raw Hides and Skin Suppliers’ Association
EU European Union
EUR Euro
FC Farmer cooperative
FDI Foreign direct investment
Research 5FeMSEDA Federal Micro and Small Enterprises Development Agency
FeSMMIDA Federal Small and Medium Manufacturing Industry Development
Agency
FOC Free of chrome
FTC Farmer training center
GTI Green Tanning Initiative
GTP Growth and Transformation Plan
GVCs Global V alue Chains
IDS Industrial Development Strategy
IPDC Industrial Parks Development Corporation
ISO International Organization for Standardization
ITPO UNIDO’s Investment and Technology Promotion Office
JICA Japanese International Cooperation Agency
LICs Low-income countries
LIDI Leather Industry Development Institute
LISEC Leather Initiative for Sustainable Employment Creation”
LLP Leather and leather products
LLPTI Leather and Leather Products Technology Institute
MOoEFCC Ministry of Environment, Forest and Climate Change
MOI Ministry of Industry (the former Ministry of Trade and Industry)
MOLSA Ministry of Labor and Social Affairs
NACE Nomenclature statistique des activités économiques dans la
Communauté européenne
NARS National Agricultural Research System
OBM Original brand manufacturing
ODM Original design manufacturing
OEM Original equipment manufacturer
PAH Polycyclic aromatic hydrocarbons compounds
PBB Polybrominated biphenyls
PEPE Private Enterprise Programme
PFOA Perfluorooctanoic acid
PMO Prime Ministers’ Office
PoPs Persistent organic pollutants
REACH Registration, Evaluation, Authorization, and Restriction of Chemicals
ReMSEDA Regional Micro and Small Enterprises Development Agency
RoOs Rules of Origin
Research 6SMEs Small and medium enterprises
TTF Transformation Triggering Facility
UK United Kingdom
UN United Nations
UNIDO United Nations Industrial Development Organization
USD US Dollar
USP Unique selling point
WEA Women Entrepreneurs Association
WTO World Trade Organization
Research 7EXECUTIVE SUMMARY
Structural transformation and export diversification into higher value-added products and
away from primary commodities remain major development objectives for low-income
countries (LICs). Sectors such as apparel or leather products have traditionally been
gateways to export diversification for LICs and are generally regarded as first steps
for developing countries embarking on an export-oriented industrialization process. Given
their rather low entry barriers (low fixed costs and relatively simple technology) and labor-
intensive nature, the sectors can absorb large numbers of unskilled workers and provide
upgrading opportunities into higher value added activities within and across sectors.
However, the defining characteristics of these sectors also mean that they are very
competitive, leaving many suppliers with limited leverage and challenges in ensuring
social and environmental compliance and longer term development benefits.
In Ethiopia, the objective to transform from the still dominant agricultural sector to the
industrial sector is paramount in policies. Agricultural development led industrialization
(ADLI) was promoted as the main guiding principle of Ethiopia’s development process
and the leather and leather products (LLP) sector was identified as one of the main priority
sectors. Ethiopia has adopted an active, state driven industrial policy aimed at linking
the LLP sector to global value chains (GVCs).
The LLP GVC represents a classic example of a buyer-driven value chain which is
characterized by decentralized, globally dispersed production networks, coordinated by
lead firms, which control activities that add “value” to products (e.g., design, branding), but
often outsource all or most of the manufacturing process to a global network of suppliers.
Similar to other industries, the LLP GVC has experienced important geographical and
organizational shifts in the last few decades. These shifts entailed further participation of
developing and emerging economies in the transformative stages of the industry, beyond
the supply of hides and skins for manufacturing in the advanced economies, and are
reflected in increasing global trade values over time. China, in particular, has emerged as
a key location for the manufacturing of leather products.
In addition to the long-term trade growth due to geographical and organizational shifts in
the LLP GVC, three further major trade trends can be identified in the last decade. First,
LLP trade growth by value has slowed down since 2009, with the important exception of
leather bags. Second, global trade of LLP by value has decreased since 2014 due to falling
retail prices and a shift in consumption patterns in key markets, in particular a trend
towards the use of synthetic materials. It remains to be seen whether or not this trend will
continue in the near future. Third, China’s market share in key consumption markets has
been decreasing in the last few years.
The EU remains an important player in the global leather trade as both an importer and an
exporter of LLP. The LLP industry has, however, experienced significant changes over the
last few decades. Similar to apparel, a growing percentage of leather products
consumption is now met through imports. The dynamics of EU imports were similar to
global trends, with increasing imports in the last two decades, a slowdown since 2009 and
– depending on the product – partially negative growth rates since 2014. China enjoys a
dominant position in many market segments in the EU, but its share is decreasing. A
number of EU countries maintain relatively large leather manufacturing sectors, in
particular Italy, which managed to build a very strong position in the high-value added
luxury segment of the market.
Research 8This report argues that the shifting LLP GVC dynamics and China’s decreasing global
supply of leather products opened a window of opportunity for low cost countries such as
Ethiopia to link to GVCs and increase exports to key markets like the EU. Even though
global and EU trade development have been sluggish, Ethiopia could increase its market
share if the sector’s competitiveness can be increased. Ethiopia has, in addition, not only
market opportunities in key consumption markets, but also in regional markets in Africa
with high growth potential and in the relatively large local market.
Exporting to the EU is highly demanding and buyer requirements as well as profitability
differ across value chains. This report has identified seven value chains for leather
products in the EU, differentiated by market segments (luxury, mid-high end, mass market
branded and mass market unbranded) and the Ethiopian companies’ specific integration
and function in the value chain (cut make trim – CMT, original equipment manufacturer -
OEM, original brand manufacturer – ODM, etc.). These value chains represent different
pathways that – theoretically – could be taken by Ethiopian producers. Some of these
value chains are characterized by low margins, but integrating in such chains can
nonetheless have important learning effects and support manufacturers in exporting to
markets with higher margins in the future.
In order to take advantage of the opportunities, the key bottlenecks in the LLP sector need
to be mitigated. Some constraints are structural in nature and will take time to be fully
resolved. Reducing key bottlenecks on a step-by-step basis will nonetheless suffice to link
to GVCs and gradually increase exports. The key bottlenecks include the limited supply
and quality of raw hides and skins; the limited supply of export-quality finished leather to
local manufacturers in the necessary consistency; and the limited capacities and
capabilities of locally-owned manufacturers to link to GVCs and fulfil buyers’ requirements.
Improving the horizontal and vertical cooperation in the sector and the development of a
common export strategy will be crucial in order to fulfil the high requirements of EU buyers.
The lack of capacities and capabilities of locally-owned manufacturers to link to GVCs and
fulfil buyers’ requirements highlights the importance and potential of supporting measures
as offered by CBI. This report has identified Ethiopian footwear, handbags and – potentially
in the future – gloves as high potential leather products for increasing exports of locally-
owned manufacturers to the EU. We argue that footwear and handbag manufacturers
need to link to different value chains in the EU, given the different structure of the leather
sub-sectors in Ethiopia and the varying buyers’ requirements in specific value chains. The
generally larger footwear manufacturers are more likely to succeed in the branded-mass
market (CMT/OEM), and to a more limited extent, in the mid-high end market segments
(OEM). Handbag manufacturers, on the other hand, are relatively smaller in size and are
more likely to link to the mid-high end market segments (OEM).
If CBI implements a project in support of locally-owned leather manufacturers in Ethiopia,
it is also important to ensure its sustainability and maximize its impact. Linking up to
existing government policies and objectives, as well as to donor activities and coordination
platforms will be a key factor to avoid redundancies, identify complementarities and
maximize the impact of CBI’s program. In addition, CBI should assess whether or not one
of the proposed models for the institutionalisation of its program is feasible in order to make
its intervention more sustainable.
Research 91. INTRODUCTION
Structural transformation and export diversification into higher value-added products and
away from primary commodities remain major development objectives for low-income
countries (LICs). Sectors such as apparel or leather products have traditionally been
gateways to export diversification for LICs and are generally regarded as first steps
for developing countries embarking on an export-oriented industrialization process. Given
their rather low entry barriers (low fixed costs and relatively simple technology) and labor-
intensive nature, the sectors can absorb large numbers of unskilled workers and provide
upgrading opportunities into higher value added activities within and across sectors.
However, the defining characteristics of these sectors also mean that they are very
competitive, leaving many suppliers with limited leverage and challenges in ensuring
social and environmental compliance and longer term development benefits.
In Ethiopia, the objective to transform from the still dominant agricultural sector to the
industrial sector is paramount in policies. Agricultural development led industrialization
(ADLI) was developed as the main guiding principle of Ethiopia’s development process.
The underlying idea was that Ethiopia’s manufacturing sector should complement the
growth of the country’s dominant agricultural economy, focusing on labor intensive and
low-tech industries with linkages to the agricultural sector. One of the main priority sectors
is the leather and leather product (LLP) sector given its direct links to agriculture through
the livestock sector as well as its labor intensity, relatively simple technology and large
export potential. Ethiopia has adopted an active, state driven industrial policy aimed
at incentivizing exports, linking to global value chains (GVCs), attracting lead firms and
foreign direct investment (FDI), supporting local firms, and creating local linkages to
promote priority sectors. As a result, the Ethiopian LLP sector has experienced significant
growth dynamics in production, employment and exports as well as upgrading processes
in recent years. Despite many remaining constraints throughout the value chain that
hamper growth in exports and the positioning of Ethiopia as a sustainable sourcing
destination.
Given the high potential of the sector, the Center for the Promotion of Imports from
Developing Countries (CBI) is currently assessing whether or not to support locally-owned
leather manufacturing small and medium enterprises (SMEs) to increase exports to the
EU. The CBI program could provide support in the following areas:
1. Strengthening the sector by capacity building of various stakeholders and
strengthening collaboration between stakeholders.
2. Enlarging the export capacities of businesses with a product offer matching the
needs of European buyers.
3. Enlarging the visibility of the variety of products Ethiopia has to offer in the
international markets.
This report provides a value chain analysis and presents the opportunities and challenges
of the Ethiopian LLP sector in order to better assess whether or not such a program is
suitable. The structure of the report is as follows: Chapter 2 gives a brief overview of the
LLP GVC dynamics and recent developments. In chapter 3, we analyze the EU’s LLP
value chains by discussing different products, market segments and value chain dynamics
as well as buyers’ requirements. Chapter 4 discusses the Ethiopian LLP sector’s recent
development and structure. In Chapter 5, the opportunities and challenges of Ethiopia’s
LLP sector are presented and policy recommendations are developed thereafter, in
Chapter 6. In Chapter 7, we present the key findings of our study.
Research 102. THE LLP GVC
The LLP GVC represents a classic example of a buyer-driven value chain which is
characterized by decentralized, globally dispersed production networks, coordinated by
lead firms which control activities that add “value” to products (e.g., design, branding), but
often outsource all or most of the manufacturing process to a global network of suppliers
(Gereffi 1999). Although buyers are usually not directly involved in production, they yield
significant control over manufacturers and stipulate often detailed product and production
specifications. The strategies of lead firms/buyers, in particular their global sourcing
policies related to costs, quality, lead times, market access, flexibility and compliance,
importantly shape production and trade patterns as well as upgrading opportunities in the
LLP sector.
Dimensions for producers to upgrade to higher value-added activities within GVCs include
process, product, functional and end market upgrading. The steps in the functional
upgrading trajectory1 from cut-make-trim (CMT) to original equipment manufacturer (OEM)
and further to original design manufacturing (ODM) and original brand manufacturing
(OBM) can be used to define categories of leather product manufacturers
(Gereffi/Frederick 2010; Staritz 2012).
The LLP value chain can be roughly divided into five key segments (Figure 1): (i) the
livestock sector and slaughterhouses, where hides and skins are collected; (ii) collectors
and traders of raw skins and hides; (iii) tanneries, which transform raw hides and skins into
semi-finished and finished leather; (iv) leather manufacturers, who produced various types
of leather products; and (v) buyers (intermediaries, branders, retailers, etc.), responsible
for distribution and sales channels at the wholesale and retail levels. Different leather items
are traded locally and internationally at different points in the value chain.
In general, the raw hides and skins are a by-product of meat production and sold to
tanneries by intermediaries. Tanning combines various processing steps from preparatory
stages, tanning, crusting to finishing.2 Many tanneries in the global (semi-)periphery are
not able to perform all processing steps and only produce lower value and semi-processed
leather (e.g. wet blue, wet white, crust, etc.). The finished leather is used to produce
various leather products for a variety of end-use markets (footwear, apparel, bags, car-
interiors, furniture, etc.). In contrast to the very labor-intensive manufacturing sector,
leather processing in tanneries is more capital and scale intensive.
1
An assembly or CMT manufacturer is responsible for manufacturing leather and may be responsible for cutting the leather and
sourcing simple trim (buttons, zippers, etc.). The buyer provides product specifications and the leather. The leather factory is
paid a processing fee rather than a price for the product. A FOB or OEM supplier purchases (or produces) the leather inputs
and provides all production services, finishing, and packaging for delivery to the retail outlet. The customer provides the design
and often specifies leather suppliers. An ODM is involved in the design and product development process, including the approval
of samples and the selection, purchase and production of required materials. The last upgrading step in this trajectory is OBM,
where suppliers develop their own brands and are thus also in charge of branding and marketing (Gereffi 1999).
2
Leather products after tanning are termed wet blue or wet white. Leather products after crusting are termed crust. Leather
products after finishing are termed finished leather. The processing stages in tanneries include the removal of the salt that
farmers use to avoid bacterial action, swelling up (soaking), unhairing (liming), removal of flesh (fleshing), the cutting of the
edges (trimming), splitting of the leather into a grain and flesh side (splitting), deliming/bating/pickling (treatment of the leather,
e.g. to improve the effects of tanning) and tanning (chrome or vegetable tanning). At this stage, the leather is neutralized
(removal of acids) and dried (wringing). After, the leather can be retanned, dyed (colored), fatliquored, dried, softened and –
depending on the specifications of the buyer – finished (e.g. color effects, embossing, adjusting gloss level, etc.).
Research 11Figure 1: The LLP GVC
Source: Own elaboration.
Similar to other industries, the leather industry has experienced important geographical
and organizational shifts in the last few decades. These shifts entailed further participation
of developing and emerging economies in the transformative stages of the industry,
beyond the supply of hides and skins for manufacturing in the advanced economies, and
are reflected in increasing global trade values over time (Figure 2). China, in particular,
has emerged as a key location for the manufacturing of leather products. This rise of China
involved growing exports of semi-finished and finished leather from other parts of the world
to China where these inputs are transformed and then exported to different markets
including countries from where the leather was sourced. Similar to other industries, such
shifts were reflected in the growth of imports of leather products in a number of key global
markets.
The majority of skins and hides are produced in developing countries. Tanning, on the
other hand, is more dispersed globally with a relatively large number of countries
maintaining tanning capacities and with a trend of tanneries to follow leather product
manufactures geographically. Over the last two decades, tanneries in rising producers of
leather products such as China expanded while tanneries in the advanced economies
declined with remaining tanneries in the advanced economies focusing on niche segments
(UNIDO 2010). A trend toward more globally consolidated tanneries has also been seen
in the last few years as globalised tanneries set up production units in different parts of the
world.
Manufacturing of leather products takes place with varying degrees of scale and
labor/capital intensity. Leather products can be manufactured in small and more labor-
intensive workshops or in large more capital-intensive factories (Memedovic/Mattila 2008).
The two types of production exist in the global industry today and focus on different
segments of the value chain. The rise of China in the manufacturing of leather over the
last few decades has been largely driven by the ability of Chinese producers to dominate
the lower to medium end segment of the industry through large-scale manufacturing. This
model of production is highly sensitive to scale due to high fixed overhead costs. As such,
this model is more sensitive to changes in market trends. Smaller scale production, on the
other hand, is more flexible in terms of scale of production and has lower fixed overhead
costs. Nonetheless, the lower economies of scale in this model makes it less competitive
in price-sensitive segments. As we will highlight later in this report, the dominance of China
in leather manufacturing based on large-scale and high fixed overhead costs is, thus, both
an advantage, due to economies of scale, and a risk, due to the need to maintain large-
scale production.
Research 12In addition to the long-term trade growth due to geographical and organizational shifts in
the LLP GVC, three further major trade trends can be identified in the last decade. First,
LLP trade growth by value has slowed down since 2009. However, leather products (excl.
footwear), particularly bags, have been an exception to this trend. Growth rates for leather
and leather footwear have been particularly weak. Second, global trade of LLP by value
has decreased since 2014 due to falling retail prices and a shift in consumer demands in
key consumption markets, in particular a trend towards the use of synthetic materials. It
remains to be seen whether or not this trend will continue in the near future. Third, as we
will show in more detail in the next chapter, China’s market share in key consumption
markets is decreasing in the last years due to rising wages, which opens a window of
opportunity for low-cost suppliers such as Ethiopia.
The negative market trend thus does not necessarily imply shrinking opportunities for
countries in the global periphery to link to the LLP GVC and increase exports. Global
buyers continue to optimize their sourcing strategy and are likely to shift to countries like
Vietnam, or potentially Ethiopia, in the context of rising wages in key supplier countries like
China. In addition, countries with a unique selling point (USP), e.g. high quality of specific
leather types, can use these advantages to successfully link to the LLP GVC and increase
exports to key consumption markets.
Figure 2: Global LLP trade (2000-2017, billion USD)
80
70
60
50
40
30
20
10
-
2000 2001 2002 2003 2004 2005 2006 2007 2008 2009 2010 2011 2012 2013 2014 2015 2016 2017
Leather Leather Products Leather Footwear
Note: Data represents global imports. Leather data includes raw hides and skins.
Source: UN Comtrade 2018 (WITS).
Research 133. MAPPING THE EUROPEAN UNION’S LLP VALUE CHAIN
3.1. Introduction
The EU remains an important player in the global leather trade as both an importer and an
exporter of leather and leather products. According to the EU Commission, the leather and
related goods sector comprises about 36,000 enterprises and generates a turnover of EUR
48 billion employing around 435,000 people (European Commission 2018a). Europe
remains an important player in the tanning stage with European tanneries active both in
the EU and also through foreign direct investments (FDI) in different parts of the world.
The European industry has, however, experienced significant changes over the last few
decades. Similar to apparel, a growing percentage of EU’s consumption of leather
products is now met through imports. In addition to China, which enjoys a dominant
position in many market segments in the EU, countries such as India, Pakistan, Vietnam
and Indonesia, are important suppliers in addition to exports from countries within the
Euro- Mediterranean zone such as Turkey, Morocco, and Tunisia. Nonetheless, a number
of European countries maintain relatively large leather product manufacturing sectors.
Those countries, in particular Italy, have managed to build a very strong position in the
high value-added luxury segment of the market, thus, creating substantial branding
barriers to entry for other suppliers. Other countries, such as Germany and the UK,
maintain production in niche areas that are often connected to other domestic industries
such as production of leather goods for the automotive sector.
Total EU imports of LLP have increased in the last two decades, particularly those of
leather products and footwear (Figure 3). The dynamics of EU imports were similar to the
global trends discussed in the previous chapter. Despite limited growth, EU imports of raw
leather remained substantial for supporting European producers of different leather
products in their quest to maintain a significant manufacturing sector.
Figure 3: EU’s imports of leather and leather products (2000-2017, billion USD)
30
25
20
15
10
5
0
Leather Leather products Leather footwear
Note: Includes intra-EU trade. Leather data includes raw hides and skins.
Source: UN Comtrade 2018 (WITS)
Research 143.2. EU’s integration in the LLP GVC
In the following section, the integration of the EU in the LLP GVC is discussed. The EU
LLP value chain can be roughly divided into five key segments: (i) the livestock sector, (ii)
collectors and local traders that link farmers with tanneries; (iii) tanneries, which source
hides and skins locally or globally and produce wet blue, crust and finally coated or finished
leather. Tanneries export either directly with further manufacturing taking place abroad or
supply (iv) leather manufacturers. Leather manufacturers may also import finished leather
from abroad and (v) supply the EU market or export. Leather products are also often
imported by branders, distributors, wholesalers or retailers.
3.2.1. Raw hides and skins and leather
Tanning involves the treatment of raw hide or skin to enable its use in the manufacture of
consumer products. Europe produces its own leather used for manufacturing activities and
also imports leather produced globally. Europe maintains its own leather industry with
about 3,000 enterprises employing around 42,000 people and generating revenues of
EUR 11 billion in 2015 (Eurostat 2018).3 European tanneries are a mixture of small and
medium family businesses and larger tanneries and often produce very high value calf
skins (European Commission 2018a). Outlets for European produced leather are footwear
(41%), leather goods (19%), furniture (17%), the automotive industry (13%), clothes (8%)
and other (2%) (European Commission 2018a).
In terms of leather imports, Italy remains the main destination in the EU accounting for
almost a third of total EU imports (Table 1). This is due to the importance of Italy as a
producer of leather products both in the European market and in the global market. Over
the last few years, restrictions on exports of raw and semi-finished leather by a number of
countries have provided a challenge in terms of access to raw materials for the EU
industry, in particular with the decline in production of skins and hides in the EU (European
Commission 2018a).
Table 1: EU imports of hides and skins as well as leather by country (% of total EU imports)
2007 2016
Country Share Country Share
Italy 38.4% Italy 35%
Germany 9.3% Germany 8.7%
Romania 7.6% Spain 7.2%
Spain 6.95% France 6.9%
Poland 5.6% Romania 5.9%
France 5% Portugal 5.7%
Source: UN Comtrade 2018 (WITS).
In terms of exporters, a relatively large number of countries supply hides and skins as well
as leather to the EU (Table 2). In addition, there is a substantial intra-EU trade in leather
with other EU countries often in the list of top five exporters of leather to other European
countries. Italy, the largest importer of leather in Europe, imports substantial amounts from
countries such as France, Spain, Germany, and the Netherlands.
3
These figures includes dressing and dyeing of fur.
Research 15Table 2: Hides and skins as well as leather exporters to the EU (% of total EU imports)
2007 2016
Country Share Country Share
Brazil 18% Brazil 15.6%
United States 6.6% United States 10.5%
India 6.6% India 6.7%
Argentina 5.7% Argentina 4.4%
China 5.1% Nigeria 4.1%
Russia 5% New Zealand 3.6%
Source: UN Comtrade 2018 (WITS)
It is important to note that the country of origin and EU importers differ significantly
depending on the processing stage of leather. The EU imports leather at different stages
(raw and semi-finished leather, crust/wet blue leather, and finished leather), but the
majority of EU imports are finished leather as well as raw and semi-finished leather.
Imports of crust/wet blue leather are relatively small.
For raw and semi-finished leather, Italy is by far the largest European importer accounting
for around 60% of total European imports in 2017 (UN Comtrade 2018). Italy was followed
by Germany, which imported 7.5% of all EU imports, followed by Spain (5.7%) and the
Netherlands (5%) (UN Comtrade 2018). The main exporters of raw and semi-finished
leather to the EU include Brazil (17.6%), the United States (13.1%), New Zealand (6.8%),
and Argentina (6.5%) in addition to Ukraine, Paraguay, and South Africa (UN Comtrade
2018). Intra-EU trade is also substantial in this area with Italy importing large amounts of
raw and semi-finished leather from France, Germany, the Netherlands, and Spain.
Italy is also the main EU importer of finished leather, but with a substantially lower market
share (15%) compared to raw and semi-finished leather (UN Comtrade 2018). Germany
(11.6%), Romania (11.4%), Poland (9.5%), France (8.2%), and Portugal (7%) are also
important importers (UN Comtrade 2018). In terms of main exporters to the EU, Brazil had
a market share of 25%, followed by India (18.2%), Pakistan (9.4%) and Turkey (6.3%), in
addition to Russia and South Africa (UN Comtrade 2018).
EU imports of crust/wet blue leather are substantially lower. Italy is the main EU importer
of crust/wet blue leather with an overall share of 76% of total EU imports (UN Comtrade
2018). Spain is the second importer with a share of 11.2% followed by France (4.3%) and
Portugal (2.8%) (UN Comtrade 2018). With regards to exporters to the EU, Nigeria is the
largest supplier with a 49% share of EU imports of crust/wet blue leather, followed by India
(23.7%), Kenya (5.9%), Uganda (3.4%), and China (3.3%) (UN Comtrade 2018).
3.2.2. Leather manufacturing
While the EU has maintained an important presence in the leather manufacturing industry
(mainly due to the position of Italy), the last two decades have witnessed a sharp increase
in the imports of leather products by the EU, indicating that most growth in demand has
been met by such imports. All of the major European markets experienced rapid growth in
imports of leather products although rates varied (Figure 4). The main importers of leather
products in the EU are France, Germany, the United Kingdom and Italy (Table 3).
Research 16Figure 4: Key EU importers of leather products (USD billion, 2002-2017)
Belgium Germany Spain France UK Italy Netherlands
5
4,5
4
3,5
3
2,5
2
1,5
1
0,5
0
2002 2003 2004 2005 2006 2007 2008 2009 2010 2011 2012 2013 2014 2015 2016 2017
Source: UN Comtrade 2018 (WITS).
Table 3: EU imports of leather products by country (% of total EU imports)
2007 2017
Country Share Country Share
United Kingdom 15.8% France 17.8%
France 15.4% Germany 17.8%
Germany 15.2% United Kingdom 13.7%
Italy 14.1% Italy 12.3%
Spain 8.1% Spain 7.3%
Belgium 5.9% Netherlands 7.1%
Source: UN Comtrade 2018
In terms of exporters, China is by far the largest supplier of leather products to the EU with
a share of 55% of total European imports (UN Comtrade 2018). China is followed by India
(11%), Switzerland (9.7%), Vietnam (7.2%), Pakistan (2.9%), and Turkey (1.6%). Intra-EU
trade in leather products remains substantial with Italy in particular having a large market
share in other European markets. While the main suppliers to different European markets
tend to be similar, there are important differences in market shares. In France for instance,
Italy is the main supplier with a market share of 35% compared to a share of 29.3% for
China. In Germany, on the other hand, the share of China is 36.2% compared to only
12.3% for Italy (Table 4).
Table 4: Leading suppliers of key EU leather products markets (2017, % share)
France Germany UK Netherlands Italy
% % % % %
Italy 35 China 36.2 China 33.6 China 27.8 China 33
China 29.3 Italy 12.3 France 17.4 Vietnam 12.3 France 21.4
Spain 7 India 9.5 Italy 14.8 Germany 10.8 Switzerl. 8.6
India 4.5 France 6.7 India 6.6 Italy 8.1 NL 6.6
Vietnam 3.8 Vietnam 6.4 Netherl. 5.2 Belgium 6.8 India 4.6
Source: UN Comtrade 2018 (WITS).
Research 17Despite the large share of China in EU’s leather products imports, it is important to note
that the share of China has been declining over the last decade following the rapid growth
rates of previous years (Figure 5). This decline in China’s market share was compensated
by a number of other suppliers including a higher share of EU producers. Between 2006
and 2017, Italy, France, Germany, and Spain increased their share in EU imports of leather
products, in addition to an increase in the market share of Vietnam.
The remaining production in the EU is often focused on niche products. The UK for
instance has a sizeable automotive leather industry since the UK has a large car industry.
Italy is to some degree an outlier as it has maintained its competitiveness in multiple
product sectors, most notably in the luxury segment.
Figure 5: China’s share in EU’s total leather product imports (%, 1994-2017)
France Germany UK Italy Netherlands EU 27
60
50
40
30
20
10
0
Source: UN Comtrade 2018 (WITS)
To examine trends in leather products more closely, we will now look in more detail at
categories of leather products: footwear, apparel, apparel accessories and luggage and
leather goods.
3.2.2.1 Footwear
3.2.2.1.1 Value chains and buyers-supplier relations
The EU is one of the key global consumption markets of (leather) footwear and is highly
dependent on imports from low-cost manufacturing countries.
As discussed above, high levels of footwear are imported from low cost manufacturing
countries. With many global suppliers competing individual suppliers have limited power
in their relationships with buyers (MarketLine 2018a). In this industry it is difficult and
consequently rare for manufacturers to forward integrate to incorporate retail functions
(MarketLine 2018a).
European manufacturers offer highly differentiated products to compete with low cost
imports (MarketLine 2018a).These can include products with specialised functions and
high-end products.
Footwear producers are expected to move their production closer to European demand as
labour costs have been rising in traditionally low-cost production areas, such as China and
Research 18Indonesia (MarketLine 2018a). Another issue is that retail prices are falling due to growing
global manufacturing capacity based on technological developments (MarketLine 2018a).
In this context many producers face challenges with rising labour and raw material costs
(MarketLine 2018a).
3.2.2.1.2 Domestic production
The EU’s footwear sector (incl. non-leather production) had about 20,300 enterprises
employing 287,000 people in 2016 with €27 billion in turnover (Eurostat 2018). Over two-
thirds of this production is from Italy, Spain and Portugal with Italy alone contributing 50%
(Eurostat 2018). In 2016, the top five producers were Italy (EUR 13.8 billion turnover),
Spain (EUR 3.2 billion), Portugal (EUR 2.5 billion), Germany (EUR 1.9 billion) and
Romania (EUR 1.0 billion) (Eurostat 2018). The high share of Italy particularly reflects the
remaining leather footwear industry producing high-value shoes, with the most expensive
global average price for shoe exports (MarketLine 2018a).
Most businesses in the EU are small with an average turnover of one million euros
(European Commission 2018b). The number of firms has been declining as production
moves abroad and most remaining are focusing on high-quality, high-added value or niche
markets, such as high-end footwear, children’s shoes, footwear for specific applications
(protective, golf, skiing boots), and bespoke footwear (European Commission 2018b).
3.2.2.1.3 Imports
The EU’s imports of leather shoes (HS6403/HS640510) increased rapidly in the first half
of the last decade before stabilizing and fluctuating following the global economic crisis in
2008 (Figure 6). In 2017, Germany was the main importer of leather shoes in the EU with
a market share of 21.6%, followed by France (15.6%), the UK (12.6%), Italy (9.6%), and
the Netherlands (9.5%) (UN Comtrade 2018). The growth of the EU’s imports over the last
decade, however, varied between different markets with Germany, Netherlands, and
Eastern European countries maintaining growth in their imports after the global crisis
relative to Italy, France, and the UK where imports dropped (Figure 7).
Figure 6: EU‘s imports of leather footwear (2000-2017, USD billion)
30
25
20
15
10
5
Note: Data includes intra-EU trade.
Source: UN Comtrade 2018 (WITS).
Research 19Figure 7: EU‘s imports of leather footwear by country (2000-2017, USD billion)
Germany Eastern Europe France UK Italy Netherlands
6
5
4
3
2
1
Note: Data includes intra-EU trade.
Source: UN Comtrade 2018 (WITS).
In terms of exporters to the EU, China was the main supplier of leather shoes to the EU in
2017 with a market share of 25%. Vietnam was the second largest supplier with an 18%
market share, followed by India (13.9%), Indonesia (10.1%), Switzerland (6.4%),
Bangladesh (3.1%), Tunisia (3%), Albania (2.9%), Cambodia (2.7%), Bosnia (2.3%),
Morocco (1.9%), and Turkey (1.6%) (UN Comtrade 2018). This represented a decline in
China’s market share from 30% in 2007, compared to 16% for Vietnam, 11.5% for India,
and 7.9% for Indonesia (UN Comtrade 2018). Overall, a degree of consolidation in the
supply base took place over this period with the share of the top 12 exporters increasing
from 81% in 2007 to 90% in 2017 (UN Comtrade 2018). These changes in market share
were associated with shifts in unit value, with some countries such as Bangladesh,
Cambodia, and Switzerland achieving a substantial increase in both their market share
and unit value (Figure 8).
Figure 8: Change in market share/unit value of top suppliers of leather shoes to the EU
(2007-2017)
60
Cambodia Switzerland
50
% CHANGE IN UNIT VALUE
40
Vietnam
30
Bosnia
20 Bangladesh
China Indonesia Albania
10 Turkey
Morocco
India
0
Tunisia
-100 -50 0 50 100 150 200 250 300 350
-10
% CHANGE IN MARKET SHARE
Source: UN Comtrade 2018 (WITS).
Research 203.2.2.1.4 Retail market
Footwear revenue in the EU amounted to USD 104.9 billion in 2017, with leather footwear
accounting for almost half of total revenue (49% or USD 51.7 billion) and 28.7% by volume
as leather footwear is more expensive (Statista 2018a).
In Western Europe, the footwear market is heavily fragmented with more than 40% of sales
split across smaller manufacturers and brands that each account for under 1% of the retail
market value (Euromonitor 2015). In most countries, local brands play an important role
and the large number of companies creates high price competition. Price competition is
intensifying as foreign retailers and footwear specialists are entering EU markets,
improving options for styles and brands. (MarketLine 2018a).
There is also so process of consolidation with the top 10 sellers making up 28% of the
Western European retail value in 2014, which was an increase of 11% over 2005
(Euromonitor 2015). By 2017, the leading five footwear players in Western Europe made
up 25% of the region’s sales (Table 5; Euromonitor 2018a). Consolidation can be seen as
a result of consumers downgrading to more affordable fashion brands offered by large
apparel chains and large footwear specialist retailers expanding their offerings in the lower
end of the market (Euromonitor 2015). These companies have the advantage of
economies of scale.
Table 5: Top Western European Footwear Companies in 2017
Rank Company Rank Company
1 Nike Inc 6 Kering SA
2 Adidas Group 7 Inditex
3 Private Label 8 Geox SpA
4 Deichmann SA 9 Vivarte SAS
5 C & J Clark Int. Ltd. 10 Asics Corp
Source: Euromonitor 2018a
As a result, the footwear market in Western Europe is becoming increasingly polarised.
Private labels have lost in competition with low priced global fashion giants (Euromonitor
2018a). Fast fashion retailers, such as H&M, Zara (Inditex) and Primark, have increased
their market share, putting pressure on specialist shoemakers and multi-brand footwear
specialist retailers (Euromonitor 2015). Sports footwear brands such as Nike and Adidas
have also experienced high growth rates, benefitting from strong brand recognition,
continued innovation and marketing campaigns (Euromonitor 2018a). In the five years
from 2012 to 2017, the fastest growing companies in terms of revenue were all sports
footwear players. Online retail has also experienced high growth rates: E-commerce rose
from 5% of footwear sales in Western Europe in 2009 to over 12% in 2014 (Euromonitor
2015).
The European footwear market is rather evenly split between the top four markets,
Germany (14.0% market share), Italy (13.5%), UK (12.2%) and France (11.3%)
(MarketLine 2018a). Some large companies are focused on individual countries within the
EU (Euromonitor 2018a). Mass market retailer Deichmann, for example, is popular in its
home market of Germany and also in Austria, the Netherlands and Turkey. Vivarte focuses
entirely on its domestic market, France. C&J Clark International, similarly, has 94% of its
regional sales in its home market, the UK. Nike Inc, Adidas Group, and Asics, on the other
hand, have broad regional coverage.
Research 213.2.2.2 Apparel
The category of ‘Apparel’ refers to items of clothing. The EU’s NACE Rev 2 classification
system considers leather clothes to include “wearing apparel made of leather or
composition leather including leather industrial work accessories as welder’s leather
aprons” (Eurostat 2008: 128). The category excludes fur wearing apparel, leather sports
gloves and sports headgear, fire-resistant and protective safety clothing.
3.2.2.2.1 Value chains and buyer-supplier relationships
EU’s apparel retailers acting as buyers are often very large companies. Also a large portion
of the retail sector in Europe is made out of retailers’ own brands. For example, for ASOS,
a large and rapidly growing online retailer with 2017 sales surpassing USD 2.5 billion, two-
fifths of products sold were own brand (MarketLine 2018b). However, numerous smaller
buyers also have a place in the market.
Large apparel retailers and supermarkets have the ability to buy in bulk and save money
on economies of scale. This puts downward pressure on prices of suppliers. Apparel
suppliers are often small and medium enterprises, which face low bargaining power. There
are high levels of cost competition globally. Wage differentials between EU-producers and
low-cost regions remain very high.
Buyers have traditionally had a relatively low cost of switching. However, this is changing.
There are some factors driving the development of longer relationships. For some buyers,
working conditions in the factories they source from have become part of the supplier
selection criteria. Large buyers are developing more sophisticated on-boarding processes
and they increasingly use approved supplier lists. Also, with fast fashion, buyers can
benefit from having suppliers they can trust to work quickly to meet expectations.
Nonetheless, the low levels of differentiation between products mean that it is not difficult
for new players to supply EU buyers.
Clothing manufacturing remains a highly labour-intensive activity. Being located in areas
with low labour costs can be an advantage for suppliers. While most suppliers remain
small, some large multinational suppliers have emerged in recent years. Clothing suppliers
for EU markets have been developing their own domestic and global fashion brands,
particularly in Asia.
3.2.2.2.2 Domestic production
EU clothing production has declined in the context of rising imports. However, the EU still
housed approximately 120,000 apparel enterprises employing almost a million people with
a turnover of EUR 71 billion in 2015 (Eurostat 2018). Top producers in 2016 were Italy
(EUR 28 billion), Germany (EUR 9 billion), France (EUR 7 billion), UK (EUR 5 billion),
Spain (EUR 5 billion) and Portugal (4 billion) (Eurostat 2018). Leather apparel is a small
portion or this industry. In 2014, Europe had about 2,400 leather apparel businesses,
employing 11,000 with a total turnover of 900 million EUR. Specifically considering leather
apparel, Italy was by far Europe’s largest producer with a manufacturing turnover of EUR
554.5 million, followed by France (EUR 70.3 million), Germany (EUR 53.4 million), Poland
(EUR 45.2 million) and Romania (EUR 16.8 million) in 2016 (Eurostat 2018).
3.2.2.2.3 Imports
EU imports of leather apparel by value experienced a declining trend over the last two
decades, particularly following the economic crisis of 2008 (Figure 9). In 2017, Germany
was the main importer of leather apparel with a market share of 22% followed by France
(16.9%). Italy (12.3%), Spain (11.2%), the UK (11.1%), and the Netherlands (8.2%) (UN
Research 22You can also read