Risk Review 2021 - FEDERAL DEPOSIT INSURANCE CORPORATION - FDIC
←
→
Page content transcription
If your browser does not render page correctly, please read the page content below
FEDER AL DEPOSIT INSUR ANCE CORPOR ATION

Risk Review
2021

                               www.fdic.gov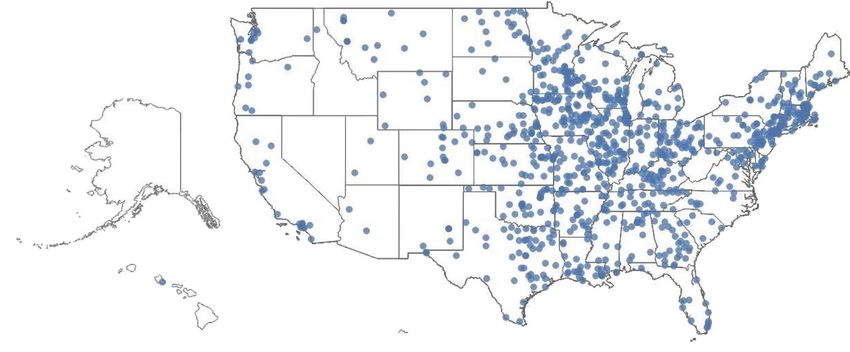
2021
Risk Review
PAGE INTENTIONALLY LEFT BLANK
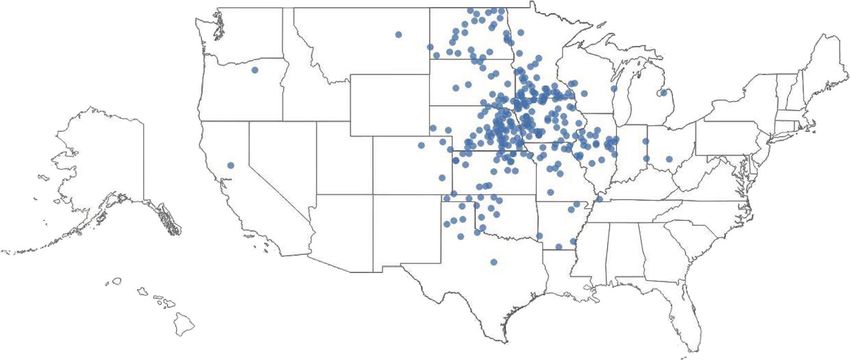
Table of Contents

Introduction............................................................................................................................... 1

Section I: Executive Summary...................................................................................................... 3

            Key Risks to Banks .......................................................................................................................4

Section II: Economic, Financial Markets, and Banking Industry Overview......................................... 7

            Economy.....................................................................................................................................7

            Financial Markets....................................................................................................................... 12

            Banking Industry........................................................................................................................ 16

Section III: Key Risks to Banks.................................................................................................... 21

      Credit Risk....................................................................................................................................... 21

            Agriculture................................................................................................................................ 21

            Commercial Real Estate.............................................................................................................. 26

            Consumer Debt........................................................................................................................... 33

            Energy...................................................................................................................................... 36

            Housing..................................................................................................................................... 40

            Leveraged Lending and Corporate Debt........................................................................................ 46

            Nonbank Financial Institution Lending......................................................................................... 50

            Small Business Lending............................................................................................................... 52

      Market Risk...................................................................................................................................... 58

            Interest Rate Risk and Net Interest Margin.................................................................................... 58

            Liquidity and Deposits................................................................................................................. 62

Acronyms and Abbreviations..................................................................................................... 65

Glossary of Terms..................................................................................................................... 66

                                                                                                                               2021 Risk Review | V
PAGE INTENTIONALLY LEFT BLANK

VI | 2021 Risk Review
Introduction
The FDIC was created to maintain stability and public                                  The report summarizes conditions in the U.S. economy,
confidence in the nation’s financial system. Identifying                               financial markets, and banking industry, and presents
and analyzing key risks in the economy, financial                                      key credit and market risks to banks. The credit risk
markets, and the banking industry that could affect                                    areas discussed are agriculture, commercial real estate,
insured institutions are critical to achieving this mission.                           consumer debt, energy, housing, leveraged lending and
The FDIC has communicated such risks through various                                   corporate debt, nonbank financial institution lending,
outreach events, research, and publications. In recent                                 and small business lending. The market risk areas
years, the FDIC began publishing a comprehensive                                       discussed are interest rate risk and net interest margin,
summary of key banking sector risks in a consolidated                                  and liquidity and deposits. Much of the discussion
report, the Risk Review. The Risk Review also contributes                              focuses on risks that may affect community banks.
to building trust and confidence through openness                                      As the primary federal regulator for the majority of
and accountability, a pillar of the FDIC’s Trust through                               community banks in the United States, the FDIC is
Transparency initiative.1                                                              attuned to risks that may affect the U.S. banking system,
                                                                                       community banks in particular, and benefits from this
FDIC-insured institutions navigated an unprecedented                                   public discussion.
banking landscape in 2020 with the onset of the COVID-19
pandemic. Federal support programs cushioned the                                       Section I is an executive summary. Section II is an
nation’s economy and muted the effects of the pandemic                                 overview of economic, financial market, and banking
on the banking industry, but close monitoring of key risks                             industry conditions. Section III is our assessment of the
remains essential. The 2021 Risk Review covers key risks                               key credit and market risks facing banks.
so policymakers and bankers can mitigate their scope and
impact.

1
  In 2018, FDIC Chairman Jelena McWilliams announced Trust through Transparency, a new initiative to foster a deeper culture of openness in the FDIC. Building on
the FDIC’s foundation of public trust and accountability, this initiative is strengthening trust between the FDIC, other regulators, the public, and banks. For more
information, see https://www.fdic.gov/about/initiatives/trust-through-transparency/.

                                                                                                                                            2021 Risk Review | 1
PAGE INTENTIONALLY LEFT BLANK

2 | 2021 Risk Review
Section I: Executive Summary
After a prolonged period of relative stability,                                     Financial market conditions deteriorated sharply with
economic conditions deteriorated sharply in                                         heightened stress in early 2020, but most markets
March 2020 following the onset of the COVID-19                                      have since recovered. In March 2020, the onset of
pandemic and closure of several key industries. The                                 the pandemic severely disrupted financial markets,
consumer, business, and banking sectors overall had                                 and equity and corporate bond markets saw sharp
entered 2020 in relative strength. Although corporate                               selloffs. Market conditions improved with the help of
debt fundamentals raised concern, smaller businesses                                unprecedented federal support programs. Most markets
were growing and consumer balance sheets were strong.                               fully recovered throughout the rest of 2020, and some
Many sectors of the economy were challenged as the                                  exceeded pre-pandemic levels.
pandemic unfolded, but federal programs provided
timely and important support to affected industries                                 The banking sector, though challenged by economic
and consumers throughout the year. The banking                                      and financial market conditions, remained relatively
industry remained resilient entering 2021 despite the                               resilient in 2020 and was a source of stability to the
extraordinary challenges of the pandemic. Strong                                    economy. The banking sector was helped by strong
liquidity and capital levels at the start of 2021 should help                       capital and liquidity levels as well as various government
to mitigate potential asset quality deterioration across                            programs that enabled banks to extend loan forbearance
loan portfolios.                                                                    and to provide support for consumers and businesses.
                                                                                    Industry balance sheets remained sound through 2020,
The economy entered the deepest recession in modern                                 but banking income declined substantially. FDIC-insured
history in 2020 as millions of individuals lost their jobs                          institutions reported a 36.5 percent decline in income
and many small businesses closed. The unemployment                                  between 2019 and 2020, which was primarily driven by a
rate rose to a record high and an unprecedented number                              sharp increase in provision expense during the first half
of people filed for unemployment insurance.2 Extensive                              of the year. Bank liquidity was supported in 2020 by a
fiscal and monetary policy helped limit the impact                                  record increase in deposits. Deposits surged 22.6 percent
of the crisis and prevent mass business bankruptcies                                between 2019 and 2020. The banking industry loan
and consumer defaults. Conditions remain weak                                       portfolio increased in 2020, primarily because of growth
for many service industries including restaurants,                                  in commercial and industrial loans, including those
retail, entertainment, travel and tourism, and other                                made through the Small Business Administration
discretionary services that do not allow for remote                                 (SBA) Paycheck Protection Program (PPP). Asset
work. The economic environment poses a significant                                  quality indicators deteriorated modestly but remained
source of risk for the banking industry as the pandemic                             considerably better than those reported during prior
continues into 2021. Even after vaccinations are                                    recessions, partly because of government support
dispensed broadly across the population, the recovery for                           extended during the year.
some of the most affected industries remains uncertain.

2
 The unemployment rate as measured by the Bureau of Labor Statistics based on the Current Population Survey reached the highest level since record collection
began in 1948.

                                                                                                                                       2021 Risk Review | 3
Key Risks to Banks
FDIC-insured institutions faced a challenging landscape    • Consumer Debt: Conditions for consumers
in 2020. Federal support programs cushioned the              deteriorated with the onset of the pandemic
nation’s economy and muted the effects of the                as business closures contributed to double-
pandemic on the banking industry, but close monitoring       digit unemployment. Government programs
of key risks remains essential. The discussion of            have helped support household balance sheets
risks in this report is organized by topic and ordered       and consumer loan performance during the
alphabetically, not by level of risk.                        pandemic. Consumer loan volumes fell in 2020
                                                             as households pulled back on spending and used
Credit Risk: Banks are exposed to an array of credit         savings to reduce outstanding loan balances. While
risks. In 2020, these risks intensified as the economic      government support and improving economic
contraction unfolded. Banks remained relatively              conditions have helped consumers stay current on
resilient partly because of government support               their loans, the outlook for consumer asset quality
extended to businesses and consumers most affected           remains uncertain. An improving economy may
by the recession. However, institutions with elevated        result in stronger consumer loan performance and
levels of credit exposure to affected sectors are            increased consumer lending opportunities.
potentially more vulnerable to market disruptions and
could present risk management challenges.                  • Energy: The energy market deteriorated sharply
                                                             in 2020, but banks with exposure to lending in this
   • Agriculture: The agriculture industry withstood         sector remain resilient. Energy demand declined
     the volatile 2020 marketplace with the help             worldwide with the onset of the pandemic,
     of record levels of government assistance and           causing energy prices to plunge. The market had
     a rebound in commodity prices. As a result,             already experienced substantial oversupply from
     agriculture bank conditions were sound as               a production policy impasse within the OPEC+
     2020 came to a close. Strong farmland equity            coalition and near-record U.S. production. After
     has enabled farmers to restructure loans to             falling in early 2020, oil prices improved during
     manage operating losses and replenish working           the second half of the year as supply and demand
     capital. Asset quality at farm banks remains            imbalances improved. Oil and gas producers
     favorable. Net farm income in 2021 is expected          continue to face many challenges. Poor operational
     to decline from last year but remain higher than        performance and escalating environmental, social,
     historical levels.                                      and governmental risks contributed to capital
                                                             scarcity for producers. Banks with significant
   • Commercial Real Estate: The pandemic
                                                             exposure to the energy market have shown
     challenged commercial real estate (CRE) market
                                                             resilience to these challenges.
     conditions in 2020. Conditions weakened sharply
     in lodging and retail sectors at the pandemic’s       • Housing: Housing activity recovered strongly
     onset, and other property sectors face uncertainty.     in 2020. After housing sales and starts
     Increased use of remote work and potential shifts       deteriorated immediately after the onset of the
     in behavior and preferences could influence the         pandemic, conditions recovered strongly during
     CRE outlook. The volume of CRE loans held by            the rest of 2020. Low interest rates, increased
     FDIC-insured institutions reached a record high         demand to accommodate remote work, and a
     at year-end 2020. Acquisition, development, and         limited supply of homes contributed to record
     construction loans—historically, a riskier category     home price increases in 2020. Banks have benefited
     of CRE loans—grew slightly in 2020 but were             from increased housing market activity with slightly
     nearly 40 percent below the 2008 peak. Among            higher lending volumes and strong refinancing
     FDIC-insured institutions, CRE loan performance         activity, although loan performance metrics of
     metrics remain at manageable levels as loan             1–4 family residential mortgages at FDIC-insured
     accommodations have become part of the lending          institutions weakened slightly in 2020.
     landscape.

4 | 2021 Risk Review
• Leveraged Lending and Corporate Debt: closures and bankruptcies did not translate into
Corporate debt markets experienced disruptions credit deterioration in 2020. While asset quality
early in the pandemic, but Federal Reserve remains at manageable levels, the long-term effect
actions helped to restore stability to bond and of the pandemic on small business asset quality
leveraged loan markets. Corporate debt levels is uncertain and remains an important source of
were elevated before the pandemic and increased credit risk for banks.
further in 2020 as bond issuance surged, pushing
corporate debt-to-GDP to an all-time high as the Market Risk: The low interest rate environment
level of corporate debt rose and GDP declined. presents earnings challenges to banks. However, bank
Banks remain exposed to risks in corporate debt liquidity positions remain strong as deposits grew
markets through direct loans and lines of credit rapidly in 2020. Uncertainty in the economy, coupled
to corporations, holdings of collateralized loan with a sudden rise in deposits, led many community
obligations, and participation in the arranging banks to allocate a higher percentage of assets to
of leveraged loans and corporate bonds, as well readily available liquidity sources. Community bank
as indirect macroeconomic effects of corporate reliance on wholesale funding decreased as deposits
debt distress on other loan portfolios. Banks with rose.
concentrations in loans to firms in especially hard-
• Interest Rate Risk and Net Interest Margin: The
hit industries could face elevated credit losses as
low interest rate environment continues to
those firms struggle to recover from the pandemic.
pressure banking sector profitability. The net
• Nonbank Financial Institution Lending: Bank interest margin reached a record low as asset
exposure to nonbank lenders increased yields declined more than funding costs. The
significantly in 2020, particularly in mortgage ratio of loans to total assets also declined for
lending. Nonbank financial institutions relied on community and noncommunity banks in 2020, as
bank lending amid the uncertainty at the onset strong deposit inflows exceeded loan demand.
of the pandemic. Most of the lending to nonbank Community banks face interest rate risk challenges
financial institutions occurs at the largest banks, in a low interest rate and tepid loan environment.
but some community banks are a source of lending
• Liquidity and Deposits: Banks entered 2020 with
to nonbank mortgage lenders. The growth in
strong liquidity, and deposit growth during the
banking sector exposure to nonbank financial
year further increased liquidity levels. Deposits
institutions in 2020 increased the industry’s
surged during the pandemic, as consumers and
vulnerability to risks from nonbanks and their
businesses responded to uncertainty by stockpiling
lending activities.
cash. Federal programs created to mitigate
• Small Business Lending: Small business economic stress contributed to unprecedented
conditions weakened significantly at the onset deposit growth. Increased on-balance sheet
of the pandemic as stay-at-home orders and liquidity reduced many community banks’ reliance
changing consumer behavior reduced economic on wholesale funding. While industry liquidity
activity. However, small business lending improved last year, sudden changes in depositor
increased in 2020 primarily because of bank behavior as pandemic conditions evolve warrant
participation in the PPP. Further, small business monitoring.
2021 Risk Review | 5PAGE INTENTIONALLY LEFT BLANK 6 | 2021 Risk Review
Section II: Economic, Financial
Markets, and Banking Industry
Overview

Economy
      • The U.S. economy entered a recession in February 2020 as the pandemic caused a historic decline in economic
        activity.
      • Labor markets deteriorated significantly in 2020 and remained weak despite the recovery that began in the
        second half of the year.
      • Throughout 2020, substantial fiscal and monetary policy measures were enacted to support consumers and
        businesses.
      • Conditions remain weak for many service industries including restaurants, retail, entertainment, travel and
        tourism, and other discretionary services that are not essential or do not allow for remote work.

The economy entered a recession in February 2020 as                                     activity was swift, severe, and broad-based. U.S. real
the onset of the pandemic halted economic activity.                                     gross domestic product (GDP) contracted 5.0 percent in
The economy started 2020 in a period of record-long                                     first quarter and continued to decline at a 31.4 percent
expansion. The expansion ended abruptly with the                                        annualized rate in second quarter, the sharpest decline
onset of the pandemic and related restrictions on                                       on record (Chart 1).3 The economic contraction was
business and consumers. The decline in economic                                         widespread across sectors (Chart 2).

Chart 1                                                                                 Chart 2
    Gross Domestic Product Declined in 2020 but Is                                        The Pandemic Affected All GDP Sectors in 2020
    Forecast to Recover in 2021
     Real U.S. Gross Domestic Product                                                     Contribution to Change in GDP
     Quarterly percent change at annual rate                                              Percent
                                                                                          50
     40                                Average Growth Rate
                                       1980–2006: 3.1 percent    Blue Chip                40
     30                                2007–2019: 1.8 percent    Consensus                30
     20                                                           Forecast
                                                                                          20
     10                                                                                   10
      0                                                                                       0

    -10                                                                                   -10
                                                                                                                                               Consumption
                                                                                          -20                                                  Business Investment
    -20
                                                                                          -30                                                  Government
    -30                                                                                                                                        Exports
                                                                                          -40                                                  Imports
    -40                                                                                   -50                                                  Real Change in GDP
       2014    2015    2016     2017     2018    2019    2020   2021    2022                         Q1                Q2                Q3                Q4

    Sources: Bureau of Economic Analysis (Haver Analytics), Blue Chip Forecasts           Source: Bureau of Economic Analysis (Haver Analytics).
    (January 2021), and FDIC.

3
    Quarterly GDP growth rates are expressed as a real seasonally adjusted annualized rate.

                                                                                                                                              2021 Risk Review | 7
Containment efforts related to the pandemic The unemployment rate reached new highs in 2020,
contributed to declines in business and consumer and employment prospects for key service sectors
spending. Both imports and exports declined in remain weak. The unemployment rate increased
2020 as domestic consumption and global trade fell. rapidly from 3.5 percent in February, the lowest
Government spending at the federal level supported level in decades, to 14.8 percent in April, the highest
the economy but declined at the state and local levels unemployment rate since the Great Depression (Chart 3).
because of increasing budgetary pressures. Initial unemployment insurance claims rose by more
than one million, well above the previous recorded
The economy began to slowly reopen in May and June. peak. The partial reopening of the economy caused the
GDP grew by 33.4 percent in third quarter, recovering unemployment rate to retreat from its record highs,
roughly two-thirds of the contraction in the first half of but labor market improvement moderated during the
the year. Economic activity moderated in fourth quarter second half of the year. The unemployment rate at the
as the initial impact of reopening waned and resurgence end of 2020 was 6.7 percent.
of the pandemic resulted in tighter restrictions in some
states. GDP grew by 4.0 percent in fourth quarter, well While more than half of the jobs lost in March and April
below the record third quarter pace. were recovered by year end, job growth was uneven
across industries. Employment in industries that require
The economic recovery has been uneven across sectors, face-to-face interaction with customers, jobs that cannot
in a pattern that is atypical of recessions. While all be performed remotely, and jobs related to discretionary
sectors were initially hit hard during the onset of the and leisure activities had the largest losses and
pandemic, goods-producing sectors have recovered recovered the slowest (Chart 4). Leisure and hospitality—
relatively quickly and service sectors have lagged. primarily restaurants and drinking establishments—have
Traditionally, the services portion of consumption is been especially hard hit as consumers reduced such
less affected by downturns, but the unique nature activities and many state and local orders limited the
of this pandemic-driven recession has hit this sector operating capacity of these establishments through the
particularly hard. Goods-producing sectors have end of 2020 and into early 2021. Government job losses
benefited from consumer and business spending related have been elevated and have been concentrated at the
to the transition to a remote work environment. state and local level as states contend with tight budgets
from greater spending and lower tax revenue from the
decline in economic activity. Job losses in education
Chart 3
The Unemployment Rate Reached New Highs in 2020 but Has Begun to
Recover
Civilian Unemployment Rate
Percent
25
Unemployed+
20
Marginally Attached+
Part Time for
15 Economic Reasons
(Top Line)
10
5
Unemployment Rate
(Bottom Line)
0
1984 1987 1990 1993 1996 1999 2002 2005 2008 2011 2014 2017 2020
Source: Bureau of Labor Statistics (Haver Analytics).
Note: Shaded areas indicate recessions.
8 | 2021 Risk Reviewand healthcare were affected by school closures and by economy. Monetary and fiscal policies were put in place
patients and providers forgoing nonemergency elective quickly to help combat the economic effects of the
services. pandemic on the economy. Congress passed stimulus
packages in March, April, and December that included
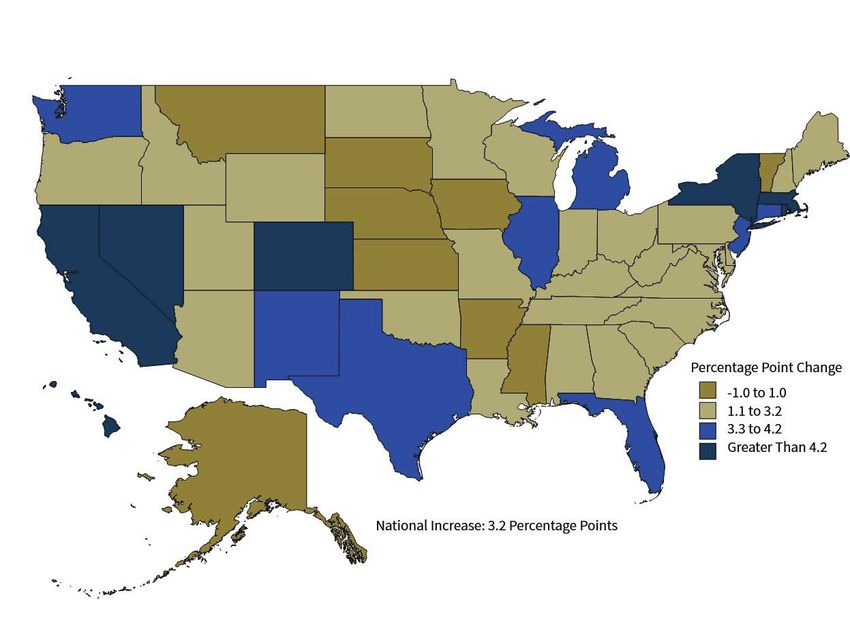
Individual states and regions have faced uneven several major components to help households and
economic conditions owing to the spread of COVID-19 businesses. Support to households included two rounds
and the nature of public health orders.4 As the virus
first halted economic activity in the United States in Chart 4
March 2020, some states enacted stay-at-home orders
Job Losses Were Uneven Across Industries
sooner and with tighter restrictions than other states.
Net Jobs Lost March to December 2020
Despite the recovery in the second half of the year, most
Thousands
states ended 2020 with higher unemployment rates than
Leisure & Hospitality
before the pandemic (Map 1). In addition, other factors Government
Education & Health
at the state and local level affected the magnitude of
Professional Services
the economic disruption and speed of reopening. States Manufacturing
Other Services
with a higher share of industries most affected by the Retail Trade
pandemic, such as leisure and hospitality, experienced Wholesale Trade
Information
larger increases in unemployment. The speed of states’ Construction
labor market recovery in the third and fourth quarters Transportation
Financial Activities
depended partly on when public health orders and other Mining
pandemic safeguards were lifted. Utilities
-4,500 -4,000 -3,500 -3,000 -2,500 -2,000 -1,500 -1,000 -500 0
Both the federal government and the Federal Reserve
Source: Bureau of Labor Statistics (Haver Analytics).
enacted fiscal and monetary policies to support the
Map 1
Unemployment Increased in Most States but Unevenly
Percentage Point Change in Unemployment Rate
February to December 2020
Percentage Point Change
-1.0 to 1.0
1.1 to 3.2
3.3 to 4.2
Greater than 4.2
National Increase: 3.2 Percentage Points
Source: Bureau of Labor Statistics (Haver Analytics).
4
For this analysis, regions are Census Regions and Divisions of the United States. See U.S. Census Bureau at https://www2.census.gov/geo/pdfs/maps-data/maps/
reference/us_regdiv.pdf.
2021 Risk Review | 9of direct stimulus payments to qualifying individuals, extended period, they may be forced to draw down their
expanded and extended unemployment insurance savings and prioritize certain expenditures, increasing
benefits, and new unemployment benefits that covered the risk of rising loan delinquency and default rates for
workers not traditionally covered by unemployment consumer loans and residential mortgages. In addition
insurance. Congress also put in place eviction moratoria to debt servicing issues, unemployment or uncertainty
and forbearance programs. Businesses benefited from about employment also reduces demand for new loans,
the creation of the PPP, which offered support in the limiting the prospects for new loans in the medium
form of loans. To extend the support to households term. Banks may also respond by tightening standards
and businesses, Congress passed additional rounds for loans, which would further reduce loan growth.
of stimulus in December 2020 and March 2021 that Fiscal stimulus in the form of government transfer
included an extension of unemployment benefits and payments, extended and enhanced unemployment
the PPP, among other measures. insurance benefits, forbearance programs, and eviction
moratoria supported unemployed consumers in 2020. In
The Federal Reserve also took expansive action fact, aggregate personal income increased in 2020.
implementing monetary policies to support financial
markets. The Federal Open Market Committee reduced Many businesses, especially small businesses, were
the federal funds rate to the zero lower bound in closed due to public health orders in 2020, increasing
two emergency meetings in March and signaled that risk to asset quality for banks. The unique nature of
rates will remain low until economic conditions have the pandemic-driven recession halted economic activity
recovered (Chart 5). broadly, harming businesses and individuals. Surveys on
business closures suggest that at the height of stay-at-
The Federal Reserve also restarted several emergency home orders in April, almost 50 percent of businesses
lending programs developed during the Great Recession were temporarily closed. While those numbers improved
and introduced new programs to support the economy. as the economy reopened, surveys suggest that more
While the take-up of the new facilities was modest, they than 20 percent of businesses remained closed at year-
helped support market confidence. end 2020, relative to a year earlier. Missed payments
on business loans increased across a wide range of
Weak labor market conditions pose risks to banks
industries during the early stages of the pandemic,
through potential asset quality deterioration. As
though delinquency rates have stabilized as parts of the
people are laid off from work, particularly for an
economy reopened and various federal programs were
Chart 5
The Federal Reserve Reduced the Federal Funds Rate in Support of the
Economy
Federal Funds Rate Target
Percent
9
8
7
6
5 Median Federal
4 Open Market
Committee
3 Projection
2
1
0
1990 1993 1996 1999 2002 2005 2008 2011 2014 2017 2020
Source: Federal Reserve (Haver Analytics).
Note: Shaded areas indicate recessions.
10 | 2021 Risk Reviewimplemented.5 The public health aspect of this recession The nation’s economic outlook may improve as more
may affect or reshape whole industries, creating more of the population becomes vaccinated, but economic
prolonged distress to banks that specialize in certain conditions remain uncertain and vary greatly across
types of loans. In addition, the economy re-entered sectors and geographies. The banking outlook should
a historically low interest rate environment that may improve with overall economic conditions, but
alter, at least temporarily, the composition of bank improvement in the banking outlook may be more
profitability but also may provide new channels for gradual than GDP growth or improvement in the
lending and banking services for large and community unemployment rate.
banks. These risks and challenges are discussed in more
detail later in this report.
5
For more information, see the U.S. Census Bureau Small Business Pulse Survey at https://www.census.gov/data/experimental-data-products/small-business-pulse-
survey.html.
2021 Risk Review | 11Financial Markets
• In March 2020, the onset of the COVID-19 pandemic severely disrupted financial markets; equity and corporate
bond markets saw sharp selloffs.
• Market conditions improved with the help of unprecedented federal support programs. Most markets fully
recovered by the end of 2020.
• Several key markets related to vulnerable industries, such as energy, remained below pre-pandemic highs.
• Corporate bond issuance set a record in 2020 as companies sought cash to ride out pandemic disruptions and
later took advantage of historically low interest rates.
In March 2020, severe financial market disruptions selling (in a “dash for cash”) caused yields to shoot
were calmed with the help of unprecedented Federal back up. One source of selling pressure was corporate
Reserve support. Prices in oil and equity markets bond funds. Outflows from corporate bond funds
declined sharply in late February and early March, as compelled those funds to sell Treasury securities they
these markets were among the first to anticipate the held as liquidity buffers. The selloff was exacerbated
material effects that the pandemic would have on the by hedge funds that were buying Treasuries but were
economy. Corporate investment grade and high-yield forced to sell after reaching stop-loss limits. During the
bond markets as well as municipal bonds subsequently selloff, Treasury bid/ask spreads widened and liquidity
experienced a rapid selloff. Market liquidity deteriorated deteriorated.
as transaction costs increased and some securities
dealers pulled back from making markets. Financial markets stabilized in the days after the Federal
Reserve dropped its target federal funds rate to near
One of the most concerning disruptions in the market zero and pledged to purchase at least $500 billion of U.S.
selloff was the volatility of Treasury securities, critical Treasuries. The Federal Reserve followed through on
benchmarks for financial assets. Treasury yields fell that pledge, purchasing Treasury and agency securities
rapidly at the onset of the pandemic before forced at an unprecedented rate (Chart 6).
Chart 6
The Federal Reserve’s Balance Sheet Expanded More Rapidly in 2020 Than
in 2008
Federal Reserve Balance Sheet Assets
$ Trillions
The Federal Reserve’s balance sheet
8 grew by $2.5 trillion in two months.
7 Total Assets
Securities Held Outright
6 All Liquidity Facilities
Support for Specific Institutions
5
4
3
2 The Federal Reserve’s liquidity facilities enhanced
confidence and helped stabilize markets, despite seeing less
1 usage than the facilities in effect during the Great Recession.
0
2007 2008 2009 2010 2011 2012 2013 2014 2015 2016 2017 2018 2019 2020
Source: Federal Reserve.
Note: All Liquidity Facilities includes Term Auction credit, primary credit, secondary credit, seasonal credit,
Primary Dealer Credit Facility, Asset-Backed Commercial Paper Money Market Mutual Fund Liquidity Facility,
Term Asset-Backed Securities Loan Facility, Commercial Paper Funding Facility, Money Market Mutual Fund
Liquidity Facility, and central bank liquidity swaps.
12 | 2021 Risk ReviewBeginning in late March through early April, the Federal The yield curve steepened throughout 2020. The
Reserve increased its market support by unveiling difference between the 10-year Treasury yield and the
11 emergency lending programs.6 These backstop 2-year Treasury yield, a commonly cited measure of the
programs contributed to lower interest rates and yield curve, more than doubled from 34 basis points at
borrowing costs in corporate bond, securities, and the beginning of 2020 to 80 basis points at the end of
other markets, despite limited usage. These programs 2020. Another measure of the yield curve, the difference
also served to stabilize financial markets by providing between 30-year and 5-year Treasury yields, increased
liquidity during a period of heightened uncertainty. The from 70 to 129 basis points by the end of 2020. Early in
Federal Reserve aided the recovery of financial markets the year, the yield-curve steepened as the decline in
throughout the rest of 2020 by setting expectations for short-term interest rates outpaced the decline in long-
maintaining an accommodative stance—both in terms of term rates. During the last five months of 2020 (and into
rates and asset purchases—into the foreseeable future. 2021), the yield curve saw additional steepening as long-
term interest rates rose and short-term rates remained
After touching all-time lows in August 2020, near zero.
benchmark interest rates started on an upward
trajectory that continued through the end of the Stabilizing debt markets and historically low yields led
year and into 2021. The 10-year Treasury yield to a record amount of investment grade and high-yield
fluctuated considerably in March with the heightened corporate bond issuance in 2020. During the March
uncertainty at the onset of the pandemic, including 2020 market stress, corporate bond spreads widened
setting an all-time low of 0.54 percent on March 9, dramatically. For example, the additional yield investors
2020. The benchmark rate reached a new record low of required for BBB-rated corporate bonds relative to
0.52 percent on August 4, 2020, amid renewed concerns Treasury bonds neared 5 percent at one point, up from
about the economic outlook. The August low marked 1.3 percent at the start of the year.7 After the introduction
the beginning of a period of rising rates, as investors of Federal Reserve support, corporate bond spreads
looked more optimistically toward a post-COVID-19 gradually declined from March highs and reached pre-
recovery. By year end, the yield on the 10-year Treasury pandemic levels by the end of the year. The combination
had increased to 0.93 percent from its August low as of low benchmark rates and declining spreads resulted
prospects for the recovery improved (Chart 7). in historically low borrowing rates. Several offerings
Chart 7
After a Period of Volatility in March, the 10-Year Treasury Yield Ended the
Year on an Upward Trajectory
Yield
Percent
2.0 10-Year Treasury Yield
1.8
The 10-Year Treasury yield
1.6
experienced volatility in March.
1.4 The 10-Year Treasury yield ended
1.2 the year on an upward trajectory.
1.0
0.8
0.6
0.4
2-Year Treasury Yield
0.2
0.0
Jan-2020 Mar-2020 May-2020 Jul-2020 Sep-2020 Nov-2020 Jan-2021
Source: Federal Reserve Board (Federal Reserve Economic Data).
6
For more information on the Federal Reserve’s funding, credit, liquidity, and loan facilities, see https://www.federalreserve.gov/funding-credit-liquidity-and-loan-
facilities.htm.
7
BBB-rated bonds are the lowest-rated bonds considered investment grade and also make up the largest segment of investment grade bonds.
2021 Risk Review | 13from highly rated companies ranked among the lowest- the year. Overall, the stock market performed well in
coupon corporate issuances ever. 2020. The Standard and Poor’s (S&P) 500 Index finished
the year up 16.3 percent, and the Dow Jones Industrial
Companies responded to the low-rate environment by Average finished up 7.3 percent. But this period was
issuing $2.3 trillion in corporate bonds, the most ever in characterized by market movements responding to
a year (Chart 8). The 2020 issuance was 60 percent above pandemic developments throughout 2020.
the 2019 level, despite slowing issuance at the end of the
year. The largest increase was from investment grade After falling as much as 34 percent from its peak, the
issuers, but high-yield issuance also rose, up 51 percent S&P 500 Index rose largely on the performance of its five
from 2019. While companies benefited by locking in low largest constituent companies. The companies were
rates, the continued rise in corporate debt levels makes predominately technology providers whose business
bond issuers vulnerable to the risk of refinancing at models performed well during the pandemic. By July,
higher interest rates. the top five stocks accounted for 22 percent of S&P 500
Index market capitalization, a record dating back to at
The municipal bond market also saw record issuance least 1980. Technology stocks generally performed well
in 2020 with an upward trend in taxable debt as a in 2020, in part because demand for those companies’
share of total municipal bonds. Like corporate bond products increased sharply in the remote work world.
spreads, municipal spreads widened in March and Historically low benchmark rates also helped propel the
narrowed following the Federal Reserve’s market NASDAQ Composite to a 43.6 percent return for the year.
support. Faced with low borrowing rates, municipalities
set a record for issuance in 2020 with $476 billion in News of vaccine developments in the latter part of
offerings. Taxable bond issuance more than doubled in the year contributed to strong performance of smaller
2020, while non-taxable bond issuance decreased. As stocks, as investors anticipated a recovery for companies
a share of total municipal issuance, taxable debt rose affected by the pandemic. The Russell 2000, a small-
to 31 percent in 2020 from 17 percent in 2019 and just cap index, had the best quarter in its history in fourth
8 percent in 2018. Low interest rates have allowed cities quarter 2020 with a return of 31.4 percent.8
and states to refinance older tax-exempt debt, replacing
the older debt with lower-coupon taxable bonds. Bank stocks underperformed in 2020. The KBW Bank
Index, which includes 24 of the largest U.S. banking
The pandemic and related government actions had a organizations, fell 13.6 percent in 2020. The broader S&P
large impact on equity market movements throughout 500 Financials sector was the third-worst performer
Chart 8
Corporate Bond Issuance Jumped in 2020
Corporate Bond Issuance
$ Trillions
2.5
Corporate bond issuance
2.0
increased by 60% over 2019.
High-Yield Investment Grade
1.5
1.0
0.5
0.0
2012 2013 2014 2015 2016 2017 2018 2019 2020
Source: Securities Industry and Financial Markets Association.
8
The full-year 2020 return for the Russell 2000 was 20.0 percent.
14 | 2021 Risk Reviewout of 11 sectors, falling 4.1 percent. Bank stock could not shut off supply fast enough and oil storage
underperformance reflected the weak outlook for banks began to reach capacity. The supply and demand
that persisted for much of 2020. However, this outlook mismatch became so extreme in April that the price of
improved at the end of the year on rising long-term oil, as measured by the West Texas Intermediate futures
interest rates, and bank stocks recovered some ground contract, briefly turned negative (Chart 9).
in early 2021.
While other markets rebounded strongly, oil prices did
The VIX, a frequently cited measure of expected not fully recover in 2020. The S&P 500 Energy sector
volatility, remained elevated for the last ten months dropped 37.3 percent in 2020 despite an overall increase
of 2020. The Chicago Board Options Exchange Volatility in the S&P 500 of 16.3 percent.
Index (VIX) jumped in March to more than six times its
level at the start of the year and reached its highest mark By year end, financial market conditions were stable
since 2008 and the highest end-of-day reading ever. As with strong price gains in many markets, particularly
market strains eased, the VIX fell but remained elevated corporates and equities. Financial market conditions
for the rest of 2020.9 It is somewhat unusual for the VIX reflected the improved economic conditions and
to remain elevated while equities perform well, as they outlook. Investor risk appetite returned and markets’
did the last three quarters of 2020. risky assets, including high-yield corporate bonds,
recovered. While financial market conditions have
Oil companies were some of the hardest hit by the improved significantly, they remain sensitive to
pandemic. Demand for oil dropped precipitously in developments related to the pandemic. Significant
the spring as businesses closed and people worldwide volatility and shifts in interest rates may pose challenges
stayed home to combat the pandemic. Oil producers to the banking sector.
Chart 9
In April, Oil Prices Turned Negative for the First Time in History
Crude Oil Price, West Texas Intermediate
$ Per barrel
80
60
40
20
0
Mar-2020 May-2020 Jul-2020 Sep-2020 Nov-2020
-20
-40
-60
Source: U.S. Energy Information Administration (Federal Reserve Economic Data).
Note: Data are from January 2020 through December 2020.
9
The VIX did not close below 20 during the last ten months of 2020 compared to a long-term historical average of about 19 coming into the year.
2021 Risk Review | 15Banking Industry
• The COVID-19 pandemic introduced new challenges to the banking industry.
• FDIC-insured institutions reported lower net income in 2020 compared with 2019, primarily because of higher
provision expense and lower net interest income.
• Deposits surged in 2020 on economic uncertainty and increased savings by consumers.
• The aggregate banking industry loan portfolio grew in 2020 owing to an increase in commercial and industrial
(C&I) loans, which included PPP loan originations.
• Asset quality indicators deteriorated modestly in 2020 but remained strong partly because of government
assistance for borrowers.
The COVID-19 pandemic introduced new challenges. asset quality metrics. Total bank equity capital grew
When mandatory stay-at-home orders were put in place 5.4 percent in 2020 and reached the highest level on
at the onset of the pandemic, banks had to quickly adapt record. Common equity tier 1 capital grew 7.5 percent,
to provide and maintain an acceptable level of customer increasing resiliency to sustain potential losses in the
service while limiting branch access. Banks pivoted to future. As of December 31, the FDIC’s “Problem Bank
remote access to banking services through online and List” included 56 institutions, well below the crisis peak
mobile applications, and many banks shifted employees of 888 in 2011. Only four banks failed in 2020.
to remote work to ensure their safety. To safeguard the
security and privacy of customer information, some The banking industry reported net income of
banks built out telecommunications infrastructures, $147.9 billion in 2020, down 36.5 percent from a year
increased Internet capacity in data centers, and enhanced earlier. The decline in banking industry net income
application portfolios to enhance remote productivity. was largely due to higher provisions for loan and
lease losses reflecting economic concerns due to the
Despite changes in the operating environment and pandemic and partially due to the implementation of
challenges presented by the pandemic, the banking the Current Expected Credit Losses (CECL) accounting
industry continued to report positive financial standard that requires estimating credit allowances for
performance and strong capital levels in 2020. The the life of a loan. Insured institutions reported $132.2
5,001 FDIC-insured financial institutions benefited from billion in provisions in 2020, up $77.1 billion from
positive net income, robust deposit growth, and strong 2019 (Chart 10). The increase in provisions, however,
Chart 10
Increase in Provision Expense Drove Decrease in Net Income
Annual Change
$ Billions
100
80 77.1
60
40 32.0
20 15.9
4.2
0
-20
-20.0 -24.5
-40
-60
-80
-100 -84.9
Net Interest Noninterest Provision Noninterest Securities Applicable Net Income
Income Income Expense Expense Gains Income
(Losses) Taxes
Source: FDIC.
Note: Annual data as of fourth quarter 2020.
16 | 2021 Risk Reviewwas largely concentrated in the first half of the year. Noninterest income rose 6 percent to $280.2 billion from
Faced with much uncertainty and concerns due to the a year earlier, largely due to an 89.3 percent increase
pandemic, government-issued lockdowns, and increase in net gains on loan sales as record low mortgage rates
in unemployment, banks reserved $114.3 billion in the coupled with a strong demand for larger homes boosted
first half of the year. As the economic outlook improved housing sales and refinances. Noninterest expense rose
and progress was made in developing a vaccine, banks 6.9 percent to $498.2 billion in 2020, primarily because of
released their provision expenses in the latter half of salary and employee benefits expenses.
the year. In fourth quarter 2020, net provision expenses
declined to $3.5 billion, the lowest quarterly level since The banking industry saw unprecedented deposit
second quarter 1995. growth in 2020 as increased economic and market
uncertainty shifted consumer and business spending
Interest rate cuts in the first half of 2020 pressured yields and saving behavior. Expanded monetary policy,
on earning assets. Net interest income decreased by coupled with government assistance and support
3.7 percent in 2020 to $526.6 billion. Annual net interest programs, including stimulus and unemployment
margin (NIM) for the industry fell to 2.82 percent, down payments and the PPP, bolstered cash for consumers
53 basis points from year-end 2019 (Chart 11). This and businesses, which further supported deposit
was the lowest annual NIM since year-end 1984, when growth and personal savings. Total deposits increased
data collection began. Continued low interest rates $3.3 trillion, or 22.6 percent, in 2020, the largest annual
and ensuing NIM compression may pose earnings and growth since 1984 (Chart 12). The influx of cash resulted
liquidity challenges for some institutions, particularly in increased balance sheet liquidity and decreased
those that rely heavily on interest income. reliance on wholesale funding. Community banks
mirrored the industry’s deposit growth, reporting a
As of December 31, 2020, community banks reported $330.5 billion (18.4 percent) increase in deposits during
an annual NIM of 3.39 percent, the lowest since year- the year.
end 1988. Relative to the banking industry as a whole,
community bank NIM benefited from higher yields The growth in deposits resulted in a large increase in
from holding more long-term earning assets. While assets, which led to a lower return on assets ratio (ROA)
this helped community banks in 2020, it may present in 2020. Assets grew $3.2 trillion (17.4 percent) in 2020,
challenges going forward as assets mature and begin to well above the 2008 to 2019 average of 3.1 percent.
reprice at lower yields. Much of the growth was in low-yielding assets. Cash and
balances due from depository institutions increased $1.5
Chart 11
Net Interest Margin Hit a Record Low
Net Interest Margin
Percent
4.00 Community Banks (3.39 percent)
Industry (2.82 percent)
3.75
3.50
3.25
3.00
2.75
2.50
2008 2009 2010 2011 2012 2013 2014 2015 2016 2017 2018 2019 2020
Source: FDIC.
Note: Data as of fourth quarter 2020.
2021 Risk Review | 17trillion (91.2 percent), while securities grew $1.1 trillion by a $232.8 billion increase in C&I loans as businesses
(28.4 percent) in 2020. Net loans and leases increased drew down credit lines as a precautionary measure
by a modest 2.2 percent. The annual ROA ratio for the to support liquidity and as banks provided PPP
industry fell to 0.72 percent at year-end 2020, 57 basis loans. Excluding PPP loans, total C&I loans would
points lower than year-end 2019. Community banks have contracted by nearly 8 percent in 2020. At the
reported a more modest decline in the ROA ratio to end of fourth quarter 2020, 83 percent of all banks
1.09 percent, 10 basis points below year-end 2019. This and 84 percent of community banks held PPP loans
was the first year since 2008 that the community bank totaling $407 billion. Growth in nonfarm nonresidential
ROA ratio surpassed the industry (Chart 13). properties (up $52.4 billion) and construction and
development loans (up $24.3 billion) also contributed
Banking industry loan growth was primarily driven to net loan growth (Chart 14). Due to increased saving
by rapid growth in the C&I loan portfolio in 2020. and reduced spending stemming from stay-at-home
Total loans increased $345 billion during the year, led restrictions and behavioral changes from the pandemic,
Chart 12
Annual Deposit Growth Reached a Record High
Deposits Deposit Growth
$ Billions Percent
3,500 Industry Annual Change in Total Deposits (Left Axis) 35
3,000 Industry Annual Deposit Growth (Right Axis) 30
Community Bank Annual Deposit Growth (Right Axis)
2,500 25
2,000 20
1,500 15
1,000 10
500 5
0 0
-500 -5
2008 2009 2010 2011 2012 2013 2014 2015 2016 2017 2018 2019 2020
Source: FDIC.
Note: Data as of fourth quarter 2020.
Chart 13
The Return on Assets Ratio Declined as Assets Grew in 2020
Assets Return on Assets
$ Billions Percent
3,500
Annual Change in Assets (Left Axis)
3,000 Industry ROA Ratio (Right Axis) 1.5
2,500 Community Bank ROA Ratio (Right Axis)
2,000 1.0
1,500
1,000 0.5
500
0 0.0
-500
-1,000 -0.5
2008 2009 2010 2011 2012 2013 2014 2015 2016 2017 2018 2019 2020
Source: FDIC.
Note: Data as of fourth quarter 2020.
18 | 2021 Risk Reviewloans to individuals declined $93.3 billion (5.1 percent), end 2010 (Chart 15). Community banks also reported
led by a $119.5 billion (12.7 percent) decrease in credit modest asset quality deterioration in 2020, but the
card loans, the highest fourth quarter year-over-year noncurrent rate of 0.77 percent and the charge-off rate
reduction in both categories since 1985. of 0.12 percent remained below the industry overall. The
industry’s coverage ratio, which compares the amount
Despite modest deterioration, asset quality indicators of loan-loss reserves to noncurrent loans, jumped to
remained relatively strong at year-end 2020. As of 184.1 percent in 2020 (up 54.2 percent from 2019) owing
December 31, 2020, the noncurrent loan rate for the to the significant increase in provisions for loan and
banking industry was 1.18 percent, up 28 basis points lease losses.
from year-end 2019 but well below the high of 5.44
reached in year-end 2009. The annual net charge-off rate Government assistance and forbearance programs
was 0.50 percent, down 2 basis points from year-end for some mortgages and student loans have helped
2019 and well below the high of 2.55 percent at year- to support asset quality during the pandemic. The
Chart 14
Commercial and Industrial Loans Led Loan Growth
12-Month Growth Rate
Percent
Total Loans & Leases
25 Commercial & Industrial
Construction & Development
20 Secured by 1–4 Family Residential Properties
Nonfarm Nonresidential Real Estate
Loans to Individuals
15
10
5
0
2015 2016 2017 2018 2019 2020
-5
Source: FDIC.
Note: Data as of fourth quarter 2020.
Chart 15
Asset Quality Indicators Remained Relatively Strong at Year-End 2020
Noncurrent and Net Charge-Off Rate Coverage Ratio
Percent Percent
6 200
Noncurrent Loan and Lease Rate (Left Axis)
175
5 Net Charge-Off Rate (Left Axis)
Coverage Ratio (Right Axis) 150
4
125
3 100
75
2
50
1
25
0 0
2008 2009 2010 2011 2012 2013 2014 2015 2016 2017 2018 2019 2020
Source: FDIC.
Note: Data as of fourth quarter 2020.
2021 Risk Review | 19PPP further supported small businesses by providing Net charter consolidation rate slightly decreased
potentially forgivable loans to cover eligible expenses. between 2019 and 2020 (Chart 17).11 The pandemic and
In addition, relief measures by federal banking challenging economic conditions could contribute to
regulators that have prevented loans from advancing to renewed consolidation and merger activity in the near
delinquency status have also helped to support asset term, particularly for banks already facing significant
quality at insured institutions.10 earnings pressure from low interest rates and a potential
increase in credit losses.
Consistent with pre-pandemic trends, branch
reductions continued in 2020 as banks leveraged Throughout 2020, the banking industry demonstrated
digital delivery channels and consumers embraced resilience despite continued economic challenges and
online banking. As of June 30, 2020, Summary of uncertainties relative to the COVID-19 pandemic. The
Deposits data showed there were 85,040 branches, next sections of this report explore the specific credit
down 1.6 percent from June 30, 2019 (Chart 16). and market risks that will continue to challenge the
Branches of community banks decreased at a higher rate banking industry in 2021.
of 2.7 percent.
Chart 16 Chart 17
The Number of Branches Steadily Declined Net Consolidation Rate Declined
Branches Net Consolidation Rate
Percent
100,000
5
80,000
4
60,000
3
Industry
Community Banks
40,000 2
20,000 1
0 0
2008 2009 2010 2011 2012 2013 2014 2015 2016 2017 2018 2019 2020 2008 2009 2010 2011 2012 2013 2014 2015 2016 2017 2018 2019 2020
Source: FDIC Summary of Deposits. Source: FDIC.
Note: Data as of June 30, 2020. Note: Data as of fourth quarter 2020.
10
See Interagency Statement on Loan Modifications and Reporting for Financial Institutions Working With Customers Affected by the Coronavirus, April 07, 2020, https://
www.federalreserve.gov/newsevents/pressreleases/files/bcreg20200407a1.pdf.
11
Net charter consolidation is the sum of the number of failures, intra-company consolidations, inter-company mergers, new charters, and other closings.
20 | 2021 Risk ReviewSection III: Key Risks to Banks
CREDIT RISK
Agriculture
• Agricultural producers weathered the volatile 2020 marketplace with the help of record levels of government
assistance and a rebound in commodity prices.
• Despite improving agricultural market fundamentals, net farm income is expected to decrease in 2021 from
last year because of lower direct government farm payments.
• Strong farmland equity has enabled farmers to restructure loans to manage operating losses and replenish
working capital, minimizing agricultural credit problems at insured institutions.
As of fourth quarter 2020, there were 1,163 farm banks comprising nearly one-quarter of all FDIC-insured
institutions. All but nine of these banks are also considered community banks by the FDIC’s definition (see
Glossary of Terms). In fourth quarter 2020, agricultural loans held by FDIC-insured institutions totaled $175
billion.
• Community banks hold 71 percent ($123 billion) of total agricultural loans.
• Twenty-five percent of farm banks (6 percent of all banks) hold a concentration of agricultural loans above
300 percent of capital (tier 1 capital and credit loss reserves for loans and leases).
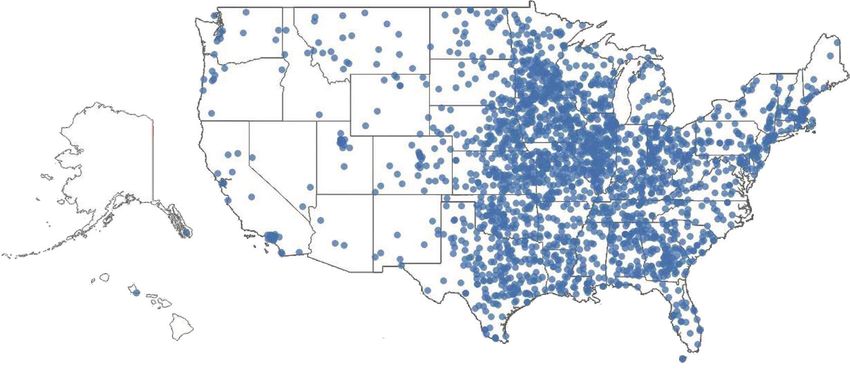
• Exposure to agricultural lending is concentrated in the Midwest.
Regional Exposure to Agricultural Lending
Dots on map represent banks with total agricultural loans above 300 percent of capital.
Source: FDIC.
2021 Risk Review | 21The agricultural industry encountered significant U.S. Department of Agriculture (USDA), net farm income,
volatility in 2020, but conditions improved by year a broad measure of profitability, reached $121.1 billion
end. The Phase 1 trade agreement between the United in 2020, an increase of 46 percent from the 2019 level
States and China, signed in early 2020, was expected (Chart 18).
to benefit the agricultural industry by reducing
uncertainty with one of the nation’s largest export Unprecedented levels of government assistance played
markets for agricultural products. Unfortunately, the a significant role in helping agricultural producers
COVID-19 pandemic quickly changed the landscape for withstand the volatile marketplace. Producers received
farmers. $32.4 billion in pandemic-related relief payments,
boosting total direct government payments in 2020
Initially, the pandemic-induced shutdowns caused to an all-time high $46.3 billion. Government payments
significant disruptions for U.S. agricultural producers accounted for 38.2 percent of net farm income in 2020,
as food demand and supply chains were disrupted. the largest percentage in more than 15 years.
Closures of schools and entertainment venues and
declines in restaurant dining and travel created a sudden A resurgence in export demand helped commodity
drop in commercial demand for food products. In some prices recover in the latter half of 2020. Since early 2018,
instances, such as in dairy and fresh produce, farmers U.S. agricultural producers have faced international
dumped their products because they had no buyers. trade challenges because of ongoing trade disputes with
COVID-19 outbreaks among workers at meat-processing key agricultural trading partners, including China. China
facilities across the country caused shutdowns that has emerged as one of the top export markets for U.S.
created processing bottlenecks and backlogs of agricultural goods. In the latter half of 2020, the level
market-ready cattle and hogs, forcing some growers to of exports to China increased significantly as China
euthanize animals. Ethanol production declined sharply continued to battle African swine fever, which has
as gasoline demand fell during the initial months of the decimated its pork production. During 2020, China’s
pandemic, dragging down corn prices. imports of U.S. pork increased 75 percent from the year
before.
Prospects improved in the second half of 2020. The
record level of government assistance and a rebound in Rebuilding of China’s hog herd also created a need
commodity prices largely due to rising exports combined for additional feed, resulting in strong imports of U.S.
to reverse pandemic-induced losses. According to the corn and soybeans. Corn exports to China reached
their second highest level in 2020, and soybean exports
Chart 18
Record Government Payments Helped Net Farm Income Recover
in 2020
Total Net Farm Income
$ Billions, nominal
140 Net Farm Income Minus Government Payments
123.7 Government Payments 121.1
120 111.4
100 92.2
81.7 81.3 83.1
80 75.1 74.9
112.7 62.3 86.1
60
82.5 60.7
70.9 63.6 67.6
40 49.3
20 46.3
22.4 25.3
11.0 9.8 10.8 13.0 11.5 13.7
0
2013 2014 2015 2016 2017 2018 2019 2020 2021F
Source: U.S. Department of Agriculture (Haver Analytics).
Note: F=USDA forecast data.
22 | 2021 Risk ReviewYou can also read