Dietary intake and FODMAP score in newly diagnosed patients with inflammatory bowel disease - DUO
←
→
Page content transcription
If your browser does not render page correctly, please read the page content below
Dietary intake and FODMAP score in
   newly diagnosed patients with
     inflammatory bowel disease
     Results from the IBSEN III cohort
           Master thesis by Marte Jerven

Supervisors: Christine Sommer and Monica H. Carlsen

    Department of Nutrition, Faculty of Medicine

             UNIVERSITY OF OSLO
                      May 2018
II
Dietary intake and FODMAP score in
   newly diagnosed patients with
     inflammatory bowel disease
     Results from the IBSEN III cohort
           Master thesis by Marte Jerven

Supervisors: Christine Sommer and Monica H. Carlsen

    Department of Nutrition, Faculty of Medicine

             UNIVERSITY OF OSLO
                      May 2018

                         III
© Marte Jerven 2018
Dietary intake and FODMAP score in newly diagnosed patients with inflammatory bowel
disease
Marte Jerven
http://www.duo.uio.no/
Print: Reprosentralen, University of Oslo
IVAbstract
Background and aim: Patients with inflammatory bowel disease (IBD), including Crohn`s
disease (CD) and Ulcerative Colitis (UC), are vulnerable to malnutrition and deficiency of
several micronutrients. Decreased dietary intake and avoidance of several foods are important
risk factors. Several patients struggles with symptoms, even when in remission. The majority
of the patients believe diet is important for the disease, and they are supported by increasing
literature. A diet low in FODMAPs seems to improve gastrointestinal symptoms, but we
know little of its impact on disease activity. We aimed to assess the dietary intake in
Norwegian IBD patients, and explore potential differences in dietary intakes between UC and
CD.
Method: In this project we included adult (≥18 years old), newly diagnosed IBD patients
enrolled in the IBSEN III cohort between 1st of January and 8th of December 2017. Data
collection on dietary intake was performed using a validated and comprehensive food
frequency questionnaire (FFQ). We developed a FODMAP score based on reported intakes of
FODMAP containing food items. We used self-reported disease activity scores to explore
associations with the FODMAP score.
Results: A total of 187 participants with CD and UC were included in the dietary analyses.
The dietary intakes of carbohydrates and vitamin D in both genders, fiber in men and iron and
folate in women of reproductive age were lower, and intake of saturated fats in both genders
were higher than recommended. Women with UC had a higher intake of alcohol and
vegetables compared to women with CD (p=0.004 and p=0.02). Among men, CD patients had
a higher intake of bread and meat (p=0.03 and p=0.02). The majority of foods known to
contain FODMAPs increased with higher FODMAP score. There were no differences in
FODMAP score with higher self-reported disease activity in CD or UC (p=0.51 and p=0.81).
Conclusion: The dietary intake in both UC and CD patients were largely in line with the
recommendations. Intakes of vitamin D in both genders and folate and iron in women of
reproductive age were lower than recommended, and status of these micronutrients should be
monitored. There were some differences in dietary intake between UC and CD, and these
differences are likely explained by dietary restrictions. The efficacy of the FODMAP score
was satisfying. To explore if dietary intake of FODMAPs is associated with disease activity,
future studies should use other outcome measures of disease activity.
VVI
Acknowledgement
First, I would like to thank my supervisors, Christine Sommer Dep. of Endocrinology, Morbid
Obesity and Preventive Medicine, Oslo University Hospital and Monica H. Carlsen Dep. of
nutrition, University of Oslo, for their professional feedback and guidance in this master
project. Christine, thank you for being available both on mail and telephone, supporting me
throughout the project, and for good advice on how to perform the statistical analyses. I am
grateful to Monica, who let me use her office and patiently helped me prepare the dataset
before analyses, and for making time for me whenever I had a question.

Further, I would like to thank the project leader in the IBSEN III cohort, Marte L. Hoivik, in
addition to several of her coworkers in the project, who has been very kind and including
towards me. Marte, I am sincerely thankful for you including me in your research team,
letting me attend the ECCO congress in Vienna, and for all of your help on the thesis. Thank
you, Elisabeth at Oslo University Hospital and Julie at Akershus University Hospital
including several gastroenterologists in these hospitals, for letting me observe consultations
and endoscopies providing me with important insights into the patient group.

Thank you, Trine M. Reine Dept. of nutrition, University of Oslo and stable-buddy, for
listening and giving me constructive feedback, and for being a friend in demanding periods.

Finally, I am grateful to all of my friends and my family, particularly my partner and my 3
year old son, for being social supports helping me stay positive.

Bærum, May 2018

Marte Jerven

                                              VII
VIII
Abbreviations
CD          Crohn’s disease

EEN         Exclusive enteral nutrition

FFQ         Food frequency questionnaire

FODMAP      Fermentable Oligo-, Di- and Monosaccharides And Polyols

FOS         Fructo-oligosaccharides

GOS         Galacto-oligosaccharides

HBI         Harvey Bradshaw index

IBD         Inflammatory bowel disease

IBS         Irritable bowel syndrome

NNR12       Nordic Nutrition Recommendations 2012

PMS         Partial Mayo score

SFA         Saturated fatty acids

UC          Ulcerative colitis

                              IX
List of tables and figures
Tables
Table 1: Constituents of FODMAP and common food sources
Table 2: Overview of micronutrients important in IBD
Table 3: Cut-off values for lactose content (g/portion)
Table 4: Components of the HBI and PMS used to calculate self-reported disease activity
scores
Table 5: Subject characteristics
Table 6: Intake of macronutrients in percent of total energy intake (E%)
Table 7: Intake per person of macro- and micronutrients (quantity/day)
Table 8: Dietary intakes in relation to recommendations and national dietary surveys, in
women
Table 9: Dietary intakes in relation to recommendations and national dietary surveys, in men
Table 10: Dietary intake per person of different food groups (g/day)
Table 11: Change in intake of different foods with higher FODMAP score
Table 12: FODMAP score in relation to self-reported disease activity in UC patients (n=115)
Table 13: FODMAP score in relation to self-reported disease activity in CD patients (n=68)
Figures
Figure 1: Overview of data collection in the IBSEN III cohort
Figure 2: Flowchart of sample used in the master project
XTable of contents
1 Introduction ...................................................................................................................... 1
1.1 Inflammatory bowel disease............................................................................................. 1
1.2 Diet and IBD .................................................................................................................... 3
1.2.1 Dietary prevention and risk factors of IBD ............................................................... 3
1.2.2 Dietary management of IBD ..................................................................................... 3
1.3 Dietary beliefs and self-imposed dietary restrictions ....................................................... 6
1.4 Nutritional status .............................................................................................................. 7
1.4.1 Micronutrient deficiency ........................................................................................... 7
1.4.2 Malnutrition ............................................................................................................... 9
2 Aim................................................................................................................................... 10
3 Methods ........................................................................................................................... 11
3.1 Study design ................................................................................................................... 11
3.2 Study population ............................................................................................................ 12
3.2.1 Ethics ....................................................................................................................... 14
3.3 Data Collection ............................................................................................................... 14
3.2.1 Dietary data (FFQ) .................................................................................................. 14
3.2.2 FODMAP score ....................................................................................................... 15
3.2.3 Background and clinical variables (IBSEN III) ...................................................... 17
3.3 Statistics ......................................................................................................................... 18
3.3.1 Statistical analyses................................................................................................... 18
3.3.2 Statistical power ...................................................................................................... 19
4 Results ............................................................................................................................. 20
4.1 Characteristics of study sample ...................................................................................... 21
4.2 Macro- and micronutrients ............................................................................................. 23
4.2.1 Dietary intakes in relation to recommendations and Norkost ................................. 26
4.3 Consume of different food groups ................................................................................. 29
4.4 FODMAP ....................................................................................................................... 30
4.4.1 Differences in total FODMAP score ....................................................................... 30
4.4.2 FODMAP score in tertiles for different food groups .............................................. 30
4.4.3 Self-reported disease activity at diagnosis .............................................................. 32
5 Discussion ........................................................................................................................ 33
XI5.1 Methodological considerations ...................................................................................... 33
5.1.1 Observational studies .............................................................................................. 33
5.1.2 Internal validity ....................................................................................................... 34
5.1.3 External validity ...................................................................................................... 39
5.2 Discussion of main findings ........................................................................................... 39
5.1.2 Macronutrients ........................................................................................................ 40
5.2.2 Micronutrients ......................................................................................................... 43
5.2.3 FODMAP score ....................................................................................................... 47
5.2.4 FODMAP and disease activity ................................................................................ 48
6 Conclusion ....................................................................................................................... 49
7 References ....................................................................................................................... 50
8 Appendix ......................................................................................................................... 60
XII1 Introduction
1.1 Inflammatory bowel disease
Inflammatory bowel disease (IBD) is a common term for two distinct conditions causing
chronic inflammation in the gastrointestinal tract; Crohn’s disease (CD) and Ulcerative Colitis
(UC). The distribution is approximately 1:3 and female domination in CD and 2:3 and male
domination in UC (1-4). While UC is confined to the colon, CD may affect the entire
gastrointestinal tract. Establishment of diagnosis is based on clinical evaluation including
symptoms and family history combined with endoscopy, imaging, histological and
biochemical parameters (5, 6). Furthermore, calprotectin measurements in feces, detected by
Norwegian scientists (7), may be useful to screen potential IBD patients and separating them
from more unspecific conditions like irritable bowel syndrome (IBS) (8).
The characteristic appearance of CD is focal or patchy discontinuous inflammation which
may extend beyond the mucosa in a transmural manner (5). On the other hand, inflammation
in UC is generally continuous and confined to the mucosa (6). CD seems to debut earlier than
UC, although both conditions most frequently develop in adolescence and early adulthood (3,
4). Usually, disease location stays reasonably unchanged for both CD and UC patients (5, 6).
About 50% of IBD patients report a disease course with an initial high activity at diagnosis,
followed by a more quiescent disease and less symptoms (9, 10). However, the inflammation
in UC may progress in extent, while penetrating and stricturing disease in CD patients may
evolve with time (9, 10). Mutual symptoms of both UC and CD, but perhaps signs of more
severe disease in UC, are abdominal pain, anorexia and fever (5, 6). Furthermore, patients
with UC often experience rectal bleeding or bloody diarrhea, tenesmus, urgency, nocturnal
defeceating, faecal incontinence and fatigue, while patients with CD often report chronic
diarrhea, weight loss and general discomfort. Surgery may be necessary, and more usual in
CD than UC (9, 10).
The etiology of IBD is not yet fully understood. Family history is an established risk factor, at
least in Caucasians and Hispanics (5, 11). Since the revolutionary finding in 2001 of the
NOD2 gene involved in CD susceptibility (12), >160 loci for IBD has been identified due to
modern gene technology (13). Furthermore, smoking is associated with increased risk for CD,
while cessation of smoking is associated with increased risk for UC (14). The leading theory
1is that IBD develop in genetic susceptible individuals because of an inappropriate immune
response to microbiota dysbiosis through interactions with environmental factors (15).
Epidemiologic studies of geographic differences in incidence and migration are useful in
providing clues on the role of environmental factors in IBD development (16-20).
Importantly, genetics seems to be emphasized in early debut of IBD, and environmental
factors in late debut, respectively (21). Together with many other suggested determinants (e.g.
hygiene, appendectomy, antibiotics), diet has been implicated in both IBD development and
disease course (15, 22).
The incidence of IBD has increased in the past decade (16, 23), although a recent systematic
review suggested a stabilization of incidence in the west, while the incidence continues to rise
in countries adapting to the western lifestyle (24, 25). A high incidence of IBD was reported
in Norway (1990-93). The mean annual incidence was 5.8 per 100 000 and 13.6 per 100 000
individuals, for CD and UC respectively (3, 4). Moreover, according to preliminary results
from the IBSEN III cohort, the incidence in Norway seems to have increased further (26).
IBD is associated with extensive health-care costs related to the use of medications,
hospitalization and work disability, representing a considerable burden to health systems and
social economy (27). Dietary interventions may therefore be a cost-effective treatment option,
and further research on diet used as treatment on IBD is warranted.
21.2 Diet and IBD
1.2.1 Dietary prevention and risk factors of IBD
Retrospective dietary collection is usual in epidemiologic studies, which makes it challenging
to elucidate dietary components or nutrients having protective or harmful impact on
development of IBD (28). The western diet high in fat including an unfavorable omega
6:omega 3 ratio, protein (animal-derived in particular), refined sugar and low in fibers from
fruit and vegetables has frequently been emphasized as risk factor for IBD (29, 30). There
seems to be convincing evidence of increased risk of IBD with high intake of total fat and a
high omega 6:omega 3 ratio, in addition to high intake of meat and sugar (15, 28, 30). Other
suggested dietary factors that might have a negative impact on IBD development, are salt and
different food additives (31-33), which needs further exploration. A diet rich in fruit and
vegetables and a favorable omega 6:omega 3 ratio, and possibly high intake of zink and
vitamin D, seems to be protective (15, 34), and is recommended in the newly published
ESPEN guidelines (35).
IBD patients have a host microbiome that differs from healthy controls (36). Dysbiosis is
important in IBD development, and scientist are trying to elucidate which factors contribute to
this imbalance in host microbiome (37). Diet influences the composition of the microbiome,
and a diet consisting of entirely animal compared to plant-based foods rapidly changed the
microbiome in light of different species colonizing the gut (38).
1.2.2 Dietary management of IBD
Currently, there is no recommended diet to treat active disease in IBD patients (35). Exclusive
enteral nutrition (EEN) is equally sufficient to corticosteroids in inducing remission in
pediatric CD (39), and is preferred as first-line therapy in children with CD (40). In adults,
EEN induced remission in 80% (41), but remain controversial mainly due to difficulties with
compliance (42). At present, EEN is not recommended to adults neither by ESPEN nor the
European Crohn’s and Colitis Organization (ECCO) (5, 35). Nevertheless, enteral nutrition is
an important accessory therapy to improve nutritional status or treat active disease in selected
cases with CD (5, 35). Two probiotics, VSL#3 and Escherichia coli Nissle 1917, are
recommended to induce remission and prevent relapse in UC (35, 43), but not in CD (5, 35).
3Extensive research on different diets that may improve the management of IBD are in
progress (e.g. the specific carbohydrate diet (SCD), omega-3 supplemented diet and
paleolithic diet), but with insufficient proof of efficacy at the time (35, 44). However, a diet
low in FODMAPs show promise as part of the management strategy due to its apparent ability
to ease functional gastrointestinal symptoms in IBD patients (45-51).
FODMAP
FODMAP (Fermentable Oligo-, Di- and Monosaccharides And Polyols) is a designation for
undigested and hence unabsorbed carbohydrates, which in the colon are fermented by host-
bacteria. In Table 1, we present the different constituents of FODMAP, and their most
common dietary sources. The concept of prebiotics was introduced in 1995 by Gibson et al
(52), and the definition recently updated: «a substrate that is selectively utilized by host
microorganisms conferring a health benefit» (53). Among prebiotics, fructo-oligosaccharides
(FOS) and inulin, and galacto-oligosaccharides (GOS) were the first recognized (52), and are
the most extensive studied (53). Both are important constituents of FODMAP (54).
Fructans: the terminology fructose and FOS may be confusing. Fructans include both FOS
and inulin, defined depending on degree of polymerization (DP). They are composed of
fructose and glucose (54). While FOS (DP 10) to improve texture and increase
fiber content in dietary products is expanding (54, 55).
GOS: composed of glucose, fructose and galactose and present in oligosaccharides with a DP
of 3-4 units (54). Fermentation of GOS by intestinal bacteria generally lead to gas-production
(54).
Lactose: A disaccharide broken down and absorbed in varying extent depending on the lactase
production in the small intestines (54).
Fructose: Ingested together with glucose in approximately equal amounts, or as a component
of sucrose, fructose is normally highly absorbed. Due to the facilitated fructose-transporter in
the small intestines, humans have the ability to absorb some free fructose, but in about 30%,
this capacity is limited (54). Thus, fructose in excess of glucose is available for fermentation
in the colon (54).
Polyols: Sugar alcohols unabsorbed by humans (54).
In 2005, Gibson and Shepherd proposed a hypothesis that excessive consumption of these
short-chain carbohydrates and polyols may lead to susceptibility to Crohn’s disease by
4impairing the epithelial barrier function (54). Later, researchers at the Monash University
developed the low FODMAP diet (56).
Table 1: Constituents of FODMAP and common food sources
FOOD COMPONENT DIETARY SOURCES
Fructose Fruits, honey, high fructose corn syrup
Lactose Milk and lactose-containing dairy products
Fructans Wheat, onions, food additive
GOS Legumes, certain beans, cabbage, onions
Polyols Apples, pears, plums, sweetener
GOS: Galacto-oligosaccharides
Functional gastrointestinal symptoms typically include bloating, wind, abdominal pain or
discomfort and diarrhea caused by water and or gas-production subsequently followed by
distension (56). The low FODMAP diet was developed by researchers at the Monash
University for individuals with IBS due to its symptom-lowering effect (57). The existence of
symptoms compatible with IBS in IBD is prevalent, particularly in CD patients, and included
nearly 40% in a previous meta-analysis (58). In a study conducted on Norwegian CD patients
in remission, they found that a strict elimination diet including common FODMAPs
significantly ameliorated IBS symptoms after only two weeks of intervention (59).
Furthermore, the elimination diet seemed to have a greater efficacy in patients with disease
located in the small intestines (59). Supportive for a diet low in FODMAP, are provocative
studies exploring the effects of FODMAP supplementation, and the subsequent increase of
symptoms in study-subjects (46, 49, 60). If the low FODMAP diet can demonstrate to be safe
and effective as a long-term management therapy, the self-coping, and thus quality of life in
IBD patients will likely improve.
51.3 Dietary beliefs and self-imposed dietary restrictions
Recently, a series of studies investigating IBD patients’ view of diet in IBD development and
management have been published (Appendix I). Between 16-48% of IBD patients believe
diet is an important risk factor for IBD development (61-63). Moreover, a range of 57-71%
thought diet trigger the disease, leading to exacerbated inflammation (61-64). According to
the majority of IBD patients, patients with CD in particular, diet is very important in
management of the disease, mostly to control and alleviate symptoms (62, 65-67).
Consequently, several patients reported modifying their diet post diagnosis (61, 62, 68). In
addition, 39% introduced changes before diagnosis due to annoying symptoms (69).
IBD patients have a reduced quality of life, and gastrointestinal symptoms exert an important
effect through increased psychological distress (70, 71). Due to symptoms, many IBD patients
avoid favorite foods, refuse to eat away from home and eat different than their family
affecting their social life (62, 63, 72). IBD patients desire advice from their caregivers, but in
many cases and in UC particular, half or less have been counselled by a dietitian (61-64, 68,
72).
Spicy foods, fatty foods, meat, dairy products, alcoholic beverages, soda, fiber-rich food
(including wholemeal products, fruit and vegetables), gas-producing foods (beans and
legumes), sugar, nuts, corn and coffee/tea are commonly restricted or avoided by IBD patients
(59, 61-65, 67-69, 72-75). Nearly every patient avoid at least one food in active disease (61,
73). CD patients in general, and those with stricturing disease particularly, impose more
restrictions in their diet compared to UC patients (61, 62, 73). In exacerbated periods, 52% of
the participants in a study preferred to follow a low residue diet (63).
61.4 Nutritional status
In the following sections we will describe common micronutrient deficiencies and
malnutrition in IBD patients. With malnutrition we refer to undernutrition, while deficiency
means an inadequate status of micronutrients.
1.4.1 Micronutrient deficiency
Micronutrient deficiency is quite prevalent in IBD (Table 2). Dietary status of micronutrients
depend on various factors including inadequate dietary intake, intestinal losses,
malabsorption, increased energy expenditure, drug interactions or failure to administer the
correct composited total parenteral nutrition (76). Development of deficiency with time
depends on disease progression, and is probably more common among the malnourished
patients (61). CD patients with small bowel involvement or previous resections in this area in
particular, are vulnerable to malabsorption of B12 and fat-soluble vitamins (76).
Table 2: Overview of micronutrients important in IBD
Micronutrient Prevalence Consequences of deficiency
Iron Iron deficiency anemia: Anemia
37% (77) Decreased quality of life and fatigue (77)
Associated with restless leg syndrome
Vitamin D and Calcium Vitamin D deficiency: Reduced bone health
53% in CD and 44% in Vitamin D deficiency may lead to increased
UC (78) susceptibility of IBD and increased disease activity
(79)
Vitamin D deficiency may increase risk of
colorectal cancer
Zink - Poor wound healing
Magnesium - Reduced bone health (calcium absorption)
Fatigue (Mg-cofactor in ATP-reactions) (80)
Vitamin A Vary greatly between Reduced vision
studies Poor wound healing
Cobalamin (B12) Deficiency in 11-22% Megaloblastic anemia
with CD (76) Hypercoagulability (due to hyper
homocysteinemia)
Folic acid (B9) Abnormal levels in up to Macrocytic megaloblastic anemia
30% of IBD patients (76) Hypercoagulability (due to hyper
homocysteinemia)
Increased risk of colorectal cancer
Inspired by Hwang et al. (76)
IBD: inflammatory bowel disease, CD: Crohn`s disease, UC: Ulcerative Colitis, Mg: Magnesium, ATP: Adenosine triphosphate
7Anemia is common in IBD patients, and CD patients are at higher risk compared to UC
patients (81). In Norway, the prevalence of anemia at disease onset was 49 and 20% in CD
and UC respectively, and the relative risk significantly higher in IBD patients compared to the
background population (82). The main causes are iron deficiency and anemia of chronic
disease (83). Reduced dietary intake of iron, intestinal blood loss, reduced absorption due to
increased hepcidin levels, malabsorption, use of certain medications and active disease are
emphasized as underlying mechanisms (76, 81, 84, 85). Iron deficiency is associated with
fatigue and have a negative impact on quality of life (77). Deficiency of folate and B12 may
lead to megaloblastic anemia, and is more prevalent in CD patients (76). An important risk
factor for B12 deficiency is previous ileal bowel resection (86). Thus, CD patients are at
particular high risk because B12 absorption is confined to the ileum (76). Folate deficiency
may develop in both UC and CD, and insufficient dietary intake, malabsorption and certain
medications are probable causes (76).
Metabolic bone disease is frequent in IBD patients, and low bone mass and osteoporosis
affect 20-50% (87). Adequate dietary intake of calcium and vitamin D are warranted to
prevent osteoporosis from developing (87). Vitamin D deficiency is more common in IBD
patients compared to the general population (88). In a Norwegian study of IBD patients, 53
and 44% of CD and UC patients respectively, were defined as deficient of vitamin D (78).
Inadequate dietary intake, malabsorption due to steatorrhea and longer disease duration may
lead to vitamin D deficiency (76). Vitamin D is not only important for bone health, but serve a
role in our immune system as well (79). Researchers are currently trying to elucidate vitamin
Ds impact on IBD, as studies indicate that deficiency may increase the risk of IBD
development and prompt a more severe disease course (79). Another important function of
vitamin D is to regulate calcium absorption (76). Due to dietary restriction or avoidance of
milk and dairy products, the calcium intake is often lower than recommended (89, 90).
Furthermore, concomitant magnesium deficiency due to diarrhea, aggravate calcium
malabsorption (76). Lastly, admission of systemic steroids is an important risk factor of
metabolic bone disease, and consensus guidelines recommend vitamin D and calcium
supplementation in these patients (87).
Venous thromboembolism is another important extra-intestinal manifestation of IBD, with
more than doubled risk compared to the general population (87). Deficiency of folate in
particular, but also B12 and B6 are implicated due to its impact on homocysteine levels, and
because IBD patients are at higher risk for hyper homocysteinemia (76).
8It is important to be aware that biochemical measures of specific micronutrients change with
increased inflammation (35). While ferritin and copper increase, folate, selenium and zinc
decrease during periods of exacerbated disease activity. Hence, micronutrient status should be
assessed when the disease is quiescent, and recommendations of supplements given
accordingly. Researchers may define deficiency differently (e.g. using different cut-off values
for biochemical samples), use suboptimal and deviating markers or include participants with
and without active disease making the interpretation of results from studies of nutritional
status in IBD patients challenging. Furthermore, deficiency of several micronutrients may be
usual in the general population, and not a characteristic phenomenon of the disease.
1.4.2 Malnutrition
Studies reporting risk and prevalence of malnutrition in IBD patients vary greatly depending
on the definition and method of assessment including factors concerning the study population
(e.g. duration of disease, recruitment method), and range from 6-70% (61, 91-95). CD is
considered to be at higher risk of malnutrition compared to UC, as it can affect the entire
gastrointestinal tract (35). Dietary restriction behavior, previous bowel resections, fistulizing
CD and active disease are associated with increased risk of malnutrition in IBD patients (61,
90, 93, 95). Decreased dietary intake was associated with risk of malnutrition in a study of
hospitalized subjects with different gastrointestinal diagnoses including IBD (91). Reduced
appetite may be a contributive factor leading to a decreased dietary intake. During increased
inflammatory activity, 69-71% of IBD patients reported reduced appetite (61, 62).
Although many studies explore avoidance and restriction in IBD patients` diets, there are
relative few studies quantifying dietary intake of different foods, and with some conflicting
results (74, 75, 96). To our knowledge, dietary intake in Norwegian IBD patients has not been
assessed before. It is crucial to increase the knowledge of dietary intakes in this group of
patients, as they tend to impose multiple restrictions in their diet. Because the availability of
different food items and dietary practices most likely differ from other populations, it is
important to do this in Norwegian IBD patients. When we have information on dietary intake,
we can explore associations between diet and disease activity. Thus, in the future we might be
able to improve the dietary counseling and individualize the dietary advice. Additionally, we
might be able to detect different subgroups that might benefit from future interventions with
diet or dietary components because of the large and comprehensive data collection in the
overall IBSEN III cohort.
92 Aim
The overall aims of this master thesis were to increase the knowledge of dietary intake in
patients with IBD and to explore associations between FODMAP score, background data and
self-reported disease activity.
The specific objectives of this master thesis were to:
describe dietary intake in newly diagnosed IBD patients in relation to dietary
recommendations
compare differences in dietary intake of macro- and micronutrients and different food
groups in UC and CD patients, on group level
develop a FODMAP score, including
1. Designate a FODMAP factor for each FFQ food item based on the Monash
University`s traffic light system for FODMAP content in food items
2. Multiply the daily intake of each food item with its designated FODMAP
factor
3. Summarize each participant`s FODMAP score into a total FODMAP score
describe the main dietary sources of FODMAP in the IBD population
explore associations between FODMAP score and background data
explore associations between FODMAP score and self-reported disease activity
103 Methods
3.1 Study design
IBSEN III is a prospective population-based inception cohort implying that the participants
are included at diagnosis. The study was initiated January 2016, and will continue recruiting
until December 2019. Twenty hospitals from the South-Eastern Norway Regional Health
Authority are participating in the cohort. This regional health thrust is the largest out of four
in Norway, and covers 10 counties and 2.6 million people (97). An outline of the data
collection in the study can be viewed in Figure 1. Follow-up with physical examinations are
performed 1 and 5 years into the cohort. Collection of dietary data is performed at inclusion,
and after 1 and 5 years.
3 months 6 months 3 years
PROM (including PROM (including PROM (including
disease activity) disease activity) disease activity)
Biological samples Biological samples Biological samples
o Fecal samples o Fecal samples o Fecal samples
Inclusion 1 year 5 years
• Demographical data • Demographical data
• Demographical data • Clinical data • Clinical data
• Clinical data (treatment and (treatment and
• Diet respons respons
• PROM • Diet • Diet
• Examinations • PROM • PROM
o Endoscopy • Examinations • Examinations
o MRI* o Endoscopy o Endoscopy
o MRI* o MRI*
• Biological samples
o Extended biopsies* • Biological samples • Biological samples
o Fecal samples o Extended biopsies* o Extended biopsies*
o Blood* o Fecal samples o Fecal samples
o Urine* o Blood* o Blood*
o Urine* o Urine*
• Linkage to registries
• Linkage to registries • Linkage to registries
*Only biobank centers (Oslo University Hospital, Akershus University Hospital and Vestfold Hospital Trust)
PROM: Patient Reported Outcome Measures, MRI: Magnetic Resonance Imaging
Red square denotes data used in this master project
Figure 3: Overview of data collection in the IBSEN III cohort
11This master project is a cross-sectional study of data material collected at inclusion (the red
square in Figure 1). Our sample consists of participants included in the study between January
1st and December 8th 2017.
3.2 Study population
The IBSEN III cohort includes treatment naïve cases at all ages. Patients are recruited to the
cohort by two separate procedures depending on which hospital they are referred to. At the
majority of the participating hospitals (n=17), patients are invited after the endoscopy when
the gastroenterologist is reasonably certain that the patient suffer from IBD. Shortly following
endoscopy, patients are summoned to a conversation with a doctor or IBD-nurse where they
sign the written consent and are included in the cohort. If participants are diagnosed at a
private health institution within the South-Eastern region, they are informed about the study
by the gastroenterologist performing the endoscopy. After referral to one of the closest
located participating hospital, patients are included in the cohort accordingly. They do not
have to perform a second endoscopy. There are three biobank centers, Oslo University
Hospital, Akershus University Hospital and Vestfold Hospital Trust, taking extended
biological samples and MRIs (Figure 1). In these three hospitals, information about the study
are sent with the summon to patients when IBD are considered likely and before a definite
diagnosis. Thus, a subgroup of the population in the cohort comprise symptomatic non-IBD
controls. A doctor or IBD-nurse goes through details about the study and answers questions at
the first consultation before endoscopy take place. In every participating hospital, and after
written consent are signed, participants receive a folder containing practical information about
the study, data-collection and biological sampling.
12The following inclusion and exclusion criteria are given in the IBSEN III protocol. The study
is registered at clinicaltrials.gov with identification number NCT02727959 (98). Diagnostic
criteria are according to Lennard Jones (99).
Inclusion criteria
Ulcerative colitis:
Diagnostic criteria (at least three out of four criteria present):
1. A history of diarrhea and/or pus in stools for more than 4 weeks or repeated
episodes.
2. Macroscopic appearance at endoscopy of continuous mucosal inflammation
affecting the rectum in continuity with some or the entire colon.
3. Microscopic features on biopsy compatible with UC.
4. No suspicion of CD on small bowel X-ray, ileocolonoscopy or biopsy.
Crohn's disease:
Diagnostic criteria (at least two of four criteria present):
1. History of abdominal pain, weight loss and/or diarrhea for more than three
months.
2. Characteristic endoscopic findings of ulceration (aphtous lesions, snail track
ulceration) or cobble stoning or radiological features of stricture or cobble
stoning.
3. Histopathology consistent with Crohn's disease (epitheloid granuloma of
Langerhans type or transmural discontinuous focal or patchy inflammation).
4. Fistula and/or abscess in relation to affected bowel segments.
Exclusion criteria
Other causes of acute or chronic bowel inflammation must be excluded, i.e.
infectious colitis, radiation colitis, diversion colitis, solitary rectal ulcer
syndrome, graft versus host disease, diverticular colitis, medication associated
colitis, ischemic colitis, microscopic colitis, enema associated colitis.
Refusal or not able to give informed consent.
13In this master project inclusion criteria were completion of the dietary FFQ, CD or UC
diagnosis and age 18 years at inclusion. Participants were excluded from data analysis if
they were diagnosed with IBD-unclassified or if important background data collected at
inclusion (i.e diagnose, date of birth, sex) were missing. We excluded participants without
date of birth, because this information was necessary to match the dietary data with data from
the IBSEN III cohort. Participants were excluded if they had an unrealistic high (> 20 000 kJ)
or low (< 3500 kJ) energy intake.
3.2.1 Ethics
The IBSEN III cohort has ethical approval from the Regional Committee for Medical and
Health Research Ethics, REC South East, Norway (REC no: 2015/946). Written consent are
obtained from all participants. Inclusion in the cohort do not imply any changes in treatment,
and patients are followed according to local hospital guidelines.
3.3 Data Collection
After inclusion in the cohort, each participant receives a personal account in the web-driven
data capture software, ViedocTM. Through this software, participants are given access to
different questionnaires opening and closing at pre-set time-intervals. There is a time limit of
28 days to respond after the date of inclusion. After 14 days, if the participant agrees to be
contacted after inclusion, a reminder is sent to their mail-address and/or cellphone. Moreover,
if the hospital have a routine doing so, they make a personal phone call to participants with
missing data, approximately 7 days before deadline. To increase the response rate in this
study, the master student called and encouraged participants to respond within the time-limit
at Akershus University Hospital in the autumn, 2017.
3.3.1 Dietary data (FFQ)
Dietary data on the participants intake the previous year was assessed using a digital
comprehensive semi-quantitative food frequency questionnaire (FFQ), validated at the
University of Oslo (100). It was originally developed to collect dietary information in the
national population survey Norkost 1997 (101), while the present FFQ is an extended and
revised version of the former. The FFQ are available from University of Oslo`s web pages,
from a link in ViedocTM or if the webpage address from the participant-folder is typed into the
14web-browser. Participants log in with their personal Bank-ID, and their social security
number is stored together with the dietary data at the TSD (Tjenester for sensitive data)
databank at the University Center for Information Technology (USIT at University of Oslo).
The FFQ includes questions on 269 different food items or composite dishes to capture
dietary intakes. Questions are subdivided into 25 different groups comprising related foods
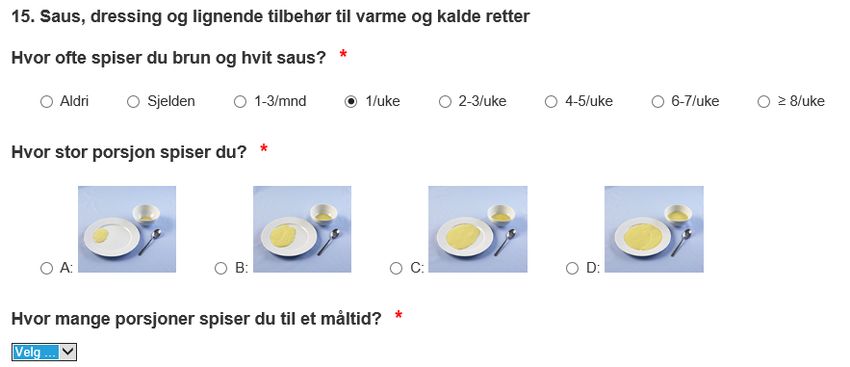
(Appendix II). To help the participants choose the proper quantity and improve accuracy, the
FFQ contained pictures of different portion sizes, household measures, pull-down menus and
measures in form of units or slices. Alternatives for estimation of frequency of intake could be
ranged from how many times per day/week to times per month the participant consumed a
food item or composite dish (examples from the dietary FFQ is given in Appendix III).
Total energy intake, macro- and micronutrients with and without dietary supplements, and
intake (g/day) of different food groups were computed using the food database KBS AE-14
and KBS software system (KBS, version 7.3, 2017). KBS was developed at the Department of
Nutrition, University of Oslo, Norway, and is available to students and researchers at the
department.
3.3.2 FODMAP score
Assignment of a FODMAP factor to each food item in the FFQ
The University of Monash, Melbourne, Australia, has developed an application called
“Monash University FODMAP diet” which consists of categorization of FODMAP contents
in food items. The Monash app was developed for IBS patients particularly, but considered
suitable for people with other gastrointestinal diseases (including IBD) adhering to a low
FODMAP diet. Depending on the amount of FODMAPs in given portion size(s), the different
foods are designated a traffic light: green=low dose; orange=moderate dose; red=high dose.
The Monash research team formerly tests all of the included foods to assure quality of the
Monash app. They have self-established analytical techniques to identify and quantify
FODMAPs (55, 102-104), but the contents in grams per 100g of fresh sample are not
published in the app.
We translated the traffic lights from the Monash app into corresponding numerical factors for
all the food items in the FFQ. An overview of the different food items and composite dishes
and their associated factor is presented in Appendix IV. In detail, each food item and
15composite dish from the IBSEN III FFQ received factor 0 if the FODMAP content was low
(green traffic light), 5 with moderate content (orange traffic light) and 10 if it contained high
amounts of FODMAP (red traffic light). In cases where a food item or composite dish was
missing in the Monash app, a FODMAP factor was estimated based on the FODMAP
containing ingredients in the recipe obtained from KBS, from the declaration on a matching
Norwegian product or information from the Norwegian Food Database
(www.matvaretabellen.no) (Appendix IV). If the total fraction of medium to high scores of
FODMAP ingredients (orange or red traffic light) amounted to or exceeded 40%, the food
item or dish received factor 10; were between 5.1-39% it received factor 5; less or equalized
5.0% it received factor 0. For dairy products, we searched the NUTTAB 2010 data base
(www.foodstandards.gov.au), to find lactose content in Australian dairy products.
Subsequently, we calculated the amount of lactose (which is the major source of FODMAP in
dairy products) in the different portion sizes in dairy products available from the Monash app
and made cut-off values for lactose content per portion (Table 3). Subsequently, we
calculated the lactose content in each of the dairy products in the FFQ based on Norwegian
serving sizes and gram lactose per 100 grams food obtained from large manufacturers of dairy
products in Norway (105, 106).
Table 3: Cut-off values for lactose content (g/portion)
FODMAP factor 0 5 10
Cut of values
(g/portion) ≤ 0.9 g/portion 1.0-3.4 g/portion ≥ 3.5 g/portion
FODMAP: Fermentable Oligo-, di- and monosaccharrides and Polyols
Numerical factors for difficult food items with no obvious comparable match in the Monash
app (e.g. cloudberries) were determined based on extrapolation of the most similar food items
found in the app (Appendix IV), after discussion with the supervisors of this project. Dietary
supplements (e.g multivitamins, fish oil supplements etc) were not included in the FODMAP
score.
16Overall score of FODMAPs based on intake
Each food item intake (g/day) was multiplied with its assigned FODMAP factor, to obtain
food item specific FODMAP scores (score/day). Subsequently, the overall FODMAP score
for each participant was computed by summarizing the 241 food item specific FODMAP
scores. Herbs and spices (10 food items from the FFQ) could not be quantified, and were not
included in the overall score. Moreover, we also estimated FODMAP intake-scores based on
participants reporting adherence to gluten- and/or lactose-free diets from the IBSEN III FFQ.
For participants adhering to gluten- and/or –lactose free diets, FODMAP factors for food
items or composite dishes containing gluten or lactose were down-regulated accordingly
(Appendix IV).
3.3.3 Background and clinical variables (IBSEN III)
Weight was measured at the hospital, and height self-reported. BMI was calculated by
dividing the weight in kilograms by the squared height in meter. Weight and height together
with date of birth, age and sex were collected in ViedocTM by the IBD-nurse at inclusion.
Demographic variables including marital status, highest fulfilled education, occupational
status, smoking/smoke-free tobacco (snus) habits and present physical activity were filled in
by the participants in ViedocTM. Some IBD-nurses filled in some of this information together
with the participant as a practical approach to show them how to use ViedocTM. The
background questionnaire also gathered information on previously (last year) or currently
adherence to specific diets (Appendix V).
17Information on self-reported disease activity was gathered in one of the IBSEN III
questionnaires. This information was used to calculate self-reported disease activity scores.
For UC, the score was based on 2 out of 3 items from the partial Mayo score (PMS) (107,
108) (Table 4). For CD, we used 4 out of 5 items from the Harvey Bradshaw index (HBI)
(109) (Table 4).
Table 4: Components of the HBI and PMS used to calculate self-reported disease
activity scores
Factors in the scores Included in our score (Yes/No)
Harvey Bradshaw Index General wellbeing Yes
Abdominal pain Yes
Abdominal mass No
Number of liquid stools per day Yes
Complications Yes
Partial Mayo Score Stool frequency Yes
Rectal bleeding Yes
Physician`s global assessment No
HBI: Harvey Bradshaw index, PMS: partial Mayo score
3.4 Statistics
3.4.1 Statistical analyses
All statistical analyses were performed by the master student, using IBM SPSS statistics
version 25 (Chicago, IL, USA). To decide if a variable was normally distributed we assessed
mean, median and standard deviation, histogram, Q-Q-Plot and normality tests (Kolmogorov-
Smirnov). Continuous variables were when normally distributed, tested with the two-sided
Student`s T-test and presented as mean and standard deviation (SD). Non-normally
distributed data were tested non-parametrically with Mann-Whitney U and presented as
median, 25th and 75th percentiles. A p-value < 0.05 was considered statistically significant.
Correlations between continuous variables were tested with Pearson`s correlation coefficient
for parametric, and Spearman`s coefficient for non-parametric variables. Categorical data
were tested with Chi-square and presented as frequencies (n) and percent. If expected count
18was
4 Results
In total, 187 out of 398 participants aged ≥18 years and diagnosed with CD or UC completed
the dietary FFQ (47%). Of the excluded participants with dietary data, 3 participants had an
unrealistic low and 8 an unrealistic high energy intake. In Figure 2, the selection of included
cases are presented in a flowchart.

  Included in IBSEN III by December 2017 (n=776)

                          Excluded due to lack of vital
                          background information (date of
                          birth, sex etc) (n=3)

                          Excluded due to prior IBD diagnose
                          (n=4)

                          Excluded due to suspicion of
                          duplication (n=4)

                          Excluded due to lack of written
                          consent (n=5)

                          Excluded due to unrealistic dietary
                          intake (n=11)

                          Excluded due to age < 18 years
                          (n=91)

                          Excluded non-IBD and IBD-U cases
                          (n=245 and n=15 respectively)

                          Excluded IBD cases without dietary
                          data (n=211)

  Included in this master project (n=187)

IBD: Inflammatory bowel disease, IBD-U: Inflammatory bowel disease unclassified

Figure 4: Flowchart of sample used in the master project

                                                                20
4.1 Characteristics of study sample
Of the total IBSEN III sample, 70 (37%) CD patients, and 117 (63%) UC patients were
included in this master project. Background characteristics are summarized in Table 5.
Table 5: Subject characteristics
MEN (n=88) WOMEN (n=99)
CD UC CD UC
(n=24) (n=64) (n=46) (n=53)
Sex, (%)a (n=187) 24 (27%) 64 (73%) 46 (46%) 53 (54%)
Age, years (n=187) 39 (25,51) 42 (29,54) 35 (25,47) 37 (29,45)
Weight, kg (n=182) 86.4 (27.2) 83.8 (13.5) 72.8 (18.1) 72.6 (15.1)
Height, cm (n=182) 182 (7) 182 (5) 167 (8) 169 (7)
BMI (kg/m2) (n=182) 26.1 (7.4) 25.5 (4.4) 26.0 (5.4) 25.4 (5.1)
Marital status (n=176)
Married/partner (%) 17 (77%) 41 (67%) 26 (59%) 38 (76%)
Single (%) 5 (23%) 20 (33%) 18 (41%) 12 (24%)
Educational level (n=179)
≤ 13 years (%) 14 (64%) 30 (48%) 20 (46%) 18 (35%)
> 13 years (%) 8 (36%) 32 (52%) 24 (55%) 33 (65%)
Occupational status (n=178)
Active worker (%) 17 (77%) 45 (74%) 24 (56%) 34 (67%)
Disabled/rehabilitation (%) 1 (4.5%) 3 (4.8%) 3 (7.0%) 5 (9.8%)
Tobacco (n=179)
Smoking (%) 3 (14%) 3 (4.8%) 7 (16%)b 2 (3.9%)
Smoke-free tobacco (snus) (%) 8 (36%) 22 (36%) 5 (11%) 7 (14%)
Physical activity (n=179)
Daily (%) 7 (32%) 24 (39%) 6 (14%) 15 (29%)
Weekly (%) 8 (36%) 27 (44%) 20 (46%) 24 (47%)
Less than weekly (%) 7 (32%) 11 (18%) 18 (41%) 12 (24%)
Duration of symptoms, 5 (2,47) 3 (2,9)c 7 (4,24) 5 (3,12)c
months (n=186)
a
difference in gender dependent of diagnose tested with chi-square, p=0.007
b
Women with CD tended to smoke more often compared to women with UC tested with chi-square, p=0.076 (Fisher`s exact test)
c
Trend towards difference in duration of symptoms prior to endoscopy tested with chi-square, p=0.14 and p=0.09 among men and women
respectively.
CD: Crohn`s disease, UC: Ulcerative Colitis, BMI: Body mass index
There was a difference in diagnose dependent of gender (p=0.007). Among CD, 66% were
women, and among UC 45% were women. The difference in diagnose dependent of gender
was still present when we included the IBD-cases without dietary data (n=211) in the former
21test (n=398). The youngest participating individual was 18 years old, and the oldest was 80
years old. The majority of the sample was between 30-59 years of age, was married/had a
partner and reported to have an occupation. Including IBD-cases without dietary data (n=211)
into the analyses, we found that significantly more women with CD smoked pre-diagnosis
compared to women with UC (p=0.04), and that participants with CD went through a longer
period with symptoms prior to examination compared to UC (men: p 13 years of schooling (in Norway: college/university
level) had a higher response rate compared to participants with ≤ 13 years of education (in
Norway: completed secondary school) (p=0.004 and p=0.04 respectively). In men, 70% with
higher compared to 46% with less education completed the dietary FFQ, while in women the
distribution was 70% versus 54% respectively. Men and women who smoked prior to
diagnosis had a significantly lower response rate (p=0.03), 32% and 41% of smokers
compared to 58% and 66% of non-smokers respectively. Among women, being between 30-
59 years old was associated with a higher response rate (p=0.01), 59% compared to 44% and
29% for age-groups 18-29 years and 60 years and older respectively. Age had no impact on
the response rate for men. Having status as active worker, BMI or using smoke-free tobacco
(snus) had no impact on the response rate for men and women.
224.2 Macro- and micronutrients
Except for alcohol intake in women, we found no statistically significant differences
comparing macro- and micronutrient intake in CD and UC at inclusion (Table 6 and 7).
Table 6: Intake of macronutrients in percent of total energy intake (E%)
Men (n=88) Women (n=99)
CD UC p CD UC p
n=24 n=64 n=46 n=53
Percent energy, E%
Protein, E% 17 (3) 17 (3) 0.84 17 (3) 17 (4) 0.56
Fat, E% 37 (6) 36 (7) 0.42 36 (5) 36 (5) 0.97
SFA, E% 14 (2) 13 (3) 0.24 13 (2) 13 (2) 0.98
MUFA, E% 14 (3) 13 (3) 0.49 13 (2) 13 (3) 0.87
PUFA, E%* 5.9 (4.6,7.3) 5.8 (4.8,6.8) 0.98 5.8 (5.1,6.8) 5.9 (5.0,7.2) 0.79
Omega-3, E%* 1.3 (0.9,1.6) 1.1 (0.8,1.6) 0.41 1.3 (1.0,1.8) 1.2 (0.9,1.8) 0.45
Carbohydrates, E% 42 (6) 43 (8) 0.65 44 (5) 43 (8) 0.57
Added sugar, E%* 6.4 (3.7,11) 6.0 (3.4,9.9) 0.68 6.9 (4.4,9.1) 7.1 (4.3,11) 0.87
Fibre, E% 2.0 (0.5) 2.1 (0.5) 0.74 2.3 (0.6) 2.5 (0.7) 0.054
Alkohol, E%* 1.1 (0.4,2.1) 1.5 (0.6,3.5) 0.18 0.2 (0.1,0.6) 0.7 (0.1,2.2) 0.004
* Tested with Mann-Whitney
CD: Crohn`s disease, UC: Ulcerous Colitis, p: p-value, SFA: Saturated fatty acids, MUFA: monounsaturated fatty acids, PUFA:
Polyunsaturated fatty acids
23Table 7: Intake per person of macro- and micronutrients (quantity/day)
MEN (n=88) WOMEN (n=99)
CD UC p CD UC p
n=24 n=64 n=46 n=53
Quantity per
person per day
Energy, MJa 12.6 (3.7) 11.4 (3.4) 0.16 9.5 (2.8) 9.8 (3.2) 0.61
Protein, g 127 (45) 111 (32) 0.13 97 (35) 95 (31) 0.74
Fat, g* 135 (79,162) 101 (83,139) 0.12 81 (65,111) 91 (70,111) 0.69
SFA, g* 50 (32,62) 38 (30,51) 0.09 32 (26,40) 33 (27,42) 0.62
MUFA, g* 51 (29,61) 38 (30,53) 0.12 29 (24,43) 34 (26,39) 0.74
PUFA, g* 21 (15,24) 18 (13,22) 0.14 15 (11,20) 14 (12,19) 0.93
Omega-3, g* 4.2 (2.9,5.2) 3.4 (2.5,4.4) 0.12 3.0 (2.1,4.4) 3.2 (2.2,4.4) 1.00
Omega-6, g* 17 (13,19) 14 (11,18) 0.18 12 (9,15) 11 (9,15) 0.86
Cholesterol, mg* 420 (263,577) 356 (263,454) 0.33 271 (211,405) 309 (222,399) 0.82
Carbohydrates, g 312 (102) 290 (104) 0.38 244 (74) 255 (107) 0.58
Fibre, g 31 (10) 29 (10) 0.33 26 (8) 30 (11) 0.08
Added sugar, g* 48 (23,81) 37 (21,69) 0.47 36 (22,54) 39 (21,60) 0.86
Alkohol, g* 5.3 (1.8,9.6) 6.1 (2.6,14) 0.33 0.9 (0.3,2.1) 2.2 (0.5,5.9) 0.004
Vitamin A, µg* 1493 1179 0.08 1130 1091 0.93
(889,2081) (743,1631) (812,1593) (790,1599)
Vitamin D, µg* 7.2 (5.4,13) 8.1 (5.3,11) 0.59 6.7 (5.4,10) 7.1 (4.8,9.3) 0.56
Vitamin E, mg 18 (7) 17 (6) 0.39 15 (6) 15 (5) 0.67
Thiamine, mg 2.1 (0.7) 1.9 (0,5) 0.12 1.7 (0.5) 1.6 (0.5) 0.84
Riboflavin, mg 2.6 (0.9) 2.4 (0.9) 0.21 2.0 (0.9) 2.0 (0.7) 0.86
Niacin, mg* 31 (26,41) 28 (21,34) 0.10 23 (17,28) 22 (17,27) 0.76
Vitamin B6, mg* 2.4 (1.5,2.9) 2.0 (1.6,2.4) 0.23 1.7 (1.3,2.3) 1.9 (1.4,2.3) 0.48
Folate, µg 369 (132) 338 (99) 0.24 317 (124) 346 (129) 0.27
Vitamin B12, µg* 9.3 (5.4,13) 7.4 (5.7,10) 0.14 6.5 (4.9,9.3) 6.9 (4.7,8.8) 0.67
Vitamin C, mg* 114 (75,171) 112 (82,146) 0.89 122 (62,165) 127 (93,176) 0.10
Calcium, mg* 998 (670,1359) 936 (686,1294) 0.50 881 (660,1141) 859 (705,1099) 1.00
Iron, mg 14 (5) 12 (4) 0.07 11 (3) 11 (4) 0.58
Sodium, g* 3.8 (3.0,4.9) 3.2 (2.6,4.1) 0.08 3.0 (2.2,3.7) 2.6 (2.0,3.4) 0.17
Potassium, g 5.1 (1.7) 4.8 (1.5) 0.34 4.2 (1.6) 4.5 (1.7) 0.28
Magnesium, mg* 477 (318,592) 436 (336,532) 0.34 355 (281,461) 371 (300,492) 0.36
Zinc, mg 17 (6) 15 (4) 0.10 13 (4) 12 (4) 0.61
Selenium, µg* 70 (45,93) 60 (46,76) 0.25 48 (38,65) 54 (36,64) 0.74
Copper, mg 1.5 (0.5) 1.4 (0.5) 0.47 1.3 (0.4) 1.4 (0.6) 0.09
Phosphorus, g 2.2 (0.7) 2.0 (0.6) 0.20 1.8 (0.6) 1.8 (0.6) 0.89
* Tested with Mann-Whitney
a
Significant difference between men and women (pWomen with UC consumed significantly more alcohol than women with CD (p=0.004). The
differences were 0.5E% or 1.3g of alcohol per day. There was a trend towards higher absolute
intakes of fiber and copper in women with UC, however the intakes were not significantly
different. Men with CD had a tendency towards higher intakes of saturated fatty acids (SFA),
vitamin A, iron and sodium compared to men with UC.
Several of the participants used dietary supplements. Forty-six percent used liquid or
capsulated marine oils, 19% used multivitamins, 7.8% used vitamin C supplements, 7.5%
took B-vitamins, 13% used Vitamin D supplements and 4% used an oral iron preparation-
liquid or in form of a tablet. When supplements were included in the analysis of vitamin D
intake, 53% of the study population had a dietary intake >10 µg.
25You can also read