The Atypical Protein Kinase C Small Molecule Inhibitor ζ-Stat, and Its Effects on Invasion Through Decreases in PKC-ζ Protein Expression - Frontiers
←
→
Page content transcription
If your browser does not render page correctly, please read the page content below
ORIGINAL RESEARCH
                                                                                                                                         published: 27 February 2020
                                                                                                                                       doi: 10.3389/fonc.2020.00209

                                              The Atypical Protein Kinase C Small
                                              Molecule Inhibitor ζ-Stat, and Its
                                              Effects on Invasion Through
                                              Decreases in PKC-ζ Protein
                                              Expression
                                              Tracess Smalley † , Rainer Metcalf † , Rekha Patel, S. M. Anisul Islam,
                                              Raja Reddy Bommareddy and Mildred Acevedo-Duncan*

                                              Department of Chemistry, University of South Florida, Tampa, FL, United States

                                              Ovarian cancer is estimated to reach 22,530 diagnoses and cause 13,980 cancer deaths
                                              per year. The most common histology diagnosed of ovarian cancer is epithelial ovarian
                            Edited by:
                          Saori Furuta,       carcinomas (EOC). An aggressive epithelial subtype is clear cell ovarian carcinoma
    University of Toledo, United States       (CCOC) and is characterized as a non-serous ovarian cancer. Protein kinase C (PKC)
                       Reviewed by:           is an enzymatic family of proteins that have been found to be a component in cancer
                      Carmine Conte,
                                              progression, tissue invasion, and metastasis. The atypical PKC (aPKC) isoforms, PKC-ι
          Agostino Gemelli University
                        Polyclinic, Italy     and PKC-ζ, have been suggested to participate in the increased proliferation of ovarian
                      Tonya J. Webb,          cancers. Previous studies have indicated that novel aPKC inhibitors ICA-1S and ζ-Stat
    University of Maryland, Baltimore,
                         United States        decreased the migratory behaviors of colorectal cancer cells and were selective for
                    *Correspondence:          PKC-ι/λ and PKC-ζ, respectively. The aims of this investigation were to further determine
               Mildred Acevedo-Duncan         the binding mechanisms of ζ-Stat, expand on the tissue range of these compounds,
                     macevedo@usf.edu
                                              investigate the therapeutic potential of ζ-Stat in CCOC, and to illustrate the disruption of
     † Theseauthors have contributed          invasion via the PKC-ζ signaling cascade. The methods utilized were molecular docking
        equally to this work and share
                                              and virtual target screening, Western blot analysis, end-point PCR, GST pull down,
                        first authorship
                                              cell viability and invasion and migration assays. We discovered that the small molecule
                   Specialty section:         inhibitor, ζ-Stat, is a prospective drug candidate to investigate as a novel potential
         This article was submitted to
                                              treatment for CCOC. We also found that the PKC-ζ/Ect2/Rac1 activation pathway was
                     Women’s Cancer,
               a section of the journal       decreased by ζ-Stat, which in turn decreased invasive behavior of CCOC.
                 Frontiers in Oncology
                                              Keywords: PKC-ζ, PKC-zeta, Ect2, clear cell ovarian carcinoma (CCOC), ζ-Stat, zeta-Stat, computational
             Received: 27 July 2019           molecular modeling
        Accepted: 06 February 2020
        Published: 27 February 2020

                              Citation:       INTRODUCTION
         Smalley T, Metcalf R, Patel R,
    Islam SMA, Bommareddy RR and              In 2019, it is estimated that ∼1.7 million new incidences of cancer will be diagnosed and 600,000
       Acevedo-Duncan M (2020) The            cancer deaths will occur (1). Cancer has become the leading cause of death in 21 states, despite
       Atypical Protein Kinase C Small
                                              decreases in cancer death rates since 1991 (2). Specifically, ovarian cancer is estimated to reach
      Molecule Inhibitor ζ-Stat, and Its
           Effects on Invasion Through
                                              22,530 diagnoses and cause 13,980 cancer deaths per year (1). This constitutes 5% of cancer deaths
           Decreases in PKC-ζ Protein         among women and is responsible for being the most lethal gynecological cancer diagnosis (3).
    Expression. Front. Oncol. 10:209.            The most common ovarian cancer diagnosis is epithelial ovarian carcinomas (EOC), which
        doi: 10.3389/fonc.2020.00209          constitutes 85–90% of diagnosis (3). Of this percent, clear cell ovarian carcinoma (CCOC)

Frontiers in Oncology | www.frontiersin.org                                         1                                          February 2020 | Volume 10 | Article 209
Smalley et al.                                                                                                                                    ζ-Stat in CCOC

represents 5% of incidence and presents unique pathological                        such as Ras Homolog Family Member A (RhoA), Rac Family
features and a chemo resistant phenotype (4, 5). CCOC is the                       Small GTPase 1 (Rac1), and Epithelial Cell Transforming 2
third most common subtype of ovarian cancer, has a higher                          (Ect2) (14–16).
risk of reoccurrence, and lower survival rate (4). Furthermore,                        The ECT2 gene is highly amplified in CCOC and may increase
CCOC is characterized as a non-serous (NS) ovarian cancer and                      migratory behavior (4). Ect2 is a Rho GTPase specific guanine
has been found to be more invasive than high grade serous                          nucleotide exchange factor (GEF) which activates this family of
ovarian carcinoma (HGSOC). It has been found that patients                         proteins by the addition of a phosphate group to Guanosine
with NS tumors have poor prognosis (6). Consequently, CCOC                         diphosphate (GDP) (17). The overexpression of Ect2 protein
is proposed to be associated with endometriosis and it has been                    promotes increased activation of the Rho GTPases, which in turn
suggested that the pre-cancerous lesions from endometriosis can                    can facilitates invasion through cytoskeleton reorganization (18).
lead to CCOC (relative risk = 12.4) (7). Endometrial cancer and                        Previous studies have indicated that novel aPKC inhibitors
CCOC have been shown to have an overexpression of Protein                          ICA-1S and ζ-Stat (Figure 1) decreased the migratory behaviors
kinase C (PKC) isoforms which play important roles in these                        of colorectal cancer cells and were selective for PKC-ι/λ and
cancers development and resistance (8).                                            PKC-ζ, respectively (16, 19). These small molecule inhibitors
    Protein kinase C (PKC) is an enzymatic family of proteins that                 were also shown to decrease cell viability in colorectal cancer and
have been found to be a component in cancer progression (9).                       melanoma (16, 19).
These proteins phosphorylate the serine and threonine residues                         Furthermore, computational molecular docking was
of substrates and are generally activated by compounds such as                     performed on PKC-ι and a homology model of PKC-ζ (since
diacylglycerol (DAG), calcium (Ca2+ ) and phorbol esters (9).                      there is no crystal structure available) with ICA-1S and ζ-Stat
There are three classifications within the PKC family which                        (19). In this study, the authors suggested that ICA-1S bound
include the conventional PKC-α, βI, βII (splice variant), γ, the                   to a potential allosteric pocket (19). However, a more in-depth
novel PKC-δ, ε, η, θ, and the atypical PKC-ζ, ι/λ (9).                             analysis of ζ-Stat is needed for subsequent studies. The further
    The atypical PKC isoforms, PKC-ι and PKC-ζ, have been                          development of computational modeling is pivotal for drug
suggested to participate in the increased proliferation of ovarian                 discovery optimization and helps push these small molecule
cancer (10). PKC-ι has also been identified as a highly amplified                  inhibitors toward a clinical setting. Computational studies
gene in CCOC (4) and is noted for its role in apical-basal polarity                can generate mechanistic understandings of the activity these
loss (10). In addition, due to mutations in the PIK3CA gene                        compounds present, can allow for inhibitor improvement, and
and inactivation of Phosphatase and Tensin Homolog (PTEN),                         can institute further signaling investigations.
the Phosphoinositide 3-Kinase (PI3K)/Serine Threonine Kinase                           It has been suggested that the distal downstream signal
1 (AKT)/Mechanistic Target Of Rapamycin Kinase (mTOR)                              cascade of PI3K/aPKC pathway should be targeted due to the
pathway has also been upregulated in CCOC (5, 11–13).                              genotypic and phenotypic reliance of this pathway in CCOC for
The upregulation of this pathway increases the expression of                       survival and invasion. The aims of this study were to further
downstream survival targets (e.g., PKC-ζ). PKC-ζ has been shown                    determine the binding mechanisms of ζ-Stat, expand on the
to be involved in tumorigenesis, tissue invasion, and cancer                       tissue range of these compounds by investigating the effects in
progression through the modulation of cell migration machinery,                    CCOC cell lines, investigate the therapeutic potential of ζ-Stat in

 FIGURE 1 | Atypical PKC inhibitors. The molecular structures and molecular weights of ICA-1S and ζ -Stat. ICA-1S was synthesized by United Chemistry Resources
 and ζ -Stat was distributed by the NCI.

Frontiers in Oncology | www.frontiersin.org                                    2                                           February 2020 | Volume 10 | Article 209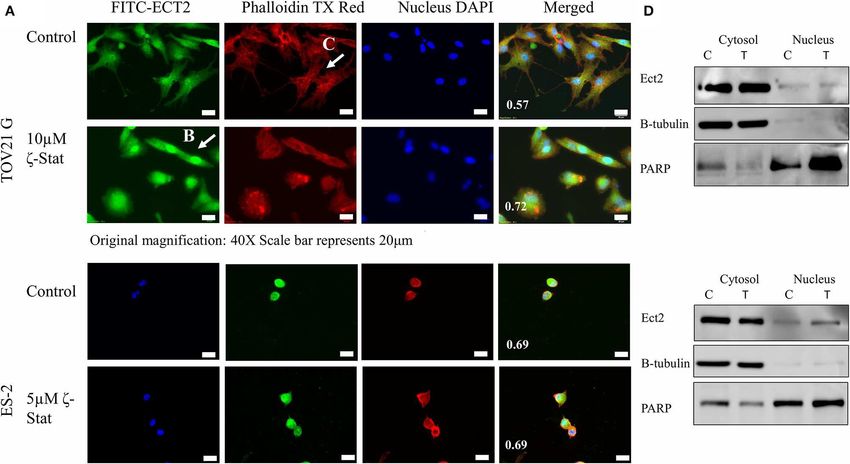
Smalley et al.                                                                                                                  ζ-Stat in CCOC

CCOC, and to illustrate the disruption of invasion via the PKC-ζ       reference conformational states from Molecular Dynamics (MD)
signaling cascade.                                                     simulations. No crystal structure currently exists of PKC-ζ,
                                                                       necessitating the need for homology modeling to attempt to
MATERIALS AND METHODS                                                  produce a potentially viable docking model for PKC-ζ. Two
                                                                       PKC-ζ models were built, one utilizing SWISS-MODEL (25–27)
Antibodies and Reagents                                                and another employing the Prime homology program (28–30)
The small molecule inhibitors, ζ-Stat and ICA-1S, were                 using the human PKC-ζ sequence (UniProt Q05513) and the
obtained from the National Institute of Health (NIH) branch            crystallized PKC-ι structures as templates. PDB systems were
National Cancer Institute (NCI) and United Chem Resources              prepared with the Protein Preparation Wizard (PrepWizard) in
in Birmingham Alabama, respectively. The sources of cell lines,        Maestro (30–34). Cofactors used in crystallization (such as sulfate
reagents and antibodies were: TOV21G and ES-2 CCOC cell                or phosphate ions), ligands, and additional protein dimers were
lines (American Type Culture Collection, USA); SHT290 normal           deleted. Bond orders were then assigned, including disulfide
endometrial stromal cell line (Kerafast, USA); MCDB 121, Media         bridges, and original hydrogens were deleted and later replaced to
199, F12K, penicillin and streptomycin, trypsin, Dulbecco’s            reduce bad contacts and other crystal artifacts before protonation
phosphate buffered saline (DPBS) and Mito + (Corning, USA);            and hydrogen bond optimization. All waters were retained for
McCoy’s media (HyClone, USA); Opti-MEM I (Gibco, USA);                 assisting in the determination of side chain protonation states
Fetal bovine serum (FBS, Atlanta Biologicals, USA); human              and initial hydrogen bond optimization. Missing side chains
insulin (MP Biomedicals, LLC, France); dimethyl sulfoxide              were added and optimized using Prime. Hydrogen atoms were
(DMSO, Sigma Aldrich, USA); Water-Soluble Tetrazolium                  then added to the protein, remaining cofactors, and to any
(WST-1, Roche, USA); Halt protease and phosphatase inhibitors          added structural waters. The program PROPKA (35) was used
cocktail and Protein A/G magnetic beads (Thermo Scientific,            for the prediction of protein ionization states at 7.4 pH and
USA); anti- PKC-ζ (9372s, 1:1000, Cell Signaling, USA); anti-          ProtAssign was used for hydrogen bond optimization. After
PKC-ι (610178 1:1000, BD, USA); anti-β-actin (A3854, 1:40000,          automatic hydrogen assignment, visual inspection was used to
Sigma Aldrich, USA); anti-RhoA (ab54835, 1:4000, Abcam,                flip residues and change protonation states at protein-protein
USA); anti-Ect2 (07-1364, 1:1000, Millipore, USA); anti-β-             interfaces if and when appropriate.
tubulin (5346t, 1:1000, Cell Signaling, USA); anti-PARP (9532s,
1:1000, Cell Signaling, USA); Donkey anti-rabbit IgG Alexa-            Molecular Dynamics
488 (A21206, 1:500, Invitrogen, USA); Goat anti-rabbit (170-           MD simulations were performed with the Desmond MD
6515, 1:2000, Bio-Rad Laboratories, USA); Goat anti-mouse              program (36–39). A cubic simulation box was created extending
(170-6516, 1:2000, Bio-Rad Laboratories, USA); Activated Rac1          at least 10 Å from the protein with imposed periodic
pulldown kit (BK035, Cytoskeleton, USA); 96-well transwell             boundary conditions. TIP3P waters (40) were added to solvate
insert and basement membrane extract (BME; both Corning                the simulation box and was then electrically neutralized by
Inc., Corning, NY, USA); RNA bee (Amsbio, United Kingdom);             introducing sodium ions. The OPLS-3 all-atom force field (41)
Qiagen RT Kit (205113, Qiagen, Germany); RhoA PCR primers              was then applied to all atoms. The SHAKE algorithm (42) was
(HP100025, Sino Biological, USA); Glyceraldehyde 3-phosphate           used to constrain all bonds in the system and the REference
dehydrogenase (GAPDH) PCR primers (Eurofins, USA); NE-                 System Propagator Algorithm (RESPA) (43) with an integration
PER Nuclear and Cytoplasmic Extraction Reagents (78835,                time step of 2 fs was employed. The Particle Mesh Ewald (PME)
Thermo Fisher Scientific, USA).                                        algorithm was used to calculate long-range electrostatics with
                                                                       a real-space cutoff of 13 Å. Van der Waals interactions were
Analysis of Somatic Gene Mutations for                                 cutoff at 16 Å. The systems were simulated in an NPT ensemble
Ovarian Cancer, CCOC and CCOC Cell                                     using the Nose–Hoover temperature coupling scheme (44) at a
Lines                                                                  temperature of 310 K and a constant pressure of 1 atm using the
The selection of CCOC cell lines employed the COSMIC database          Martyna-Tuckerman-Tobias-Klein (MTTK) barostat (45, 46).
(20). Initially, the search was focused on all ovarian subtypes            All systems were energy minimized with a truncated
in the database. The search was then re-focused on clear cell          newtonian conjugate gradient (TNCG) method (47) followed by
carcinomas. Furthermore, the COSMIC cell line project was              multiple restrained minimizations to randomize systems before
utilized for the analysis of mutations in TOV21G and ES-2              equilibration and final simulation. Heavy atoms of the protein
cells (20).                                                            were held fixed during heating for an initial 12 ps NVT ensemble
                                                                       simulation at 10 K with the Berendsen thermostat (48). This was
Computational Analysis of aPKCs                                        followed by simulations at 1 atm in the NPT ensemble for 12 ps at
Protein Preparation                                                    10 K and 24 ps at 310 K. Unrestrained equilibration MD was then
Protein model systems for PKC-ι and PKC-ζ were prepared                performed for 24 ps at 310 K and 1 atm. Finally, unconstrained
using the Schrodinger software suite (21). Protein structure           production MD was performed on PKC-ι and PKC-ζ systems for
coordinates were downloaded from the Protein Data Bank                 250 ns. Energies were recorded every 2 ps and trajectory frames
(PDB) (22, 23). The PKC-ι model was generated from the                 were recorded every 5 ps.
PDB 3A8W entry co-crystallized with adenosine triphosphate                 Final system equilibration was determined by the observation
(ATP) (24). The apo structure, PDB 38AX, was used to cross             of asymptotic behavior of the potential energy, Root Mean Square

Frontiers in Oncology | www.frontiersin.org                        3                                     February 2020 | Volume 10 | Article 209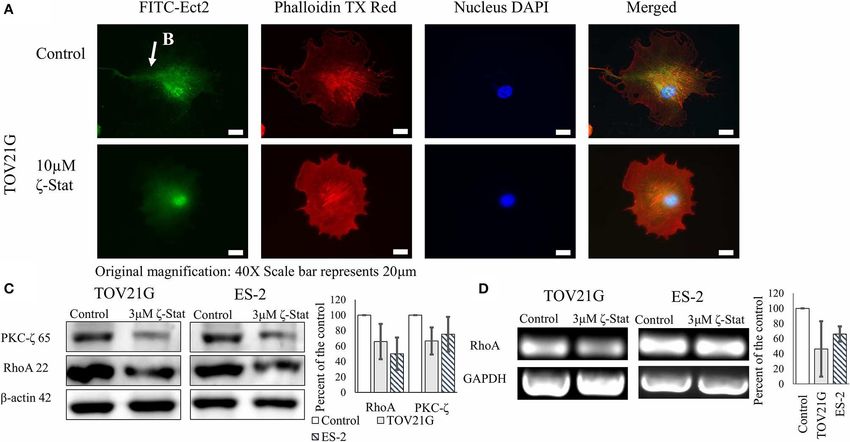
Smalley et al.                                                                                                                     ζ-Stat in CCOC

Deviation (RMSD), and Radius of Gyration (Rg) profiles and                   The position of the cubic docking grid for the ATP binding
visual inspection of trajectories guided by Root Mean Square             site was centered on the original co-crystallized ligand centroid
Fluctuation (RMSF) profiles (Supplementary Material).                    and from the binding cavity centroid defined by SiteMap for
                                                                         the proposed allosteric site with a box size of 29 Å for both. A
Consensus Docking                                                        constrained minimization of the receptor was performed with
After equilibration was determined, a hierarchical average linkage       an RMSD cutoff of 0.18 Å. An initial softened potential Glide
clustering method based on RMSD was utilized to determine                docking of the ligand set was then implemented with the standard
an average representative structure for the equilibrated PKC-            precision (SP) mode and a van der Waals scaling factor of 0.5
ι system. The program PROPKA was then implemented again                  was applied to the non-polar atoms of the receptor and ligands.
on the equilibrated structure to test consistency of side chain          The resulting top 20 poses of the ligands were used to sample
protontion states at 7.4 pH. The representative structure was            protein plasticity by conformational searches and minimizations
then used for consensus docking incorporating five diverse and           of binding pocket residues within 6 Å of any ligand pose for
complimentary docking methods described below. By applying               all complexes obtained. The new receptor conformations were
these varied energy scoring methods, the weaknesses of each              then redocked using complexes within 30 kcal/mol from the best
method can be identified for a particular model and error                scoring structure. Glide docking parameters for this step were
statistically minimized, yielding a more accurate summary of             reset to the default hard potential function with a van der Waals
ligand binding dispositions and affinities.                              scaling of 1.0 and SP mode.
    As a check for the placement of the grids used in the docking            The estimated binding affinity of each complex was reported
studies and for further analysis of the binding cavities for the         in the GlideScore and used to compare differences between each
ATP binding site and the potential allosteric site, Schrödinger’s        ligand while the Emodel score is used to inter-compare poses
SiteMap program (49–51) was employed. SiteMap searches the               of the ligands. Emodel places more significance on weighting
protein structure for likely binding sites and highlights regions        force field components (electrostatic and van der Waals energies),
within the binding site suitable for occupancy by hydrophobic            making it better for comparing conformers as opposed to
groups, hydrogen-bond donors, acceptors, or metal-binding                comparing chemically-distinct species.
functionality of the ligand.
    The ligands ICA-1S, ζ-Stat, and ATP were prepared using the          Quantum Polarized Ligand Docking (QPLD)
program LigPrep (52) and the OPLS-3 all-atom force field was             To account for ligand polarization upon binding, Quantum
applied to all ligand atoms.                                             Mechanics/Molecular Mechanics (QM/MM) docking was
                                                                         performed by the Schrödinger QM-Polarized Ligand Docking
Rigid Receptor Docking (RRD)                                             Protocol (QPLD) (61–64). The protocol first employs RRD using
Rigid docking simulations were performed by Glide (53–55).               Glide in SP mode. In this step, the top five poses of each ligand in
Glide uses a GlideScore fitness function based on Chemscore              the initial RRD were used. Potential ligand polarization induced
(56, 57) for estimating binding affinity, but includes a steric-         by the protein were then calculated with QSite (63, 65, 66)
clash term, adds buried polar terms to penalize electrostatic            at the B3LYP/6-31G∗ level. The ligand force fields were then
mismatches, and modifies other secondary terms. Docking                  reconstructed with QM/MM modified charges, redocked, and
simulations used both the standard precision (SP) and extra              five poses of each ligand were saved for evaluation.
precision (XP) methods. XP mode is a refinement algorithm
enforced only on good ligand poses. Sampling is based on an              Molecular Mechanics and Generalized Born Surface
anchor and refined growth strategy and the scoring function              Area (MM/GBSA)
includes a more complete treatment of some of the SP energetic           The MM/GBSA method combines molecular mechanics energy
terms, such as the solvation and hydrophobic terms. Docking              terms and implicit solvation models to calculate the binding-free
grids were defined by a rectangular ligand atom inclusion outer          energy based on docking complexes. The protocol, implemented
box of 22 Å and ligand centroid constraint inner box of 10 Å             by the Prime MM-GBSA module, calculates optimized free
in the x, y, and z directions originating from the binding cavity        energies for the free protein and free ligand and references
centroid defined by SiteMap for the proposed allosteric site and         them with the original bound complex energy (67). Polar
by the original co-crystallized ATP ligand centroid for the ATP          contributions are calculated using the Generalized Born (GB)
binding site.                                                            model (68), an implicit solvent model is based on a variable
                                                                         dielectric surface Generalized Born (VD-SGB) approach, where
                                                                         the variable dielectric value for each residue was fit to a large
Induced Fit Docking (IFD)                                                number of side-chain and loop predictions while the non-polar
The IFD methodology (30, 55, 58–60) incorporates both the                energy is estimated using the solvent accessible surface area
docking program Glide to account for ligand flexibility and the          (SASA) (69). The simulation was performed based on receptor–
Refinement module in the Prime program to account for receptor           ligand complex structures obtained from induced fit docking.
flexibility. The Schrödinger IFD protocol attempts to model              The obtained ligand poses were minimized using the local
induced-fit effects from alterations in binding site conformation        optimization feature in Prime, whereas the energies of complex
due to ligand binding in order to increase accuracy of binding           were calculated with the OPLS-3 force field and Generalized-
affinity estimates and prediction of possible binding modes.             Born/Surface Area continuum solvent model (70). During the

Frontiers in Oncology | www.frontiersin.org                          4                                      February 2020 | Volume 10 | Article 209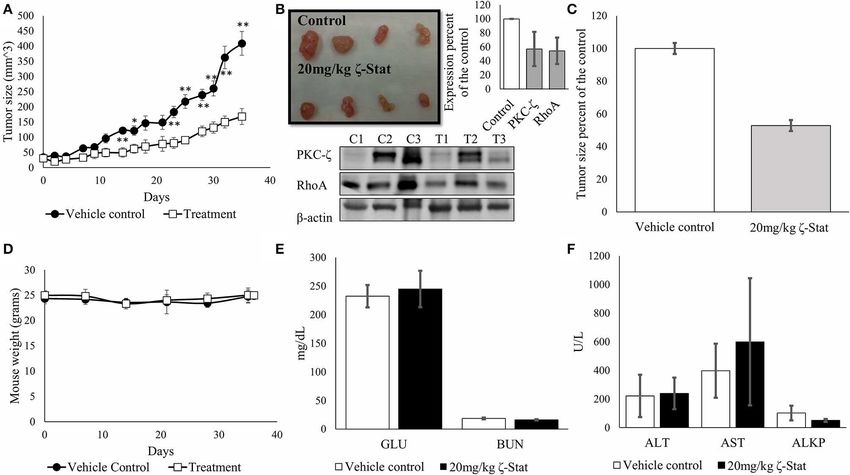
Smalley et al.                                                                                                                        ζ-Stat in CCOC

simulation process, the ligand strain energy is also considered.            Cell Viability Assay
A known issue with MM/GBSA is that scores do not accurately                 Cells were seeded in to 96-well plate at 800 cells per well with 200
reproduce absolute physical binding affinities but display great            µL of media. Cells were treated with different concentrations of
efficacy at ranking compounds in a relative manner (71–74).                 DMSO (vehicle to match treatment, N = 12) and ζ-Stat (1, 3, 5,
We developed a correlation function using a single-layer logistic           and 10 µM, N = 3). After 72 h of treatment, the cell viability was
regression to rescale MM/GBSA scores based on the other                     analyzed using WST-1 at wavelengths 450 and 630 nm. The plates
docking score algorithms. This retains the ranking accuracy of              were read on a BioTek SynergyHT microplate reader. Standard
MM/GBSA and allows us to proportion the results in a minimally              curves for each cell line was generated based on the number of
biased and physically relevant manner.                                      cells added and the absorbance recorded.

Virtual Target Screening (VTS)                                              Cell Lysate Collection
VTS is a system designed to virtually screen a molecule of interest         Media was extracted from the vessel and 250 µL of lysis buffer
to a large library of protein structures. The current protein library       [Pierce R Immuno Precipitation Lysis Buffer, 25 mM Tris-HCl
consists of 1,451 structures with a concentration of kinases. The           pH 7.4, 150 mM NaCl, 1 mM EDTA, 1% NP-40 and 5% glycerol]
system is calibrated with a set of small drug-like molecules are            with protease and phosphatase inhibitors was added to the plates.
docked against each structure in the protein library to produce             Cells were scraped and collected from the vessel (on ice) and the
benchmark statistics. VTS was employed as a theoretical assay               suspension was sonicated for 3 × 5 s cycles on ice. The samples
of potential kinase activity and gauge of potential biological              were centrifuged at 4◦ C at 12,000 × g for 15 ms. The supernatant
promiscuity. The calibration procedure allows the analysis to               (cell lysate) was removed from the cellular membrane pellet and
accurately predict inhibitor–kinase binding affinities when Kd <            placed in a secondary micro centrifuge tube. Protein content was
10 µM (defining a hit) and Kd ≥ 10 µM are both considered (72%              measured per Bradford Assay Reagent on a BioTek SynergyHT
accuracy in the best case) (75). Therefore, the VTS system is able          microplate reader at 595 nm.
to robustly discriminate protein binders from non-binders and
give some inclination as to potential binding promiscuity of the            Western Blot Analysis
molecule of interest with respect to the protein group tested.              Cell lysates containing equal amounts of protein (20–40
                                                                            µg) were loaded in each lane and run on sodium dodecyl
                                                                            sulfate-polyacrylamide gel electrophoresis (SDS-PAGE) and
Cell Culture                                                                transblotted to a 0.45 µm nitrocellulose membrane. Cell lysates
The CCOC cells lines TOV21G and ES-2 were cultured in MCDB                  were probed with the primary antibodies against PKC-ζ,
131: Media 199(1:1 ratio) and McCoy’s medium, respectively,                 PKC-ι, RhoA, and β-actin (for loading control) and re-probed
supplemented with 10% FBS, 100 units/mL of penicillin, and                  with secondary antibodies for development. Immunoreacted
100 µg/mL of streptomycin. The immortalized normal human                    bands were visualized by enhanced chemiluminescence
endometrial stromal cell line, SHT290, was maintained in F12K:              per the manufacturer’s instructions [Thermo ScientificTM
Media 199 (1:1 ratio) and supplemented with 5% FBS, 0.1%                    SuperSignalTM West Pico PLUS Chemiluminescent Substrate].
Mito+, 2 µg/mL of human insulin, 100 units/mL of penicillin,                Band densitometry was performed with ImageJ FIJI (76) software
and 100 µg/mL of streptomycin. All cell cultures represented                and normalized densities were derived by the ratio of the protein
were passaged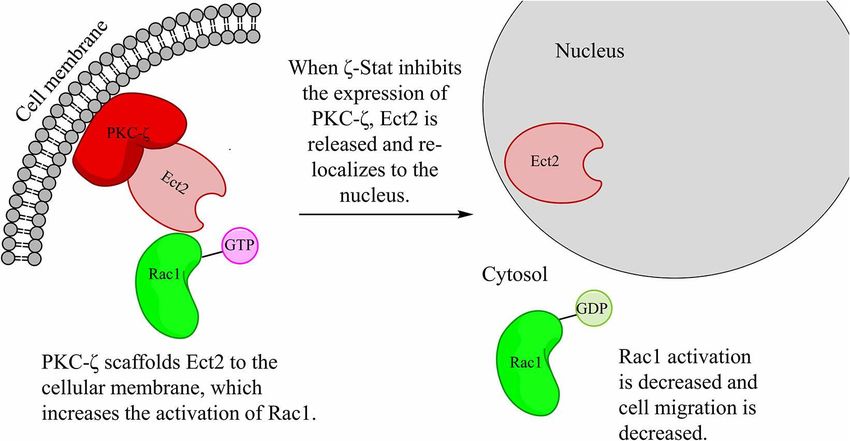
Smalley et al.                                                                                                                    ζ-Stat in CCOC

negative control were performed to determine assay efficiency.           study involved 12 athymic female nude mice weighing between
Briefly, 500 µg of protein were balanced in 200 µL of cell               20–25 g and >10 weeks of age. The 12 mice were divided into
lysis for each sample. The positive control received 200 µM              two groups after TOV21G cells were implanted (1 × 10⁶ cells/per
of non-hydrolyzable guanosine 5′ -O-[gamma-thio] triphosphate            mouse flank in 0.2 mL of media). The first group was the vehicle
(GTPγS) and the negative control received 200 µM of guanosine            control group (N = 6), which received 100 µL of 1x DPBS. The
diphosphate (GDP). These samples were incubated at room                  second group (N = 6) was injected with 100 µL of 20 mg/kg of
temperature (RT) for 15 ms. All samples (positive, negative,             ζ-Stat dissolved in 1x DPBS. The tumor volume was calculated
DMSO control and treatment) were incubated with GST-tagged               using the formula: length × width × width × ½. Three days after
PAK-PBD agarose beads for 1 h 4◦ C. These samples were pelleted          the implantation of the cells, tumors were treated as of day 0. The
at 5,000 × g (at 4◦ C) and washed with Wash Buffer. The pelleted         treatments were administered every other day subcutaneously
beads were re-suspended with 20 µL of 2X Laemmli sample                  intra-tumor and around the tumor site for 35 days.
buffer and boiled at 95◦ C for 2 ms.                                        At the end point of the experiment, tumors and heart serum
                                                                         were harvested. Tumors were imaged and measured, and blood
Preparation of Cytoplasmic and Nuclear                                   serum was analyzed for enzymatic levels of glucose (GLU),
Extracts                                                                 blood urea nitrogen (BUN), alanine aminotransferase (ALT),
TOV21G and ES-2 cells were seeded in 100 mm tissue culture               aspartate aminotransferase (AST), and alkaline phosphatase
plates (1.5 × 10⁵ ). Cells were treated for 72 h with 10 µM ζ-Stat       (ALKP) at the Moffitt Research Facility. Briefly, blood chemistry
(DMSO control) and harvested with trypsin. The instructions              analysis was performed by initially collecting whole blood in a
provided by the manufacturer were followed to fractionate the            serum separator tube, which then sat for 20 ms at RT before
cytoplasmic and nuclear portions. The extracts were analyzed via         centrifugation. Once the blood was centrifuged the serum was
immunoblots and translocation of Ect2 was investigated.                  separated and placed in a specialized sample cup made for
                                                                         the IDEXX CatalystDx. The cup containing the serum and the
Fluorescent Microscopy                                                   desired chemistry slides were then placed into the CatalystDx
TOV21G cells were seeded into 4 chambered slides at a 500                for analysis.
cells per well concentration and after 24 h, were treated with
a vehicle control (DMSO) and 10 µM of ζ-Stat every 24 h                  In-vivo Tumor Fractionation
for 72 h. Cells were then fixed with 4% paraformaldehyde for             Tumors were re-suspended and sonicated in 700 µL of
15 ms and immunostained with Ect2 antibody at 4◦ C overnight             homogenization buffer [Pierce R Immuno Precipitation Lysis
with light agitation. The slides were incubated with Alexa 488           Buffer, 25 mM Tris-HCl pH 7.4, 150 mM NaCl, 1 mM EDTA,
rabbit secondary antibody for 1 h at room temperature RT.                1% NP-40 and 5% glycerol]. The suspension was sonicated
Subsequently, the slides were stained with Phalloidin conjugated         for 3 × 5 s cycles on ice. The tumor suspensions were
to Texas red dye for 30 ms at RT, mounted with solution                  centrifuged at 12,000 × g for 15 min to obtain cell extracts. The
containing 4′ ,6-diamidino-2-phenylindole (DAPI) and imaged              supernatant was removed and protein content was measured
on an Olympus BX53 Digital Upright Fluorescent Microscope.               using Bradford reagents.

Invasion Assay                                                           Statistical Analysis
For the evaluation of invasion, cells were serum starved for 48 h,       R studio software was used for statistical analyses. A one-way
followed by detachment and plating into the upper chamber                ANOVA with a Tukey’s multiple comparisons test was performed
of a 96-well (8 µm) transwell permeable support, coated with             for Western Blot analyses and cell viability. A two-tailed unpaired
0.1X BME. Serum (10%) containing media was loaded into the               student T-test was utilized for the statistical significance of the
lower chamber as a chemoattractant. Subsequently, TOV21G                 particle counts for cell migration and invasion, day to day tumor
cells at the upper chamber were treated with 10 µM of ζ-stat             volume, mouse body weight, and individual enzyme levels. The
for 24 h (N = 4). Two experimental treatment groups for the              Pearson’s Correlation Coefficient (PCC) was utilized for co-
cells were performed: Control (DMSO vehicle) and treatment.              localization and was analyzed using ImageJ FIJI software, using
The invasive cells that passed into the lower chamber were then          the Coloc2 plugin.
fixed with 4% paraformaldehyde, stained with 2% crystal violet
in 2% ethanol, washed with distilled water and photographs were          RESULTS
captured after drying using a light microscope Motic AE31E. For
migration, a similar protocol was followed except without coating
                                                                         PIK3CA and ARID1A Are in the Top
the transwell insert with BME. The assay was quantified with             Mutated Genes in All Ovarian Tissue Types
ImageJ FIJI software.                                                    and in CCOC
                                                                         To understand the genetic landscape of ovarian cancer,
ζ-Stat in-vivo                                                           we utilized the Catalogue of Somatic Mutations in Cancer
The following experiments outline the investigations of ζ-Stat           bioinformatics database (COSMIC) (20). The results
in TOV21G clear cell carcinoma ovarian xenografts. We have               demonstrated that the top mutations in ovarian cancer overall
an Institutional Animal Care and Use Committee (IACUC)                   are TP53 (p53), FOXL2 (Forkhead box protein L2), KRAS
approved by Adrienne Booker for the discussed studies. The               (Kirsten Ras oncogene homolog), PIK3CA (Phosphatidylinositol

Frontiers in Oncology | www.frontiersin.org                          6                                     February 2020 | Volume 10 | Article 209
Smalley et al. ζ-Stat in CCOC
4,5-bispohsphate 3-kinase catalytic subunit alpha), ARID1A (AT- suggest that ζ-Stat is selective to PKC-ζ decreased expression and
rich interaction domain 1A), and BRAF (B-Raf proto-oncogene) could be used to interrupt the PKC-ζ pathways.
(Table 1). The search was then refocused to only contain CCOC
samples and the top two mutated genes found were PIK3CA In-silico Results and Model Validation
(33%) and ARID1A (50%) (Table 2). These results suggest that Model Viability
one of the most common gene mutations in ovarian cancer and RMSD and Rg plots of PKC-ι (Supplemental Figure 1) displayed
CCOC is PIK3CA, which is ∼10% of mutated samples in all asymptotic behavior beyond 7 ns. RMSD appeared to equilibrate
the ovarian tissue in the database. Due to this, the downstream near 2.3 Å, similar to the reported crystallographic resolution of
survival targets PKC-ζ and PKC-ι are likely to be overexpressed, 2 Å (24). Any additional fluctuation is likely from the disordered
amending the need for their explicit targeting. tail regions and missing residues 446–454 as evidenced from the
In addition, the PIK3CA mutation was used to select two cell PKC-ι RMSF plot (Supplemental Figure 2). From these analyses,
lines that would be representative of this mutation in CCOC. Two the MD model is considered viable due to the ability of the
commonly utilized cell lines, TOV21G and ES-2 were selected
based on their genetic profile. While both cell lines possess a
PIK3CA mutation, TOV21G has an ARID1A mutation and ES-2
has a TP53 mutation (Table 2). TABLE 2 | Somatic mutations in CCOC and CCOC cell lines.
Somatic mutations in Somatic mutations in cell lines
Select Inhibitor Effects on PKC-ζ and CCOC
PKC-ι Protein Expression Gene Percent mutation of TOV21G ES-2
To determine which inhibitors affect PKC-ζ and PKC-ι protein samples tested
expression in CCOC, Western Blots were employed with ICA-
1S and ζ-Stat (Figure 1) as potential inhibitors. Initially, the ARID1A 50 ARID1AY551fs*72,Q758fs*75 TP53S241F
expression of these aPKCs were investigated in rapidly growing PIK3CA 33 PIK3CAH1047Y PIK3CA
cells (50%) and cell cycle arrested (serum free, SF) (Figure 2A). TERT 17 KRASG13C
The density of each band was quantified using analytical software. TP53 11 PTENK267fs*9,G143fs*4
The results showed that ICA-1S did not affect PKC-ζ or PKC- KRAS 8
ι protein expression (Figure 2B); however, ζ-Stat substantially
The table below describes the five most common gene mutations in CCOC according to
decreased the expression of PKC-ζ in TOV21G cells (p-value the Catalogue of Somatic Mutations in Cancer database (COSMIC). The gene name and
0.00225, F = 9.5709, t = −4.413) and ES-2 cells (not significant) percent of samples with mutation are listed. The gene mutations for TOV21G CCOC cells
but not PKC-ι protein expression (Figure 2C). These results and ES-2 CCOC cells are listed with specific mutation type.
TABLE 1 | Six most common gene mutations in all ovarian cancers.
Gene Protein Product Protein Function Chromosomal Percent Mutation of Highest Percent Mutation Type
Location Samples Tested Mutation
(human)
Somatic mutations in all ovarian tissue types
TP53 p53 Tumor suppressor, 17p13.1 46 55.89, 20.23 Substitution missense, other
regulates cell cycle
FOXL2 Forkhead box protein L2 Transcription factor 3q23 20 100 Substitution missense
KRAS Kirsten Ras oncogene Regulation of cell division 12p12.1 12 100 Substitution missense
homolog (KRAS
proto-oncogene, GTPase)
PIK3CA Phosphatidylinosital-4,5- Phosphorylates certain 3q26.3 10 96.88 Substitution missense
bisphosphate 3-kinase signaling molecules
catalytic subunit alpha
ARID1A AT-rich interaction domain 1A Regulate transcription by 1p35.3 9 40, 38.26, 23.48 Substitution missense,
altering chromatin deletion frame shift,
structure insertion frame shift
BRAF B-Raf proto-oncogene, This protein plays a role in 7q34 7 97.63 Substitution missense
serine/threonine kinase regulating the MAP
kinase/ERKs signaling
pathway, which affects
cell division, differentiation,
and secretion.
The table below describes the six most common gene mutations in all ovarian cancers according to the Catalogue of Somatic Mutations in Cancer database (COSMIC). The gene
name, protein product, general function, chromosomal location, percent of all samples with mutation, highest type of mutation and most common mutation type are listed.
Frontiers in Oncology | www.frontiersin.org 7 February 2020 | Volume 10 | Article 209Smalley et al. ζ-Stat in CCOC
FIGURE 2 | PKC-ζ and PKC-ι protein expression in rapidly growing and serum starved cells and the effects of ICA-1S and ζ -Stat on PKC-ζ and PKC-ι protein
expression in SHT290, TOV21G, and ES-2 CCOC cell lines. (A) SHT290, TOV21G, and ES-2 cell lines were harvested at 50% and 48 h after serum starvation (SF)
(N = 3). The membranes were probed with anti-PKC-ζ and PKC-ι to investigate protein expression. (B) TOV21G and ES-2 cell lines were treated with 3µM ζ -Stat for
24, 48 and 72 h. An untreated control and vehicle control (DMSO) are also illustrated. The immunoblots were probed with PKC-ζ , PKC-ζ , and β-actin (loading control)
(N = 3). (C) The raw data’s densitometry was quantified using ImageJ software and analyzed with a one-way ANOVA. Standard deviation is represented (**p < 0.01).
model to accurately maintain the lowest energy structure under structure and therefore cannot be used for further modeling.
significant perturbation. Despite this, the ATP binding region is largely stable with RMSF
To date, no crystallographic structure exists of PKC-ζ. As well within reasonable values (Figure 3D). This allows inclusion
such, a homology model was attempted using the Schrödinger of the PKC-ζ homology model ATP binding site with docking
program Prime (28–30) with the human PKC-ζ sequence studies to compare binding modes between PKC-ι and PKC-ζ
(UniProt Q05513) and the crystallized PKC-ι structures as ATP binding sites (Figure 3C—yellow region).
templates. PKC-ι was chosen as the primary template due to The Schrödinger program SiteMap was used for optimizing
its highest sequence identity (49.0%) and homology (53.8%) placement of grids used in the docking studies and to search
given from a BLAST search (77) coupled with highest overall for any other potential binding sites. A possible allosteric
structural resolution. A pre-generated SWISS-MODEL (25–27) site for PKC-ι was identified by SiteMap near residues 397–
homology model was used as a control for structural reference. 400 in the activation segment of the PKC-ι c-lobe consisting
The Prime model (Figure 3C) was identical to the SWISS- of a pocket made by α-helices E and F and the interhelical
MODEL variant, so only the Prime model was used for further loop between α-helices H and I (Figure 3C—magenta region).
analysis. RMSD and Rg plots of the PKC-ζ homology model SiteMap also scores regions based on potential hydrogen
(Supplemental Figure 3) do show asymptotic behavior after bonding, hydrophobicity, and pocket volume. Scores of 0.8 or
1.2 ns, however the RMSD equilibration is averaged to 4.4 Å greater are considered the cutoff for distinguishing between
and is clearly outside any acceptable resolution. The Rg plot drug-binding and non-drug-binding sites. The PKC-ι ATP
also shows a significant expansion indicative of unfolding with site was scored at 1.004 and the potential allosteric site was
internal water infiltration. RMSF plots (Supplemental Figure 4) scored at 0.779. The potential allosteric site score is notably
also show substantial backbone movement beyond 2 Å at regions within SiteMap calibration error and was still included in
of PKC-ζ residues differing from PKC-ι with notable disruption docking studies due to proximity of the pocket with the PKC-ι
of predicted secondary structure. These factors conclude that activation segment and for the possibility of induced fit effects
the homology model does not represent a physical low energy opening the site.
Frontiers in Oncology | www.frontiersin.org 8 February 2020 | Volume 10 | Article 209Smalley et al. ζ-Stat in CCOC FIGURE 3 | Computational modeling results. Binding site characterization for PKC-ι ATP site with co-crystallized ATP shown for reference (A) and the PKC-ι potential allosteric site with ζ -Stat docking result shown for reference (B). SiteMap analysis for each site is also shown (A,B). Yellow volume denotes hydrophobic regions, red volumes demarcate hydrogen bond donor sites, and blue volumes define hydrogen bond acceptor sites. The final homology model structure of PKC-ζ (C) generated is displayed with cartoon ribbons and colored by sequence identity to the PKC-ι reference structure. Blue are identical residues between both structures with cyan highlighting dissimilar amino acids. Red indicates sequence spans with no structural template. The ATP binding region is also delineated by a yellow domain and a magenta domain localizes the suspected allosteric site, both defined by SiteMap. Post-MD RMSD analysis (D) is illustrated with cartoon ribbons colored by RMSD per residue over the length of the simulation. Continuous color shift is used to show residue displacement from original structure with blue representing a minimum of 0 Å RMSD, white representing mid values of 4 Å RMSD, and red representing a maximum of 8 Å RMSD. Consensus docking scores (E–G) are measured in kcal/mol and represent estimated free energies of binding (1G◦ ). Green highlighting features the best scoring molecule for a particular site and yellow highlight focuses the averaged consensus scoring for each compound. Theoretical KD values are calculated from free energies of binding (1G◦ ). VTS results are also listed (H). Docking Results of each technique for a particular model. Error can also be Minimal direct binding data exists for PKC-ι and PKC-ζ so a statistically minimized, yielding a more accurate summary of consensus docking approach was utilized to gauge the optimal ligand binding dispositions and affinities. docking algorithm for the ATP and potential allosteric site. Staurosporine was used as a docking control for the ATP The approach detailed utilizes five different computational site since binding data exists for both PKC-ι [261 nM Ki (78), methods of discerning theoretical binding affinities: two unique values converted from IC50 s] and PKC-ζ [131 nM Ki (79), values scoring functions (SP and XP) for ridged docking methods, converted from IC50 s]. ATP is not used as a docking control due IFD to account for potential induced fit effects, QPLD can to poor model forcefields and lack of direct binding data. resolve polarization effects through QM/MM techniques, and Docking results are summarized in Figures 3E–G. Docking MM/GBSA is superior in clarifying penalties for solvent scores for staurosporine controls are well within reasonable interactions. Employing these functions when little empirical agreement with literature values. Docking scores and poses evidence exists to correlate results helps identify weaknesses for each molecule are nearly identical for the ATP site of Frontiers in Oncology | www.frontiersin.org 9 February 2020 | Volume 10 | Article 209
Smalley et al.                                                                                                                                           ζ-Stat in CCOC

PKC-ι and PKC-ζ and both prefer staurosporine by a significant                         for ζ-Stat having negligible inhibition. ICA-1S activity as a
margin (Figures 3E,F, green highlight). XP scoring consistently                        PKC-ι inhibitor gives some support to the existence of the
yielded scores in closest agreement to literature values and                           potential allosteric site, since modeling suggests that ICA-1S does
highest Pearson correlation to overall averages. IFD and QPLD                          not interact significantly with the ATP site, but does display
have poorer correlation and control accuracy, suggesting a                             binding at concentrations similar to experimental values for
less pronounced influence of charge factors and induced fit                            inducing inhibition. Unfortunately, the data for PKC-ζ is less
effects since including polarization and site flexibility does not                     clear. All the modeling can show is if the two compounds in
increase docking accuracy. MM/GBSA scores exhibit similarly                            question can effectively bind to the ATP site of PKC-ζ. This may
reduced correlation and high variance, entailing that solvent                          indirectly imply an allosteric site exists for PKC-ζ if inhibition
effects are also not likely a major factor for binding; this is                        is experimentally observed and the compound in question does
understandable given the pocket depth. These analyses signify                          not appear to have favorable docking to the ATP site. For ICA-
that the hydrophobic centers of the site (Figure 3A) are the                           1S, there is negligible affinity for the ATP site and experiment
dominant factors in ligand binding with the ATP site for both                          reflects a lack of inhibition. Modeling also suggests an allosteric
models. As opposed to the pan-kinase inhibitor, staurosporine,                         mechanism may be present for ζ-Stat as binding is also negligible
ICA-1S and ζ-Stat display negligible binding with the ATP site.                        for the ATP site. Experimental inhibition should be observed for
    The potential allosteric site was also studied (Figures 3B,G),                     any compounds that compete for the ATP site since there is no
but only for PKC-ι since the corresponding PKC-ζ allosteric site                       significant difference between the ATP sites of PKC-ι and PKC-ζ.
model could not be validated. As such, no conclusions should
be drawn concerning possible interactions of these compounds                           Virtual Target Screening Results
with any potential allosteric sites on PKC-ζ (only the ATP site                        VTS uses a large curated protein structure library to which
achieved an apparent suitable stability for docking studies).                          molecules of interest are docked. Statistical calibrations and
Of the three molecules, the potential allosteric site appears to                       baselines are applied to average and relate docking scores
prefer only ICA-1S with a theoretical KD of 1.4 µM. A recent                           with each individual and class of proteins. A kinase-enriched
study by Ratnayake et al. (19) measured myelin basic protein                           library (1,451 proteins, 464 transferases, and 65 unique kinases)
(MBP) phosphorylation by PKC-ι and PKC-ζ in the presence                               was assigned for docking with the three compounds. A hit
of ICA-1S, ICA-1T (the phosphorylated version of ICA-1S),                              on a protein is classified as the potential (p < 0.05) of
and ζ-Stat. Docking figures match expected activity of PKC-ι                           the molecule of interest to bind to the specified protein

 FIGURE 4 | Cell proliferation and viability of SHT290, TOV21G, and ES-2 CCOC cell lines. (A) SHT290, (B) TOV21G, and (C) ES-2 cells were treated for 0, 24, 48
 and 72 h with 1, 3, 5, and 10 µM ζ -Stat. WST-1 assays were run after 72 h of ζ -Stat treatment (Vehicle control N = 12, treatment N = 3). A standard curve for each
 cell line is also represented. Standard deviation is represented. A one-way ANOVA was tested for the WST-1 assays (*p < 0.05, **p < 0.01).

Frontiers in Oncology | www.frontiersin.org                                       10                                            February 2020 | Volume 10 | Article 209
Smalley et al. ζ-Stat in CCOC
FIGURE 5 | Effects of ζ -Stat on Ect2 localization and RhoA protein and genomic expression. (A) TOV21G cells were seeded on a four-chamber slide and treated for
72 h with 10µM ζ -Stat. The slide was fixed with formaldehyde and immunostained with anti-Ect2, phalldoidin dye, and DAPI. Original magnification is 40X and scale
bar is 20µm. (B) Ect2 is visualized in the filamentous extension of the TOV21G cell. (C) A Western Blot for TOV21G and ES-2 cells treated for 72 h with vehicle control
(DMSO) and 3µM ζ -Stat is represented with an immunoblot that was probed for PKC-ζ and RhoA (N = 3). (D) TOV21G and ES-2 cells were treated for 72 h with
3 µM ζ -Stat and harvested with RNAbee for mRNA semi-quantification. Endpoint PCR was run with RhoA and GAPDH primers (mRNA control) (N = 3).
with a theoretical KD of 10 µM or less. This analysis can Analysis of the PKC-ζ/Ect2/Rac1/RhoA
infer the specificity of a molecule for a particular class of Pathway
proteins. The VTS results for each compound are listed in To determine the downstream effects of ζ-Stat on invasion,
Figure 3H. immunofluorescence, Western Blots and semi-quantitative
The staurosporine control gave an expected baseline endpoint PCR techniques were utilized. Vehicle control
commensurate of a pan-kinase inhibitor. It displayed low to and ζ-Stat treated TOV21G cells were probed with anti-
moderate total protein activity with moderately high interaction Ect2 and imaged. The results showed that Ect2 was
with general transferases and hit a majority of kinases, alluding present in the filamentous extensions in control cell.
a clear preference for kinases. ICA-1S demonstrated a low total After treatment, the polarity of the filamentous extensions
protein activity with a slight but pronounced increase in affinity decreased and Ect2 was found to be more abundant
for transferases and kinases. This suggests a possibility of seeing around the nucleus (Figures 5A,B). Western results
some expected broad kinase interference for ICA-1S. ζ-Stat, demonstrated that 3 µM of ζ-Stat decreased RhoA protein
however, portrays significant specificity in VTS. It has similar expression as well as mRNA expression (Figures 5C,D).
low hit percentages for all protein classes, implying little to no These results suggest that the decrease in PKC-ζ protein
expected kinase activity. expression reduces the expression of RhoA at the
genomic level.
Inhibition of Cell Viability Furthermore, Ect2 localization was observed by
The effects of ζ-Stat on CCOC cellular viability was investigated immunofluorescence with and without treatment. The PCC
via WST-1 methodologies. The results revealed that 10 µM ζ- showed that the control had a lower amount of Ect2 nuclear
Stat did not significantly effect SHT290 normal endometrial localization (0.57) in comparison to the treated (0.72) TOV21G
stromal cells, but did significantly decreased the viability by 37% cells (Figure 6A). In contrast, ES-2 cells had little effect as
in TOV21G cells (p-value 0.0436, F = 4.2461, t = −3.058) both the control and the treated cells had a PCC value of
and by 57% in ES-2 cells (p-value 0.00363, F = 7.2918, t 0.69 (Figure 6B). In addition, the filamentous actin (F-actin)
= −4.220) (Figures 4A–C). These results suggest that ζ-Stat organization was investigated via phalloidin stain. In Figure 6C,
decreases the viability of CCOC but has negligible effects on the F-actin in the control for TOV21G showed filamentous
normal endometrial stromal cells. extensions, whereas in the treated cells, the F-actin seemed
Frontiers in Oncology | www.frontiersin.org 11 February 2020 | Volume 10 | Article 209Smalley et al. ζ-Stat in CCOC
FIGURE 6 | Localization of Ect2. (A) TOV21G and ES-2 cells were probed with anti-Ect2, phalloidin dye and DAPI. The Pearson’s correlation coefficient is represented
in white at the bottom left corner of the merged images. Original magnification is 40× and scale bar is 20µm. (B) A visualization of the organized filamentous actin in
TOV21G cells treated with vehicle control (DMSO). (C) A visualization of Ect2 localization in TOV21G cells treated with 10µM ζ -Stat for 72 h. (D) Nuclear and cytosolic
fractionation of TOV21G and ES-2 cells were treated for 72 h with 10µM of ζ -Stat, Western blotted and immunoblotted with Ect2. Control antibodies used were
β-tubulin (cytosol) and PARP (nucleus).
to aggregate within the cell, rounding the edges. Although Analysis of ζ-Stat in TOV21G Tumor
a nuclear fractionation could not confirm the translocation Xenografts
of Ect2 into the nucleus is TOV21G cells (Figure 6D), it To determine the effects of ζ-Stat in-vivo, we injected athymic
did show that this translocation did occur in ES-2 cells. An nude female mice with TOV21G cells and sequentially treated
explanation for this may be that the ζ-Stat is disrupting the mice for 35 days. At the endpoint of the experiment, the
cell structure causing the cells to become more globular and tumors were harvested, and the blood serum was screened
thereby making the cytosol surround the nucleus in a more for enzymes associated with kidney and liver failure, as well
significant manner. as glucose levels for screening diabetes. Our data exhibited
Moreover, TOV21G cells were treated with 10 µM ζ-Stat statistically significant changes in tumor volume between vehicle
and seeded into 96 welled transwell plates. After 24 h of control and treated mice (Figure 8A) starting on day 14 (p-
treatment, the cells were fixed and stained to determine the value 0.006343, t = 3.4389) up until day 35 (p-value 0.001136,
effects ζ-Stat on invasion and migration. Our data showed t = 4.4827). Results also demonstrated that ζ-Stat decreased
that ζ-Stat drastically decreased invasion and migration when tumor growth by more than 50% by the endpoint of the
compared to the control (Figure 7A). After the images were experiment (Figures 8B,C) and decreased PKC-ζ and RhoA
quantified, the data revealed that the decrease in invasion and expression in tumors by more than 40%. The treatments did
migration was statistically significant (Figures 7B,C; invasion not lower the mouse population’s body weight (Figure 8D)
p-value 0.002826, t = 4.859; migration p-value < 0.001, t = and did not have a significant effect on the enzyme panel
6.1887). To further illustrate this point, Rac1 activation was (Figures 8E,F). These preliminary results suggest that ζ-Stat can
investigated utilizing a GST pull down method. The negative be used for the treatment of CCOC and does not cause short-
and positive control display how well the assay data fits the term toxicity.
intended model (p-value < 0.001, t = 7.675). Compared to
the sample control, the amount of activated Rac1 pulled down ζ-Stat Interrupts the PKC-ζ/Ect2 via PKC-ζ
from treated samples was only 37% (p-value 0.044, t = −3.044; Protein Decrease
Figure 7D). These data reinforce the theory that ζ-Stat decreases Our predicted pathway models that PKC-ζ scaffolds Ect2 to
the invasion and migration of CCOC through a decreased the cellular membrane (Figure 9). This mis-localization of Ect2
activation of Rac1. permits the wild-type Ect2 more access to Rac1 and therefore
Frontiers in Oncology | www.frontiersin.org 12 February 2020 | Volume 10 | Article 209Smalley et al. ζ-Stat in CCOC
increases its activation. Upon increased Rac1 activation, CCOC located on the long arm of chromosome three and in proximity.
invasion is increased. PKC-ζ protein level decrease via ζ-Stat, The ARID1A (1p36.11) is also located up stream of PRKCZ
releases Ect2 from the membrane scaffold, and re-localizes Ect2 (1p36.33) on the short arm of the first chromosome. It has been
to the nucleus, limiting its access to cytosolic Rac1 and decreasing noted that mutations and deficiencies in ARID1A have been
Rac1 activation. shown to sensitize cancers to PARP and PI3K inhibitors (82–84).
Previous literature has suggested that the atypical PKCs and
DISCUSSION their pathways should be the focus of targeted treatment (4).
One explanation for this is that the atypical PKC isoforms
In this study, we discovered that the small molecule inhibitor, have been linked to signaling pathways needed for cancer
ζ-Stat, is a prospective drug candidate to investigate as a novel survival and growth. A study performed by Yao et al. illustrated
potential treatment for CCOC. We also investigated the PKC- the dramatic changes to prostate cells malignancy upon PKC-
ζ/Ect2/Rac1 activation pathway and found that ζ-Stat decreases ζ silencing (85). In our study, when CCOC (TOV21G and
the invasive behavior of CCOC by decreasing cytosolic Ect2 and ES-2) cells grew rapidly and were cell cycle arrested (serum
Rac1 activation. starved), the aPKCs were present in both conditions. However,
the expressions of PKC-ζ and PKC-ι were found to be very
Targeting aPKCs in CCOC low in the normal endometrial stromal cells. These findings
To understand the therapeutic potential of a protein target, there may indicate that CCOC cells have a reliance on aPKC
must be an appreciation of the underlying genetic abnormalities overexpression for cell viability. An interesting complication
specific to the cancer type. The TP53 gene (tumor suppressor in other types of CCOC is that ζ-Stat does not specifically
p53) is the most commonly mutated gene in all ovarian cancers limit expression of PKC-ζ but also effects downstream targets
and is especially a prognostic marker of HGSOC (80). In contrast, in the PKC-ζ/Ect2/RhoA pathway. As shown in Figure 2, ζ-
CCOC typically has a wild type TP53 and mutations in the tumor Stat had a negligible effect on PKC-ζ expression in ES-2 cells,
suppressor ARID1A (81). Although PRKCZ and PRKCI are not however in Figure 5, there was a decrease in RhoA protein
in the top mutated genes in CCOC, PIK3CA is mutated (∼30%) and mRNA expression. This leads to the conclusion that
and is located on the third chromosome’s long arm. Interestingly, ζ-Stat has generalized effect on the pathway dependent on cell
PIK3CA (3q26.32), ECT2 (3q26.31), and PRKCI (3q26.2) are all type. Furthermore, these data support that PKC-ζ/Ect2/RhoA
FIGURE 7 | PKC-ζ regulates invasion and migration of TOV21G ovarian cancer. (A) TOV21G cells were grown, serum starved for 48 h, and placed in the upper
chamber of transwell plate coated with 0.1x BME and serum (10%) containing media was placed in the lower chamber as a chemo attractant. Following treatment
with 10µM ζ -stat for 24 h, cells that invaded through BME and migrated into the lower chamber were stained with crystal violet and observed under microscope.
Original magnification is 10x and scale bar represents 1 mm. (B) Invasion (N = 4) and (C) migration (N = 4) fixed and stained cells on the lower chamber were
quantified using ImageJ FIJI software, average and plotted. Standard deviation error bars are represented. (**p < 0.01, ***p < 0.001). (D) Activated Rac1 (GTP bound)
was pulled down using GST tagged PAK-PBD and analyzed by Western Blot. Densitometry of activated Rac1 bands were plotted (N = 4). Standard deviation error
bars are represented.
Frontiers in Oncology | www.frontiersin.org 13 February 2020 | Volume 10 | Article 209You can also read