ZNF91 deletion in human embryonic stem cells leads to ectopic activation of SVA retrotransposons and up-regulation of KRAB zinc finger gene clusters
←
→
Page content transcription
If your browser does not render page correctly, please read the page content below
Downloaded from genome.cshlp.org on October 30, 2021 - Published by Cold Spring Harbor Laboratory Press

Research

ZNF91 deletion in human embryonic stem cells leads
to ectopic activation of SVA retrotransposons
and up-regulation of KRAB zinc finger gene clusters
Nina L. Haring,1 Elisabeth J. van Bree,1 Whitney S. Jordaan,1 Judith R.E. Roels,1
Gonzalo Congrains Sotomayor,1 Tiziana M. Hey,1 Fred T.G. White,1 Marc D. Galland,1
Marten P. Smidt,1 and Frank M.J. Jacobs1,2
1
 Evolutionary Neurogenomics, Swammerdam Institute for Life Sciences, University of Amsterdam, 1098 XH Amsterdam, The
Netherlands; 2Amsterdam Neuroscience, Complex Trait Genetics, University of Amsterdam, 1098 XH Amsterdam, The Netherlands

        Transposable element (TE) invasions have shaped vertebrate genomes over the course of evolution. They have contributed
        an extra layer of species-specific gene regulation by providing novel transcription factor binding sites. In humans,
        SINE-VNTR-Alu (SVA) elements are one of three still active TE families; approximately 2800 SVA insertions exist in the
        human genome, half of which are human-specific. TEs are often silenced by KRAB zinc finger (KZNF) proteins recruiting
        corepressor proteins that establish a repressive chromatin state. A number of KZNFs have been reported to bind SVAs, but
        their individual contribution to repressing SVAs and their roles in suppressing SVA-mediated gene-regulatory effects re-
        mains elusive. We analyzed the genome-wide binding profile for ZNF91 in human cells and found that ZNF91 interacts
        with the VNTR region of SVAs. Through CRISPR-Cas9-mediated deletion of ZNF91 in human embryonic stem cells, we es-
        tablished that loss of ZNF91 results in increased transcriptional activity of SVAs. In contrast, SVA activation was not observed
        upon genetic deletion of the ZNF611 gene encoding another strong SVA interactor. Epigenetic profiling confirmed the loss of
        SVA repression in the absence of ZNF91 and revealed that mainly evolutionary young SVAs gain gene activation-associated
        epigenetic modifications. Genes close to activated SVAs showed a mild up-regulation, indicating SVAs adopt properties of
        cis-regulatory elements in the absence of repression. Notably, genome-wide derepression of SVAs elicited the communal up-
        regulation of KZNFs that reside in KZNF clusters. This phenomenon may provide new insights into the potential mecha-
        nisms used by the host genome to sense and counteract TE invasions.
        [Supplemental material is available for this article.]

Over the course of evolution, the human genome has been invad-                      species-specific gene expression (Trizzino et al. 2017). In addition,
ed by transposable elements (TEs), which still remain in our ge-                    novel TE insertions can affect gene expression negatively through
nome today as repetitive DNA sequences (Cordaux and Batzer                          the induction of local heterochromatin mediated by KRAB zinc
2009). The majority of TE families have lost the capacity to                        finger (KZNF) proteins and cofactors (Lippman et al. 2004;
copy–paste through accumulation of mutations or active repres-                      Rebollo et al. 2011; Jacobs et al. 2014). Thus, we can conclude
sion by the host. In humans, only elements belonging to Alu,                        that TE insertions can have a long-lasting impact on gene regula-
LINE-1, and SVA families are still capable of retrotransposition                    tion, which continues many millions of years after the spreading
(Kazazian et al. 1988; Batzer et al. 1991; Brouha et al. 2003;                      of novel TE insertions has been halted. Most TE families are si-
Ostertag et al. 2003; Wang et al. 2005). Despite and owing to the                   lenced through binding of members of the KZNF family of which
genome’s efforts to repress TE activity, TE invasions have been                     members coevolved to recognize specific TE families (Wolf and
an important source of evolutionary genomic innovation by creat-                    Goff 2009; Thomas and Schneider 2011; Jacobs et al. 2014;
ing genomic variability and introducing new gene-regulatory                         Najafabadi et al. 2015; Wolf et al. 2015; Schmitges et al. 2016;
properties. Throughout evolution, waves of TE insertions added                      Imbeault et al. 2017; Seah et al. 2019) and recruit KAP1 (Nielsen
a species-specific layer of gene regulation through the introduction                et al. 1999; Sripathy et al. 2006) and repressive epigenetic modifi-
of novel transcription factor (TF) binding sites important for chro-                ers (Schultz et al. 2001, 2002; Turelli et al. 2014). The KZNF family
matin remodeling (Sundaram et al. 2014), immunity (Chuong                           expanded through segmental duplications along the course of evo-
et al. 2016), brain development (Notwell et al. 2015), liver func-                  lution, and most of its members reside in clusters (Huntley et al.
tioning (Trizzino et al. 2017, 2018), and stem cell pluripotency                    2006; Thomas and Schneider 2011). How KZNFs sense the inva-
(Kunarso et al. 2010; Pontis et al. 2019). Profiling of enhancer-                   sion of new TEs and mediate a response to control their spread re-
associated histone marks (H3K27ac and H3K4me1) in liver cells                       mains elusive. Recently, it has been shown that derepression of TEs
derived from six primate species revealed that young TEs account                    leads to up-regulation of KZNFs, potentially induced through an
for most of the newly evolved cis-regulatory elements that drive                    innate immune response (Kauzlaric et al. 2017; Tao et al. 2018;
                                                                                    Tie et al. 2018). The mechanism behind this and the consequences

Corresponding author: F.M.J.Jacobs@uva.nl
Article published online before print. Article, supplemental material, and publi-   © 2021 Haring et al. This article, published in Genome Research, is available un-
cation date are at https://www.genome.org/cgi/doi/10.1101/gr.265348.120.            der a Creative Commons License (Attribution-NonCommercial 4.0 Internation-
Freely available online through the Genome Research Open Access option.             al), as described at http://creativecommons.org/licenses/by-nc/4.0/.

31:1–13 Published by Cold Spring Harbor Laboratory Press; ISSN 1088-9051/21; www.genome.org                                        Genome Research                1
                                                                                                                                      www.genome.org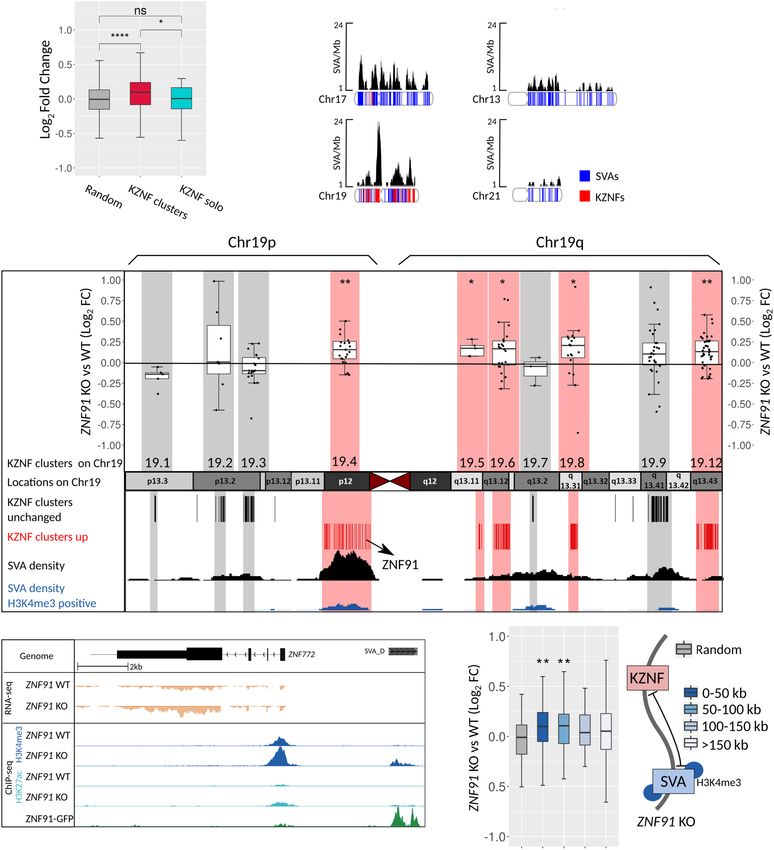
Downloaded from genome.cshlp.org on October 30, 2021 - Published by Cold Spring Harbor Laboratory Press

Haring et al.

of the up-regulation of KZNFs remain to be established. In addi-         (Fig. 1E). To determine the core sequence bound by ZNF91, we dis-
tion, it is becoming increasingly clear that the function of KZNFs       covered two motifs on either side of the VNTR region within the
is not limited to TE repression. Several other roles have been attrib-   SVA. The motifs are partly overlapping on a VNTR-derived se-
uted to specific KZNFs, such as autoregulation by binding to itself      quence, indicating that ZNF91 predominantly binds to the
and/or other members of the KZNF family (Frietze et al. 2010; Yan        VNTR region of SVAs (Fig. 1D,F). The observed high level of
et al. 2017), gene regulation (Oleksiewicz et al. 2017; Yang et al.      ZNF91 ChIP coverage between the two ZNF91 peak summits sug-
2017; Chen et al. 2019; Farmiloe et al. 2020), and maintenance           gests that ZNF91 binds to multiple locations throughout the
of DNA methylation at imprinting control regions (Li et al. 2008;        VNTR region (Fig. 1E; Supplemental Fig. S1D). Many of the SVAs
Takahashi et al. 2015, 2019; Riso et al. 2016).                          not bound by ZNF91 are shorter or truncated, suggesting that
      In this study we focus on a primate-specific TE class, named       the lack of ZNF91 binding is likely caused by the absence of that
after its composite domains: SINE-VNTR-Alu (SVA). There are ap-          part of the SVA that contains the ZNF91 binding site (Fig. 1G).
proximately 2800 fixed SVA insertions in the human genome,               Collectively, these data support earlier findings pointing toward
half of which were inserted in our genome after the split with           a major role of ZNF91 in SVA repression.
the last common ancestor (LCA) with chimpanzees and are there-
fore unique to humans (Wang et al. 2005). Several lines of evi-
dence showed that SVA insertions harbor a strong gene-                   SVAs become epigenetically and transcriptionally active
regulatory potential (Savage et al. 2013, 2014; Jacobs et al. 2014;      in the absence of ZNF91
Pontis et al. 2019) and can function both as transcriptional activa-     To determine the fate of SVAs in the absence of ZNF91, we genet-
tors and repressors (Trizzino et al. 2017, 2018; Pontis et al. 2019).    ically deleted ZNF91 in human embryonic stem cells (hESCs) using
Although the primate-specific ZNF91 was identified as a strong re-       CRISPR-Cas9 technology. RNA-sequencing analysis of three inde-
pressor of SVA activity (Jacobs et al. 2014), it remained unclear to     pendent clonal ZNF91 knockout (KO) hESC lines confirmed the
what extent ZNF91 binds to SVAs and if ZNF91 is sufficient for           absence of ZNF91 transcripts (Fig. 2A). Whereas SVAs are efficient-
SVA repression in a human-cellular environment. Moreover, a re-          ly silenced in hESCs under normal conditions, SVAs became tran-
cent study showed that a number of other KZNF proteins also              scriptionally active in ZNF91 KO cells. Most SVAs showed only
bind SVAs (Imbeault et al. 2017), raising the possibility that multi-    modest transcriptional activation in the absence of ZNF91; differ-
ple KZNFs are necessary to silence SVAs. Here, we assessed the role      ential expression analysis revealed 173 significantly up-regulated
of ZNF91 in repressing SVAs by mapping its binding sites and cre-        SVA transcripts in ZNF91 KO versus wild-type (WT) cells (Fig.
ating a genetic deletion of ZNF91 in human embryonic stem cells.         2B). Analysis of the transcript structure revealed that many SVAs
The data described here elucidate the gene-regulatory role of SVAs       generate transcripts that run from start (5′ ) to end (3′ ) of the ele-
under conditions in which epigenetic repression is lost.                 ment. However, we also identified 10 SVAs that generated tran-
Furthermore, our findings strengthen previous observations re-           scripts that extend into the downstream sequence (up to 150 kb)
garding TE-mediated communal up-regulation of KZNF clusters              generating large lncRNAs (Fig. 2C; Supplemental Table S1).
(Kauzlaric et al. 2017; Tie et al. 2018; Pontis et al. 2019), which            To determine the epigenetic fate of SVAs in the absence of
may deepen our understanding of how KZNFs act in the presence            ZNF91-mediated repression, we performed chromatin immuno-
of unrepressed TEs in our genome.                                        precipitation for the repressive epigenetic mark H3K9me3,
                                                                         which is present on the majority of TEs including SVAs under
                                                                         normal conditions in hESCs (Fig. 3A; Supplemental Fig. S2). By
Results                                                                  ChIP-qPCR we observed an approximate threefold decrease of
                                                                         H3K9me3 signal on SVAs in ZNF91 KO cells compared to WT cells
ZNF91 binds at the Alu-VNTR border of the vast majority of SVAs          (Fig. 3B). This indicates that in the absence of ZNF91, SVAs lose
To determine genome-wide binding of ZNF91, we transfected                their epigenetic repressive marks. We next assessed whether loss
HEK293 cells with a ZNF91-GFP fusion construct and performed             of epigenetic repression in ZNF91 KO cells is accompanied by
GFP chromatin immunoprecipitation followed by sequencing                 gain of epigenetic activation by analyzing the presence of epige-
(ChIP-seq) (Supplemental Fig. S1A,B). Two independent ChIP-              netic marks associated with an active chromatin state. We focused
seq replicates revealed 8302 and 16,425 high-confidence binding          on the enhancer/promoter associated marks H3K4me3 and
sites for replicate 1 and 2, respectively (Supplemental Fig. S1C).       H3K27ac and assessed their genome-wide distribution by ChIP-
For further analysis, 7220 ZNF91 peaks that were shared between          seq in ZNF91 KO and WT hESCs. H3K4me3 is mainly found at
both replicates were considered.                                         transcription start sites (TSSs) and is associated with active tran-
      First, we analyzed binding sites with the strongest ZNF91 en-      scription (Bernstein et al. 2005), whereas H3K27ac histone modifi-
richment (top 10% based on MACS score) to determine to which             cations are associated with active enhancers and promoters (Wang
genomic regions ZNF91 preferentially binds. This analysis revealed       et al. 2008; Creyghton et al. 2010). In ZNF91 KO hESCs, 29.2% of
that 85% of the strongest enriched sites reside within SVAs, indi-       SVAs became H3K4me3 positive compared to 0.8% in WT hESCs
cating that they are the primary target of ZNF91 (Fig. 1A).              (Fig. 3C). H3K27ac was detected at 6% of SVAs in ZNF91 KO
Genome-wide, the majority (88%) of SVAs is bound by ZNF91                hESCs, and nearly all of these were also H3K4me3 positive (Fig.
(Fig. 1B), which was seen for all subclasses (Fig. 1C). Therefore,       3C). We noticed that the level of epigenetic activation of SVAs
ZNF91 does not seem to have a clear preference for evolutionary          roughly correlates with their evolutionary age: predominantly
old or younger SVAs. ZNF91 binding was highest at the Alu-               the youngest classes of SVAs (SVA-D/E/F) gained an H3K4me3
VNTR border within SVAs, at the same location where KAP1 shows           mark upon ZNF91 deletion, with 92% of SVA-E and 65% of SVA-
the highest level of binding (Fig. 1D). Fifty-nine percent of ZNF91-     F elements displaying signs of epigenetic activation (Fig. 3D).
bound SVAs showed a second smaller ZNF91 peak at the other side          The H3K4me3 peak colocalizes with the 5′ peak of ZNF91 binding,
of the VNTR, at the VNTR-SINE border (Fig. 1D,E). This second            suggesting that ZNF91 binds to the domain that is also important
ZNF91 binding site was observed mainly for young SVA subclasses          for the activation of the SVA (Fig. 3E). Furthermore, H3K4me3-

2    Genome Research
       www.genome.org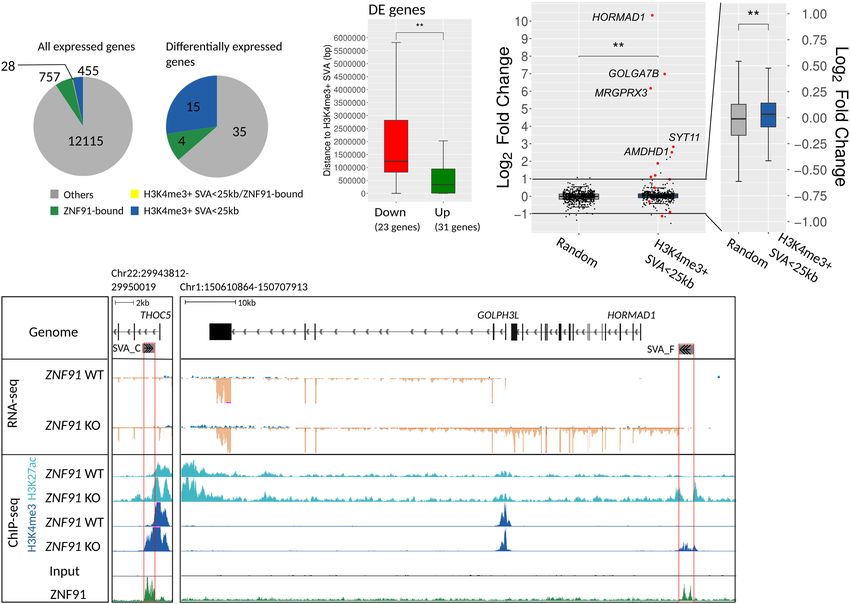
Downloaded from genome.cshlp.org on October 30, 2021 - Published by Cold Spring Harbor Laboratory Press
SVA activation induces up-regulation of KZNFs
A B C for both H3K4me3 and H3K27ac are
located significantly closer to expressed
genes than their H3K4me3-positive
and H3K4me3/H3K27ac-negative coun-
terparts (Fig. 3G). Recently, a ChIP-exo
screen, including more than 200 KZNF
proteins, revealed that ZNF611 also binds
SVAs, although to a lesser extent than
ZNF91. Fifty-eight percent of SVAs is
bound by ZNF611, and SVA-A and SVA-
D F are bound most frequently (Supple-
mental Fig. S3A,B; Imbeault et al. 2017).
Because both ZNF91 and ZNF611 are ex-
pressed in hESCs, we generated ZNF611
KO lines to assess the role of ZNF611 in
repressing SVAs (Supplemental Fig.
S3C). To account for possible redundan-
cy of both KZNF proteins, also ZNF91/
ZNF611 double KO (dKO) cell lines were
created and analyzed (Supplemental
Fig. S3C). RNA-seq revealed no transcrip-
E F tional activation of SVAs upon ZNF611
deletion (Supplemental Fig. S3D,E). No
additional effect on SVA transcriptional
activation was observed in ZNF91/
ZNF611 dKO cells, indicating there is
no functional redundancy or compensa-
tion between ZNF91 and ZNF611 (Sup-
plemental Fig. S3D,E). In conclusion,
G our data reveal that ZNF91, but not
ZNF611, is essential for SVA repression
in hESCs. In the absence of ZNF91-
mediated repression, SVAs lose epi-
genetic repression, become aberrantly
transcribed, and bear histone marks asso-
ciated with active chromatin.
SVAs function as gene regulators in the
absence of repression
Figure 1. ZNF91 binds at the Alu-VNTR and VNTR-SINE border of all SVA subclasses. (A) Pie chart show- SVAs are shown to harbor strong gene-
ing the distribution of the top 10% ZNF91 peaks based on MACS score. (B) Pie chart showing the number regulatory properties (Savage et al.
of SVA elements that are bound (green, 2545) and not bound (gray, 338) by ZNF91. (C) Frequency plot 2013, 2014; Jacobs et al. 2014; Trizzino
showing fraction of SVA subclasses bound by ZNF91 (green). (D) Schematic of SVA-D with different do-
mains indicated. A pile-up of KAP1 summits on the SVA-D consensus is displayed in blue (Jacobs et al. et al. 2017, 2018; Pontis et al. 2019). To
2014), and a representative example of ZNF91 coverage on an SVA-D is in green. Two ZNF91 binding provide further support for this, we ana-
motifs were identified localizing to the Alu-VNTR border and VNTR-SINE border. The fraction of SVA el- lyzed whether human genes with an
ements that contain motif 1 in the peaks localizing to the Alu-VNTR border and motif 2 in the peaks lo- SVA nearby showed differential gene ex-
calizing to the VNTR-SINE border are expressed in percentages. (E) Heatmap and profile plots of ZNF91
pression compared to the orthologous
ChIP showing coverage in RPKM of the mean of replicates 1 and 2 with SVA center as reference point.
Average signal plotted per SVA subclass. (F) Comparison of motifs 1 and 2 showing overlap at the center. genes in the rhesus macaque monkey,
(G) Length of SVA elements bound (2546, green) and not bound (gray) by ZNF91. Light gray indicates which is a species that lacks SVAs
that at least one of the two SVA binding motifs (199) was present, and dark gray indicates that no motif completely. This was done in human
was detected (139). For statistical testing, an unpaired Wilcoxon rank-sum test was used followed by an
and rhesus ESC lines by comparing
FDR correction: (∗∗∗∗ ) P < 0.0001.
gene expression profiles throughout hu-
man and rhesus neuronal differentiation
(Field et al. 2019). This comparative anal-
negative SVAs were shorter than their H3K4me3-positive counter- ysis revealed that on average, genes that had a nearby SVA inser-
parts, indicating that shorter elements, likely owing to shorter tion in the human lineage, were more likely to display a higher
VNTRs, have fewer domains required for activation (Fig. 3F). expression level in humans compared to rhesus (Supplemental
Next, we assessed whether SVA insertions located in tran- Fig. S4A,B), indicating an enhancing effect of the SVA insertions
scriptionally active regions were more likely to become activated on gene regulation.
upon ZNF91 deletion. To this end, we looked at the distance be- We next examined gene expression changes potentially
tween activated SVAs and genes expressed in hESCs. SVAs positive caused by activated SVAs in ZNF91 KO hESCs. Genes located in
Genome Research 3
www.genome.org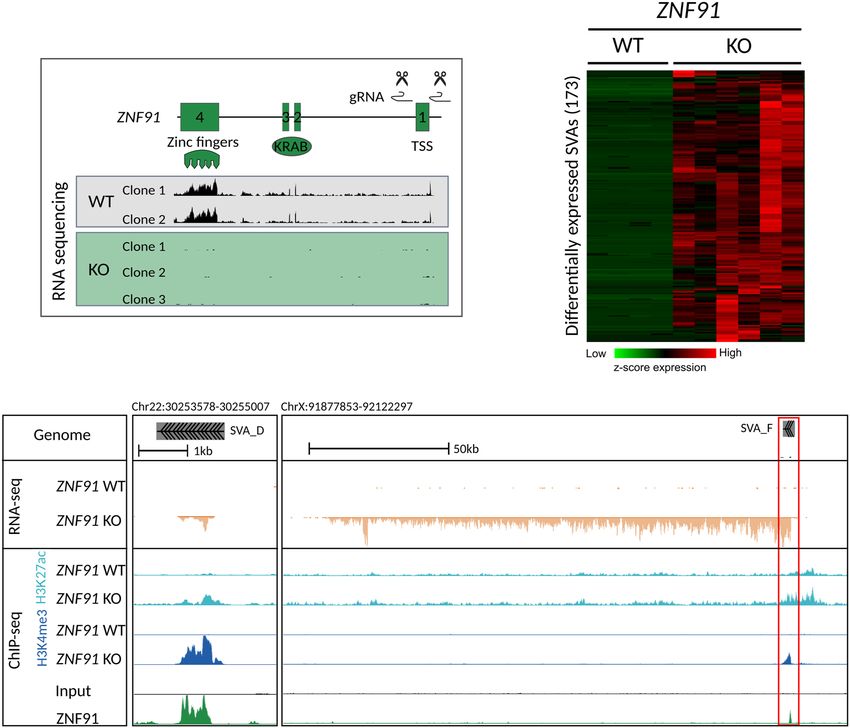
Downloaded from genome.cshlp.org on October 30, 2021 - Published by Cold Spring Harbor Laboratory Press

Haring et al.

               A                                                                              B

               C

Figure 2. SVA elements become transcriptionally active in the absence of ZNF91. (A) CRISPR-Cas9 design to delete 172 bp around the transcription start
site (TSS) of ZNF91 and RNA-sequencing coverage tracks showing absence of ZNF91 expression in ZNF91 KO clonal hESC lines. (B) Heatmap of hierarchical
clustering (Euclidean distance) using Z-score of scaled counts of SVA elements that are up-regulated in ZNF91 KO hESCs (defined as log2 fold change ≥ 3).
(C ) Coverage of RNA-seq and H3K4me3 and H3K27ac ChIP-seq data for ZNF91 WT and KO hESCs and ZNF91-GFP ChIP on HEK293 cells: (left) transcripts
running from 5′ to 3′ end of SVA; (right) red box indicates SVA element as driver of lncRNA. RNA-seq coverage tracks were scaled using DESeq2 scaling
factors. ChIP-seq coverage tracks were scaled based on control regions.

proximity of an H3K4me3-positive SVA were overrepresented                      through de novo transcript assembly is the SVA-HORMAD1 fusion
(Fisher’s exact test, P < 0.00001) among 54 differentially expressed           transcript. HORMAD1 is normally exclusively expressed in the tes-
genes. The vast majority (13/15) of differentially expressed genes             tis, but aberrantly induced in hESCs upon ZNF91 deletion (Fig.
within 25 kb of an SVA was up-regulated (Fig. 4A; Supplemental                 4D). In the expressed sequence tags (EST) database we found
Table S1). Furthermore, significantly up-regulated genes are locat-            ESTs that covered this fusion transcript, indicating that SVA-
ed closer to H3K4me3-positive SVAs compared to down-regulated                  HORMAD1 fusion transcripts also exist in a (patho-) physiological
genes (Fig. 4B). In addition, genes located within a 25-kb window              context (Supplemental Fig. S4C).
from an H3K4me3-positive SVA showed a mild, but significant,                         In line with what is observed for other KZNF proteins
up-regulation compared to a group of randomly selected genes                   (Imbeault et al. 2017; Farmiloe et al. 2020), ZNF91 also binds to ge-
(Fig. 4C). Together this further confirms that derepressed SVAs                nomic regions outside SVAs. We found that ZNF91 binds to 1062
have a positive regulatory effect on the expression of nearby genes.           gene promoters. However, differential gene expression analysis us-
Besides potentially functioning as classical enhancers, we ob-                 ing RNA-seq data of ZNF91 KO hESCs revealed no collective ex-
served that some of the up-regulated genes had an activated SVA                pression changes of ZNF91-bound genes in hESCs (Supplemental
near their TSSs, of which the H3K4me3 signal in the ZNF91 KO                   Fig. S4D). Even if we only consider ZNF91 peaks in promoters
cells extended the H3K27ac and H3K4me3 signal that is present                  that overlap with KAP1 binding in hESCs (Supplemental Fig.
in the gene promoter under normal conditions (Fig. 4D;                         S4E), we find no evidence for a direct regulatory role of ZNF91
Supplemental Table S1). Some activated SVAs become alternative                 on the promoters where it binds independently of SVAs
TSSs in ZNF91 KO cells, generating chimeric SVA-gene transcripts               (Supplemental Fig. S4F). Therefore, our data suggest that the
with the genes that are located downstream (Supplemental Table                 main role of ZNF91 is to repress SVA transcriptional activity and
S1). Of the 15 differentially expressed genes located within 25 kb             the SVA-mediated gene-regulatory potential as a result of the pro-
of an H3K4me3 marked SVA 7 functioned as alternative TSS. An ex-               pensity of SVAs to gain activating epigenetic marks in the absence
ample of an alternative ectopically expressed transcript identified            of repression.

4    Genome Research
        www.genome.org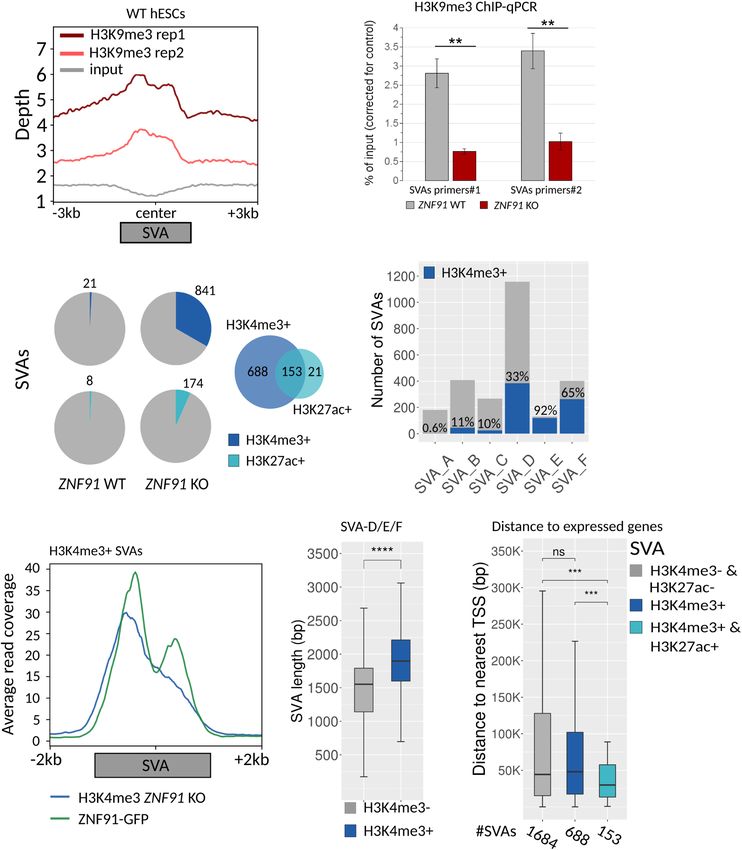
Downloaded from genome.cshlp.org on October 30, 2021 - Published by Cold Spring Harbor Laboratory Press
SVA activation induces up-regulation of KZNFs
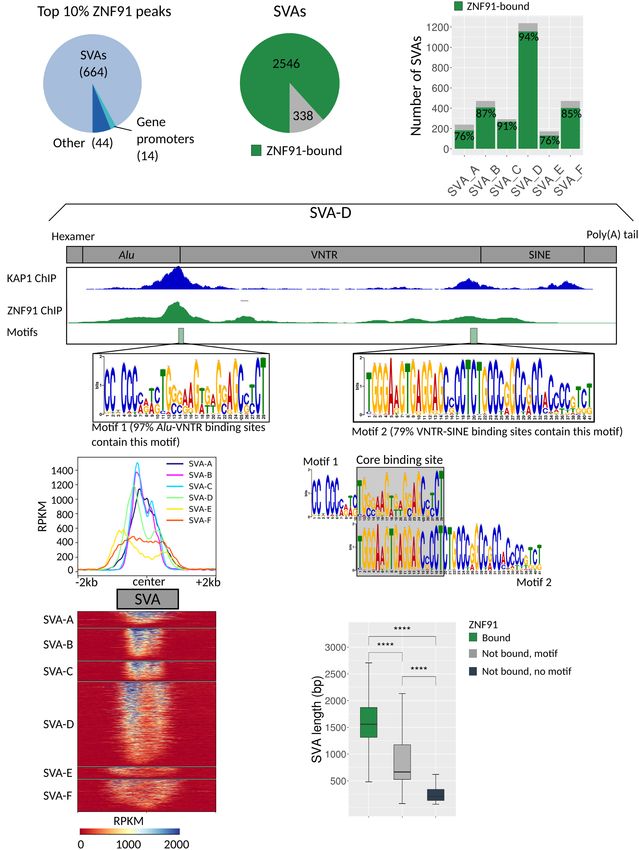
A B density of SVAs (Fig. 5B), which is
highest in the areas where the up-regulat-
ed KZNF clusters reside. A proportion
of SVAs in these clusters become
H3K4me3 positive upon ZNF91 deletion
(Fig. 5C). This suggests that the collective
up-regulation of KZNFs may be a conse-
quence of activated SVA insertions in
close vicinity of KZNFs (Fig. 5D). This is
further supported by the fact that only
KZNFs within 100 kb of an H3K4me3-
C D positive SVA showed an up-regulation
that was significant compared to a set
of randomly selected genes (Fig. 5E).
This regulatory effect was restricted to
KZNFs because other genes located inside
KZNF clusters on Chromosome 19 do not
show a collective up-regulation (Supple-
mental Fig. S5A). An alternative possibil-
ity is that KZNFs are regulated by ZNF91
directly through ZNF91 binding to their
E F G promoters. However, for the KZNFs that
showed evidence for ZNF91 binding in
their promoter, even after reducing the
threshold of ZNF91-peak detection,
ZNF91 binding did not correlate with dif-
ferential expression upon ZNF91 KO
(Supplemental Fig. S5B,C), in line with
what was observed for other ZNF91-
bound genes (Supplemental Fig. S4D,F).
This suggests that, although we cannot
fully rule this out, up-regulation of KZNFs
does not seem to be mediated by loss of
ZNF91 binding to their promoters. This
Figure 3. Evolutionarily young SVA elements become epigenetically active in the absence of ZNF91. provides further circumstantial support
(A) Profile plots showing coverage of H3K9me3 centered on SVA elements in WT hESCs, and 3 kb up- for the hypothesis that KZNF up-regula-
stream of and downstream from SVAs is displayed. (B) H3K9me3 ChIP-qPCR on ZNF91 WT and KO tion is mediated by derepressed SVAs in
hESCs using two SVA primer pairs. Percentage of input was normalized against a control (LTR12). A the KZNF clusters, although we were not
one-sided, unpaired t-test was used for statistical analysis. (C) Pie charts showing number of H3K4me3
(dark blue) and H3K27ac (light blue) positive SVA elements in ZNF91 WT and KO hESCs; Venn diagram
able to provide conclusive evidence for
showing overlap of H3K4me3 and H3K27ac peaks. (D) Absolute number (gray) and percentage of this. A few studies have linked KZNF up-
H3K4me3-positive (blue) SVA elements in each subclass. (E) Profile plot showing ZNF91 ChIP signal in regulation to the induction of an innate
HEK293 cells and H3K4me3 signal in ZNF91 KO hESCs. Average read coverage on H3K4me3-positive immune response by retroviral transcripts
SVAs was displayed 2 kb upstream of and downstream from the element. (F ) Box plot showing length
(Li et al. 2018; Tie et al. 2018). However,
of H3K4me3-positive and -negative SVA subtypes D, E, and F. (G) Box plots showing distance from
H3K4me3/H3K27ac-negative, H3K4me3-positive, and H3K4me3/H3K27ac-positive SVA elements to we found no significant up-regulation of
nearest TSS of a gene expressed in hESCs (baseMean > 10) in base pairs. Outliers are not displayed. genes associated with a response to viral
For statistical testing in F and G, an unpaired Wilcoxon rank-sum test was used, for G followed by an infections in ZNF91 KO hESCs (Supple-
FDR correction: (∗∗∗∗ ) P < 0.0001; (∗∗∗ ) P < 0.001; (∗∗ ) P < 0.01; (ns) not significant. For H3K4me3 and mental Fig. S5D). Although the mecha-
H3K27ac ChIP analyses, only SVA elements bound by ZNF91 were included.
nism remains elusive, our results are in
line with previous studies reporting a sim-
Up-regulation of SVA-dense KZNF clusters upon ZNF91 deletion ilar up-regulation of KZNFs in response to loss of KAP1-mediated re-
pression of TEs (Kauzlaric et al. 2017; Tie et al. 2018). Whether or
Although only 54 differentially expressed genes met the stringent not derepressed SVAs are mediating those observed effects remains
statistical threshold of the DESeq2 analysis, we noticed a modest to be established, but our findings show a possible trace of a feed-
collective up-regulation of KZNFs in ZNF91 KO cells compared to back mechanism through which our genome senses the presence
WT. The differential expression was limited to KZNFs located in of uncontrolled TEs, where up-regulation of KZNFs may be the pio-
clusters of KZNFs, but solitary KZNFs were unaffected (Fig. 5A). neering response to counteract their invasion.
KZNF clusters are found on a number of chromosomes and vary
in the amount of KZNFs per cluster. The KZNF density on Chromo-
some 19 is very high, harboring many KZNF clusters and a high
Discussion
number of KZNFs (Fig. 5B). A subset of these clusters shows a col- Here, we describe the genome-wide effects of genetic deletion of
lective up-regulation in the absence of ZNF91 (Fig. 5C). Remark- ZNF91, which binds to SVAs, one of the few currently active TEs
able is that Chromosome 19 also shows an exceptionally high in our genome. We show that SVAs become derepressed upon
Genome Research 5
www.genome.orgDownloaded from genome.cshlp.org on October 30, 2021 - Published by Cold Spring Harbor Laboratory Press
Haring et al.
A B C
D
Figure 4. Differentially expressed genes in ZNF91 KO cells are bound by ZNF91 and driven by activated SVA elements. (A) Pie charts of all expressed
(baseMean > 10) and differentially expressed (DE) genes (DESeq2 analysis, Padj < 0.05) indicating how many genes are bound by ZNF91 at their promoter
(green), located within 25 kb of an H3K4me3-positive SVA (blue), both (yellow), and neither (gray). (B) Box plots of distance to nearest H3K4me3-positive
SVA from TSS of DE genes (23 genes down-regulated and 31 up-regulated). (C ) Box plots showing log2 fold change of genes that are located within 25 kb
of an H3K4me3-positive SVA (420 genes) compared to a set of randomly selected genes (556 genes). Red data points indicate genes that were differentially
expressed (FDR < 0.05). Only expressed genes (baseMean > 10) were included in this graph. (D) Coverage tracks of RNA-seq (blue is transcription from the
positive strand, and orange is from the negative strand) and ChIP-seq data: (left) activation of an intronic SVA-C results in extension of H3K4me3 and
H3K27ac signals at the promoter, leading to increased expression of THOC5; (right) activation of an SVA-F upstream of HORMAD1 leads to generation
of an SVA-HORMAD1-GOLPH3L fusion transcript. Red boxes indicate activated SVA elements. RNA-seq coverage tracks were scaled using DESeq2 scaling
factors. ChIP-seq coverage tracks were scaled based on control regions. For all statistical testing, an unpaired Wilcoxon rank-sum test was used, if necessary,
followed by an FDR correction: (∗∗ ) P < 0.01.
genetic deletion of ZNF91, but not by deleting ZNF611. In addi- ditions that affect the epigenetic status of our genome such as can-
tion, our data confirm previous observations that suggested a hid- cer and aging-associated diseases (Bollati et al. 2009; Szpakowski
den gene-regulatory potential of SVAs in our genome (Savage et al. et al. 2009; Jintaridth and Mutirangura 2010; Barchitta et al.
2013, 2014; Jacobs et al. 2014; Trizzino et al. 2017; Pontis et al. 2014). As an example, we showed that in the absence of ZNF91-
2019). Loss of ZNF91 leads to derepression of the majority of mediated repression, SVAs drive the expression of a chimeric
SVAs in our genome, but among individual SVA insertions we ob- HORMAD1 transcript in hESCs, a gene exclusively expressed in
served a large variation in the levels of epigenetic and transcrip- the testis. HORMAD1 is found to be aberrantly expressed in various
tomic signatures associated with the ectopic activation of SVAs. types of cancer (Shahzad et al. 2013; Watkins et al. 2015; Nichols
Derepressed SVAs occasionally generate SVA-gene fusion tran- et al. 2018). Further analyses of RNA-seq and histone ChIP data of
scripts. This phenomenon called exonization is also observed for these cancer cells could point out if pathological derepression of
some other TE classes (Faulkner et al. 2009; Hancks et al. 2009; SVAs is the cause of ectopic HORMAD1 expression in cancers.
Pontis et al. 2019). By gaining a novel TE-derived promoter, such Our data suggest that despite the ability of multiple KZNF pro-
TE-gene fusion transcripts may display highly different character- teins to bind to SVAs, including ZNF611, genetic deletion of
istics from the native transcripts regarding developmental timing ZNF91 is sufficient to elicit derepression of the majority of SVAs
and cell type specificity. That this phenomenon can occur under in our genome. We further show that although ZNF611 binds to
normal conditions is evidenced by many reports of de novo SVA all SVA subclasses, genetic deletion of ZNF611 in hESCs does not
insertions leading to disease through mRNA dysregulation and al- lead to SVA derepression. We cannot rule out, however, that
ternative splicing (Kobayashi et al. 1998; Wilund et al. 2002; Deng ZNF611 or any of the other SVA-interacting KZNFs, contribute to
et al. 2008; Van der Klift et al. 2012; Nakamura et al. 2015). In ad- H3K9me3 deposition and SVA repression in other cell types or dur-
dition, our data show that epigenetic activation of SVAs can lead to ing different developmental stages. A recent report shows that
gene dysregulation. This is in line with previous studies showing a ZNF611 is capable of repressing H3K27ac-positive SVAs upon over-
global derepression of young TEs under pathological cellular con- expression in naive hESCs (Pontis et al. 2019). This raises the
6 Genome Research
www.genome.orgDownloaded from genome.cshlp.org on October 30, 2021 - Published by Cold Spring Harbor Laboratory Press
SVA activation induces up-regulation of KZNFs
A B
C
D E
Figure 5. Up-regulation of clustered KZNF genes in proximity of activated SVA elements. (A) Box plots showing log2 fold change of a random gene set
(257), KZNF located in clusters (265), and solitary KZNF genes (38). Clusters and solitary KZNF were defined by Thomas and Schneider (2011). Only genes
with a baseMean > 10 were included. (B) SVA coverage (SVA/Mb) is shown for Chromosomes 17 and 19 with higher SVA density than expected and
Chromosomes 13 and 21 with lower SVA density than expected (based on Wang et al. 2005). Chromosome density plots show distribution of SVA elements
(blue) and KZNF genes (red). (C) Schematic representation of Chromosome 19 showing the location of KZNF clusters. Box plots of log2 fold changes on top
show if clusters are up-regulated (red) or unchanged (gray). Only genes with baseMean > 10 were included. Number of expressed genes per cluster: 19.1 =
9 genes, 19.12 = 42 genes, 19.2 = 7 genes, 19.3 = 20 genes, 19.4 = 23 genes, 19.5 = 5 genes, 19.6 = 24 genes, 19.7 = 3 genes, 19.8 = 19 genes, 19.9 = 26
genes. Coverage tracks show SVA/Mb for all SVA elements (black) and H3K4me3-positive SVA elements (blue). (D) Coverage of RNA-seq and ChIP-seq
(H3K4me3 and H3K27ac) on ZNF91 WT and KO hESCs and ZNF91 in HEK293 cells showing ZNF772 and upstream SVA-D. RNA-seq coverage tracks
were scaled using DESeq2 scaling factors. ChIP-seq coverage tracks were scaled based on control regions. (E) Box plots showing log2 fold change of
KZNF grouped per distance to nearest SVA that gained H3K4me3 upon ZNF91 deletion (random = 88 genes, 0–50 kb = 112 genes, 50–100 kb = 60 genes,
100–150 = 46 genes, >150 kb = 85 genes). For all analyses only expressed (baseMean > 0) genes were included. For all statistical testing an unpaired
Wilcoxon rank-sum test was used, followed by an FDR correction: (ns) P > 0.05; (∗ ) P < 0.05; (∗∗ ) P < 0.01; (∗ ∗∗∗ ) P < 0.0001.
possibility that in primed hESCs that were used in our study, en- mutations are found in genomes but according to gnomAD “the
dogenous ZNF611 expression levels are too low to repress SVAs variant annotation and/or quality of these calls is dubious.” (See
effectively. Karczewski et al. 2020.) Similar sporadic low-confidence LOF mu-
The ZNF91 gene is fixed in the human population, and based tations are found in any essential gene. The absence of null alleles
on 250,000 genomes included in the gnomAD database of genetic indicates that ZNF91 is an essential gene in humans, despite its re-
variants, no homozygous null mutations exist in the human pop- cent emergence in primate genomes. Furthermore, there is no ev-
ulation. Sporadically, low-confidence loss-of-function (LOF) idence of aberrant ZNF91 expression levels being associated with
Genome Research 7
www.genome.orgDownloaded from genome.cshlp.org on October 30, 2021 - Published by Cold Spring Harbor Laboratory Press
Haring et al.
human diseases. Possibly, ZNF91 has an even greater and more es- 1:4–1:10. For single cell culturing, culture medium was supple-
sential role in early embryonic stages, which prevents deleterious mented with ROCK inhibitor Thiazovivin (2 μM, Sigma-Aldrich)
mutations to be carried over to viable offspring. 1 h before dissociation and during plating. For H3K9me3 ChIP-
Our data showed that activation of SVAs results in a collective seq experiments, hESCs were cultured on MEFs as described in
up-regulation of KZNFs, specifically affecting KZNFs located in Jacobs et al. (2014).
SVA-rich clusters. This supports a hypothetical model in which
TE derepression elicits a defensive response by the host to counter- hESC transfection and clonal expansion
act TE outbursts. The mechanism that drives this response remains Two gRNAs targeting a few hundred base pairs around the TSS of
elusive. It was recently reported that the presence of TE-derived ZNF91 or ZNF611 were cloned into pX330 (Supplemental Table
transcripts could elicit an innate immune response resulting in S2). For transfection 400,000 hESCs per well were seeded on a
up-regulation of KZNFs (Li et al. 2018; Tie et al. 2018). However, six-well plate 1 d before transfection. Per well, a total of 3 μg
in our study we did not find support for this. Possibly, higher levels pX330(Cas9-gRNA), 1.5 μg of each of the two gRNAs, and 20 ng
of KZNF protein lead to more aspecific binding capacities of of pCAG.GFP was mixed with 5 μL P3000 reagent in a total volume
KZNFs, which could be a short-term solution of our genome to es- of 50 μL Opti-MEM (Invitrogen). This DNA mix was combined
tablish repression of TEs. In the long term, the KZNFs that were with a second mix containing 3.75 μL Lipofectamine 3000
most able to repress the TE may be subject to evolutionary pressure (Invitrogen) and 46.25 μL Opti-MEM (Invitrogen) and incubated
and subsequently undergo structural evolutionary changes to op- for 15 min at room temperature. Medium was refreshed before add-
timize their repressive capacities. In our study, the collective up- ing 100 μL transfection mix dropwise. Forty-eight hours after
regulation of KZNFs is likely mediated by the high density of acti- transfection GFP positive cells were sorted using fluorescence acti-
vated SVAs in the KZNF clusters. These findings are supported by vated cell sorting (FACS) on a FACS Aria III with a 100-μm nozzle.
an earlier study that attributed a collective up-regulation of KZNF Cells were plated at low density (5000–9000 cells) on MEF-coated
clusters in mouse KAP1 KO cells to aberrant activation of nearby 60-mm plates for clonal expansion. Until colonies appeared, cells
were cultured in recovery medium, consisting of hESC-condi-
TEs (Kauzlaric et al. 2017). Our data provide further support for
tioned medium and MEF-conditioned medium (1:1). For ZNF91
this hypothesis and show a possible mechanism in which the epi-
and ZNF611, WT and KO clonal lines were expanded in parallel.
genetic activity of the invading TEs is coopted by the host to estab-
For ZNF91/ZNF611 dKO cells, one clonal ZNF91 KO line was
lish a genome-wide defense against their outburst. Our genome
used to generate ZNF611 WT and KO lines in parallel. To ensure
has endured ongoing retrotransposition activity by SVAs for clonality, colonies were passaged manually to a 96-well plate be-
many millions of years, and ZNF91 has a crucial role in reducing fore they started to merge. All lines were frozen down and geno-
their invasive behavior. By unleashing this active class of TEs in typed using PCR and Sanger sequencing (for genotyping
the human genome by removing its main repressor protein, our primers, see Supplemental Table S1; for Sanger sequences, see
data shed light on the complex interactions between TE invasions Supplemental File 1). Lines were considered WT if only one WT
and the KZNFs that evolve to repress them to protect our genome’s band was found with PCR and sequencing confirmed no inser-
integrity. tions/deletions were present. Lines were considered KO if only
the band with the deletion was found and sequencing confirmed
that the start codon was deleted. A selection of WT and KO lines
Methods was expanded for mRNA level detection with qPCR (for primers,
HEK293 cell culture and transfection see Supplemental Table S2) to select lines used for RNA-seq.
HEK293 cells were cultured in DMEM (Invitrogen) supplemented
with 10% fetal bovine serum (FBS, Gibco) and 1% penicillin/strep-
Plasmids
tomycin (Invitrogen). To passage cells, 0.25% trypsin/0.01% EDTA For ZNF91-GFP ChIP experiments pCAG.ZNF91 from Jacobs et al.
(Invitrogen) in PBS was used 1:10 every 3–4 d. One day before (2014) was used to generate pCAG.ZNF91-Glycinelinker-eGFP. For
transfection, 2 million cells were seeded per 60 mm dish to reach CRISPR-Cas9 deletion experiments gRNAs were cloned into
70% confluency on the day of transfection, and 4.1 μg pX330-U6-Chimeric_BB-CBh-hSpCas9 (Addgene 42230) and
pCAG.ZNF91-GFP or pCAG.GFP plasmid was used to transfect pCAG.GFP (Addgene 11150) was cotransfected for FAC-sorting
each 60 mm dish using 5.5 μL Lipofectamine 3000 (Invitrogen) of hESCs.
and 8.3 μL P3000 (Invitrogen). Forty-eight hours after transfection,
cells were isolated for chromatin immunoprecipitation (ChIP). Western blotting
A fraction of the GFP ChIP on ZNF91-GFP and GFP-transfected
Human embryonic stem cell culture HEK293 cells was used for western blot to confirm the presence
H9 human embryonic stem cells were grown on matrigel-coated of ZNF91 protein. DTT (final concentration 100 mM) and 2×
dishes (Corning). They were cultured in hESC medium that was in- Laemmli sample buffer (Bio-Rad) were added to half of the sample.
cubated with mouse embryonic fibroblasts (MEFs) for 24 h. hESC Samples were subjected to SDS-PAGE on 4%–20% mini protean
medium consisted of DMEM/F12 supplemented with 2 mM L-glu- precast protein gels (Bio-Rad) and transferred to a blotting mem-
tamine (Invitrogen), 20% knockout serum replacement (Gibco), brane according to the manufacturer’s protocol. Blots were washed
penicillin/streptomycin (Invitrogen), nonessential amino acids three times in water and then blocked for 1 h in 5% milk powder in
(Invitrogen), and 0.1 mM β-mercaptoethanol (Invitrogen). TBS-T on a rocking platform. Blots were incubated with rabbit anti-
Medium was supplemented with basic fibroblast growth factor β-Tubulin (Cell Signaling Technology 2144, 1:1000) or rabbit anti-
(Sigma-Aldrich, 8 ng/μL) and changed daily to secure pluripotency GFP (Abcam ab290, 1:5000) in TBS-T overnight at 4°C on a rotator.
of hESCs. For maintenance of the culture, cells were grown in col- Blots were washed in TBS-T and then exposed to goat-anti-rabbit-
onies and passaged manually by cutting the colonies with a nee- HRP (Thermo Fisher Scientific 656120, 1:25000) in TBS-T, both for
dle. For transfection and clonal expansion hESCs were grown as 1 h on a rocking platform. Blots were washed twice for 30 min in
single cells and passaged using accutase (Sigma-Aldrich) at ratios TBS-T on a rocking platform. Signal was visualized with
8 Genome Research
www.genome.orgDownloaded from genome.cshlp.org on October 30, 2021 - Published by Cold Spring Harbor Laboratory Press
SVA activation induces up-regulation of KZNFs
SuperSignal West Dura Trial Kit (Thermo Fisher Scientific) on Previously published RNA-seq data of human and rhesus ma-
Odyssey FC Imaging System (LI-COR Biosciences). caque (Macaca mulatta) hESCs and cortical organoids was used
(Field et al. 2019). Genes with an average basemean (DESeq) ex-
pression level below 30 over all analyzed human and macaque tis-
RNA sequencing sues were excluded to ensure only orthologous genes, expressed
Samples of ZNF91 KO, ZNF611 KO, and ZNF91/ZNF611 dKO were in both species, were studied. Transcripts without expression
used for RNA sequencing. Total RNA was isolated using TRIzol ac- in any of the time points were excluded. Expression of
cording to the manufacturer’s protocol, followed by a DNase treat- transcripts with an SVA >1000 bp within 100 kb of their TSS
ment and RNA purification using the RNA clean and concentrator (GSE106245_hg19.fantom.lv3) were compared to those without.
kit (Zymo research). Ribosomal RNA was depleted from total RNA Significant differences between human/rhesus expression ratios
with the rRNA depletion kit (NEB E6310) and subsequently pre- for genes with an SVA nearby versus all genes was tested using
pared for RNA-seq with NEB Next Ultra Directional RNA Library the Wilcoxon rank-sum test, and 95% confidence intervals of
Prep Kit (NEB E7420) at GenomeScan. Samples were sequenced the mean were calculated by 10,000 times bootstrap of genes with-
at 150-bp paired end at an Illumina HiSeq 4000 device. out an SVA nearby for a similar sized sample as those with an SVA
nearby. Only results for cortical organoids shown.
Mapping and analysis of RNA-seq data
A Snakemake (Köster and Rahmann 2012) pipeline was written to Chromatin immunoprecipitation (ChIP)
quality check, trim, map, and quantify RNA-seq data. The com- HEK293 and ZNF91 WT and KO hESCS were harvested the follow-
plete pipeline can be found at https://zenodo.org/record/ ing ways: HEK293 cells, transfected with ZNF91-GFP or GFP two
2581199 and as Supplemental Code. A short description of the replicates each, were harvested from a confluent 60-mm dish by
separate steps composing the pipeline follows. Paired-end mechanical detachment with a cell scraper in cold PBS. One repli-
Illumina RNA-seq FASTQ files were used as input. Read quality cate of ZNF91 WT and KO hESC colonies were detached from two
was assessed with FastQC. Trimmomatic (Bolger et al. 2014) was 60-mm dishes with a cell scraper and collected at the bottom of a
used to clip adapter sequences and trim low-quality reads. Reads 15-mL tube through mild centrifugation (3 min at 400 rpm).
were aligned to the human genome (hg19 version) using STAR Medium was replaced with 10 mL cold PBS. For all ChIP experi-
(Dobin et al. 2013) with default settings except for the following: ments, cells were cross-linked immediately after harvest by adding
outFilterMismatchNmax = 2 and outFilterMultimapNmax = 10, 1 mL of 11× cross-linking buffer (50 mM Tris-HCL pH 7.5, 100 mM
outWigType = bedGraph, outSAMtype = BAM SortedByCoordinate. NaCl, 1 mM EDTA, 0.5 mM EGTA, 11% Formaldehyde) to 10 mL of
(Based on our verification that almost all SVA sequences are shared cold cell suspension for 10 min at room temperature on a rocking
between hg19 and hg38, we state that mapping on hg38 instead of platform. To quench formaldehyde, glycine was added at a final
hg19 would not significantly alter the outcome or conclusions of concentration of 0.11 M and samples were incubated for 5 min
our study.) We assessed in a representative RNA-seq sample that at room temperature on a rocking platform. Cells were pelleted
with 150-bp reads and paired-end sequencing, the percentage of through centrifugation for 5 min at 2000 rcf at 4°C. To remove
multimapping reads that end up at SVAs is very low: Of all reads all traces of cross-linking buffer, the cells were washed two times
at SVAs, only 5.8% was derived from multimapping reads, which with 10 mL cold PBS. hESC samples were split in two for
was not higher than the average 8% of multimapping reads genome H3K4me3 and H3K27ac ChIP. For cell lysis, 1 mL lysis buffer 1
wide. Because STAR assigns a multimapping read to only one, high- (50 mM Hepes-KOH pH 7.5, 140 mM NaCl, 1 mM EDTA, 10% glyc-
est scoring place, we feel that this is the best approach for our re- erol, 0.5% NP-40, 0.25% Triton X-100) supplemented with prote-
search question. Base-by-base coverage tracks were generated from ase inhibitor cocktail (Roche) was added to cell pellets and
each bedGraph file with bedGraphToBigWig. Coverage tracks incubated on a rocking platform for 10 min, GFP and H3K4me3
were displayed on UCSC Genome Browser while scaled using a scal- at 4°C, and H3K27ac at room temperature (RT). Cells were pelleted
ing factor determined with DESeq2, including all RNA-seq samples again by centrifugation (5 min at 2000 rcf at 4°C). Next, 1 mL lysis
in one session. Raw read counts of genes were determined with buffer 2 (10 mM Tris-HCL pH 8, 200 mM NaCl, 1 mM EDTA, 0.5
featureCounts (Liao et al. 2014) using hg19 KnownGenes.GTF mM EGTA) supplemented with protease inhibitor cocktail
from UCSC for annotation (https://genome.ucsc.edu/index.html; (Roche) was added to cell pellets, followed by incubation on a rock-
downloaded September 12, 2016). Only properly paired reads ing platform for 5 min, GFP and H3K4me3 at 4°C, and H3K27ac at
were counted (-B) and the library was reversely stranded (-s 2). RT. Cells were pelleted again by centrifugation (5 min at 2000 rcf at
Genes were summarized at metalevel (default), whereas TEs were 4°C). The pellet was resuspended in 100 μL lysis buffer 3 (10 mM
summarized at the feature level (-f). StringTie (Pertea et al. 2015) Tris-HCL pH 8, 100 mM NaCl, 1 mM EDTA, 0.5 mM EGTA, 0.1%
was used to build de novo transcript models from ZNF91 WT and Na-Deoxycholate, 0.5% N-Lauroylsarcosine) supplemented with
KO hESC samples mapped with STAR (BAM files sorted by coordi- protease inhibitor cocktail (Roche). Chromatin was sheared to
nate were used as input). Predicted transcripts were included with fragments of ∼500 bp in 12 cycles of sonication (intensity high,
a minimum length of 100 bp (-m) and minimum read coverage of 30 sec on and 1 min off) in a Bioruptor. Then, 450 μL lysis buffer
1.5 (-c). One annotation file was generated from all separate 3 and 50 μL 10% Triton X-100 were added to the sonicated cell ly-
StringTie transcript models that could be used by featureCounts sate. Samples were centrifuged at maximum speed for 10 min at
to estimate raw counts of chimeric transcripts. DESeq2 (Love et al. 4°C. Fifty microliters supernatant was stored at −20°C to be used
2014) was used to normalize raw counts, perform principal compo- as input sample, and the rest was used for chromatin immunopre-
nent analysis and differential expression analysis of genes, TEs, and cipitation (ChIP). Fifty microliters of Dynabeads M-280 sheep anti-
transcripts assembled with StringTie. For differential expression rabbit IgG (Invitrogen) were washed three times with 0.5% BSA in
analysis of SVAs, Log2 FC > 3 was considered differentially ex- PBS before incubating with 5 μg rabbit anti-GFP (Abcam ab290),
pressed, because SVA expression levels were too low to determine 3.75 μL rabbit anti-H3K4me3 (Millipore 07-473, lot 2930138), or
adjusted P-values adequately. R packages ggplot2 and ggpubr were 5 μg rabbit anti-H3K27ac (Abcam ab4729, lot GR3205521-1) on a
used to generate plots and perform statistical testing. Heatmaps rotator for 4 h at 4°C. Excess antibody was removed by three
were generated with MeV (vs 4.8.1). wash steps with lysis buffer 3. Beads were resuspended in 500 μL
Genome Research 9
www.genome.orgDownloaded from genome.cshlp.org on October 30, 2021 - Published by Cold Spring Harbor Laboratory Press
Haring et al.
1% Triton X-100 in lysis buffer 3 and added to the lysate. IP was with 0.5% BSA in PBS before incubating with 5 μg rabbit anti-
performed on a rotator overnight at 4°C. Immuno complexes H3K9me3 (Abcam ab8898, lot GR3365652-1) on a rotator for 6 h
were washed four times with 1 mL RIPA buffer (50 mM Hepes- at 4°C. Excess antibody was removed by two wash steps with 500
KOH pH 7.5, 500 mM LiCl, 1 mM EDTA, 1% NP-40, 0.7% Na- µL lysis buffer 3. Beads were resuspended in 500 μL 1% Triton X-
Deoxycholate) supplemented with protease inhibitor cocktail 100 in lysis buffer 3 and added to the lysate. IP was performed
(Roche) and once with 1 mL cold TBS (50 mM Tris-HCL pH7.6, on a rotator overnight at 4°C. Immuno complexes were washed
150 mM NaCl, GFP and H3K4me3) or TE (10 mM Tris-HCLpH8, four times with 500 µL RIPA buffer (50 mM Tris-HCL pH7.6, 500
1 mM EDTA, H3K27ac) using a magnetic stand. After removal of mM LiCl, 1 mM EDTA, 1% NP-40, 0.7% Na-Deoxycholate) and
all traces of TBS, the beads were resuspended in 200 μL elution buff- once with 500 µL cold TE (10 mM Tris-HCL pH 8, 1 mM EDTA,
er (50 mM Tris-HCLpH 8, 10 mM EDTA, 1% SDS). Then, 150 μL 50 mM NaCl) using a magnetic stand and resuspended in 500 µL
elution buffer was added to thawed input sample (50 μL). TE (without NaCl). The cell suspension in TE was transferred to a
Chromatin was eluted and cross-linking reversed by incubating new 1.7-mL tube, the TE was removed, and the beads were resus-
at 65°C on a rocking platform. Next, 200 μL TE (10 mM Tris-HCL pended in 210 µL elution buffer (50 mM Tris-HCL pH 8, 10 mM
pH 8, 1 mM EDTA) was added to each sample to dilute SDS in elu- EDTA, 1% SDS). Then, 150 μL elution buffer was added to thawed
tion buffer. ChIP DNA was treated with Ambion RNase Cocktail input sample (50 μL). Chromatin was eluted and cross-linking re-
(Invitrogen) for 30 min at 37°C and Proteinase K (Invitrogen) for versed by incubating at 65°C on a rocking platform (Eppendorf,
2 h at 55°C. DNA was extracted with one step phenol/chloroform ThermoMixer C). Next, 200 μL TE (10 mM Tris-HCLpH8, 1 mM
and two steps chloroform. Ethanol (100%) was used to precipitate EDTA) was added to each sample to dilute SDS in the elution buff-
DNA for 45 min at −80°C. DNA was pelleted by centrifugation at er. ChIP DNA was treated with Ambion RNase Cocktail (Invitrogen
14,000 rpm for 45 min at 4°C. The pellet was washed with 70% AM2286, lot 0906010) for 2 h at 37°C and Proteinase K
ethanol and centrifuged at 14,000 rpm for 10 min at 4°C. DNA (Invitrogen) for 2 h at 55°C at 550 rpm on a rocking platform.
was dissolved in nuclease-free water. Finally, extracted DNA was DNA was extracted with two steps phenol/chloroform and two
purified using DNA Clean & Concentrator-5′ columns (Zymo). steps chloroform. Ethanol (100%) was used to precipitate DNA
ChIP-seq for H3K9me3 on hESCs was performed according to overnight at −80°C. DNA was pelleted by centrifugation at
the protocol described by Jacobs et al. (2014). For the ChIP, 5 μg 14,000 rpm for 45 min at 4°C. The pellet was washed with 70%
of rabbit anti-H3K9me3 (Abcam ab8898) was used. ethanol and centrifuged at 14,000 rpm for 10 min at 4°C. DNA
was dissolved in nuclease-free water. Finally, extracted DNA was
purified using DNA Clean & Concentrator-5′ columns (Zymo).
H3K9me3 ChIP-qPCR qPCR using the QuantiTect SYBR Green PCR kit (Roche) and 2× di-
Three replicates of ZNF91 WT and KO hESC colonies were harvest- luted DNA and DNA input control was performed on a Roche
ed by mechanical detachment from 60-mm dishes with a cell lifter Lightcycler 480 II to check ChIP enrichment. The qPCR was per-
and collected at the bottom of a 15-mL tube. Medium was replaced formed by 5 min at 95°C, 40 cycles of 10 sec at 95°C, 30 sec at
with 1 mL cold PBS. For all ChIP experiments, cells were cross- 60°C, and 30 sec at 72°C. Primers used for the qPCR are listed in
linked immediately after harvest by adding 100 µL of 11× cross- Supplemental Table S3. The qPCR Ct values of the duplicates
linking buffer (50 mM Tris-HCL pH 7.6, 100 mM NaCl, 1 mM were analyzed by calculating the fold difference between ChIP
EDTA, 0.5 mM EGTA, 11% Formaldehyde) to 1 mL of cold cell sus- DNA samples and DNA input control with the following formula:
pension for 10 min at room temperature on a rocking platform. To ΔCt [normalized ChIP] = Ct [ChIP] − (Ct [Input] − Log2 (Input
quench formaldehyde, glycine was added at a final concentration Dilution Factor)). Furthermore, the fold enrichment was calculat-
of 0.11 M and samples were incubated for 5 min at room temper- ed to normalize the background signal by dividing the ChIP
ature on a rocking platform. Cells were pelleted through centrifu- DNA signal by the DNA input control signal (negative control,
gation at 500 rcf for 5 min at 4°C. To remove all traces of cross- in this case, the LTR12C).
linking buffer, the cells were washed two times with 1 mL cold
PBS. For cell lysis, 1 mL lysis buffer 1 (50 mM Tris-HCL pH 7.6,
140 mM NaCl, 1 mM EDTA, 10% glycerol, 0.5% NP-40, 0.25% ChIP-seq library prep and sequencing
Triton X-100) supplemented with protease inhibitor cocktail For TruSeq ChIP sample prep (Illumina, Lot 20194738), 25–30 ng
(Roche) was added to cell pellets. The cell suspension was trans- of ChIP DNA was used as starting material. The provided protocol
ferred to a 1.7-mL low binding tube (Corning) and incubated on was followed with the following adjustments: DNA Clean &
a rocking platform for 10 min at 4°C. Cells were pelleted again Concentrator-5 kit (Zymo) instead of beads was used for DNA pu-
by centrifugation (5 min at 500 rcf at 4°C). Then, 1 mL lysis buffer rification. DNA fragment size selection with 2% agarose size selec-
2 (10 mM Tris-HCL pH 8, 200 mM NaCl, 1 mM EDTA, 0.5 mM tions gels (Invitrogen) using E-Gel SizeSelect II (Invitrogen) was
EGTA) supplemented with protease inhibitor cocktail (Roche) done before and after PCR amplification of indexed ChIP DNA
was added to cell pellets, followed by incubation on a rocking plat- to obtain the 400–500 bp fraction. H3K4me3 and ZNF91-GFP
form for 10 min at 4°C. Cells were pelleted again by centrifugation ChIP samples were pooled and subjected to 75-bp paired-end se-
(5 min at 500 rcf at 4°C). The pellet was resuspended in 100 μL lysis quencing at a depth of 130 million reads, which was performed
buffer 3 (10 mM Tris-HCL pH 8, 100 mM NaCl, 1 mM EDTA, 0.5 by MAD:Dutch Genomics Service and Support Provider of the
mM EGTA, 0.1% Na-Deoxycholate, 0.5% N-Lauroylsarcosine) sup- University of Amsterdam on an Illumina NextSeq 550 device.
plemented with protease inhibitor cocktail (Roche). Chromatin H3K27ac ChIP samples were pooled and subjected to 150-bp
was sheared to fragments of ∼500 bp in 12 cycles of sonication (in- paired-end sequencing by GenomeScan at an Illumina HiSeq
tensity high, 30 sec on and 1 min off) in a bioruptor. Next, 550 μL 4000 device. For H3K9me3 ChIP-seq on hESCs, library prep was
lysis buffer 3 and 50 μL 10% Triton X-100 was added to the sonicat- described in Jacobs et al. (2014).
ed cell lysate. Samples were centrifuged at maximum speed for 10
min at 4°C. Fifty microliters supernatant was stored at −20°C to be
used as input sample and the rest was used for chromatin immuno- Mapping and analysis of ChIP-seq data
precipitation (ChIP). Fifty microliters of Dynabeads M-280 sheep Next to our own ChIP-seq data we reanalyzed the ZNF611 ChIP-
anti-rabbit IgG (Invitrogen, lot 00892017) were washed two times exo data published by Imbeault et al. (2017), accession number
10 Genome Research
www.genome.orgDownloaded from genome.cshlp.org on October 30, 2021 - Published by Cold Spring Harbor Laboratory Press
SVA activation induces up-regulation of KZNFs
GSE78099. A Snakemake (Köster and Rahmann 2012) pipeline was Competing interest statement
written to trim and map ChIP-seq data. The complete pipeline can
be found at https://zenodo.org/record/2581325 and as The authors declare no competing interests.
Supplemental Code. The following is a short description of the
separate steps of the pipeline, using paired-end Illumina sequenc-
ing FASTQ files as input. Read quality was assessed with FastQC. Acknowledgments
Trimmomatic (version 0.38) (Bolger et al. 2014) was used to clip
adapter sequences and trim low-quality reads. Bowtie 2 (version This work was supported by a European Research Council (ERC)
1.0.1) (Langmead and Salzberg 2012) in –end-to-end –very-sensi- starting grant (ERC-2016-stG-716035) to F.M.J.J., Human
tive mode was used to map reads to the human genome (hg19 ver- Frontier Science Program (HFSP) Career Development Award
sion). Fragment length for valid paired-end fragments was set to a (CDA00030/2016C) to F.M.J.J., and Nederlandse Organisatie
minimum of 80 (-I) and a maximum of 500 (-X). The resulting SAM voor Wetenschappelijk Onderzoek (NWO)-Vici (865.09.002) to
files were converted to BAM files sorted by coordinate using M.P.S. We thank Lars von Oerthel for his technical assistance
SAMtools (version 1.7) (Li et al. 2009). The rmdup function of with FACS experiments and members of the Evolutionary
SAMtools was used to remove potential PCR duplicates from Neurogenomics group for helpful discussions.
ChIP-seq samples. For mapping ChIP-seq data, we included multi- Author contributions: Conceptualization, F.M.J.J. and N.L.H.;
mapping reads, because this is now standard practice for analyzing methodology, N.L.H., E.J.v.B., W.S.J., T.M.H., J.R.E.R., F.T.G.W.,
ChIP-seq data with Bowtie 2 and widely done in our field and G.C.S.; data analysis, F.M.J.J., N.L.H., E.J.v.B., M.D.G., and
(Imbeault et al. 2017; Fuentes et al. 2018). We used the default set- F.T.G.W.; data curation, F.M.J.J., N.L.H., and E.J.v.B.; writing of
ting (search for multiple alignments, report the best one) with the manuscript, F.M.J.J., N.L.H., and E.J.v.B.; reviewing/editing of
‐‐very-sensitive and ‐‐end-to-end parameters, to limit the inclusion manuscript, F.M.J.J., N.L.H., E.J.v.B., and M.P.S.; funding acquisi-
of false positive/false negative read assignment. BEDTools tion, F.M.J.J. and M.P.S.; supervision and project administration,
genomecov and bedGraphToBigWig were used to generate unnor- F.M.J.J.
malized base-by-base bigWig files coverage tracks. For visualization
on the UCSC Genome Browser, data was scaled according to
GAPDH control regions. BamCoverage from the deepTools pack- References
age (version 2.5.7) (Ramírez et al. 2016) was used to generate
Bailey TL, Boden M, Buske FA, Frith M, Grant CE, Clementi L, Ren J, Li WW,
RPKM normalized base-by-base (‐‐binSize 1) coverage bigWig file. Noble WS. 2009. MEME SUITE: tools for motif discovery and searching.
BigwigCompare from the deepTools package was used to generate Nucleic Acids Res 37: W202–W208. doi:10.1093/nar/gkp335
one coverage bigWig file displaying the mean of two ZNF91 ChIP Barchitta M, Quattrocchi A, Maugeri A, Vinciguerra M, Agodi A. 2014. LINE-
replicates. Profile plots were generated with deepTools 1 hypomethylation in blood and tissue samples as an epigenetic marker
for cancer risk: a systematic review and meta-analysis. PLoS One 9:
computeMatrix and plotHeatmap 2 kb around the center of SVAs e109478. doi:10.1371/journal.pone.0109478
using Galaxy (Galaxy deepTools version 3.1.2.0.1). Peak calling Batzer MA, Gudi VA, Mena JC, Foltz DW, Herrera RJ, Deininger PL. 1991.
was done with MACS2 (version 2.1.1.20160309) (Zhang et al. Amplification dynamics of human-specific (HS) alu family members.
Nucleic Acids Res 19: 3619–3623. doi:10.1093/nar/19.13.3619
2008). All tags at a given location were included (‐‐keep-dup all)
Bernstein BE, Kamal M, Lindblad-Toh K, Bekiranov S, Bailey DK, Huebert
and subpeaks were determined (‐‐call-summits). We used the fol- DJ, McMahon S, Karlsson EK, Kulbokas EJ, Gingeras TR, et al. 2005.
lowing cutoffs for ZNF91 ChIP: ZNF91 rep1 MACS score ≥ 50 and Genomic maps and comparative analysis of histone modifications in
ZNF91 rep2 MACS score ≥ 100. Only peaks occurring in both rep- human and mouse. Cell 120: 169–181. doi:10.1016/j.cell.2005.01.001
licates were included. This resulted in 7220 genuine ZNF91 peaks. Bolger AM, Lohse M, Usadel B. 2014. Trimmomatic: a flexible trimmer for
Illumina sequence data. Bioinformatics 30: 2114–2120. doi:10.1093/bio
For H3K4me3 and H3K27ac ChIPs, all peaks were included. informatics/btu170
Mapping of H3K9me3 ChIP-seq data was done according to steps Bollati V, Schwartz J, Wright R, Litonjua A, Tarantini L, Suh H, Sparrow D,
described in Jacobs et al. (2014). Vokonas P, Baccarelli A. 2009. Decline in genomic DNA methylation
through aging in a cohort of elderly subjects. Mech Ageing Dev 130:
234–239. doi:10.1016/j.mad.2008.12.003
Brouha B, Schustak J, Badge RM, Lutz-Prigge S, Farley AH, Moran JV,
Motif analysis Kazazian HH Jr. 2003. Hot L1s account for the bulk of retrotransposition
in the human population. Proc Natl Acad Sci 100: 5280–5285. doi:10
MEME suite (version 5.0.4) (Bailey et al. 2009) was used for motif .1073/pnas.0831042100
discovery (MEME), motif search (FIMO) (Grant et al. 2011) and Chen W, Schwalie PC, Pankevich EV, Gubelmann C, Raghav SK, Dainese R,
Cassano M, Imbeault M, Jang SM, Russeil J, et al. 2019. ZFP30 promotes
motif comparison (TomTom). For motif discovery, sequences of adipogenesis through the KAP1-mediated activation of a retrotranspo-
peak summits extended with 50 bp to both sides were retrieved son-derived Pparg2 enhancer. Nat Commun 10: 1809. doi:10.1038/
and used as input for MEME. For ZNF91 SVA motif discovery, s41467-019-09803-9
SVAs were split in half and intersected with ZNF91 peaks. The Chuong EB, Elde NC, Feschotte C. 2016. Regulatory evolution of innate im-
munity through co-option of endogenous retroviruses. Science 351:
top 200 peaks localizing to each half were used to generate two mo- 1083–1087. doi:10.1126/science.aad5497
tifs. For promoter motif discovery, the top 200 of ZNF91 peaks Cordaux R, Batzer MA. 2009. The impact of retrotransposons on human ge-
overlapping with gene promoters (TSS plus/minus 1 kb) were nome evolution. Nat Rev Genet 10: 691–703. doi:10.1038/nrg2640
used, respectively. The orientation of SVAs and genes were taken Creyghton MP, Cheng AW, Welstead GG, Kooistra T, Carey BW, Steine EJ,
Hanna J, Lodato MA, Frampton GM, Sharp PA, et al. 2010. Histone
into consideration. H3K27ac separates active from poised enhancers and predicts develop-
mental state. Proc Natl Acad Sci 107: 21931–21936. doi:10.1073/pnas
.1016071107
Deng H, Le WD, Jankovic J. 2008. Genetic study of an American family with
Data access DYT3 dystonia (lubag). Neurosci Lett 448: 180–183. doi:10.1016/j.neulet
.2008.10.049
All raw and processed sequencing data generated in this study have Dobin A, Davis CA, Schlesinger F, Drenkow J, Zaleski C, Jha S, Batut P,
Chaisson M, Gingeras TR. 2013. STAR: ultrafast universal RNA-seq align-
been submitted to the NCBI Gene Expression Omnibus (GEO; er. Bioinformatics 29: 15–21. doi:10.1093/bioinformatics/bts635
https://www.ncbi.nlm.nih.gov/geo/) under accession number Farmiloe G, Lodewijk GA, Robben SF, van Bree EJ, Jacobs FMJ. 2020.
GSE162571. Widespread correlation of KRAB zinc finger protein binding with
Genome Research 11
www.genome.orgYou can also read