Retreat and extinction of the Late Pleistocene cave bear (Ursus spelaeus sensu lato) - Core
←
→
Page content transcription
If your browser does not render page correctly, please read the page content below
Sci Nat (2016) 103: 92
DOI 10.1007/s00114-016-1414-8

    ORIGINAL PAPER

Retreat and extinction of the Late Pleistocene cave bear (Ursus
spelaeus sensu lato)
Mateusz Baca 1,2 & Danijela Popović 3 & Krzysztof Stefaniak 4 & Adrian Marciszak 4 &
Mikołaj Urbanowski 5 & Adam Nadachowski 6 & Paweł Mackiewicz 7

Received: 8 July 2016 / Revised: 18 September 2016 / Accepted: 20 September 2016 / Published online: 11 October 2016
# The Author(s) 2016. This article is published with open access at Springerlink.com

Abstract The cave bear (Ursus spelaeus sensu lato) is a typical           decrease in the cave bear records with cooling indicate that the
representative of Pleistocene megafauna which became extinct at           drastic climatic changes were responsible for its extinction.
the end of the Last Glacial. Detailed knowledge of cave bear              Climate deterioration lowered vegetation productivity, on which
extinction could explain this spectacular ecological transforma-          the cave bear strongly depended as a strict herbivore. The distri-
tion. The paper provides a report on the youngest remains of the          bution of the last cave bear records in Europe suggests that this
cave bear dated to 20,930 ± 140 14C years before present (BP).            animal was vanishing by fragmentation into subpopulations oc-
Ancient DNA analyses proved its affiliation to the Ursus                  cupying small habitats. One of them was the Kraków-
ingressus haplotype. Using this record and 205 other dates, we            Częstochowa Upland in Poland, where we discovered the latest
determined, following eight approaches, the extinction time of            record of the cave bear and also two other, younger than 25,000
                                                                          14
this mammal at 26,100–24,300 cal. years BP. The time is only                C years BP. The relatively long survival of this bear in karst
slightly earlier, i.e. 27,000–26,100 cal. years BP, when young            regions may result from suitable microclimate and continuous
dates without associated collagen data are excluded. The demise           access to water provided by deep aquifers, indicating a refugial
of cave bear falls within the coldest phase of the last glacial           role of such regions in the Pleistocene for many species.
period, Greenland Stadial 3. This finding and the significant
                                                                          Keywords Ancient DNA . Cave bear . Extinction . Last
Communicated by: Sven Thatje                                              glacial maximum . Megafauna . Refugium

* Paweł Mackiewicz
  pamac@smorfland.uni.wroc.pl
                                                                          Introduction
1
     Center for Precolumbian Studies, University of Warsaw, Krakowskie
     Przedmieście 26/28, 00-927 Warszawa, Poland                          The extinction of large-bodied mammals (called megafauna)
2
     Institute of Genetics and Biotechnology, University of Warsaw,
                                                                          is one of the most characteristic and inherent features of the
     Pawińskiego 5A, 02-106 Warszawa, Poland                              Late Pleistocene. The disappearance began 50,000 years ago
3
     Centre of New Technologies, University of Warsaw, S. Banacha 2c,
                                                                          and affected a substantial number of mammalian genera, e.g.
     02-097 Warszawa, Poland                                              36 % of them in Eurasia, 72 % in North America and 83 % in
4
     Department of Paleozoology, Institute of Environmental Biology,
                                                                          South America (Barnosky et al. 2004). Both the climate and
     University of Wrocław, Sienkiewicza 21, 50-335 Wrocław, Poland       environment changes, as well as human influence, are be-
5
     Department of Archaeology, Institute of History and International
                                                                          lieved to be the main causes of this extinction (Barnosky
     Relations, Szczecin University, Krakowska 71-79,                     et al. 2004; Cooper et al. 2015; Koch and Barnosky 2006;
     71-017 Szczecin, Poland                                              Lorenzen et al. 2011; Stuart 2015). The climate shift was
6
     Institute of Systematics and Evolution of Animals, Polish Academy    sufficient to explain the fauna transformation in some cases,
     of Sciences, Sławkowska 17, 31-016 Kraków, Poland                    but in others, a combination of climatic and anthropogenic
7
     Department of Genomics, Faculty of Biotechnology, University of      effects was most probably responsible for this phenomenon
     Wrocław, Joliot-Curie 14a, 50-383 Wrocław, Poland                    (Cooper et al. 2015; Lorenzen et al. 2011).
92 Page 2 of 17 Sci Nat (2016) 103: 92
A typical representative of megafauna is the cave bear The paper reports on, so far, the youngest remains of the
(Ursus spelaeus sensu lato), which was one of the most wide- cave bear from the Stajnia Cave located in the Częstochowa
spread mammals in Eurasia in the Late Pleistocene. It evolved Upland, Poland. In this region were also found other quite
from Middle Pleistocene Ursus deningeri and developed into young fossils of this bear in two caves, Komarowa and
several forms which can be distinguished at morphological and Deszczowa (Nadachowski et al. 2009; Wojtal 2007; Wojtal
genetic levels. Two main European forms in the species rank, et al. 2015). Genetic analyses confirmed beyond doubt the
which diverged probably between 414,000 and 173,000 years affiliation of this specimen to the cave bear, whereas the direct
ago, were identified as Ursus ingressus, which inhabited south- radiocarbon dating provided the evidence for the survival of
eastern and central Europe as well as the Ural (Baca et al. 2014; this species into the Greenland stadial GS-3. Using this new
Rabeder et al. 2004b), and U. spelaeus, which lived mainly in dating and more than 200 published dates, we estimated the
western Europe, although its remains were found also in the time of cave bear extinction and discussed potential factors of
Altai (Knapp et al. 2009; Rabeder et al. 2004b). According to its disappearance and survival in karst regions.
the rules of the International Code of Zoological Nomenclature,
U. ingressus should, however, be called Ursus kanivetz, be-
cause under the latter name a bear from Medvezhiya Cave in Materials and methods
the Ural was first described by Vereshchagin (1973) (see also
Baryshnikov and Puzachenko (2011)). Further studies of an- Excavation site and specimen description
cient DNA showed that the haplotype from Medvezhiya Cave
is clustered with others from Europe, described as U. ingressus The specimen of the cave bear (JST4), the third phalanx, was
(Baca et al. 2012; Knapp et al. 2009). Additionally, two small excavated in Stajnia Cave located in the Kraków-
cave bear forms that had preserved some primitive traits were Częstochowa Upland in Poland (50° 36′ 58″ N, 19° 29′ 04″
distinguished as subspecies of U. spelaeus: U. spelaeus eremus E, Fig. 1). The specimen under study shows a morphometry
and U. spelaeus ladinicus (Rabeder and Hofreiter 2004; typical of speleoid bear forms (Fig. 2). It had the greatest
Rabeder et al. 2004a). Their distribution was confined to the length = 39.3 mm and the proximal height = 27.1 mm. The
high alpine caves in Austria and Italy. Recently, another major measurements better correspond to the cave than brown bear.
group of large cave bears from the Caucasus and the Yana Mean and standard deviation of these parameters are respec-
River region in eastern Siberia was discovered (Baryshnikov tively 38.3 ± 3.7 and 25.9 ± 2.3 mm for U. spelaeus from Buse
1998; Knapp et al. 2009). Initially, they were named Ursus di Bernardo (Italy) (Santi et al. 2011) and 36.6 ± 5.5 and
deningeri kudarensis, but recent genetic studies suggest that 25.1 ± 3.7 mm for U. ingressus from Gamssulzenhöhle
they should be considered a third species, Ursus kudarensis (Austria) (Alscher 2013), whereas subfossil Ursus arctos from
(Stiller et al. 2014). Austria and France is characterized by smaller dimensions, i.e.
By the end of the Pleistocene, all these cave bear forms 33.8 ± 5.8 and 20.9 ± 6.0 mm, respectively (Alscher 2013).
were extinct and the causes and timing of this process have Therefore, the measurements for the specimen JST4 are closer
been debated over the recent years. Direct radiocarbon dating to the mean values of the cave bear and are much higher than
indicates that the last cave bears became extinct prior to the those for the brown bear. Moreover, the phalanx is more mas-
Last Glacial Maximum (LGM) and disappeared from fossil sive and not as slender as in the brown bear. It has also a well-
record quite simultaneously in different parts of Europe about developed articular surface with subcircular contour (Bonifay
24,000 14C years before present (BP) (about 28,000 cal. years 1966; Torres Pérez-Hidalgo 1989).
BP) (Bocherens et al. 2014; Hofreiter et al. 2002; Martini et al. The Stajnia Cave is famous for the discovery of the first
2014; Pacher and Stuart 2009; Sabol et al. 2014; Wojtal et al. remains of Neanderthals in Poland (Nowaczewska et al.
2015). Paleogenetic analyses showed, nonetheless, that the 2013; Urbanowski et al. 2010). Six stratigraphical complexes
demise of cave bears started ca. 50,000 radiocarbon years named from A to G were distinguished in this cave, spanning
BP (Stiller et al. 2010), thus about 25,000 years before their the period of more than 100,000 years (Żarski et al. 2017). The
final extinction. It has been argued that apart from the chang- youngest complexes A and B represent MIS 1 sediments. The
ing climate (Pacher and Stuart 2009; Stuart and Lister 2007), complex C consists of several layers, marked from the top as
several other factors contributed to the decline of cave bears. C6, C7 and C18 corresponding to MIS 2 as well as C19 from
There is compelling evidence for human hunting of cave bears the younger MIS 3. The deposits consist of poorly sorted sandy
(Münzel et al. 2011; Wojtal et al. 2015), as well as their com- loams containing sharp-edged limestone rubble, dated to the
petition for caves as a shelter (Grayson and Delpech 2003). LGM. The cave bear specimen under study was found at the
Possibly, also large carnivores like cave lion (Panthera bottom of layer C18 deposited during the Leszno
spelaea) and cave hyena (Crocuta crocuta spelaea) hunted (Brandenburg) Phase. The complex D of about 60 cm average
cave bears while these were hibernating (Bocherens et al. thickness includes three units D1, D2 and D3, dated to the older
2011a; Diedrich 2014). part of MIS 3. They yielded the remains of HomoSci Nat (2016) 103: 92 Page 3 of 17 92
Fig. 1 Localization of cave bears
(Ursus spelaeus sensu lato)
remains younger than 26,000 14C
years BP in Europe including the
latest record confirmed
genetically from the Stajnia Cave
neanderthalensis and very rich Late Middle Palaeolithic flint Mothur (Schloss et al. 2009). The readings were assembled
artefacts. The archaeologically sterile complex E is most prob- in SeqMan Pro (DNASTAR). Consensus sequences from two
ably of MIS 4 age, whereas the oldest complexes F and G are replicates were called according to the guidelines proposed by
dated to MIS 5. Remains of the Late Pleistocene cave bear Stiller et al. (2009). To further confirm AMS date obtained in
(U. spelaeus sensu lato) were found in large numbers through- Poznań Radiocarbon Laboratory, the remaining bone powder
out the whole profile from layers G to C6. A tooth of cave bear (ca. 300 mg) was sent to GADAM Centre in Gliwice, Poland,
from layer D1 was dated to >49,000 years BP. In total, 323 for independent dating.
teeth and bones of the bear were found in this cave.
Analysis of DNA sequence
Laboratory analysis of specimen
To verify taxonomic and phylogenetic position of the analysed
The bone was cut into two parts and one of them was submit- specimen, we compared it with all 141 sequences of cave bears
ted to radiocarbon dating in Poznań Radiocarbon Laboratory, (U. spealeus, U. ingressus, U. rossicus and U. kudarensis)
whereas the other one was used for genetic analyses. DNA available in GenBank as well as 490 sequences of brown bear
extraction was performed in a laboratory dedicated to ancient (U. arctos). The number of base differences per site (p dis-
DNA analyses observing strict contamination precautions. tance) between the sequence under study and the others was
Samples were thoroughly cleaned with sterile toothbrush calculated in MEGA6 (Tamura et al. 2013). The median-
and bleach, rinsed with ddH2O and pulverized in cryogenic joining network (Bandelt et al. 1999) was constructed using
mill (Spex). A portion of the obtained bone powder was used the Network 4.6.1 software (fluxus-engineering.com). The MP
for DNA extraction following the established protocol (Baca algorithm was used to resolve reticulations in the final network
et al. 2012). A 309-bp-long fragment of mitochondrial DNA (Polzin and Daneschmand 2003).
control region was amplified in singleplex PCR reactions with Phylogenetic trees were created by Bayesian method in
five different primer pairs (Baca et al. 2012). PCR products MrBayes 3.2.3 (Ronquist et al. 2012) and maximum likeli-
were pooled and converted into Illumina sequencing library hood in morePhyML 1.14 (Criscuolo 2011) based on
following the protocol proposed by Meyer and Kircher PhyML 3.0 (Guindon et al. 2010). In the MrBayes analyses,
(2010). Two uniquely indexed libraries based on independent- we adopted a mixed model to sample appropriate substitution
ly amplified PCR products were produced, pooled with other models across the larger space in the Bayesian MCMC anal-
libraries and sequenced on MiSeq platform. Adaptor and qual- ysis itself, avoiding the need for a priori model testing
ity trimming were performed with Adapter Removal (Huelsenbeck et al. 2004). Additionally, we applied gamma-
(Lindgreen 2012). PCR primer sequences were trimmed in distributed rate variation across sites with five discrete rate92 Page 4 of 17 Sci Nat (2016) 103: 92
Estimation of extinction time
To determine the extinction time of the cave bear, we collected
207 dates of its remains. The dates were carefully selected from
the set of 513 dates reported in various references, including an
excellent and comprehensive review of dating the cave bear
remains done by Pacher and Stuart (2009). We discarded the
dates based on molecular, uranium series, uranium/thorium,
stratigraphy context and strata dating, dates of U. kudarensis
remains, without dating error, infinitive dates and dates out of
range 47,500 ± 3000 BP after calibration, as well as the dates of
remains with unclear affiliation to the cave bear. All the dates
were calibrated to the years BP in OxCal v4.2.4 (Bronk
Ramsey et al. 2013) using intCal13 atmospheric curve
(Reimer et al. 2013). In the assessment of the extinction time,
calibrated mean values and standard deviations were used.
The best-fitted distribution to the set of dates was selected
adopting the Akaike information criterion (AIC) and Schwarz
Bayesian criterion (BIC) based on the maximum likelihood
method applying fitdist from library fitdistrplus in R package
(R_Core_Team 2015). Besides R package, statistical analyses
were also performed in Statistica (StatSoft_Inc. 2011). To de-
fine the extinction time, we performed a procedure based on
five methods devised by Strauss and Sadler (1989), Solow
(1993), Roberts and Solow (2003), Solow and Roberts
(2003) and McInerny et al. (2006) and implemented by
Rivadeneira et al. (2009). In addition, we applied the newly
developed inverse-weighted McInerney Gaussian-resampled
(GRIWM) (Bradshaw et al. 2012) and bootstrap-resampled
(BRIWM) methods (Saltré et al. 2015). In the last two ap-
Fig. 2 The third phalanx (JST4) excavated in the Stajnia Cave and con- proaches, we assumed 10,000 iterations and α level 0.05.
firmed genetically as belonging to the cave bear Ursus ingressus
Results
categories as suggested by jModeltest 2.1 based on Bayesian
Information Criterion (BIC) and decision theory (DT) criteri- Dating sample from Stajnia Cave
on (Darriba et al. 2012; Guindon et al. 2010). Two indepen-
dent runs starting from random trees, each using eight Markov Direct radiocarbon dating the JST4 sample in Poznań
chains, were applied. The trees were sampled every 100 Radiocarbon Laboratory yielded an unexpected young 14C
generations for 20,000,000 generations. In the final analysis, date 20,930 ± 140 years BP. Collagen yield was low (ca.
we selected trees from the last 5,500,000 generations that 2 mg after ultrafiltration, 0.3 % of initial sample’s weight)
reached the stationary phase and convergence (i.e. the stan- but the computed C/N ratio (3.6) was close to the upper limit
dard deviation of split frequencies stabilized and was lower of the accepted range: 2.9–3.6 (DeNiro 1985; van Klinken
than the proposed threshold of 0.01). The tree inferred in 1999). To verify this date, the remaining bone powder was
morePhyML was based on the best-fit substitution model dated in Gliwice Absolute Dating Methods Centre for inde-
TPM2uf+Γ found in jModeltest 2.1 among 1624 candidate pendent replication. The GADAM extraction procedure
models according to BIC and DT criteria. The best heuristic yielded more than 3.5 mg of collagen from the processed bone
search algorithm, nearest neighbour interchanges (NNI) and sample and resulted in the 14C date 21,900 ± 90 years BP, still
subtree pruning and regrafting (SPR), in morePhyML was quite young. The C/N ratio was estimated at a similar level.
applied. The non-parametric bootstrap analysis in PhyML After calibration, the second date obtained for the JST4 sam-
was carried out applying 1000 replicates and assuming the ple is older (26,114 cal. years BP) than the first one
approximate likelihood ratio test (aLRT) based on a (25,251 cal. years BP) and their 95 % probability intervals
Shimodaira-Hasegawa-like procedure in morePhyML. (25,648–24,807 and 26,360–25,905 cal. years BP,Table 1 Direct radiocarbon dates of cave bear remains younger than 26,000 14C years BP
Locality Country Specimen Sample number Unc. date years Calibrated date years BP Haplotype Source reference
BP ± error
Mean ± SD Median 95 % CI
Sci Nat (2016) 103: 92
Stajnia Cave Poland 3rd phalanx Poz-61719 20,930 ± 140a 25,251 ± 205 25,267 25,648–24,807 U. ingressus This paper
Grotta Sopra Fontana Marella Italy ? UZ-2512/ETH-5I98 21,810 ± 200a 26,082 ± 202 26,058 26,516–25,712 – Perego et al. (2001)
Stajnia Cave Poland 3rd phalanx GdA-3894 21,900 ± 90a 26,114 ± 113 26,101 26,360–25,905 U. ingressus This paper
Vindija Cave Croatia ? Beta-171313 22,020 ± 100a 26,235 ± 137 26,221 26,516–25,985 U. ingressus Hofreiter et al. (2004b)
Szeleta Cave Hungary Bone ISGS-A-0131 22,107 ± 130a 26,331 ± 175 26,317 26,681–26,006 – Adams (2002)
Grotta Sopra Fontana Marella Italy ? UZ-2513/ETH-5199 22,310 ± 200a 26,600 ± 273 26,585 27,122–26,102 – Perego et al. (2001)
Chiostraccio Cave Italy Long bone Beta-285012 22,670 ± 130 26,990 ± 197 27,010 27,340–26,595 – Martini et al. (2014)
Rebolal Cave Spain Adult jaw Ua-24939 22,915 ± 445a 27,128 ± 429 27,161 27,886–26,202 – Grandal-d’Anglade
et al. (2006)
Vindija Cave Croatia ? Beta-156100 23,780 ± 120a 27,851 ± 120 27,841 28,103–27,624 U. ingressus Hofreiter et al. (2004a)
Rochedane France 3rd metatarsal GrA-52632 23,900 ± 110 27,948 ± 134 27,934 28,231–27,701 U. spelaeus Bocherens et al. (2014)
Chiostraccio Cave Italy Phalanx Beta-340969 23,930 ± 100 27,969 ± 132 27,956 28,245–27,725 – Martini et al. (2014)
Cova Eirós Spain Humerus Ua-4298 24,090 ± 440 28,237 ± 405 28,205 29,070–27,475 – Grandal-d’Anglade and
Vidal Romani (1997)
Bame aux Pirotas Switzerland Metapodial frag. ETH-16879 24,170 ± 230 28,223 ± 237 28,216 28,679–27,783 – Morel and Schifferdecker
(1997)
Bärenloch Austria Radius Ua-24796 24,175 ± 365 28,271 ± 343 28,249 28,956–27,634 – Bochud et al. (2007)
Komarowa Cave Poland Skull Poz-339 24,550 ± 220 28,582 ± 248 28,587 29,075–28,050 – Wojtal et al. (2015)
Deszczowa Cave Poland Mandible frag. Poz-28284 24,580 ± 200 28,615 ± 227 28,619 29,069–28,129 U. ingressus Wojtal et al. (2015)
Izabela Textorisová Cave Slovakia Metacarpal IV VERA-5679 24,640 ± 170 28,680 ± 193 28,680 29,076–28,280 – Sabol et al. (2014)
Istállós-kő Cave Hungary Caudal vertebra OxA-16640 24,950 ± 140 28,997 ± 183 28,983 29,379–28,660 – Davies and Hedges
(2008–2009)
Gamssulzenhöhle Austria ? VRI-1159 25,090 ± 640 29,310 ± 699 29,266 30,696–28,002 – Fiebig and Pacher (2006)
Istállós-kő Cave Hungary Metacarpal OxA-16639 25,500 ± 210 29,659 ± 314 29,633 30,305–29,060 – Davies and Hedges
(2008–2009)
Sirgenstein Cave Germany m1 OxA-12013 25,560 ± 130 29,707 ± 224 29,681 30,199–29,310 U. ingressus Hofreiter et al. (2007)
Cova Eirós Spain Rib Ua-38460 25,592 ± 602 29,781 ± 625 29,784 30,959–28,622 – Pérez-Rama et al. (2011)
Gamssulzenhöhle Austria ? Hv 16893 25,965 ± 780 30,093 ± 765 30,101 31,480–28,537 – Withalm (2001)
The haplotype assignment was based on DNA studies
CI confidence interval
a
Dates which were excluded in the conservative estimation of extinction time
Page 5 of 17 9292 Page 6 of 17 Sci Nat (2016) 103: 92
respectively) do not overlap (Table 1). The dates are, however, The sequence was identical with eight sequences isolated
similar because the extreme values of their intervals differ in from the cave bear specimens excavated in Gamssulzen Cave,
only 257 years. Therefore, this double check suggested a high Austria (FM177760.1), Herdengel, Austria (FN663158.1),
degree of reliability of the dating. Nixloch, Austria (AJ300172.1, FN390842.1), Peştera cu
The dates are in agreement with the results of multidisciplin- Oase, Romania (EU289394.1) and Potocka Zijalka, Slovenia
ary geological, geochemical, palaeobotanical, palaeontological (AJ300173.1, FN390843.1, FN390844.1). The maximum
and isotopic analyses of the Stajnia Cave (Nowaczewska et al. percentage of differences with U. ingressus sequences was
2013; Urbanowski et al. 2010; Żarski et al. 2017). They seem to 3.2 % and averaged 1.1 %, whereas other bears differed from
indicate that the layer C18, in which the specimen under study the Stajnia sequence by an average of 4.4 % (U. spelaeus),
was found, was accumulated in cold climate conditions and cor- 6.8 % (U. kudarensis) and 11.5 % (U. arctos). The smallest
responds to the Leszno (Brandenburg) Phase dated to 20.1–23.7 difference from brown bear sequences was 8.5 %. It seems to
(±1.1 to 2.4) ka (Marks 2012; Marks et al. 2015). suggest that it is improbable that the JST4 sample belongs to
the brown bear (represented by almost 500 sequences) as it
Genetic verification of Stajnia sample was suspected following the young radiocarbon date. In agree-
ment with that, the Stajnia sequence grouped significantly
The young dates could suggest that the sample belongs to the with other U. ingressus sequences in phylogenetic trees
brown bear because it is assumed that cave bear disappeared (Fig. 4).
about 24,000 14C years BP (28,000 cal. years BP) (Bocherens The tree confirmed separation of the cave bear into three
et al. 2014; Hofreiter et al. 2002; Martini et al. 2014; Pacher main clades: U. kudarensis, U. spelaeus and U. ingressus.
and Stuart 2009; Sabol et al. 2014; Wojtal et al. 2015). Interestingly, a U. rossicus sequence showed a closer affilia-
Therefore, we verified its taxonomic assignment based on tion to U. ingressus, whereas most of the sequences assigned
genetic studies. Analyses of sequence reads obtained from to U. spelaeus ladinicus were located at the base of other
two independent libraries produced from the JST4 sample modern cave bears, with the exclusion of U. kudarensis.
(11,340 and 10,208 reads mapped to the reference sequence, This is indicative of U. s. ladinicus representing an early di-
respectively) resulted in identical 309-bp-long consensus se- verged lineage of cave bears related to ancestors of the modern
quences. Having removed a poli-T/C stretching from the mid- cave bears. Median joining haplotype network placed the
dle of the sequence and having trimmed 3′ end to fit the other JST4 sample within the U. ingressus group, too (Fig. 5). Its
available cave bear sequences, the 254-bp-long fragment was haplotype occupies the central place in respect to others,
used for subsequent analyses. Comparisons of this sequence which agrees with its quite wide distribution in Europe
with all the available 631 sequences from cave and brown (Austria, Romania and Slovenia). It would arguably imply
bears clearly indicated its affiliation to the cave bear classified that the Stajnia sample, with its young radiocarbon age, is a
to U. ingressus haplotype (Fig. 3). remnant from the common haplotype which survived to the
north of the Carpathian Mountains.
Other young dates of the cave bear
In Table 1, we compared the dates of the cave bear remains
younger than 26,000 14C years BP reported so far, and in
Fig. 6, we presented the distribution of collected cave bear
dates. At the top of the list, there is the date for Stajnia Cave
specimen (Poz-61719) and the next one is the date of the
remains from Grotta Sopra Fontana Marella in Italy, albeit it
was not genetically confirmed. The second youngest sample
from which a DNA was extracted comes from Vindija Cave. It
is almost 1000 years older than the Poz-61719.
The dates younger than 20,000 years were reported by other
authors (see Pacher and Stuart (2009) for the review). However,
they concerned samples that were carbonated or contaminated,
which could rejuvenate the dates. Other young samples came
from mixed fossil sets, therefore can represent the brown bear
Fig. 3 Differences between the sequence from the Stajnia Cave and other
classified cave bears (Ursus kudarensis, ingressus, spelaeus) and the
or other mammals. The other young date of U. ingressus
brown bear (Ursus arctos). The results clearly indicate a close similarity 13,230 years BP from Geißenklösterle was revised by the second
of the Stajnia sample to Ursus ingressus dating to 24,210 years BP (Münzel and Athen 2009). This dateSci Nat (2016) 103: 92 Page 7 of 17 92 Fig. 4 MrBayes phylogenetic tree for cave bears (Ursus kudarensis, ingressus, rossicus, spelaeus) and the brown bear (Ursus arctos) mtDNA control region. The sequence from the Stajnia sample indicated by an arrow groups significantly within U. ingressus clade. Values at nodes correspond in the order to: posterior probabilities estimated in MrBayes, support values calculated in morePhyML based on a Shimodaira-Hasegawa-like procedure and bootstrap values obtained in PhyML. Values for probabilities and bootstrap percentages lower than 0.50 and 50 %, respectively, were omitted Fig. 5 Haplotype network of cave bears (Ursus kudarensis, ingressus, spelaeus) and the brown bear (Ursus arctos). The haplotype from the Stajnia Cave occupies the central position within U. ingressus haplotypes
92 Page 8 of 17                                                                                                            Sci Nat (2016) 103: 92

                                                                             These approaches, however, are known to be the most conserva-
                                                                             tive and are susceptible to the type II errors, giving confidence
                                                                             limits too broad, with the range greater than the nominal value.
                                                                             Their results can even indicate that an already extinct species
                                                                             should still be considered as extant (Rivadeneira et al. 2009). In
                                                                             fact, the method by Roberts and Solow (2003) produced a slight-
                                                                             ly younger extinction time, ca. 21,300 cal. years BP, and the
                                                                             method by Solow and Roberts (2003) an even much younger
                                                                             time, ca. 9500 cal. years BP for the set with Poz-61719 date.
                                                                                The most reliable seems the GRIWM approach because it is
                                                                             the only one providing model accuracy and no misclassifica-
                                                                             tion issues. This is achieved by its inherent down-weighting
                                                                             interval procedure and by taking into account the uncertainties
                                                                             in record dates (Saltré et al. 2015). The range of 95 % confi-
Fig. 6 Distribution of the cave bear (Ursus spelaeus sensu lato) dates       dence intervals based on this is ca. 26,100–24,300 cal. years BP
(yellow bars) with fitted density functions of lognormal distribution (red   and contains other 10 calculations (Table 2). It is 2000 to
line). The function was averaged for two distributions with one of the
dates for the Stajnia sample (Poz-61719 or GdA-3894)
                                                                             3500 years later than it was previously assumed (Bocherens
                                                                             et al. 2014; Hofreiter et al. 2002; Martini et al. 2014; Pacher
                                                                             and Stuart 2009; Sabol et al. 2014; Wojtal et al. 2015) and 1600
should nevertheless be considered with caution, too, as the col-             to 2600 years later than the recent estimations using GRIWM,
lagen content of this sample is not reliable (Münzel et al. 2011).           too, but with smaller sets of dates (Cooper et al. 2015).
Similarly, the date 17,385 years BP obtained for a cave bear                    Not all young dates listed in Table 1 provided chemical data
specimen from Bärenloch was also criticized as contaminated                  about the collagen, and some of them were criticized for exactly
by recent carbon and another dating resulted in >46,900 years                this reason (Bocherens et al. 2014). These dates may not neces-
BP (Blant et al. 2010). It demonstrates that the radiocarbon dates,          sarily be wrong, but they should be confirmed by additional
especially young, should be verified and the taxonomic assign-               studies. Therefore, we also carried out an assessment of the ex-
ment of such specimens should be checked by ancient DNA                      tinction time excluding all the dates younger than the first youn-
analyses, e.g. a sample from Rebolal Cave in Spain dated to                  gest date for which collagen was well examined (Table 1). We did
13,785 years BP (Grandal-d’Anglade et al. 2006) and from                     not consider in these calculations the dates from the Stajnia Cave
Urals sites dated to 16,470 years BP (Kosintsev et al. 2003). So             specimen, either. This conservative approach for most of the
far, the specimen from Stajnia remains the youngest case of the              methods gave extinction times older by merely 650–1800 years
cave bear, which was twice dated and genetically studied. Only               (Table 2). Only the methods by Roberts and Solow (2003) and
six other samples younger than 26,000 14C years BP were veri-                Solow and Roberts (2003) delivered younger extinction times.
fied by DNA studies (Table 1).                                               According to the GRIWM methods, the most probable extinction
                                                                             time is in the range of ca. 26,100–27,000 cal. years BP.
                                                                                Our calculated extinction times correspond to a δ18O decrease
Estimation of the cave bear’s extinction time                                in the revised Greenland record developed by combining the
                                                                             Cariaco Basin (Hulu Cave) and Greenland ice core (GICC05)
We estimated the time of the cave bear’s disappearance process-              records (Cooper et al. 2015; Fig. 7). The estimated extinction
ing 207 dates of its remains by means of seven methods                       time falls in the middle of Greenland Stadial 3 (GS-3) (or at the
(Table 2). The calculations were based on two data sets. Since               beginning in the conservative estimation) and matches also a
we obtained two dates for the Stajnia sample, only one of them               significant decline in the density function describing the distribu-
was included in a given calculation to avoid a bias of this sample.          tion of cave bear records (Fig. 7). The results indicate that the
   Differences in the determined extinction time between sets                cave bear did not survive into the LGM, if we assume a rigorous
with two Stajnia dates were very small (Table 2). The inclusion              definition of its duration from 23,000 to 19,000 cal. years BP
of the older Stajnia date (GdA-3894) resulted in the extinction              (Waelbroeck et al. 2009). However, other researchers (see
time being older by only ca. 1000 years than the calculations with           Hughes et al.(2013) for review) suggest that the global ice max-
the younger date (Poz-61719). Generally, almost all the methods              imum started slightly earlier 26,000 (Peltier and Fairbanks 2006)
gave very similar mean extinction times of about 25,800 to                   or 26,500 cal. years BP (Clark et al. 2009). In this case, the
24,500 cal. years BP. This range is also inclusive of the time               species became extinct at the beginning of the LGM.
(24,807 cal. years BP) at two standard deviations for Poz-                      The estimated extinction time of cave bear corresponds to
61719 date. Only the method by Roberts and Solow (2003)                      the end of the first megafaunal transition cluster, which began
and Solow and Roberts (2003) produced deviated results.                      around interstadials 5 to 7 in northern Europe (Cooper et al.
Sci Nat (2016) 103: 92 Page 9 of 17 92
Table 2 Estimated extinction time of cave bear for seven methods and three data sets
Method With Stajnia Cave date: Conservative approach
Poz-61719 GdA-3894
Strauss and Sadler (1989) 24,910 25,754 26,664
Solow (1993) 24,912 25,755 26,665
McInerny et al. (2006) 24,916 25,759 26,669
Solow and Roberts (2003) 9462 25,474 8788
Roberts and Solow (2003) 21,266 25,327 22,731
BRIWM (Saltré et al. 2015) 24,540 (24,412–25,839) 25,725 (25,414–25,871) 26,378 (26,276–28,004)
GRIWM (Bradshaw et al. 2012) 24,749 (24,291–25,234) 25,720 (25,263–26,081) 26,555 (26,117–27,007)
For the first five methods, the upper boundary of 95 % confidence interval is presented. For BRIWM and GRIWM methods, median and 95 %
confidence interval (in parentheses) are shown
2015). We also observed a gradual decrease in the number of Palaeoloxodon naumanni in Japan. The second cluster of ex-
reported dating records for the cave bear since that time tinctions occurred during the termination of the Pleistocene
(Fig. 7). Besides the cave bear also two other mammalian (ca. 14,000 to 11,000 cal. years BP) and concerned the species
species disappeared at the end of this extinction event: the that survived the LGM. Our results indicate that the cave bear
short-faced bear Arctodus simus in East Beringia and elephant represents the pre-LGM megafaunal disappearance.
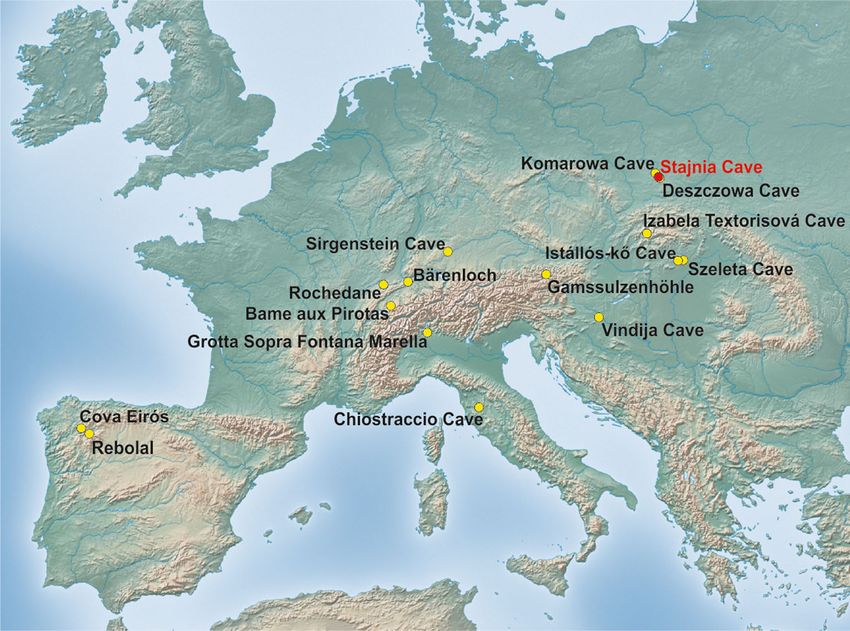
Fig. 7 Distribution of late dates of the cave bear (Ursus spelaeus sensu Bradshaw et al. (2012). Horizontal bars indicate 95 % confidence interval
lato) samples in the time scale (yellow diamonds). The youngest date of for BRIWM and GRIWM methods. Two standard deviations for the Poz-
the Stajnia sample confirmed genetically was indicated (Poz-61719). The 61719 date are also marked by a short black vertical line (2SD). The
red curve in the upper part corresponds to the density function averaged results were compared with the revised Greenland ice core δ18O curve
for distributions with one of the dates for the Stajnia sample. Symbols (in black) developed by combining the Cariaco Basin (Hulu Cave) and
above the curve indicate cave bear extinction times for two data sets, Greenland ice core (GICC05) records (Cooper et al. 2015).
including the Stajnia Poz-61719 date (circles) or GdA-3894 date Corresponding Greenland stadials (GS) and interstadials (GI) as well as
(squares), estimated by methods: SS Strauss and Sadler (1989), S strict definition of the Last Glacial Maximum (LGM) were marked. The
Solow (1993), M McInerny et al. (2006), SR Solow and Roberts (2003), results show that the cave bear became extinct in the middle of the cold
RS Roberts and Solow (2003), BRIWM Saltré et al. (2015) and GRIWM stadial GS-392 Page 10 of 17 Sci Nat (2016) 103: 92
Discussion early diverged giant panda (Ailuropoda melanoleuca)
(Grandal-d’Anglade 2010; Van Heteren et al. 2009).
Potential factors influencing cave bear extinction The vegetarian diet of the cave bear is also confirmed by
many studies of stable isotopes (δ13C, δ15N) from bone and
A variety of causes of the cave bear extinction have so far been tooth collagen (Blant et al. 2010; Bocherens et al. 1994, 1997,
proposed (Kurten 1958; Münzel et al. 2011; Pacher and Stuart 2006; Fernández-Mosquera et al. 2001; Horacek et al. 2012;
2009; Stiller et al. 2010; Stuart and Lister 2007). Dramatic Krajcarz et al. 2014; Nelson et al. 1998; Pacher et al. 2012;
climate changes were most often reported. Climate deteriora- Vila Taboada et al. 1999). Having analysed isotope composi-
tion began in Europe 33,000 cal. years BP and culminated in tion, no differences were found between still vegetarian habits
24,000 cal. years BP, when Scandinavian Ice Sheet reached its of U. spelaeus and U. ingressus from Ach valley (Münzel
maximum range (Clark et al. 2009; Marks 2012). Generally, et al. 2011). Similarly, coexisting U. ingressus and
the climate change at the end of the Last Glacial caused severe U. spelaeus eremus from Austrian caves Gamssulzen and
changes in plant communities in the whole of Europe and Ramesch were also exclusively herbivorous, although they
resulted in the considerable reduction of boreal forest and could consume different plant types and/or plants from differ-
the spread of dry shrubland, steppes and tundra (Harrison ent habitats (Bocherens et al. 2011b; Münzel et al. 2014). The
and Prentice 2003; Ray and Adams 2001). Just before the most comprehensive isotopic studies of cave bear samples
estimated extinction time of the cave bear, between 28,000 from 60,000–25,000 cal. years BP (MIS 3) showed neither
and 27,000 cal. years BP, the climate in central Europe became taxonomic nor geographic pattern both in east-west and
extremely dry (Musil 2010). At around 27,000 cal. years BP, a south-north directions (Krajcarz et al. 2016). The most distinct
significant cooling occurred, which resulted in the formation isotopic sets came only from high Alpine sites located over
of cold continental steppe and forest steppe with tundra con- 1500 m above sea level, as well as two Romanian sites Peştera
ditions. Further extreme cooling led to the development of cu Oase and Urşilor. Some isotopic gradient with altitude was
continental climate in 25,000–23,000 cal. years BP and cold also observed. The studies indicated that the cave bear was
continental steppe or forest steppe with sites similar to tundra. homogeneous in the global scale according to its vegetarian
Simultaneously, continuous permafrost developed in England, diet and was characterized by low ecological flexibility.
northern France, northern Belgium, the Netherlands, northern On the other hand, some isotope analyses were indicative
Germany and northern Poland with the lowest temperatures of an omnivorous diet for cave bears (Hildebrand et al. 1996;
(Renssen and Vandenberghe 2003). Generally, the period Richards et al. 2008; Robu et al. 2013). However, such results
28,000–22,000 cal. years BP was characterized by a very cold should be considered with caution because they may be influ-
and extremely arid climate in the whole of central and north- enced by many other factors not related to diet, e.g. individual
western Europe, resulting in the accumulation of loess and the age, environmental conditions, climate, physiology and hiber-
formation of tundra gley soils. In the northernmost regions, nation length (see Grandal-d’Anglade et al. (2011) and Pacher
climate resembled polar deserts. In this period, even southern and Stuart (2009)), for discussion). Nevertheless, we cannot
Europe was dominated by xerophytic steppe, grassland and rule out some dietary flexibility of cave bears in their depen-
dry shrubland with only a small contribution of eurythermic dence on local food type accessibility. For example,
conifers, as it is indicated by pollen records (Fletcher et al. U. ingressus from Loutra Arideas Cave in Greece was mainly
2010). As a result of the climate cooling, vegetation seasons herbivorous but probably fed also on aquatic animals, as it is
shortened and the availability of high quality plant material transpires from isotopic studies (Dotsika et al. 2011).
decreased, which was crucial for cave bears’ survival because Similarly, comparative analysis of dental microwear of
plants were the main source of its food. specimens from Goyet Cave in Belgium did not support
Cave bears are generally considered herbivorous, follow- dietary specialisation of cave bears but rather indicated a
ing morphometric analyses of their skull and dentition mixed model based on plants, meat, invertebrates and
(Grandal-d’Anglade and Lopez-Gonzalez 2004; Kurtén supposedly bones (Peigné et al. 2009). However, these
1976; Mattson 1998; Rabeder et al. 2000; Van Heteren et al. studies were criticised by Bocherens (2009) for choosing
2009, 2014), limb proportions (Athen 2006) and bite forces in too specialised reference herbivorous bears and for miss-
its jaws (Grandal-d’Anglade 2010). The herbivory of this bear ing comparability in extant bears with similar food pref-
is also supported by a relatively thick dental enamel cap erences. Recent microwear studies associated with stable
(Mackiewicz et al. 2010) and several adaptations in enamel isotope analyses provided no evidence for the carnivory
structure (Wiszniowska et al. 2010) to harder and more of the cave bear and revealed that this herbivorous bear
abrasive food items. Figueirido et al. (2009) came to the op- showed some ecological flexibility, probably related to
posite conclusions based on morphometrical studies of bear climate fluctuations and competition between various hap-
skulls, but these studies were criticized by the lack of allome- lotypes (Münzel et al. 2014). Other microwear analyses
tric correction and inclusion of all extant bear taxa, e.g. the led to a conclusion that some cave bears consumed moreSci Nat (2016) 103: 92 Page 11 of 17 92
bones than the brown bear (Pinto Llona 2006, 2013). 2011; Stiller et al. 2010) and attacks by predators, such as
Together with tooth marks left probably by cave bears lions, hyenas and wolves (Diedrich 2014) for meat acquisition
on bones (Pinto and Andrews 2004; Quilès et al. 2006; as well as competition for the shelter and denning space. It
Rabal-Garces et al. 2012), the findings can also be could be an important factor in its extinction, since the cave
interpreted as occasional changes in preferential herbivo- bear was more dependent on caves for hibernation than the
rous habits related to pre-hibernation period or seasonal brown bear or other species (Kurtén 1976; Rabeder et al.
resource availability. Supposedly, with the deteriorating 2000). Evidence of hunting and exploitation of cave bears
high-quality plant material, mainly herbivorous cave bears by Middle and Upper Palaeolithic humans was reported in
were able to shift more to omnivorous diet. Given the many regions of Europe (Austria, Belgium, Czech Republic,
great area inhabited by cave bears, it is not beyond the Germany, Italy, Poland, Slovakia and Slovenia) (see Wojtal
bounds of possibility that distinct populations developed et al. (2015) for review). One of the spectacular examples is a
adaptations to local environmental conditions. flint projectile embedded in a vertebrae found in Höhle Fels in
Nevertheless, the available data seem to indicate that the Swabian Jura (Germany), where human hunters contributed to
cave bear was strongly dependent on plant food. Therefore, it the extinction of cave bears through a long period (Münzel
seems reasonable to assume that its extinction was triggered and Conard 2004a, b; Münzel et al. 2011). Hofreiter et al.
off by a decrease in vegetation productivity resulting from (2007) argued that there is no evidence for a significant cli-
climate cooling in the last glacial, especially in stadials GS- mate change around the time of the cave bear’s replacement in
6, GS-5 and GS-3. In agreement with that, we found a signif- Ach valley (Germany) and assumed that the most plausible
icant correlation between Greenland ice core δ18O record be- explanation is an increasing pressure from humans and the
ing a good climate proxy and the distribution of the cave bear difference in dietary habits of different haplotypes of the cave
record described by the density function (averaged for Poz- bear. Humans could also be responsible for the decrease in
61719 and GdA-3894). The calculated number of cave bear genetic diversity and the final extinction of the cave bear in
records decreased with the decline of δ18O value. The corre- Ardèche (France) (Bon et al. 2011).
lation coefficient was 0.24 (number of data = 464; p val-
ue = 3 × 10⁻⁷) in the long time span from 34,510 (the maxi- Spatial pattern of cave bear survival and extinction
mum of the distribution) to 25,250 cal. years BP (the mean
date of Stajnia sample). In the short time period from 27,850 The global picture of the cave bear genetic diversity shows
(the GI-3) to 25,250 cal. years BP, the correlation coefficient that its populations may have declined from east to west
was 0.48 (n = 131; p value = 7 × 10⁻⁹). Our results correspond (Stiller et al. 2014). It may be true but only on a continental
with the findings by Stiller et al. (2010), who also showed a scale (Asia–Europe), assuming that the youngest bears in Asia
stepwise decline of the cave bear population over are represented by the samples from Ural dated to 35,773 and
25,000 years. The extinction of more than ten other species 41,026 cal. years BP (Pacher and Stuart 2009). They are much
was dated to the similar period (Cooper et al. 2015), pointing older than those from Europe. However, the amassed dates of
to the climate change as the global factor for the megafauna the last records of the cave bear younger than 29,000 cal. years
transformation. In contrast the to the cave bear, its close rela- BP are distributed in distant sites in the whole of Europe,
tive, the brown bear (U. arctos), did not experience a decline including not only western sites (Austria, Germany, France,
in its population size at that time (Stiller et al. 2010), which Switzerland) and south (Croatia, Italy, Spain) but also eastern
may result from its larger dietary flexibility as an omnivore. regions (Hungary, Poland, Slovakia)—Table 2. It seems to
Simultaneously, the cave bear from France, Germany and imply that the extinction of this mammal was preceded by a
Poland remained faithful to its vegetarian diet for a long peri- fragmentation of its populations into separated subpopula-
od of time, despite climatic fluctuations as it is suggested by tions, as it was found for bears from the north-western alpine
stable isotope studies (Bocherens et al. 2014; Krajcarz et al. foreland (Bocherens et al. 2014). It resulted from an ongoing
2014; Münzel et al. 2014). After the cave bear extinction, increase of steppes, tundra and open landscapes at the expense
U. arctos took over its ecological and nutritional niche and of woodland, which were fragmented into smaller habitats. In
more often used caves during dormancy (Bocherens 2015; such patchy woodland remnants with sufficient plant produc-
Kurtén 1976; Münzel et al. 2011). tivity, the cave bear could hold on longer (Martini et al. 2014).
Our results show that the extinction of the cave bear falls One of such regions is likely to be the Kraków-
within the middle of GS-3 stadial, one of the coldest phases of Częstochowa Upland in Poland. This region is typically abun-
the last glacial period. The colder climate not only decreased dant in the cave bear remains. Besides Stajnia Cave, quite late
availability of plant food but also extended the already long cave bear remains were also found in other caves in this re-
hibernation period of the cave bear (Rabeder et al. 2000). At gion, i.e. in Komarowa Cave (dated to 24,550 ± 220 14C years
that time, the bear was more susceptible to human hunting BP), Deszczowa Cave (24,580 ± 200 14C years BP) and
(Grayson and Delpech 2003; Kurten 1958; Münzel et al. Mamutowa Cave (26,010 ± 150 14C years BP). It confirms92 Page 12 of 17 Sci Nat (2016) 103: 92
that one of the latest cave bear populations could survive rel- results, however, one should err on the side of caution, owing
atively long in this region. The numerous remains of the cave to the controversies over the stratigraphy and the age of the
bear were found across the whole profile in the Stajnia Cave, sediments in this cave (Lorenc 2013).
from layers dating from more than 100,000 years (MIS 5c). It The Kraków-Częstochowa Upland is a typical karst region. It
would be indicative of a region inhabited continuously by an was suggested that such biotopes with suitable microclimate
abundant population of the cave bear till its extinction in the were pleasant for flora and fauna also in the context of the other
Greenland Stadial 3. late cave bear found in Chiostraccio Cave in Italy (Martini et al.
Despite the location of Kraków-Częstochowa Upland 2014). In fact, karst regions are characterized by a diversified
north from Carpathians, this region could be a refugial area relief rich in slopes, ridges, valleys and sinkholes (dolines). It
because it was not covered by ice sheet during the last glacial. results in various amounts of solar radiation, shading and albedo
At the time of its maximum extent between ca. 23,000 and on different parts of the slopes and in consequence air tempera-
19,500 years BP (Clark et al. 2009), Scandinavian Ice Sheet ture, air humidity and soil moisture (Bárány-Kevei 1999; Bátori
only reached the location of Płock and Konin, about 200 km et al. 2014b; Bokwa et al. 2008). Lower parts of valleys and
north of the Stajnia Cave (Marks 2012). Furthermore, the sinkholes offer colder and wet conditions but more stable tem-
central part of this upland was not glaciated either in the pre- perature, whereas steep slopes (especially facing the south) are
vious glacial periods owing to its elevation and unique con- characterized by higher temperatures. Moreover, slopes with
figuration of the surrounding river valleys. As a result, ice different geographic exposure obtain various amounts of radia-
sheets that came across this morphological step bypassed a tion depending on the time of the day (Bárány-Kevei 1999;
BGlacial Oasis of the Polish Jura [‘Jurassic Highland’]^ Bokwa et al. 2008). These local environment conditions strong-
(Lewandowski 2011). Although a consistency between stra- ly differentiate the composition of vegetation in karst regions on
tigraphy and radiocarbon age in cave sediments of the a local scale (Bátori et al. 2011, 2014a, b; Bokwa et al. 2008;
Kraków-Częstochowa Upland was not always found Ozkan et al. 2010). Thanks to that, they could play a refugial role
(Lorenc 2013), there are some results suggesting that this re- in the preservation of vascular plants providing primary habitats
gion could offer quite favourable environmental conditions to other species (Bátori et al. 2011; Bátori et al. 2012; Ozkan
for plants and animals even in stadials and play a role of local et al. 2010), including herbivorous cave bear. The expositional
refugium for the forest fauna during the Saalian and Vistulian and environmental differences in karst terrains could cause snow
glaciations (Stefaniak et al. 2009). For example, the studies of cover to melt in various periods and vegetation to be available to
Biśnik Cave located in the southern part of Kraków- cave bears in more abundance for longer time in the year, espe-
Częstochowa Upland suggested that even in cold periods, cially on the south-facing slopes receiving more solar radiation
birds and mammals typical for forest environments or associ- and showing lower probability of ground frosts. It made the
ated with dense vegetation were present in the vicinity of the ecosystem less dependent on the global climate. Such local cli-
cave (Cyrek et al. 2010; Socha 2009; Stefaniak et al. 2009; matic diversity was described also for the Kraków-Częstochowa
Tomek et al. 2012). Detailed bioclimatic analyses based on the Upland with its consequence on vegetation composition and
deposition of rodent assemblages in the cave’s layers from the distribution (Bokwa et al. 2008; Medwecka-Kornaś and
late Middle and Late Pleistocene also indicated conditions of Kornaś 1977). Together with the favourable microclimate, the
typical temperate climate in the biome of deciduous forests karst regions offered a permanent access to water supplied by
(Socha 2014). Interestingly, a temperature decrease deduced deeper aquifers, whereas the high porous carbonate rocks were
from the layers corresponding to the coldest stadials (e.g. the better protected against frost, which lead to greater stability of
LGM) was smaller than it should be expected from global their slopes (Martini et al. 2014).
climatic conditions in these periods (Socha 2014). Similarly, Our findings show that apart from the Mediterranean
the fauna assemblage found in the Borsuka Cave in the south- region with the assumed more temperate climate, there
ern part of the Kraków-Częstochowa Upland also demonstrat- were also other areas with relatively favourable environ-
ed the presence of forest adapted species at the end of the mental conditions, enabling a prolonged survival of the
Upper Plenivistulian (Wilczyński et al. 2012). For example, vanishing species. This provides corroborative evidence
in the layer dated to 32,000–31,000 cal. years BP, the elk Alces for the concept of the cryptic northern refugia, which are
alces and the beaver Castor fiber were reported (Wilczyński areas at high latitudes characterized by a climate that
et al. 2012). Assemblages dated to the LGM recovered from allowed the survival of temperate species during the gla-
the Mamutowa Cave in the Upland are similar to other north- cials (Schmitt and Varga 2012; Stewart and Lister 2001).
ern refugial faunas around the Carpathian Bow, whereas those Among several others, the Carpathian region is considered
from the Deszczowa contain forest-associated temperate or to be such refugial area, following the studies of plant and
even thermophile species such as the pine marten Martes mammal fossils from the sites that proved the occurrence
martes and the fat dormouse Glis glis (Nadachowski et al. of temperate species during the LGM (Sommer and
2009; Sommer and Nadachowski 2006). With the latter Nadachowski 2006; Stewart and Lister 2001). The idea ofSci Nat (2016) 103: 92 Page 13 of 17 92
cryptic northern refugia was further supported by the ge- Athen K (2006) Biostatistical investigation of long bones and metapodial
bones of Ursus spelaeus and Ursus deningeri. Sci Ann Sch Geol
netic diversity of several modern species like the bank vole
Aristot Univ Tessaloniki (AUTH) 98:159–162
Clethrionomys glareolus (Kotlík et al. 2006; Wójcik et al. Baca M, Stankovic A, Stefaniak K, Marciszak A, Nadachowski A,
2010), the common vole Microtus arvalis (Stojak et al. Węgleński P, Mackiewicz P (2012) Genetic analysis of cave bear
2015) or the adder Vipera berus (Ursenbacher et al. 2006). specimens from Niedźwiedzia cave. Palaeontol Electron 15:16
Baca M et al (2014) Ancient DNA and dating of cave bear remains from
Niedźwiedzia Cave suggest early appearance of Ursus ingressus in
Sudetes. Quat Int 339-340:217–223
Conclusions Bandelt HJ, Forster P, Rohl A (1999) Median-joining networks for infer-
ring intraspecific phylogenies. Mol Biol Evol 16:37–48
The youngest record of the cave bear dated to ca. 26,000– Bárány-Kevei I (1999) Microclimate of karstic dolines. Acta
Climatologica Universitatis Szegediensis 32-33:19–27
25,000 cal. years BP and genetically confirmed as Barnosky AD, Koch PL, Feranec RS, Wing SL, Shabel AB (2004)
U. ingressus, together with its estimated extinction time, indi- Assessing the causes of late Pleistocene extinctions on the conti-
cates that its isolated populations could survive into the middle nents. Science 306:70. doi:10.1126/science.1101476
of GS-3 stadial, the coldest phase of the Last Glacial. Its disap- Baryshnikov G (1998) Cave bears from the Paleolithic of the Greater
Caucasus Quaternary Paleozoology in the Northern Hemisphere
pearance resulted from a climate cooling, which fragmented the
XXVII:69–118
habitats of the cave bear and reduced plant productivity that Baryshnikov GF, Puzachenko AY (2011) Craniometrical variability in the
constituted its staple diet. Low temperatures also prolonged cave bears (Carnivora, Ursidae): multivariate comparative analysis.
hibernation period for this bear, resulting in the animal becom- Quat Int 245:350–368. doi:10.1016/j.quaint.2011.02.035
ing more vulnerable to attacks by predators and to human hunt- Bátori Z, Gallé R, Erdős L, Körmöczi L (2011) Ecological condi-
tions, flora and vegetation of a large doline in the Mecsek
ing. The cave bear was disappearing by separation into isolated Mountains (South Hungary). Acta Botanica Croatica 70:147–
populations confined to small habitats. One of them was karst 155. doi:10.2478/v10184-010-0018-1
terrains, e.g. the Kraków-Częstochowa Upland in Poland, Bátori Z, Kormoczi L, Erdos L, Zalatnai M, Csiky J (2012) Importance of
where the latest so far record of the cave bear was discovered. karst sinkholes in preserving relict, mountain, and wet-woodland plant
species under sub-Mediterranean climate: a case study from southern
The regions offered relatively favourable environmental condi- Hungary. J Cave Karst Stud 74:127–134. doi: 10.4311/2011lsc0216
tions, with milder microclimate retaining sufficient ecosystem Bátori Z et al (2014a) The conservation value of karst dolines for vascular
productivity. Thanks to that, cave bears could survive in these plants in woodland habitats of Hungary: refugia and climate change.
refugial areas longer. It cannot be ruled out that it survived the Int J Speleol 43:15–26. doi:10.5038/1827-806x.43.1.2
Last Glacial Maximum, as some of the specimens seem to Bátori Z et al (2014b) Microclimate-vegetation relationships in natural
habitat islands: species preservation and conservation perspectives.
indicate, but the data should be re-dated and confirmed by Q J Hung Meteorol Serv 118:257–281
ancient DNA analyses. Further research is needed to fully un- Blant M, Bocherens H, Bochud M, Braillard L, Constandache M,
derstand paleoecology of this cave bear population. Jutzet J-M (2010) Le gisement à faune würmienne du
Bärenloch: Préalpes fribourgeoises, Suisse. Bull de la Société
Fribourgeoise des Sci Nat = Bull der Naturforschenden Gesch
Acknowledgments This paper is dedicated to the memory of the late Freiburg 99:149–170. doi:10.5169/seals-308891
Ana Stankovic, an excellent paleogeneticist and the best friend of ours, Bocherens H (2009) Dental microwear of cave bears: the missing
who tragically passed away in her prime but remains forever in our hearts. temperate/boreal vegetarian Bcarnivore^. Proc Natl Acad Sci U S
We are very grateful to Bogdan Ridush for the helpful discussion about A 106:E133 . doi:10.1073/pnas.0910368106author reply E134
cave bears in Ukraine and to Marcelo Rivadeneira for his useful remarks Bocherens H (2015) Isotopic tracking of large carnivore palaeoecology in
about the estimation of extinction time. This work was supported by the mammoth steppe. Quat Sci Rev 117:42–71. doi:10.1016/j.
Polish National Science Centre grant no. 2012/07/B/NZ8/02845. The quascirev.2015.03.018
publication editing was funded by the KNOW Consortium, Faculty of Bocherens H, Fizet M, Mariotti A (1994) Diet, physiology and
Biotechnology, University of Wroclaw. ecology of fossil mammals as inferred from stable carbon and
nitrogen isotope biogeochemistry: implications for Pleistocene
Open Access This article is distributed under the terms of the bears. Palaeogeogr Palaeoclimatol Palaeoecol 107:213–225.
Creative Commons Attribution 4.0 International License (http:// doi:10.1016/S0031-0182(96)00106-X
creativecommons.org/licenses/by/4.0/), which permits unrestricted Bocherens H, Billiou D, Patou-Mathis M, Bonjean D, Otte M, Mariotti A
use, distribution, and reproduction in any medium, provided you give (1997) Paleobiological implications of the isotopic signatures (13C,
appropriate credit to the original author(s) and the source, provide a link 15 N) of fossil mammal collagen in Scladina Cave (Sclayn,
to the Creative Commons license, and indicate if changes were made. Belgium). Quat Res 48:370. doi:10.1006/qres.1997.1927
Bocherens H, Drucker DG, Billiou D, Geneste JM, van der Plicht J
(2006) Bears and humans in Chauvet Cave (Vallon-Pont-d’Arc,
Ardèche, France): insights from stable isotopes and radiocarbon
References dating of bone collagen. J Hum Evol 50:370–376. doi:10.1016/j.
jhevol.2005.12.002
Adams B (2002) New radiocarbon dates from Szeleta andIstállóskő Bocherens H et al (2011a) Isotopic evidence for dietary ecology of cave
Caves, Hungary. Praehistoria 3:53–55 lion (Panthera spelaea) in North-Western Europe: prey choice, com-
Alscher M (2013) Morphologie und Metrik der Phalangen in der petition and implications for extinction. Quat Int 245:249–261.
Höhlenbärengruppe. Universität Wien doi:10.1016/j.quaint.2011.02.023You can also read