LIFE INSIDE A DINOSAUR BONE: A THRIVING MICROBIOME - bioRxiv
←
→
Page content transcription
If your browser does not render page correctly, please read the page content below
bioRxiv preprint first posted online Sep. 7, 2018; doi: http://dx.doi.org/10.1101/400176. The copyright holder for this preprint
       (which was not peer-reviewed) is the author/funder. All rights reserved. No reuse allowed without permission.

              LIFE INSIDE A DINOSAUR BONE: A THRIVING MICROBIOME

     EVAN T. SAITTA1*, RENXING LIANG2, CHUI Y. LAU2, CALEB M. BROWN3,
     NICHOLAS R. LONGRICH4, THOMAS G. KAYE5, BEN J. NOVAK6, STEVEN
     SALZBERG7, PAUL DONOHOE8, MARC DICKINSON9, JAKOB VINTHER10,11, IAN D.
     BULL12, RICHARD A. BROOKER10, PETER MARTIN13, GEOFFREY D. ABBOTT8,
     TIMOTHY D. J. KNOWLES14, KIRSTY PENKMAN9, and TULLIS C. ONSTOTT2

     1
         Integrative Research Center, Section of Earth Sciences, Field Museum of Natural History,
     Chicago, Illinois, USA
     2
         Department of Geosciences, Princeton University, Princeton, New Jersey, USA
     3
         Royal Tyrrell Museum of Palaeontology, Drumheller, Alberta, Canada
     4
         Department of Biology and Biochemistry and Milber Centre for Evolution, University of
     Bath, Bath, United Kingdom
     5
         Foundation for Scientific Advancement, Sierra Vista, Arizona, USA
     6
         Revive and Restore, San Francisco, California, USA
     7
         Departments of Biomedical Engineering, Computer Science, and Biostatistics, Center for
     Computational Biology, McKusick-Nathans Institute of Genetic Medicine, Johns Hopkins
     University, Baltimore, Maryland, USA
     8
         School of Natural and Environmental Sciences, Newcastle University, Newcastle upon
     Tyne, UK
     9
         Department of Chemistry, University of York, York, UK
     10
          School of Earth Sciences, University of Bristol, Bristol, UK
     11
          School of Biological Sciences, University of Bristol, Bristol, UK
     12
          School of Chemistry, University of Bristol, Bristol, UK
     13
          School of Physics, University of Bristol, Bristol, UK
     14
          School of Chemistry and School of Arts, University of Bristol, Bristol, UK

     Abstract: Fossils were long thought to lack original organic material, but the discovery of
     organic molecules in fossils and sub-fossils, thousands to millions of years old, has
     demonstrated the potential of fossil organics to provide radical new insights into the fossil
     record. How long different organics can persist remains unclear, however. Non-avian
     dinosaur bone has been hypothesised to preserve endogenous organics including collagen,

                                                                       1
bioRxiv preprint first posted online Sep. 7, 2018; doi: http://dx.doi.org/10.1101/400176. The copyright holder for this preprint
       (which was not peer-reviewed) is the author/funder. All rights reserved. No reuse allowed without permission.

     osteocytes, and blood vessels, but proteins and labile lipids are unstable during diagenesis or
     over long periods of time. Furthermore, bone is porous and an open system, allowing
     microbial and organic flux. Some of these organics within fossil bone have therefore been
     identified as either contamination or microbial biofilm, rather than original organics. Here,
     we use biological and chemical analyses of Late Cretaceous dinosaur bones and sediment
     matrix to show that dinosaur bone hosts a diverse microbiome. Fossils and matrix were
     freshly-excavated, aseptically-acquired, and then analysed using microscopy, spectroscopy,
     chromatography, spectrometry, DNA extraction, and 16S rRNA amplicon sequencing. The
     fossil organics differ from modern bone collagen chemically and structurally. A key finding
     is that 16S rRNA amplicon sequencing reveals that the subterranean fossil bones host a
     unique, living microbiome distinct from that of the surrounding sediment. Even in the
     subsurface, dinosaur bone is biologically active and behaves as an open system, attracting
     microbes that might alter original organics or complicate the identification of original
     organics. These results suggest caution regarding claims of dinosaur bone ‘soft tissue’
     preservation and illustrate a potential role for microbial communities in post-burial
     taphonomy.

                                                                       2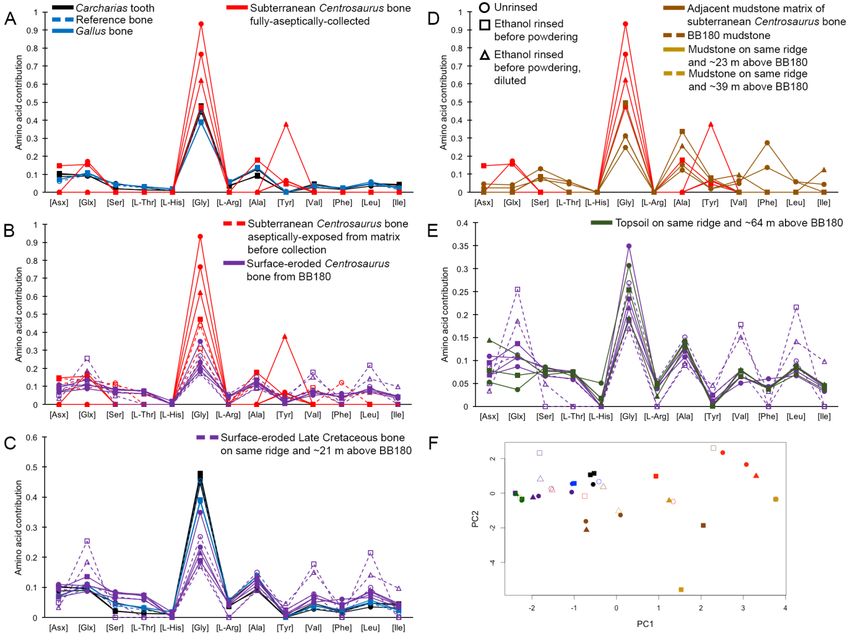
bioRxiv preprint first posted online Sep. 7, 2018; doi: http://dx.doi.org/10.1101/400176. The copyright holder for this preprint
       (which was not peer-reviewed) is the author/funder. All rights reserved. No reuse allowed without permission.

     Introduction: Fossils have often been thought to contain little original organic material due
     to decay and diagenesis. However, discoveries of ancient DNA (Orlando et al. 2013) and
     peptide (Demarchi et al. 2016) sequences in sub-fossils as well as very ancient biomolecules
     such as sterols (Melendez et al. 2013) and melanin (Vinther et al. 2008) in fossils challenge
     this view. These finds show that organic remains can potentially persist for thousands to even
     millions of years depending on the biomolecule and environmental conditions. These organic
     molecular fossils can potentially shed light on the biology and evolution of extinct organisms
     (e.g., colour, morphology, behaviour, phylogeny), providing unique insights into past life and
     the origins of present life. In theory, organic remains capable of surviving millions or tens of
     millions of years may offer palaeontologists new insights into the biology of organisms
     distantly related to any living species, such as dinosaurs. However, exactly how long
     different types of organic molecules can potentially survive remains debated.
                Dinosaur bone has been reported to contain endogenous organics such as collagen,
     osteocytes, and blood vessels. These reports, if verified, could radically change the study of
     macroevolution and the physiology of extinct organisms given the immense potential of
     protein sequence data to shed light on the biology and systematics of extinct organisms
     (Pawlicki et al. 1966; Schweitzer et al. 2005a, 2005b, 2007a, 2007b, 2008, 2009, 2013, 2014,
     2016; Asara et al. 2007; Organ et al. 2008; Schweitzer 2011; Bertazzo et al. 2015; Cleland et
     al. 2015; Schroeter et al. 2017). Most of these reports rely on structural observations, mass
     spectrometry, and immunohistochemistry. It makes sense to search for collagen in ancient
     remains since such sub-fossils and fossils are often bone, dentine, or enamel and these
     calcified tissues have protein compositions dominated by collagen, which relative to many
     other vertebrate proteins is robust due to its decay resistance, triple helical quaternary
     structure, and high concentration of thermally stable amino acids (Engel & Bächinger 2005;
     Persikov et al. 2005; Sansom et al. 2010; Wang et al. 2012). However, others have criticised
     such mass spectral data, saying that it represents laboratory or environmental contamination
     (Buckley et al. 2008, 2017; Bern et al. 2009) or statistical artefacts (Pevzner et al. 2008).
     Furthermore, antibodies are known to cause occasional false positives (True 2008). Organics
     within fossil bone of appreciable age/thermal maturity producing ‘vessel’- and ‘cell’-shaped
     molds have alternatively been identified as biofilm (Kaye et al. 2008).
                Such structures, if indeed Mesozoic ‘soft tissue’, would be expected to consist
     primarily of extracellular structural proteins and phospholipids of cell membranes, which are
     unstable through diagenesis and deep time (Bada 1998; Briggs & Summons 2014). While
     protein sequences are lost through hydrolysis of peptide bonds, phospholipids hydrolyse at

                                                                       3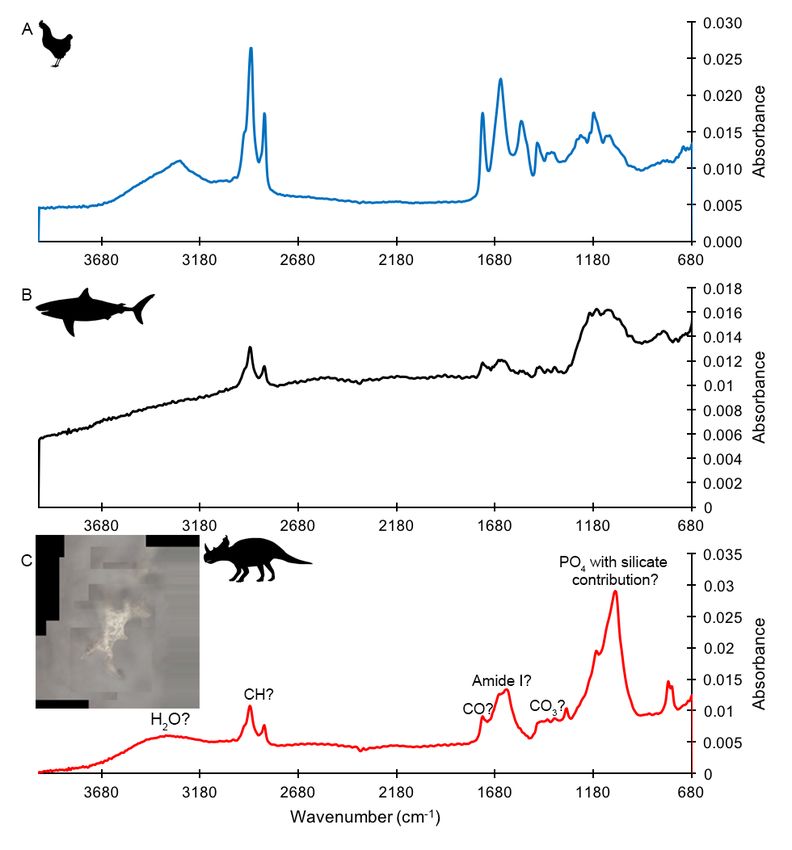
bioRxiv preprint first posted online Sep. 7, 2018; doi: http://dx.doi.org/10.1101/400176. The copyright holder for this preprint
       (which was not peer-reviewed) is the author/funder. All rights reserved. No reuse allowed without permission.

     their ester bonds, freeing fatty acids from glycerol-phosphate polar heads (Eglinton & Logan
     1991; Zuidam & Crommelin 1995). The resulting free fatty acids, however, can polymerise
     in situ to form kerogen-like aliphatic hydrocarbons which are stable through diagenesis
     (Stankiewicz et al. 2000; Gupta et al. 2006a, 2006b, 2007a, 2007b, 2008, 2009). The
     conversion of the hydrocarbon tails of phospholipids into kerogen is far more likely than
     preserving a protein sequence of amino acids. One survey of amino acids in fossil bone
     (Armstrong et al. 1983) yielded data in which fossils older than the Upper Pleistocene no
     longer had amino acid compositions similar to fresh bone proteins. Additionally, amino acid
     concentration decreased from recent bone to Mesozoic bone, while racemisation increased
     sharply from recent bone to Upper Pleistocene bone, but then gradually decreased from that
     point through to Mesozoic bone, suggesting protein loss and contamination (see supplemental
     material for a reanalysis of this data from Armstrong et al. 1983). However, partially intact
     Pliocene peptides about 3.4 Ma have been verified from exceptionally cold environments
     (Rybczynski et al. 2013) and under what, for now at least, seems like unique molecular
     preservational mechanisms in the calcite crystals of eggshell from 3.8 Ma (Demarchi et al.
     2016). Both of these examples, however, a far younger than Mesozoic fossils.
                Even simple estimations do not predict protein survival in the deep geologic record.
     Assuming fairly average human body composition (Janaway et al. 2009) and mass, it only
     takes ~5 % of the water already present in the body to hydrolyse all of the peptide bonds in
     the proteome (supplemental material). This calculation assumes a closed system with no
     endogenous water, and it seems unlikely that any fossil matrix would be anhydrous
     throughout its entire taphonomic history. For example, it requires a significant amount of
     diagenetic alteration to fossilise resin into desiccated copal and amber (Langenheim 1969,
     1990; Lambert & Frye 1982; Mills et al. 1984; Pike 1993; Ragazzi et al. 1993; Villanueva-
     García et al. 2005). Calculating exponential decay curves assuming first order kinetics paints
     an even more pessimistic picture. Modifications at terminal regions and internal peptide
     bonds shielded by steric effects can result in longer observed half lives of peptide bonds
     under hydrolysis (Kahne & Still 1988; Radzicka et al. 1996; Testa & Mayer 2003). At 25 °C
     and neutral pH, peptide bond half lives as a result of uncatalysed hydrolysis for the relatively
     stable acetylglycylglycine (C-terminal), acetylglycylglycine N-methylamide (internal), and
     the dipeptide glycylglycine are 500, 600, and 350 years, respectively (Radzicka et al. 1996).
     Even assuming a very conservative half life of 600 years for all peptide bonds in the average
     human body at arguably unextreme conditions (25 °C and neutral pH), no bonds would
     remain after ~51,487 years (supplemental material):

                                                                       4
bioRxiv preprint first posted online Sep. 7, 2018; doi: http://dx.doi.org/10.1101/400176. The copyright holder for this preprint
(which was not peer-reviewed) is the author/funder. All rights reserved. No reuse allowed without permission.
b = h/(2^(y/t1/2))
where b = number of peptide bonds = 1,
y = years,
h = estimated number of peptide bonds in average human body = 6.78844 x 10^25,
and t1/2 = half life in years under uncatalysed hydrolysis = 600.
The half life in this case is 3 orders of magnitude too short in order to get peptide bonds
surviving into the Mesozoic (~66 Ma); a half life of ~769,130 years would be required. This
does not even take into consideration environmental or diagenetic increases in temperature or
pH fluctuations, nor does it take into account scavenging or microbial/autolytic decay. Of
course, these values are based on some very extreme assumptions and should not be taken as
precise estimates, but rather, as framing the enormity of the challenge for Mesozoic protein
survival. Empirically derived estimates for collagen and osteocalcin upper age limits based
on experimentally observed gelatinisation and Gla-rich mid-region epitope loss, respectively,
can give widely different estimates at 20 °C: 15,000 years for collagen and 580,000 years for
osteocalcin. The estimates vary according to temperature. For example, at 0 °C, the upper age
limit for collagen and osteocalcin are estimated at 2,700,000 and 110,000,000 years,
respectively (Nielsen-Marsh 2002). Even frozen collagen by these estimates fails to survive
long enough for the possibility of survival in Mesozoic specimens, and no Mesozoic fossils
have been preserved frozen since they predate the appearance of the current polar ice caps.
The kinetics of thermal instability under non-enzymatic reactions are just one hurdle
that such ‘soft tissues’ would have to clear. Bone is also an open system (Bada et al. 1999),
allowing for organic and microbial influx. Invasion of microbes into the bone could lead to
the enzymatic degradation of endogenous organics (in addition to any autolytic degradation
from endogenous enzymes) and mobile breakdown products of organics can be lost from the
bone into the surroundings.
Here, chemical and biological analyses of freshly-collected, aseptically-acquired, Late
Cretaceous surface-eroded and excavated subterranean dinosaur bones, compared to
associated sediment and soil, younger fossil, and modern bone controls, show evidence for a
microbiome. Analyses were conducted using variable pressure scanning electron microscopy
(VPSEM), energy dispersive X-ray spectroscopy (EDS), light microscopy, attenuated total
reflectance Fourier-transform infrared spectroscopy (ATR FTIR), pyrolysis-gas
chromatography-mass spectrometry (Py-GC-MS), high performance liquid chromatography
(HPLC), radiocarbon accelerator mass spectrometry (AMS), Qubit fluorometer,
5bioRxiv preprint first posted online Sep. 7, 2018; doi: http://dx.doi.org/10.1101/400176. The copyright holder for this preprint
(which was not peer-reviewed) is the author/funder. All rights reserved. No reuse allowed without permission.
epifluorescence microscopy (propidium iodide (PI) and SYTO 9 staining), and 16S rRNA
amplicon sequencing.
In addition to finding little evidence for the preservation of original proteinaceous
compounds, our findings suggest that bones not only act as open systems just after death and
exhumation, but also as fossils in the subsurface. Microbial communities appear to be
thriving inside the dinosaur bones collected here.
Materials and Methods:
Aseptic fossil acquisition
Samples of Late Cretaceous fossil dinosaur bone, along with associated sediment and soil
controls were obtained from the Dinosaur Park Formation (Late Campanian) in Dinosaur
Provincial Park, Alberta, Canada (supplemental material). The Dinosaur Park Formation is a
well-sampled alluvial-paralic unit deposited during a transgressive phase of the Western
Interior Seaway, for which a diverse vertebrate fauna has been documented over more than a
century of collection (Currie and Koppelhus, 2005). The bone samples were collected from a
monodominant bonebed (BB180) of the centrosaurine Centrosaurus apertus (Ornithischia;
Ceratopsidae), located 3 m above the contact with the underlying Oldman Formation (precise
location data available at the Royal Tyrrell Museum of Palaeontology). The mudstone-hosted
bone-bearing horizon is an aggregation of disarticulated but densely packed bones, with a
vertical relief of 15–20 cm. Similar to other ceratopsid bonebeds from the same stratigraphic
interval (Ryan et al. 2001; Eberth and Getty, 2005), the recovered skeletal remains are nearly
exclusively from Ceratopsidae, and with all diagnostic ceratopsid material assignable to
Centrosaurus apertus, with the site interpreted as a mass-death assemblage. Fossil material
was collected under a Park Research and Collection Permit (No. 16-101) from Alberta
Tourism, Parks and Recreation, as well as a Permit to Excavate Palaeontological Resources
(No. 16-026) from Alberta Culture and Tourism and the Royal Tyrrell Museum of
Palaeontology, both issued to C. M. Brown.
Sandstone and mudstone overburden was removed with pick axe and shovel (~1 m
into the hill and ~1 m deep) to make accessible a previously unexcavated region of the
bonebed, stopping within ~10 cm of the known bone-bearing horizon. A few hours after
commencement of overburden removal, excavation of the mudstone to the bone-bearing
horizon was conducted using awl and scalpel. Subterranean Centrosaurus bones (identified
as a small rib and a tibia) were first discovered non-aseptically, exposing them to the air in a
6bioRxiv preprint first posted online Sep. 7, 2018; doi: http://dx.doi.org/10.1101/400176. The copyright holder for this preprint
(which was not peer-reviewed) is the author/funder. All rights reserved. No reuse allowed without permission.
manner identical to typical palaeontological excavation and allowing for rapid detection of
bones.
At this point, aseptic techniques were then implemented to expose more of the bone in
order to determine its size and orientation. It is worth qualifying the usage of the term
‘aseptic’ in this study. Paleontological field techniques have changed little over the last
century, and it is likely near impossible to excavate fossils in an absolutely sterile manner
(e.g., the process of matrix removal induces exposure, the wind can carry environmental
contaminants onto exposed fossils, etc.). In light of this, the term ‘aseptic’ is used here to to
acknowledge the inability to provide completely sterile sampling conditions, while still
indicating that efforts are taken to reduce introducing contamination to the samples to an
extent that might influence results. Our success at reasonably reducing contamination is
evidenced by the fact that our samples yielded consistent and interpretable results.
During aseptic excavation and sampling, nitrile gloves washed in 70 % ethanol and a
facemask were worn. All tools (i.e., awl, scalpel, dremel saw) were sterilised with 10 %
bleach, followed by 70 % ethanol, and a propane blowtorch at the site. Bone samples several
cm long were obtained using a diamond-coated dremel saw or utilising natural fractures in
the bone. For the fully-aseptically-collected bone samples, the bone was sampled without
first removing the surrounding matrix, although fractures in the mudstone did appear during
sampling so that the samples cannot be said to have been unexposed to the air, especially
prevalent in the small rib sample sent to Princeton University for analysis. Also sampled were
the aseptically-excavated, but completely-exposed portions of the subterranean bone
immediately next to the fully-aseptically-collected bone region (i.e., the regions of the bone
fully-exposed using aseptic techniques after initial discovery of the bone in order to
determine size and orientation and referred to here as aseptically-exposed). All samples were
collected in autoclaved foil without applying consolidants, placed in an ice cooler kept in the
shade, and brought back to the field camp freezer that evening. Surface-eroded bone from
BB180 and on the same ridge above BB180, mudstone excavated from the overburden-
removed area of BB180 and several cm below the weathered surface of the same ridge above
BB180, and topsoil on the same ridge above BB180 were similarly aseptically-acquired and
stored (i.e., sterile tools, foil, and personal wear; kept cool). In total, eight bone samples,
eight sediment samples, and two soil samples were collected. Samples were transported to the
Royal Tyrrell Museum of Palaeontology in a cooler. Following accession at the museum,
replicates of the samples were transported on ice as logistically possible to the University of
Bristol and Princeton University and stored at 4 or -80 °C, respectively, as required for
7bioRxiv preprint first posted online Sep. 7, 2018; doi: http://dx.doi.org/10.1101/400176. The copyright holder for this preprint
(which was not peer-reviewed) is the author/funder. All rights reserved. No reuse allowed without permission.
analysis upon arrival (i.e., both Princeton and Bristol received a sample of fully-aseptically-
collected bone, BB180 mudstone, topsoil, etc.). Samples were mailed to Princeton on ice,
while samples were transported via plane to Bristol without refrigeration (maximum time
unrefrigerated under 24 hr).
These aseptically-collected Dinosaur Provincial Park fossil bone, mudstone, and soil
samples were compared to younger fossils and modern bone (supplemental material). In
particular, chicken (Gallus gallus domesticus) bone was obtained frozen from a Sainsbury’s
grocery store in Bristol, UK and was kept refrigerated (4 °C). This chicken bone can be
safely assumed to contain high amounts of collagen. Other controls included amino acid
composition data from a reference bone (fresh, modern sheep long bone) and radiocarbon
data from an 82–71 Ka radiocarbon-dead bovine right femur used as a standard from the
literature (Cook et al. 2012). Black, fossil sand tiger shark teeth (Carcharias taurus) eroded
from Pleistocene-Holocene sediments were non-aseptically-collected from the surface of the
sand on a beach in Ponte Vedra Beach, Florida, USA with no applied consolidants and were
stored at room temperature. It should be noted that Florida experiences a high temperature
climate relative to many samples typically studied for palaeoproteomics. Teeth samples
represent a mix of dentine and enamel as opposed to normal bone tissue, with relative
concentrations depending on how easily the different tissues fragmented during powdering.
Technical grade humic acid was also purchased from Sigma Aldrich as a further control.
ATR FTIR
ATR FTIR was carried out at the University of Bristol. Samples were powdered in a sterile
mortar and pestle (70 % ethanol rinsed) and then demineralised in 10 mL of 0.5 M
hydrochloric acid (HCl) for 5 days, with the acid replaced three times during that period by
spinning in a centrifuge and pipetting off the old acid and replacing with fresh acid. After
demineralisation and pipetting out the last acid volume, the samples were rinsed with 10 mL
of milli-Q water and spun in a centrifuge three times, replacing the water each time. After
pipetting out the last water volume, samples were freeze dried overnight.
The demineralisation products were analysed using a Nicolet iN10 MX FTIR
spectrometer with a KBr beamsplitter and MCT/A detector. The sample was placed on a KBr
disc, and background spectra were collected before analysing each sample for subtraction
purposes. The sample contacted with a Ge tip microATR attachment that was cleaned with
ethanol. Next, 128 scans were collected over a wavelength range from 675–4000 cm-1 at 8
8bioRxiv preprint first posted online Sep. 7, 2018; doi: http://dx.doi.org/10.1101/400176. The copyright holder for this preprint
(which was not peer-reviewed) is the author/funder. All rights reserved. No reuse allowed without permission.
cm-1 resolution. The spectrometer aperture windows were set to 50 µm giving an effective
sample collection area of about 17 µm.
Light microscopy, VPSEM, and EDS
The same demineralised samples that underwent ATR FTIR were subsequently analysed by
VPSEM and EDS performed at the University of Bristol. Specimens were mounted onto
carbon tape on standard SEM pin-stubs and were not electrically coated. A Zeiss SIGMA-HD
VPSEM instrument was used in this work, with the instrument’s chamber filled with a
recirculated nitrogen supply to negate against the electrical surface charge accumulation on
the sample. Typical vacuum levels during analysis varied between 0.1 and 0.25 mbar. Control
of the SEM, with a specified spatial resolution of 1.2 nm under such low-vacuum conditions,
was performed using the microscope’s standard SmartSEM user interface. For standard
sample imaging, a beam current of 1.7 nA (30 µm aperture), 15 kV accelerating voltage, and
a 10 mm working height (horizontal sample; no tilt) were used. During the accompanying
EDS compositional analysis of regions of interest within the sample, both the beam current
and accelerating voltage were increased to 2.9 nA and 20 kV, respectively, with the sample
position in the instrument remaining unchanged. An EDAX Ltd. (Amatek) Octane Plus Si-
drift detector was used for the EDS analysis, with control performed through the
accompanying TEAM analytical software. Collection periods of 100 s were used, with the
electrically (Peltier) cooled detector operating with a dead-time of 20 % to permit for
individual peak discrimination from the 30,000–40,000 counts per second incident onto the
device. Elemental quantification of the spectra obtained was performed using the eZAF
deconvolution and peak-fitting algorithm based upon the ratios of the differing K, L, and M
X-ray emissions.
After VPSEM and EDS analysis, the same samples were imaged using light
microscopy utilising a Leica DFC425 C digital camera under magnification from a Leica
M205 C stereomicroscope.
Py-GC-MS
Py-GC-MS was conducted at the School of Chemistry, University of Bristol. Sample
fragments were rinsed in 70 % ethanol prior to powdering with a sterile mortar and pestle (70
% ethanol rinsed) in an attempt to remove exterior contamination. A quartz tube was loaded
with ~1 mg of the sample powder and capped with glass wool. A pyrolysis unit (Chemical
Data Systems (CDS) 5200 series pyroprobe) was coupled to a gas chromatograph (GC;
9bioRxiv preprint first posted online Sep. 7, 2018; doi: http://dx.doi.org/10.1101/400176. The copyright holder for this preprint
(which was not peer-reviewed) is the author/funder. All rights reserved. No reuse allowed without permission.
Agilent 6890A; Varian CPSil-5CB fused column: 0.32 mm inner diameter, 0.45 µm film
thickness, 50 m length, 100 % dimethylpolysiloxane) and a double focussing mass
spectrometer (ThermoElectron MAT95, ThermoElectron, Bremen; electron ionisation mode:
310 °C GC interface, 200 °C source temperature) with a 2 mL min-1 helium carrier gas.
Samples were pyrolysed in the quartz tube (20 s, 610 °C), transferred to the GC (310 °C
pyrolysis transfer line), and injected onto the GC (310 °C injector port temperature was
maintained, 10:1 split ratio). The oven was programmed to heat from 50 °C (held for 4 min)
to 300 °C (held for 15 min) by 4 °C min-1. A m/z range of 50–650 was scanned (one scan per
second). There was a 7 min delay whereby the filament was switched off for protection
against any pressure increases at the start of the run. MAT95InstCtrl (v1.3.2) was used to
collect data. QualBrowser (v1.3, ThermoFinnigan, Bremen) was used to view data.
Compounds were identified with the aid of the National Institute of Standards and
Technology (NIST) database.
HPLC amino acid analysis
Reversed-phase high performance liquid chromatography (RP-HPLC) for analysing amino
acids was done at the University of York on samples originally sent to the University of
Bristol. Samples from Dinosaur Provincial Park were transported to York on ice. Replicate
sample fragments were either ethanol (70 %) rinsed prior to powdering or powdered without
a rinse with a sterile mortar and pestle (also 70 % ethanol rinsed). Several mg of powder were
accurately weighed into sterile 2 mL glass vials (Wheaton). Then, 7 M HCl (Aristar,
analytical grade) was added, and the vials were flushed with N2. Hydrolysis (18 hr, 110 ºC)
was performed, and samples were rehydrated with a solution containing HCl (0.01 mM) and
L-homo-arginine (LhArg) internal standard. Chiral amino acid pairs were analysed using an
RP-HPLC (Agilent 1100 series; HyperSil C18 BDS column: 250 mm length, 5 µm particle
size, 3 mm diameter) and fluorescence detector, using a modified method outlined by
Kaufman and Manley (1998). Column temperature was controlled at 25 °C and a tertiary
solvent system containing methanol, acetonitrile, and sodium acetate buffer (23 mM sodium
acetate trihydrate, 1.3 µM ethylenediaminetetraacetic acid (EDTA), 1.5 mM sodium azide,
adjusted to pH 6.00 ±0.01 using 10 % acetic acid and sodium hydroxide) was used. Some
replicates of the samples underwent dilution to reduce peak suppression caused by high
mineral content. This involved salt removal by adding 60 µL of 1M HCl to ~2 mg of
powdered sample in a 0.5 mL Eppendorf tube, sonicating for 2 mins to dissolve the powder,
adding 80 µL of 1M KOH to produce a gel suspension, centrifuging for 5 mins, separating a
10bioRxiv preprint first posted online Sep. 7, 2018; doi: http://dx.doi.org/10.1101/400176. The copyright holder for this preprint
(which was not peer-reviewed) is the author/funder. All rights reserved. No reuse allowed without permission.
clear solution from the gel, drying the clear supernatant by centrifugal evaporation, and
finally, rehydration in 20 µL LhArg (Marc Dickinson, unpublished methods).
Principal component analysis of amino acid concentration data was run on R using the
prcomp() command (scale set to ‘TRUE’ in order to normalise the data).
Radiocarbon AMS
Radiocarbon analyses were performed at the BRAMS facility at the University of Bristol.
Fossil bone samples were surface cleaned using an autoclaved razorblade to scrape their
exterior surface. All samples were powdered by mortar and pestle cleaned through
autoclaving and rinsing with 70 % ethanol. Samples were transferred into pre-combusted
(450 °C, 5 hr) culture tubes and 10 mL of 0.5 M HCl were added to eliminate any carbonates.
The HCl solution was replaced as necessary until CO2 effervescence ceased. Samples were
rinsed with three washes of 10 mL MilliQ ultrapure water before freeze-drying. Samples
were weighed into aluminium capsules to obtain ~1 mg C before being combusted in an
Elementar Microcube elemental analyser (also obtaining the % C by mass of the
demineralised samples) and graphitised using an IonPlus AGE3 graphitisation system. The
resulting graphite samples were pressed into Al cathodes and analysed using a MICADAS
accelerator mass spectrometer (Laboratory of Ion Beam Physics, ETH, Zurich). All samples
were blank subtracted using a bone sample known to be radiocarbon ‘dead’, the Yarnton
sample from Cook at al. (2012).
DNA extraction, 16S rRNA amplicon sequencing, and epifluorescence microscopy
DNA extraction and quantification (Qubit fluorometer), epifluoresence microscopy (SYTO
9/propidium iodide (PI) dual staining), and 16S rRNA amplicon sequencing were conducted
at Princeton University. The bone and adjacent mudstone were processed inside a laminar
flow hood after UV treatment (30 min). Specifically, the bone fragments were carefully
picked out and surfaces of the fossil bones were scraped off with an autoclaved razor blade.
The bone, the scrapings, and mudstone were powdered separately, with a sterile mortar and
pestle after autoclaving and UV treatment. The powder from fossil bone samples were either
demineralised in 0.5 M EDTA (pH = 8) or not demineralised. The EDTA demineralised bone
was stained with SYTO 9 dye and propidium iodide (LIVE/DEAD BacLight Bacterial
Viability Kit, Molecular Probes, USA) in the dark for 15 min. These are fluorescent dyes that
intercalate between the base pairs of DNA. The stained samples were analysed using a
11bioRxiv preprint first posted online Sep. 7, 2018; doi: http://dx.doi.org/10.1101/400176. The copyright holder for this preprint
(which was not peer-reviewed) is the author/funder. All rights reserved. No reuse allowed without permission.
fluorescence microscope (Olympus BX60, Japan). Live cells are stained as green whereas
membrane-compromised cells fluoresce red.
Powder (0.25 g) was used to extract DNA from the bone, the scrapings and mudstone
by using Power Viral Environmental RNA/DNA Isolation kit (MO BIO Laboratories,
Carlsbad, CA, USA). However, the DNA yield from the mudstone was below detection (0.5
ng/mL). Therefore, a further attempt was made to extract DNA from a large amount of
powder (5 g bone and 10 g mudstone) using DNeasy PowerMax Soil Kit (QIAGEN,
Germanry) according to the manufacturer’s instruction. Additionally, the slurry from the
EDTA demineralised bone was subjected to DNA extraction using the same large scale kit.
Extracted DNA was then quantified by dsDNA HS Assay kit (Life Technologies, Carlsbad,
USA) and the fluorescence was measured using a Qubit fluorometer (Invitrogen, Carlsbad,
USA).
To prepare the library for 16S rRNA amplicon sequencing, DNA was used as PCR
template to amplify the 16S rRNA gene V4 region using bacterial/archaeal primer
515F/806R (Caporaso et al. 2012). The PCR reaction condition was as follows: initial
denaturation at 94 °C for 3 min; 25 or 30 cycles of denaturation at 94 °C for 45 s, annealing
at 50 °C for 1 min, extension at 72 °C for 90 s and a final extension at 72 °C for 10 min. PCR
product (5 µL) was loaded onto a gel to confirm the amplification by running agarose gel
electrophoresis. The amplicon products were pooled to make the library and sequenced for a
150-bp paired-end reads on Illumina Hiseq 2500 housed in the Genomics Core Facility at
Princeton University. The raw sequences were quality-filtered with a minimum Phred score
of 30 and analysed by QIIME (Quantitative Insights Into Microbial Ecology) software
package (Caporaso et al. 2010). Data will be uploaded onto the Sequence Read Archive
(SRA) of NCBI upon publication.
Results:
Light microscopy, VPSEM, and EDS
VPSEM and EDS of HCl demineralised, freeze-dried dinosaur bones revealed that vessels
(and rare fibrous fragments) (Fig. 1A, D – E, H–J) were white, Si-dominated with O present,
contained holes, and were sometimes infilled with a slightly more prominent C peak
internally. Vessels occured alongside white quartz crystals, which had strong Si peaks and
overall were elementally similar to the vessels, and smaller reddish minerals, originally
presumed to be iron oxide or pyrite, but which had high Si content (Ba was also present).
12bioRxiv preprint first posted online Sep. 7, 2018; doi: http://dx.doi.org/10.1101/400176. The copyright holder for this preprint
(which was not peer-reviewed) is the author/funder. All rights reserved. No reuse allowed without permission.
Demineralisation products differed from those of chicken bone (Fig. 1C, G, M) and
Pleistocene-Holocene shark tooth (Fig. 1B, F, L), which were much more homogenous and
consisted of large fibrous masses. These more recent samples were enriched in C, O, N, and
S, but the shark tooth also had a strong Fe signature and a relatively more prominent S peak
than the chicken bone. The chicken demineralisation product was white, while that of the
shark tooth was black.
ATR FTIR
ATR FTIR of a HCl demineralised, freeze-dried vessel from subterranean Centrosaurus bone
revealed somewhat poorly-resolved, broad organic peaks (Fig. 2C) that were close in position
to peaks that might be expected from various CH, CO, and amide bonds, as well as water,
phosphate, and potentially carbonate and silicate bonds (Lee et al. 2017; also see publicly
available NIST libraries). Pleistocene-Holocene shark tooth (Fig. 2B) and modern chicken
bone (Fig. 2A) demineralisation products similarly revealed peaks consistent with organic
and phosphatic peaks, and the chicken bone had particularly strong organic peaks relative to
phosphate. Maintaining close contact of the sample to the Ge crystal was difficult, resulting
in the poorly resolved peaks, especially in the shark tooth sample.
13bioRxiv preprint first posted online Sep. 7, 2018; doi: http://dx.doi.org/10.1101/400176. The copyright holder for this preprint
(which was not peer-reviewed) is the author/funder. All rights reserved. No reuse allowed without permission.
Figure 1. Light microscopy (A–C) and VPSEM (D–G) images and EDS spectra (H–M) of
demineralised, freeze-dried samples. A–C, samples rested on carbon tape upon SEM stubs
and the pitting was a result of prior VPSEM and EDS analysis. A, Centrosaurus vessels and
associated minerals. B, F, L, Carcharias tooth. C, G, M, Gallus. D, infilled Centrosaurus
vessel. E, Centrosaurus vessel, fibrous material along the centre of the vessel, and associated
reddish minerals around the vessel. H, Centrosaurus vessel exterior from D. I, Centrosaurus
vessel infilling from D. J, associated reddish mineral in Centrosaurus. K, Centrosaurus
fibrous material from E. Centrosaurus samples are fully-aseptically-collected subterranean
bone.
14bioRxiv preprint first posted online Sep. 7, 2018; doi: http://dx.doi.org/10.1101/400176. The copyright holder for this preprint
(which was not peer-reviewed) is the author/funder. All rights reserved. No reuse allowed without permission.
Figure 2. ATR FTIR spectra of demineralised, freeze-dried samples. A, Gallus. B, Carcharias
tooth. C, fully-aseptically-collected subterranean Centrosaurus bone vessel with inset
showing a composite image of the vessel that was analysed.
Py-GC-MS
Centrosaurus bone had low pyrolysate concentration (Fig. 3B) as evidenced by the
significant column bleed at the end of the run and contained mostly early-eluting pyrolysates.
In comparison, humic acid also contained many early-eluting pyrolysates (Fig. 3D). The
pyrogram for Centrosaurus bone does not match that of modern collagen-containing bone
(Fig. 3A) and was most similar to mudstone matrix (Fig. 3C).
Prominent subterranean Centrosaurus bone pyrolysates were indanes/indenes, alkyl
benzenes, and some polycyclic aromatic hydrocarbons. Weak alkane/alkene doublets were
detected in the Late Cretaceous bones (Fig. 4A–D; supplemental material). Variation in the
conspicuousness of these doublets between the fully-aseptically-collected and aseptically-
exposed subterranean Centrosaurus bone samples was apparent (Fig. 5A–D).
15bioRxiv preprint first posted online Sep. 7, 2018; doi: http://dx.doi.org/10.1101/400176. The copyright holder for this preprint
(which was not peer-reviewed) is the author/funder. All rights reserved. No reuse allowed without permission.
Figure 3. Py-GC-MS total ion chromatograms of samples ethanol rinsed before powdering.
A, Gallus bone. B, fully-aseptically-collected subterranean Centrosaurus bone. C, adjacent
mudstone matrix of subterranean Centrosaurus bone in B. D, humic acid (technical grade)
powder.
16bioRxiv preprint first posted online Sep. 7, 2018; doi: http://dx.doi.org/10.1101/400176. The copyright holder for this preprint
(which was not peer-reviewed) is the author/funder. All rights reserved. No reuse allowed without permission.
Figure 4 (Above). Py-GC-MS chromatograms searching for ion m/z ranges typical of alkanes
and alkenes from kerogen in the fully-aseptically-collected subterranean Centrosaurus bone
ethanol rinsed before powdering. Doublets are weakly apparent at best. A, m/z = 55. B, m/z
=57. C, m/z =83. D, m/z =85.
Figure 5. Py-GC-MS chromatograms searching for ion m/z ranges typical of alkanes and
alkenes from kerogen in the aseptically-exposed subterranean Centrosaurus bone ethanol
rinsed before powdering. Doublets are more strongly apparent than in Fig. 4. A, m/z = 55. B,
m/z =57. C, m/z =83. D, m/z =85.
HPLC amino acid analysis
Fully-aseptically-collected subterranean Centrosaurus bone had a total hydrolysable amino
acid (THAA) compositional profile that did not match collagen (Fig. 6A, F). The fully-
aseptically-collected subterranean Centrosaurus bone appeared to be heavily dominated by
Gly. Surface-eroded Late Cretaceous bone from the same outcrop showed a different THAA
compositional profile to the fully-aseptically-collected subterranean Centrosaurus bone, even
when examining bone eroded out of the BB180 quarry itself (Fig. 6B, F). Even more
interestingly, the more thoroughly treated replicates of the aseptically-exposed subterranean
Centrosaurus bone did not match the fully-aseptically-collected subterranean bone and was
similar to the surface-eroded Late Cretaceous bone in THAA compositional profile. Relative
Gly concentration in surface-eroded Late Cretaceous bone was not as high as in the fully-
17bioRxiv preprint first posted online Sep. 7, 2018; doi: http://dx.doi.org/10.1101/400176. The copyright holder for this preprint
(which was not peer-reviewed) is the author/funder. All rights reserved. No reuse allowed without permission.
aseptically-collected subterranean Centrosaurus bone, where Gly heavily dominated the
compositional profile. The surface-eroded Late Cretaceous bone showed somewhat more
similarity to collagen in THAA compositional profile than did the fully-aseptically-collected
subterranean Centrosaurus bone, but ultimately did not align (Fig. 6C, F).
Figure 6. THAA compositional profiles of the samples based on amino acid percentages. A,
Late Cretaceous subterranean bone (red) compared to non-aseptically-collected Pleistocene-
Holocene teeth (black) and modern bone (blue). B, Late Cretaceous subterranean bone (red)
compared to surface-eroded Late Cretaceous bone from the same outcrop (purple). C,
surface-eroded Late Cretaceous bone (purple) compared to Pleistocene-Holocene teeth
(black) and modern bone (blue). D, Late Cretaceous subterranean bone aseptically collected
(red) compared to the adjacent mudstone matrix (brown). E, surface-eroded Late Cretaceous
bone (purple) compared to topsoil at higher elevation (i.e., prairie level) on the same ridge
(green). F, PCA on normalised amino acid percentages (see A–E legends). See supplemental
material (Fig. S.21; Table S.9) for PCA summary. Colour and symbol coding is constant
throughout.
18bioRxiv preprint first posted online Sep. 7, 2018; doi: http://dx.doi.org/10.1101/400176. The copyright holder for this preprint
(which was not peer-reviewed) is the author/funder. All rights reserved. No reuse allowed without permission.
Figure 7. THAA concentrations (summed total of all amino acids measured) of the samples.
A, logarithmic scale comparison of modern Gallus bone (blue), fully-aseptically-collected
subterranean Centrosaurus bone (red), Pleistocene-Holocene surface-eroded shark teeth
(black, with a repeated measurement for the ethanol rinsed sample), and topsoil on same
ridge and ~64 m above BB180 (green). B, comparison between fossil Late Cretaceous bone
and mudstone. Fully-aseptically-collected subterranean Centrosaurus bone (solid red),
adjacent mudstone matrix of subterranean Centrosaurus bone (solid brown), aseptically-
exposed subterranean Centrosaurus bone (open red), BB180 mudstone (open brown),
surface-eroded Centrosaurus bone from BB180 (solid purple), mudstone on same ridge and
~39 m above BB180 (open tan), mudstone on same ridge and ~23 m above BB180 (solid tan),
and surface-eroded Late Cretaceous bone on same ridge and ~21 m above BB180 (open
purple). Diluted replicates likely provide the most accurate measurements given the peak
reduction present in the non-diluted replicates.
19bioRxiv preprint first posted online Sep. 7, 2018; doi: http://dx.doi.org/10.1101/400176. The copyright holder for this preprint
(which was not peer-reviewed) is the author/funder. All rights reserved. No reuse allowed without permission.
Subterranean Centrosaurus bone had far lower THAA concentration (summed total of
all amino acids measured) than did modern chicken bone (Fig. 7A), and the aseptically-
exposed subterranean Centrosaurus bone showed higher THAA concentration than the fully-
aseptically-collected subterranean Centrosaurus bone (Fig. 7B). Surface-eroded Late
Cretaceous bone showed high variability in THAA concentrations, and at least one sample
seemed to show higher THAA concentrations than subterranean Centrosaurus bone.
Late Cretaceous bone was L-amino acid dominated when such amino acids were
above detection limit (Table 1). Surface-eroded Late Cretaceous fossil bone seemed to show
slightly more variability in D/L values than the subterranean bone samples. Similar to the
samples described here, other, non-aseptically-collected, room-temperature-stored Jurassic
and Cretaceous surface-eroded bones have low amino acid concentrations and lack
significant concentrations of D-amino acids (supplemental material).
The adjacent mudstone matrix did not match the subterranean Centrosaurus bone in
THAA compositional profile (Fig. 6D, F). Some of the surface-eroded Late Cretaceous bone
showed similarity to topsoil at the prairie level above the outcrop in THAA compositional
profile (Fig. 6E, F). Although mudstone and fully-aseptically-collected subterranean
Centrosaurus bone did not tend to overlap in THAA compositional profile, they differed
from collagen in diametrically different ways than did the topsoil and surface-eroded Late
Cretaceous bone (Fig. 6F). The fully-aseptically-collected subterranean Centrosaurus bone
tended to have higher Gly and Tyr and lower Glx, Leu, Asx, Val, Ile, and L-Thr than
collagen. Mudstone tended to have higher Tyr, Ala, and Ser than collagen. Topsoil and
surface-eroded Late Cretaceous bones (as well as the more thoroughly treated replicates of
the aseptically-exposed subterranean Centrosaurus bone) tended to have higher Glx, Leu,
Asx, Val, Ile, and L-Thr and lower Gly and Tyr than collagen. The greatest variation between
the samples of this study was in relative Gly and Tyr concentrations, although Tyr variation
was heavily skewed by two samples (one mudstone and one fully-aseptically-collected
subterranean Centrosaurus bone) with unusually high concentrations. Most of the
consistently observed variation occured in Gly relative concentrations, and this metric
appeared somewhat able to discriminate between 1) fully-aseptically-collected subterranean
Centrosaurus bone, 2) modern bone and Pleistocene-Holocene surface-eroded shark teeth,
and 3) topsoil, mudstone, and surface-eroded Late Cretaceous bone (supplemental material).
20bioRxiv preprint first posted online Sep. 7, 2018; doi: http://dx.doi.org/10.1101/400176. The copyright holder for this preprint
(which was not peer-reviewed) is the author/funder. All rights reserved. No reuse allowed without permission.
Asx Glx Ser Ala Val
Sample treatment
D/L D/L D/L D/L D/L
Fully-aseptically-collected subterranean
Centrosaurus bone
Unrinsed NA NA NA NA NA
Unrinsed NA 0 NA NA NA
Ethanol rinsed before powdering 0 0 NA 0 NA
Ethanol rinsed before powdering, diluted NA NA NA NA NA
Subterranean Centrosaurus bone
aseptically-exposed from matrix before
collection
Unrinsed 0 0 0 0 NA
Ethanol rinsed before powdering 0 0 0 0 0
Ethanol rinsed before powdering, diluted 0.214 0.550 0 0.207 0
Adjacent mudstone matrix of
subterranean Centrosaurus bone
Unrinsed 0 0 0 0 0
Unrinsed 0 0 0 0 0
Ethanol rinsed before powdering NA NA 0 0.338 NA
Ethanol rinsed before powdering, diluted NA NA 0 0.299 0
Surface-eroded Centrosaurus bone from
BB180
Unrinsed 0 0 0 0 0
Unrinsed 0.110 0 0 0 0
Ethanol rinsed before powdering 0.082 0.084 0 0.078 0
Ethanol rinsed before powdering, diluted 0 0 0 0 0
Surface-eroded Late Cretaceous bone on
same ridge and ~21 m above BB180
Unrinsed 0 0 0 0 0
Ethanol rinsed before powdering 0 0.538 NA 0 0.750
Ethanol rinsed before powdering, diluted 0 0.951 0 0.323 0.901
Topsoil on same ridge and ~63 m above
BB180
Unrinsed 0.418 0.378 0.020 0.071 0
Ethanol rinsed before powdering 0.130 0.123 0.038 0.080 0.038
Ethanol rinsed before powdering, diluted 0.135 0.139 0.045 0.089 0.040
Pleistocene-Holocene surface-eroded
Carcharias teeth
Unrinsed 0.209 0.039 0.092 0.027 0.011
Ethanol rinsed before powdering 0.512 0.153 0.301 0.155 0.114
Ethanol rinsed before powdering 0.527 0.154 0.295 0.166 0.112
Modern Gallus bone
Unrinsed 0.053 0.027 0 0.015 0
Ethanol rinsed before powdering 0.055 0.029 0 0.016 0
Table 1. Comparison of Late Cretaceous, Pleistocene-Holocene, and modern amino acid
racemisation values. NA indicates that amino acid concentration was below detection limit.
21bioRxiv preprint first posted online Sep. 7, 2018; doi: http://dx.doi.org/10.1101/400176. The copyright holder for this preprint
(which was not peer-reviewed) is the author/funder. All rights reserved. No reuse allowed without permission.
Topsoil showed greater THAA concentration than subterranean and surface-eroded
Centrosaurus bones, but not as high as modern chicken bones (Fig. 7A). Mudstone tended to
have very low THAA concentration, even compared to some of the Late Cretaceous bone
samples (Fig. 7B); however, one unrinsed replicate of mudstone ~39 m above BB180 was an
outlier, potentially representing contamination or collection of pure mudstone alongside some
larger organic detritus. The highest THAA concentrations in mudstone tended to be observed
in the adjacent mudstone matrix to the subterranean Centrosaurus bone. When amino acids
were above detection limit, mudstone was L-amino acid dominated like the Late Cretaceous
bone (Table 1). Topsoil, on the other hand, showed moderate levels of racemisation.
Pleistocene-Holocene surface-eroded shark teeth had THAA compositional profiles
that strongly matched collagen (Fig. 6A, C, F) and fairly high amino acid concentration with
THAA concentrations between those of subterranean Centrosaurus bone and modern chicken
bone (Fig. 7A). Pleistocene-Holocene surface-eroded shark teeth, unlike the Late Cretaceous
bone and mudstone, had very high racemisation (Table 1), even more so than the topsoil
sample. Ethanol rinsing appeared to lower amino acid concentration in the shark teeth but did
not affect THAA compositional profile (Figs. 6A, C, F, 7A).
Radiocarbon AMS
Total organic carbon (TOC) content was higher in the subterranean and surface-eroded
Centrosaurus bone than the matrix, even the directly adjacent matrix, and was comparable to
that found in the topsoil (Table 2). However, the organic carbon content in the Centrosaurus
bones was significantly lower than the 82–71 Ka Yarnton bovine bone sample known to
contain well-preserved (radiocarbon-dead) collagen (Cook et al. 2012). TOC in the
Centrosaurus bone was not found to be radiocarbon dead, but did exhibit lower F14C values
than both the mudstone and especially the topsoil. Assuming all endogenous bone C is
radiocarbon ‘dead’, based on these F14C values, a simple 2-end-member mixing model would
suggest that ~26 % of the C in subterranean Centrosaurus bone originates in the adjacent
mudstone matrix (supplemental material).
22bioRxiv preprint first posted online Sep. 7, 2018; doi: http://dx.doi.org/10.1101/400176. The copyright holder for this preprint
(which was not peer-reviewed) is the author/funder. All rights reserved. No reuse allowed without permission.
% mass after
C % (organic F14C (organic
Sample HCl
fraction) fraction)
demineralisation
Fully-aseptically-collected subterranean
Centrosaurus bone core (surface scraped 53.98 2.777 0.0149
prior to powdering)
Adjacent mudstone matrix of subterranean
82.27 1.32 0.0573
Centrosaurus bone
Topsoil on same ridge and ~63 m above
91.63 2 0.766
BB180
Mudstone on same ridge and ~23 m above
90.38 0.89 0.0628
BB180
Surface-eroded Late Cretaceous bone core
on same ridge and ~21 m above BB180 43.4 1.63 0.0422
(surface scraped prior to powdering)
Yarnton bovine right femur (82–71 Ka,
16.73 44.9 0.0056*
Cook et al. 2012)
Table 2. Carbon data from Late Cretaceous fossil bone, mudstone, topsoil, and younger
bone. *This sample was used for blank correction in the AMS analyses, therefore this value is
not blank-subtracted.
Fluorescence microscopy, DNA extraction and 16S rRNA amplicon sequencing
DNA concentration was about 50 times higher in subterranean Centrosaurus bone than in
adjacent mudstone matrix (Table 3; supplemental material). PI staining for DNA on EDTA
demineralised Centrosaurus bone revealed multi-cell aggregates forming organic vessel and
conglomerate structures that fluoresce red (Fig. 8A–D).
16S rRNA amplicon sequencing revealed the predominance of Actinobacteria and
Proteobacteria in subterranean Centrosaurus bone (Fig. 9). Sequences affiliated with classes
Nitriliruptoria and Deltaproteobacteria were more abundant relative to adjacent mudstone or
even the surface scrapings from the bone itself. The majority of the sequences within
Deltaproteobacteria were identified as belonging to the family Desulfurellaceae, which
contains some sulfur-respiring species (sulfur-, rather than sulfate-reducing). However, the
short reads prevented species level identification. In Centrosaurus bones, about 30 % of
sequences were phylogenetically close to the genus Euzebya.
23bioRxiv preprint first posted online Sep. 7, 2018; doi: http://dx.doi.org/10.1101/400176. The copyright holder for this preprint
(which was not peer-reviewed) is the author/funder. All rights reserved. No reuse allowed without permission.
DNA per 1 g
Average DNA Total
of bone or
Sample concentration DNA
mudstone
(ng/µL) (ng)
(ng/g)
Fully-aseptically-collected subterranean
Centrosaurus bone core (surface scraped prior 0.793 3965 793
to powdering)
Adjacent mudstone matrix of subterranean
0.0328 164 16.4
Centrosaurus bone
Below detection
Laboratory blank
(bioRxiv preprint first posted online Sep. 7, 2018; doi: http://dx.doi.org/10.1101/400176. The copyright holder for this preprint
(which was not peer-reviewed) is the author/funder. All rights reserved. No reuse allowed without permission.
Figure 9. Comparison of microbial community (phylum level) from fully-aseptically-collected
subterranean Centrosaurus bone and adjacent mudstone matrix. There are two replicates per
sample.
Discussion:
Light microscopy, VPSEM, and EDS
Demineralisation products of dinosaur fossil bone differ structurally and elementally from the
Pleistocene-Holocene and modern samples when examined using light microscopy and
VPSEM. Occasional infilling of the dinosaur bone vessels with greater C concentration in the
interior compared to the exterior of the vessel is consistent with a growing biofilm. The Si
dominance of the demineralisation products from the dinosaur bone likely suggest that they
are at least partly silicified. HCl demineralisation (especially the relatively intensive
demineralisation used on the samples that underwent microscopy, EDS, and ATR FTIR) may
favour mineralised biofilm retrieval assuming that low pH might degrade organically-
25bioRxiv preprint first posted online Sep. 7, 2018; doi: http://dx.doi.org/10.1101/400176. The copyright holder for this preprint
(which was not peer-reviewed) is the author/funder. All rights reserved. No reuse allowed without permission.
preserved biofilms, explaining why all of the observed demineralisation products of the
dinosaur bone have high Si content. If this is the case then it would indicate that the original
organics are significantly more susceptible to acid (i.e., of different composition) than the
organic masses in the identically treated younger bone samples, which survive well. It seems
likely that mineral infilling in the Centrosaurus bone is largely of silicates, which have partly
replaced the originally organic vessel-like structures, as well as, potentially, some barite or
gypsum with minimal iron oxide or pyrite. Some of these inorganic compounds might
contribute to the colour of the fossils. The fibrous material may be silicified biofilm with a
collagenous texture imprint from the surrounding apatite matrix or may simply be a small
misinterpreted quartz crystal. A silicified biofilm might be a result of unique environmental
conditions (either early or late in the taphonomic history) or microbial communities that these
fossils experienced. Therefore, examining fossils from different localities, climates,
lithologies, and taphonomic histories is vital to understanding variation in how biofilms in
fossil bone might be mineralised.
The Pleistocene-Holocene shark tooth and modern chicken bone demineralise to
reveal large organic masses (i.e., rich in C and O) consistent with collagen protein as
evidenced by discernable N and S peaks, unlike the much older dinosaur bone
demineralisation products. However, the high Fe content in the shark tooth suggests some
taphonomic mineral accumulation (e.g., iron oxide or pyrite) and may explain some of the
dark discolouration in the teeth, potentially alongside a browning effect caused by the
taphonomic formation of melanoidins, advanced glycation end products, and similar
condensation products (Wiemann et al. 2016). The relatively more pronounced S peak in the
shark tooth as compared to the chicken bone might indicate sulphurisation of the collagen
protein or some other taphonomic incorporation of inorganic S from the environment into the
tooth, the latter being consistent with pyrite. After all, the teeth are the only fossils in this
study to derive from a marine depositional environment, so the potential for pyrite formation
under euxinic conditions, for example, would not be surprising. Low pressure conditions of
VPSEM and EDS, as well as charging during these analyses, may have affected subsequent
light microscopy observation, but this is mitigated by the fact that light microscopy was done
under a comparative framework between the samples.
ATR FTIR
The ATR FTIR results here showing various organic bonds could be taken by some to be
consistent with supposed dinosaur collagen. Similar, albeit higher-resolution, peaks to those
26bioRxiv preprint first posted online Sep. 7, 2018; doi: http://dx.doi.org/10.1101/400176. The copyright holder for this preprint
(which was not peer-reviewed) is the author/funder. All rights reserved. No reuse allowed without permission.
detected here are used as evidence for purported dinosaur collagen (Lee et al. 2017), but, it
should be noted that such results are not conclusive of collagen. Detection of peaks such as
those associated with amide bonds may not necessarily derive from proteins, as amide bonds
are not specific to proteins and can be found in protein degradation products such as
diketopiperazines (Saitta et al. 2017). CH and CO bonds are even more widely distributed
through organic molecules. Some researchers have indeed attempted to observe how ATR
FTIR spectra of bone collagen is modified when carbonaceous contamination (e.g., applied
organics like consolidants, humic acids, or soil carbonate) is present (D’Elia et al. 2007), but
it can be tempting for taphonomists to observe organics peaks in such spectra and attribute
them to endogenous protein. Even if such bonds are from proteins, without deconvolving
peaks to produce fingerprints of protein secondary structure (Byler & Susi 1986), one cannot
say from the presence of such organic bonds alone that the protein is collagen, let alone
endogenous or ancient. Despite the strong demineralisation treatment, it appears that some
phosphate remained in the samples, as evidenced by the presence of peaks consistent with
phosphate in the spectra. It has been shown experimentally and theoretically that variation in
the phosphate bands derived from ATR FTIR of bone can be affected by bone collagen
content, with low-frequency symmetry of the phosphate peaks more apparent in bone
containing lower amounts of collagen (Aufort et al. 2018). The observation of sharper, more
symmetric phosphate peaks in the Centrosaurus bone compared to the younger bone might
suggest lower relative collagen content. However, it should be noted that the described
pattern in phosphate peak alteration was observed using a diamond ATR, and this method can
result in differences in spectra from those made using Ge ATR as was done here due to
different refractive indices of the crystals (Aufort et al. 2016), so such a comparison may be
inappropriate. Additionally, it would be advisable to obtain ATR FTIR data from non-
demineralised samples before trying to interpret the results here. Regardless, discussion of
symmetry in the phosphate peaks should be had on any future papers that attempt to use ATR
FTIR data as evidence for purported Mesozoic collagen. Future work on the specimens
analysed here should also attempt ATR FTIR mapping on polished sections to examine how
peaks are spatially distributed, perhaps in combination with time-of-flight secondary ion
mass spectrometry (TOF-SIMS).
Py-GC-MS
The dinosaur fossil bones show greater chemical resemblance to mudstone than to fresh,
modern bone and appear somewhat low in organics relative to fresh, modern bone. Although
27You can also read