Genomic Insights Into the Pathogenicity of a Novel Biofilm-Forming Enterococcus sp. Bacteria (Enterococcus lacertideformus) Identified in Reptiles ...
←
→
Page content transcription
If your browser does not render page correctly, please read the page content below
ORIGINAL RESEARCH
                                                                                                                                             published: 02 March 2021
                                                                                                                                      doi: 10.3389/fmicb.2021.635208

                                             Genomic Insights Into the
                                             Pathogenicity of a Novel
                                             Biofilm-Forming Enterococcus sp.
                                             Bacteria (Enterococcus
                                             lacertideformus) Identified in
                         Edited by:
                        Daniel Yero,
                                             Reptiles
 Autonomous University of Barcelona,
                              Spain
                                             Jessica Esther Agius 1* † , David Norton Phalen 1,2† , Karrie Rose 3† and
                                             John-Sebastian Eden 4,5†
                       Reviewed by:
              Jean-Christophe Giard,         1
                                               Faculty of Science, Sydney School of Veterinary Science, University of Sydney, Camden, NSW, Australia, 2 Schubot Exotic
     Université de Caen Normandie,           Bird Health Center, College of Veterinary Medicine & Biomedical Sciences, Texas A&M University, College Station, TX,
                               France        United States, 3 Australian Registry of Wildlife Health, Taronga Conservation Society Australia, Mosman, NSW, Australia,
           Victor Sebastian Blancato,        4
                                               Centre for Virus Research, The Westmead Institute for Medical Research, Westmead, NSW, Australia, 5 Marie Bashir
      CONICET Instituto de Biología          Institute for Infectious Diseases and Biosecurity, Faculty of Medicine and Health, Sydney School of Medicine, University
 Molecular y Celular de Rosario (IBR),       of Sydney, Camperdown, NSW, Australia
                            Argentina
                  *Correspondence:
                                             Whole genome analysis of a novel species of enterococci, Enterococcus
                  Jessica Esther Agius
         jessica.agius@sydney.edu.au         lacertideformus, causing multi-systemic and invariably fatal disease in critically
                            † ORCID:         endangered Christmas Island reptiles was undertaken to determine the genetic
                 Jessica Esther Agius        elements and potential mechanisms conferring its pathogenic nature, biofilm-forming
     orcid.org/0000-0001-8735-1222
                 David Norton Phalen         capabilities, immune recognition avoidance, and inability to grow in vitro. Comparative
     orcid.org/0000-0003-2387-4061           genomic analyses with related and clinically significant enterococci were further
                          Karrie Rose
     orcid.org/0000-0001-9828-538X
                                             undertaken to infer the evolutionary history of the bacterium and identify genes both
                John-Sebastian Eden          novel and absent. The genome had a G + C content of 35.1%, consisted of a
     orcid.org/0000-0003-1374-3551           circular chromosome, no plasmids, and was 2,419,934 bp in length (2,321 genes,
                   Specialty section:
                                             47 tRNAs, and 13 rRNAs). Multi-locus sequence typing (MLST), and single nucleotide
         This article was submitted to       polymorphism (SNP) analysis of multiple E. lacertideformus samples revealed they were
           Evolutionary and Genomic
                                             effectively indistinguishable from one another and highly clonal. E. lacertideformus was
                         Microbiology,
               a section of the journal      found to be located within the Enterococcus faecium species clade and was closely
             Frontiers in Microbiology       related to Enterococcus villorum F1129D based on 16S rDNA and MLST house-keeping
       Received: 30 November 2020            gene analysis. Antimicrobial resistance (DfreE, EfrB, tetM, bcrRABD, and sat4) and
        Accepted: 09 February 2021
         Published: 02 March 2021
                                             virulence genes (Fss3 and ClpP), and genes conferring tolerance to metals and biocides
                              Citation:
                                             (n = 9) were identified. The detection of relatively few genes encoding antimicrobial
    Agius JE, Phalen DN, Rose K and          resistance and virulence indicates that this bacterium may have had no exposure
   Eden J-S (2021) Genomic Insights
                                             to recently developed and clinically significant antibiotics. Genes potentially imparting
     Into the Pathogenicity of a Novel
   Biofilm-Forming Enterococcus sp.          beneficial functional properties were identified, including prophages, insertion elements,
               Bacteria (Enterococcus        integrative conjugative elements, and genomic islands. Functional CRISPR-Cas arrays,
lacertideformus) Identified in Reptiles.
         Front. Microbiol. 12:635208.
                                             and a defective prophage region were identified in the genome. The study also revealed
    doi: 10.3389/fmicb.2021.635208           many genomic loci unique to E. lacertideformus which contained genes enriched in

Frontiers in Microbiology | www.frontiersin.org                                    1                                          March 2021 | Volume 12 | Article 635208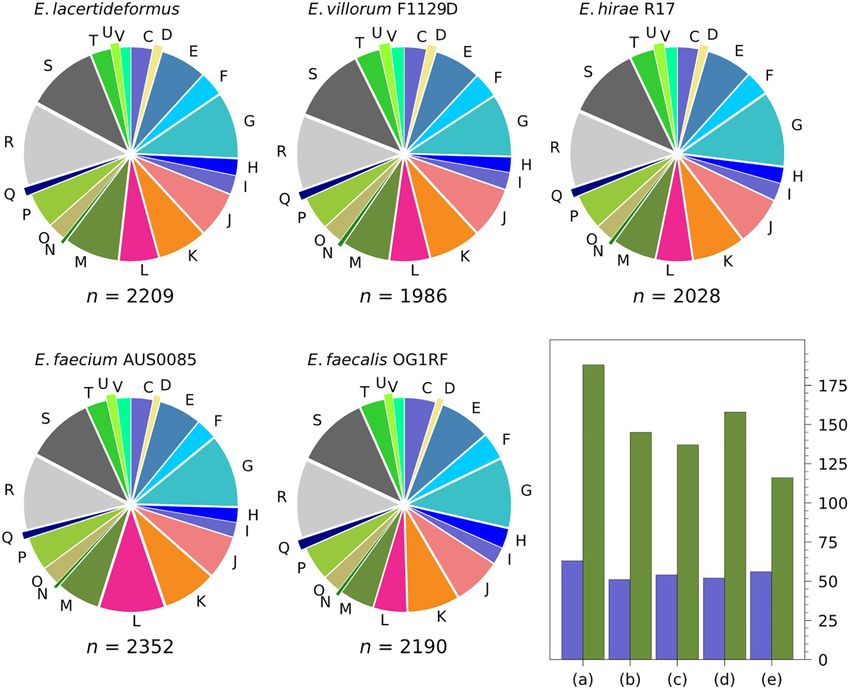
Agius et al.                                                                                                         Enterococcus and Christmas Island Reptiles

                                             cell wall/membrane/envelop biogenesis, and carbohydrate metabolism and transport
                                             functionality. This finding and the detection of putative enterococcal biofilm determinants
                                             (EfaAfs, srtC, and scm) may underpin the novel biofilm phenotype observed for this
                                             bacterium. Comparative analysis of E. lacertideformus with phylogenetically related and
                                             clinically significant enterococci (E. villorum F1129D, Enterococcus hirae R17, E. faecium
                                             AUS0085, and Enterococcus faecalis OG1RF) revealed an absence of genes (n = 54) in
                                             E. lacertideformus, that encode metabolic functionality, which potentially hinders nutrient
                                             acquisition and/or utilization by the bacterium and precludes growth in vitro. These
                                             data provide genetic insights into the previously determined phenotype and pathogenic
                                             nature of the bacterium.
                                             Keywords: antimicrobial resistance, bacteria, biofilm, Christmas Island, enterococcus, reptiles, virulence, whole
                                             genome sequencing

INTRODUCTION                                                                        thick biofilm-like matrix comprising pilus extensions radiating
                                                                                    from the cell wall. The large colonies of bacteria replace bone and
Emerging infectious diseases are increasingly impacting reptile
                                                                                    soft tissues in the head, and compress and replace the normal
populations globally and pose a significant threat to their
                                                                                    parenchyma of the other tissues that they invade. The biofilm
conservation and biodiversity (Cabañes et al., 2014; Jacobson
                                                                                    surrounding E. lacertideformus appears to mask it from the host’s
et al., 2014; O’Dea et al., 2016; Tetzlaff et al., 2017). An example
                                                                                    immune system as histologically limited inflammatory responses
of a pathogen that is posing a major threat to multiple reptilian
                                                                                    are observed surrounding the bacteria (Rose et al., 2017).
species is a novel bacterial species; Enterococcus lacertideformus.
                                                                                        As efforts to culture E. lacertideformus in vitro have been
This novel pathogen is the only known species of Enterococcus
                                                                                    unsuccessful, no information on antimicrobial susceptibilities,
that acts as a primary pathogen and is not associated with
                                                                                    virulence traits and metabolic traits exist. This lack of
hospital-acquired infections. This organism poses a major threat
                                                                                    understanding regarding the bacterium’s inability to grow
to the captive breeding colonies of the Extinct in the Wild
                                                                                    in vitro, in addition to its novelty, unique structure and apparent
Christmas Island Lister’s geckos (Lepidodactylus listeri) and blue-
                                                                                    evasion of host immune responses highlights the need to study
tailed skinks (Cryptoblepharus egeriae), where it has breached
                                                                                    its biology through in silico investigations into the organism’s
quarantine measures causing mortality events in conservation
                                                                                    genome and evolutionary origins. This foundational genomic
breeding colonies on Christmas Island (Rose et al., 2017). The
                                                                                    work will contribute to fulfilling the overarching goals of
origin is unknown, but this bacterium appears to have established
                                                                                    diagnostic tool development, prognostication, treatment, and
itself either in the environment or in host species on Christmas
                                                                                    biosecurity risk analyses and practice.
Island where it is regularly observed to cause disease in the
invasive free-ranging Asian house (Hemidactylus frenatus) and
mute (Gehyra mutilata) geckos. Although at the time of the
initial outbreak E. lacertideformus was thought to be a locally                     MATERIALS AND METHODS
occurring disease, research suggests that the incident may not
be isolated. Outbreaks likely caused by E. lacertideformus or                       Sample Collection and Preparation
a similar organism with identical morphology, lesion type and                       Tissue samples were collected from three wild Asian house
distribution have been described in Singapore house geckos                          geckos on Christmas Island showing signs consistent with
from Malaysia (McNamara et al., 1994), four species of captive                      infection with E. lacertideformus (Rose et al., 2017). Two
lizards (Carolina anole, Cape girdled lizards, Balkan green lizards,                geckos (samples: 10706.1 and 10706.10) were collected from
and European green lizards) held in a Polish collection (Zwart                      southeast of Christmas Island in September 2017 (South
and Cornelisse, 1972), and in free-ranging brown anoles (Anolis                     Point, GPS coordinates: 10◦ 330 42.0500 S 105◦ 380 55.0700 E),
sagrei) from Florida, United States of America (Ossiboff et al.,                    and one gecko (sample: 10702.133) was collected from the
2020). Molecular analyses further undertaken on the brown                           centerof Christmas Island (Pink House Research Station, GPS
anoles revealed that a 1,400 bp segment of the 16s rRNA gene                        coordinates: 10◦ 290 30.5000 S 105◦ 380 49.6000 E) in May 2018. The
was 100% identical to E. lacertideformus (Ossiboff et al., 2020).                   affected geckos were euthanised with an overdose of alfaxalone
    Infection with E. lacertideformus is believed to result from                    (Alfaxane, Jurox Animal Health). The diseased tissues from the
bite wounds to the face or by colonization of the oral cavity                       mucosa and submucosa of the maxilla were aseptically collected
followed by tissue invasion. Lizards present initially with gingival                and stored in 90% ethanol until DNA extraction.
swelling and the formation of gelatinous subcutaneous nodules
of the face and head. With time, the disease becomes systemic                       DNA Isolation
and expansile nodular lesions are seen in multiple tissues.                         Genomic DNA was isolated from the alcohol-fixed tissues using
Microscopically, chains of bacterial cocci are surrounded by a                      a modified animal tissue protocol and the DNeasy Blood and

Frontiers in Microbiology | www.frontiersin.org                                 2                                       March 2021 | Volume 12 | Article 635208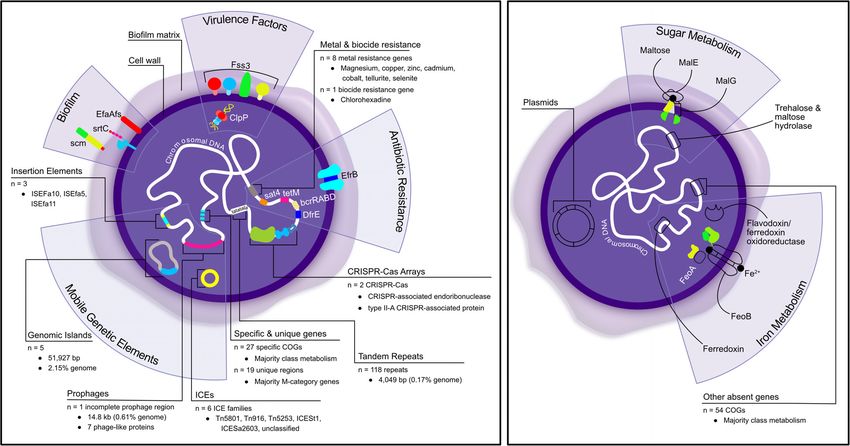
Agius et al.                                                                                                Enterococcus and Christmas Island Reptiles

Tissue Kit (Qiagen, Victoria, Australia). Briefly, tissues were        furthermore, both assemblies were structurally similar. However,
rehydrated with four 1× phosphate buffered saline washes to            following initial annotations, MEGAHIT in comparison to
remove residual fixative, mechanically ground and pre-treated          the SPAdes assembly comprised a greater number of CDS
with a lysozyme digestion step (25 mM Tris-HCl pH 8, 2.5 mM            and was able to resolve expected rRNA genes, therefore was
EDTA, 1.2% triton X-100, 20 mg µL−1 lysozyme) recommended              used to represent the whole genome shotgun assembly of
for lysis of Gram-positive bacteria. Samples were then digested        E. lacertideformus.
with proteinase K for 6 h and the DNA purified following the
manufacturer’s instructions.                                           Genome Annotation
                                                                       Gene identification and annotation was performed by the
Whole Genome Sequencing                                                DFAST prokaryotic genome annotation pipeline v1.2.41 with
Purified genomic DNA was prepared as shotgun libraries using           default settings (Tanizawa et al., 2018). ABRicate v0.8 (Seemann,
the Truseq DNA PCR-free library and sequenced on the Illumina          2020) PointFinder (Zankari et al., 2017) was used to screen
NovaSeq 6000 platform generating at least 150 Gb of 150 bp             the 10702.133 MEGAHIT contigs for putative resistance genes
paired-end reads per library at the Australian Genome Research         and virulence factors using multiple databases – Antibiotic
Facility (AGRF).                                                       Resistance Gene-ANNOTation (ARG-ANNOT) (Gupta et al.,
                                                                       2014), ResFinder (Zankari et al., 2012), Resistance Gene Identifier
Sequence Assembly and Analysis                                         (RGI) (Alcock et al., 2020), Comprehensive Antibiotic Resistance
The raw sequence reads were assessed for quality using FastQC          Database (CARD) (Jia et al., 2017), PlasmidFinder (Carattoli
(Andrews, 2010). The raw sequence reads were quality trimmed           et al., 2014), NCBI AMRFinderPlus (Feldgarden et al., 2019),
using Trimmomatic (Bolger et al., 2014), sequences with a              and Virulence Factor Database (VFDB) (Chen et al., 2016).
Phred score less than 25 were removed. To obtain an initial            Positive identification of resistance genes and virulence factors
estimate of sequencing coverage of E. lacertideformus present          were indicated by a E-value threshold of 1e-100, and a minimum
in each library, the trimmed reads were mapped against the             coverage and nucleotide identity of 75 and 85%, respectively.
Enterococcus hirae strain R17 genome (NCBI GenBank accession           The Antibacterial Biocide and Metal Resistance Genes Database
CP015516) (Peng et al., 2017) using the Burrow-Wheeler Aligner         (BacMet) v2.0 for experimentally confirmed (n = 753) and
(BWA-MEM v0.7.12) with default settings (Li and Durbin,                predicted (n = 155,512) resistance genes were downloaded
2009). This revealed that sample 10702.133 contained the highest       from the BacMet website2 to predict antibacterial biocide and
coverage depth (mean 1006.52×) in comparison to samples                metal resistance encoding genes (Pal et al., 2014) and used
10706.1 and 10706.10, with mean coverages of 245.72× and               for annotation with DIAMOND v3.2.10 using the BLASTx
8.73×, respectively. Given the greater sequencing coverage,            algorithm and an E-value threshold 1e-100. The presence of
10702.133 was therefore chosen as the sample to represent              CRISPR loci were predicted using the CRISPERFinder (Grissa
the genome of E. lacertideformus in our study. To perform              et al., 2007) tool3 and CRISPI4 with default settings (Rousseau
genome assembly, trimmed reads were first mapped to the                et al., 2009). The abundance and diversity of insertional elements
reference assembly Gekko japonicus v1.1 (NCBI genome assembly          and transposons were identified using ISfinder5 (Siguier et al.,
GCF_001447785.1) using BWA-MEM v0.7.12 to remove host                  2006) and BLASTn v2.2.31+, with an E-value threshold of 1e-50.
sequences. The unmapped, i.e., ‘non-Gecko’ reads from sample           Discovery and annotation of prophage loci within the genome
10702.133 were then de novo assembled using both SPAdes                was undertaken using PHASTER6 (Arndt et al., 2016) and
v3.13.0 (Bankevich et al., 2012) and MEGAHIT v1.1.3 (Li                BLASTn v2.2.31+. The genome was additionally investigated for
et al., 2015), the remaining samples 10706.1 and 10706.10 were         integrative conjugative elements (ICEs) by homology searches
assembled using only MEGAHIT v1.1.3. Default parameters                using web nucleotide BLAST against 714 ICEs downloaded
were used for each genome assembler method, except for                 from the ICEberg database v2.0 (Liu et al., 2019). Only
setting the distribution of kmers to be 21, 29, 39, 59, 79, 99,        complete ICE sequences were included with E-value and bit-
119, and 127. Both SPAdes and MEGAHIT were evaluated to                score thresholds of 1e-150 and 400, respectively. The genome
determine the method that produced the assembly with the               was additionally mined for secondary metabolite biosynthetic
highest quality. The non-gecko contigs were then aligned against       gene clusters using antiSMASH bacterial v5.07 with default
the NCBI non-redundant nucleotide and protein databases with           settings (Blin et al., 2019), and ribosomally synthesized and
an E-value threshold of 1e-10 using BLAST (Altschul et al.,            post-translationally modified peptides and bacteriocins using
1990) and DIAMOND (Buchfink et al., 2015), respectively.               BAGEL48 (van Heel et al., 2018). Horizontal gene transfer
The contigs were then filtered by taxonomic group (‘Bacteria’
or ‘Enterococcus’), sequence coverage depth as determined by           1
                                                                         https://dfast.nig.ac.jp/
expected coverage from initial mapping to E. hirae R17 genome,         2
                                                                         http://bacmet.biomedicine.gu.se/
and contig length sequence (>250 bp). The de novo assemblies           3
                                                                         https://crisprcas.i2bc.paris-saclay.fr/
using SPAdes and MEGAHIT were then examined by QUAST                   4
                                                                         http://crispi.genouest.org
v5.0.2 (Gurevich et al., 2013), using default parameters with          5
                                                                         https://isfinder.biotoul.fr/
E. hirae R17 as a reference genome. Based on the QUAST                 6
                                                                         https://phaster.ca/
results, there were negligible differences in the quality of           7
                                                                         https://antismash.secondarymetabolites.org
the MEGAHIT and SPAdes assemblies for sample 10702.133,                8
                                                                         http://bagel4.molgenrug.nl/

Frontiers in Microbiology | www.frontiersin.org                    3                                           March 2021 | Volume 12 | Article 635208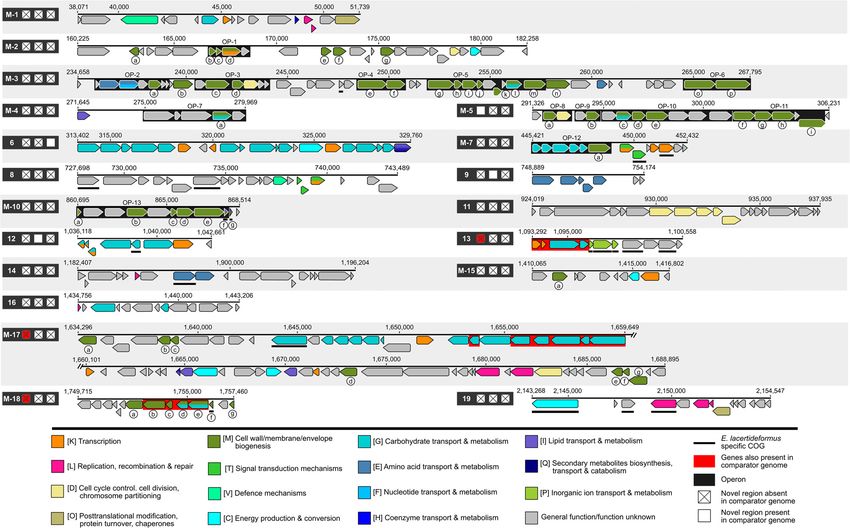
Agius et al.                                                                                           Enterococcus and Christmas Island Reptiles

was detected by the genomic island tool Islandviewer 4,                  nucleotide polymorphisms (SNPs) with a minimum coverage
using the prediction method IslandPath-DIMOB (sequence                   of 10×. A nucleotide was identified as a putative SNP if it
composition method)9 (Bertelli et al., 2017). The whole genome           occurred in more than 50% of the read coverage. Each SNP
shotgun assembly of E. lacertideformus was ordered against               was manually inspected to confirm the alignment and coverage.
the reference genome E. hirae R17 using the Mauve Contig                 Pairwise identity percentages and the number of SNPs between
Mover (MCM) (Rissman et al., 2009). Enterococcus hirae R17               each sample and the reference were calculated to determine the
(accession: NZCP015516) was chosen as the reference genome               clonality between samples and if mixed organisms were present.
as multiple alignments with other comparator enterococci                 To verify clonality, seven house-keeping multi-locus sequence
(E. villorum F1129D, accession: BJWF01000000, E. faecium                 typing (MLST) genes (atpA, adk, ddl, gdh, gyd, pstS, and
AUS0085, accession: CP006620, and E. faecalis OG1RF, accession:          purK) from 10702.133, 10706.1 and 10706.100 were identified,
NC017316) using the MCM algorithm revealed that the E. hirae             extracted, concatenated, and aligned using MAFFT aligner
R17 alignment had the lowest number of locally collinear blocks,         v7.450, and the number of SNPs counted.
rearrangements, and inversions. However, as a complete genome                A comparative analysis of the E. lacertideformus whole
of E. lacertideformus is not available, genomic rearrangements           genome shotgun assembly to four other complete genomes
of this bacterium cannot be excluded. Proteins classified as             (E. villorum F1129D, E. hirae R17, E. faecium AUS0085,
hypothetical by the program were confirmed by BLASTp and                 and E. faecalis OG1RF) was made using the CGView
renamed if they had E-value and percent identity thresholds              Comparison Tool (CCT) (Stothard et al., 2019). The contigs
of 1e-50 and 80, respectively. The query data and functions              of E. lacertideformus were ordered against the E. hirae R17
of all non-ribosomal hypothetical proteins identified using              genome with MCM. This tool was additionally used to assign
BLASTp were also listed. Repeat sequences were identified using          genes of E. lacertideformus to Clusters of Orthologous Groups
Tandem Repeats Finder Program v4.0910 with default parameters            (COGs), and generate circular genomic maps containing
(Benson, 1999).                                                          genome features (G + C content, G + C skew, CDS, rRNA, and
                                                                         tRNA). A complete count of the genes for each COG functional
Biofilm and Pili Virulence Factors                                       feature common among all five genomes were determined,
Nucleotide sequences of well-defined genes involved in biofilm           and their proportions comparatively illustrated in a circle
development and pili expression among enterococci were                   chart. Functional features where E. lacertideformus contained
identified and extracted from known enterococcal biofilm-                the largest number of genes when compared to comparator
forming and clinically significant genomes E. faecalis OG1RF,            genomes were extracted and illustrated in a bar chart. The
E. faecalis LN68, E. faecalis KUB3006 and E. faecium DO.                 number of COGs present across all five genomes (Core COGs)
The nucleotide sequences of enterococcal surface protein (esp),          and the number of COGs occurring only in E. lacertideformus
endocarditis and biofilm-associated pili genetic locus (EbpA,            (Specific COGs) were defined. To determine ‘Core COGs,’COG
EbpB, and EbpC), E. faecalis endocarditis-associated antigen A           source IDs shared between E. lacertideformus and all four-
(EfaA), aggregation substance (Agg), adhesion of collagen of             comparator genomes E. hirae, E. villorum, E. faecium, and
E. faecalis (ace), adhesion to collagen from E. faecium (acm),           E. faecalis for each feature were counted. When COG source
second collagen adhesin of E. faecium (scm), nidogen-binding             IDs were present only in E. lacertideformus and absent in all
LPXTG surface adhesion (sgrA), sortase-encoding gene (srt),              comparator genomes these were considered ‘Specific COGs’
hyaluronidases (hylA and hylB), gelatinase (gelE), serine protease       and were summed for each feature. The number of individual
(sprE), and fecal streptococci regulator locus (fsrA, fsrB, and          genes for each feature for both the core and specific COGs were
fsrC) were manually queried using BLASTn on Geneious Prime               summed and tabulated as in some instances multiple genes were
v2020.0.511 to determine if E. lacertideformus contained any             associated with a single COG ID. Additionally, COG source
homologous regions (E-value threshold 1e-10).                            IDs present among all comparator genomes, but absent in
                                                                         E. lacertideformus were defined.
Comparative Analysis                                                         The E. lacertideformus genome was aligned to reference
The trimmed non-Gecko reads from samples 10702.133                       genomes E. villorum F1129D, E. hirae R17, and E. faecium
(accession: SRX9763078), 10706.10 (accession: SRX9763079),               AUS0085 using the progressiveMauve algorithm (Darling et al.,
and 10706.1 (accession: SRX9763080) were aligned to                      2010). Enterococcus faecalis OG1RF was not used as a comparator
our reference E. lacertideformus whole genome shotgun                    due to its genomic dissimilarity to E. lacertideformus, and
assembly (MEGAHIT assembly of sample 10702.133)                          inability to adequately resolve novel regions. Alignments were
(accession: JADAKE000000000) using BBMap v37.98 (Bushnell,               visualized in the Mauve Genome Viewer using Geneious Prime
2014) and the resultant BAM alignments were visualized in                v2020.0.5 to identify regions unique to E. lacertideformus. True
Geneious Prime v2020.0.5. Sample 10702.133 contained the                 deletions on comparison were unable to be resolved as they
highest coverage depth (mean 2478.26×) in comparison to                  may represent missing assembly data. Regions were illustrated
samples 10706.1 and 10706.10, with mean coverages of 523.34×             as insertions when they were absent in at least two of the three
and 13.47×, respectively. The samples were screened for single           comparator genomes and had a length of greater than 5,000
                                                                         nucleotides. Insertions which fulfilled these criteria were not
9
 http://www.pathogenomics.sfu.ca/islandviewer/                           included if all the genes of that region were categorized as having
10
   http://tandem.bu.edu/trf/trf.html                                     a hypothetical or unknown function. Genes possibly explaining
11
   https://www.geneious.com                                              the biofilm phenotype of E. lacertideformus, categorized into

Frontiers in Microbiology | www.frontiersin.org                      4                                    March 2021 | Volume 12 | Article 635208
Agius et al.                                                                                            Enterococcus and Christmas Island Reptiles

the [M] functional category (cell wall/membrane/envelope                  abundance of E. lacertideformus in each tissue sample varied, with
biogenesis), were further labeled and their function and query            sample 10702.133 containing the highest coverage depth (mean
statistics tabulated. Operons for the [M] category genes identified       1006.52×) in comparison to samples 10706.1 and 10706.10,
in the unique regions of E. lacertideformus were predicted using          with means coverages of 245.72× and 8.73×, respectively.
POEM py3k (Xiao, 2019).                                                   Given the higher abundance of E. lacertideformus in the
                                                                          sequenced libraries, host depleted sequence reads from sample
Phylogenetic Analysis                                                     10702.133 was used to generate our reference genome by de
The complete 16S rDNA gene from E. lacertideformus was                    novo assembly. A comparison of assembly methods using both
aligned against 32 reference sequences of known Enterococcus              SPAdes and MEGAHIT revealed negligible differences in the
and outgroup bacteria downloaded from NCBI GenBank. The                   overall assembly quality according to N50 and L50 metrics.
reference sequences selected represented a suitable diversity of          However, more genes and expected rRNA were identified using
enterococcal species, particularly focusing on the E. faecium clade       the MEGAHIT assembly contig set, therefore was used as our
as preliminary phylogenetic analyses revealed E. lacertideformus          final draft genome and more subsequent genome annotations
mapped to this species group (Rose et al., 2017). All sequences           and comparisons. The initial MEGAHIT assembly of sample
were aligned using MAFFT aligner v7.450 with the FFT-NS-                  10702.133 produced a total of 3,367,650 non-Gecko contigs
i × 1,000 algorithm (Katoh and Standley, 2013) in Geneious                of which 829,116 returned any BLAST result less than 1e-
Prime v2020.0.5. The General-Time Reversible model (GTR)                  5. The majority of contigs (n = 827,464/829,116) were host
with Gamma distributed rate classes (n = 4) including Invariant           derived (Eukaryota) and likely due to differences in our study
sites (GTR + G + I) was found to be the best-fit substitution             species (H. frenatus) and the reference genome used for host
model according to Bayesian Information Criterion (BIC)                   DNA removal (G. japonicus). Importantly, of the non-Eukaryota
in MEGA-X v10.1.1 (Kumar et al., 2018). The 16S rDNA                      contigs, 139 were annotated as ‘Bacteria,’ and 46 specifically as
phylogenetic tree was inferred using the maximum likelihood               ‘Enterococcus.’ Furthermore, 39 ‘Enterococcus’ contigs remained
approach in PhyML v20150402 with the GTR + G + I model                    following removal of sequences less than 250 bp in length
and 1,000 bootstrap replicates (Guindon et al., 2005). The                (Supplementary Table 1). The 39 contigs made up the final
phylogeny represented the best topology with nearest-neighbor             contig set of the draft E. lacertideformus genome (accession:
interchange (NNI) and sub-tree pruning and re-grafting (SPR)              JADAKE000000000) and ranged between 269 and 431,263 bp
searches. The phylogeny was visualized using Figtree v1.4.412 .           in length with an N50 and L50 of 137,263 and 6, respectively,
The phylogram was rooted using an outgroup, the branch                    and a total length of 2,419,934 bp. The G + C content of
leading to Vagococcus penaei (strain: CD276) and Vagococcus               the draft genome was 35.1% and contained a total of 2,321
martis (strain: D7T301) and was shown with bootstrap replicates           genes (2,257 CDS), 47 tRNAs, 13 rRNAs (n = 4 5S rRNA,
hidden when less than 50%. In addition to the 16S rDNA                    n = 3 16S rRNA, n = 6 23S rRNA), and 4 ncRNAs (Figure 1).
phylogeny, the MLST allelic profiles of E. faecium house-                 No plasmids were identified in the assembly. The BLASTp
keeping genes were downloaded from pubMLST13 and were                     results illustrated by rings 6 – 10 in Figure 1 indicate that the
identified and extracted from the E. lacertideformus assembly as          proteins of E. lacertideformus do not demonstrate significant
previously stated. The complete sequences of the seven house-             homology to any of the comparator genomes (E. villorum,
keeping genes (atpA, adk, ddl, gdh, gyd, pstS, and purK) were             E. hirae, E. faecium, and E. faecalis), particularly E. faecalis
queried against the reference sequences of known enterococcus             (innermost BLAST ring).
and outgroup bacteria used in the 16S rDNA phylogeny and
extracted. The seven constitutive genes for each bacterium were
then concatenated to produce a multi-locus alignment, and the             Antimicrobial Resistance and Virulence
nucleotide sequences aligned as before. Phylogenetic analysis of          Genes
this dataset was performed employing the GTR + G + I model                The whole genome shotgun assembly of E. lacertideformus
(against best model by BIC) with 1,000 bootstrap replicates.              was screened using ABRicate and PointFinder to identify
The phylogram generated from this approach was visualized and             antimicrobial resistance and virulence encoding genes. Of the
rooted as the 16S rDNA phylogeny.                                         eight databases used, only CARD and VFDB returned hits.
                                                                          A total of two virulence factors, including the ATP-dependant
                                                                          Clp protease proteolytic subunit (ClpP) and fibrinogen binding
RESULTS                                                                   MSCRAMM (Fss3) were identified with VFDB, and two
                                                                          antimicrobial resistance genes, including dihydrofolate reductase
Features of the Genome                                                    (DfrE) and multidrug efflux ABC transporter subunit (EfrB)
Maxilla tissue DNA from three E. lacertideformus infected Asian           were identified with CARD (Table 1). Genes and gene-products
House geckos were subjected to whole genome sequencing                    mediating intrinsic resistance to cephalosporins (CroRS, IreK,
on the Illumina NovaSeq platform producing 498,507,015 to                 and IreP), penicillin (PBPs, pbp5), low-level aminoglycosides
833,901,565 paired reads across all the samples. The relative             [AAC(60 )-Ii, APH(30 )-IIIa] and clindamycin (lsa) were not
                                                                          identified when screening E. lacertideformus. Antibacterial
12
     http://tree.bio.ed.ac.uk/software/figtree/                           biocide and metal resistance genes were additionally predicted
13
     https://pubmlst.org/data/                                            (Table 1). Putative resistance genes related to magnesium, copper,

Frontiers in Microbiology | www.frontiersin.org                       5                                    March 2021 | Volume 12 | Article 635208
Agius et al. Enterococcus and Christmas Island Reptiles
FIGURE 1 | Circular map of the Enterococcus lacertideformus genome. A graphical circular map of the incomplete E. lacertideformus genome performed with the
CGview comparison tool (Stothard et al., 2019). Contigs were ordered against the E. hirae R17 genome using Mauve Contig Mover. Concentric rings from outside to
(Continued)
Frontiers in Microbiology | www.frontiersin.org 6 March 2021 | Volume 12 | Article 635208Agius et al. Enterococcus and Christmas Island Reptiles
FIGURE 1 | Continued
inside are as follows: (1) contigs of the E. lacertideformus incomplete genome (2) Scale marks of the E. lacertideformus genome. The gray rectangles represent
genomic islands (GI-1 to G1-5), white-filled rectangles represent secondary metabolite gene cluster regions (SM-1 to SM-2), hatched boxes represent COG feature
[M – cell wall/membrane/envelope biogenesis] dominant regions unique to E. lacertideformus, and the black rectangle represents a prophage region (PR). (3) COG
features for protein coding genes on the forward strand. (4) Locations of protein coding, tRNA, and rRNA genes on the forward strand. (5) Locations of protein
coding, tRNA, and rRNA genes on the reverse strand. (6) COG features for protein coding genes on the reverse strand. Gene colors indicate protein coding, tRNA,
rRNA and COG features to which they belong are shown in the key below the map. (7–11) Regions of similarity detected using BLASTp (E-value threshold = 0.1)
between CDS translations shared by E. lacertideformus, and those of reference genomes E. villorum F1129D, E. hirae R17, E. faecium AUS0085, and E. faecalis
OG1RF, respectively. Regions of similarity are colored (black to blue) based on the percent identity between the aligned sequence segments are shown below the
map. (12) The black plot depicts GC content with the peaks extending toward the outside of the circle representing GC content above the genome average,
whereas those extending toward the center mark segments with GC content lower than the genome average. (13) The innermost plot depicts GC skew. Both base
composition plots were generated using a sliding window of 10,000 nt.
zinc, cadmium, cobalt, tellurite, selenite and chlorhexidine were Genomic Islands
encoded in the genome. Five regions (GI 1 to 5) totalling 51,927 bp in length (2.15%
of the genome) were predicted as genomic islands (GI) in the
CRISPR Genes E. lacertideformus assembly (Supplementary Table 5). All five
Using the CRISPRCasFinder tool the genome of GIs were distinctly separate from one another and were therefore
E. lacertideformus was identified to have three CRISPR elements not suspected of being a single GI. Each of the five GIs encoded
and two Cas clusters (Table 2). One Cas cluster (CAS-TypeIIA) both hypothetical proteins and proteins with known functionality
was flanked by three CRISPR-Cas genes, consisting of cas1, cas2 (Supplementary Table 5). Independent identification of
and csn2. The second Cas cluster was identified upstream of hypothetical proteins using BLASTp revealed that out of
Cas-TypeIIA and contained only the cas1 and cas2 genes. 44 proteins identified as hypothetical by the Islandviewer
program, 18 returned a positive BLAST result (including 2
Mobile Genetic Elements ribosomal proteins) (Supplementary Table 6). Of these, six
The E. lacertideformus assembly was investigated for mobile genes frequently encoded on GIs were identified, and included
genetic elements, including ICEs, prophages, and transposable three recombinase family proteins (GI-1 and GI-5), a ISL3 family
elements. The genome was identified to contain 36 ICEs transposase (GI-3), a site-specific recombinase, phage integrase
exhibiting homology to six ICE families (Tn5801, Tn916, Tn5253, family (GI-4), and a tyrosine-type recombinase/integrease
ICESt1, ICESa2603, and unclassified) (Supplementary Table 2). (GI-4). Unlike GIs 2 to 5, GI 1 was observed to contain several
Each of the classified ICE families, excluding ICESt1, harbored housekeeping genes, and therefore this region may not in fact
tetracycline resistance from Staphylococcus aureus (Tn5801 represent a true GI.
and Tn916), Streptococcus suis (ICESa2603), Streptococcus
pneumoniae (Tn5253 and Tn916), Streptococcus gallolyticus Secondary Metabolite Gene Clusters
(Tn916), Streptococcus pseudintermedius (Tn916), Streptococcus The E. lacertideformus assembly contained two secondary
agalactiae (Tn916), and Filifactor alocis (Tn916). Additional metabolite regions (Figure 1). The first region (SM-1)
resistance profiles for cadmium and arsenic (ICEa2603) from comprised of two types, the Linear azol(in)e-containing
Streptococcus dysgalactiae, streptothricin (ICESsu05SC260) from peptides (LAP), and thiopeptide cluster. Both clusters
Streptococcus suis, and bacitracin resistance (Tn916) from spanned a total of 29,133 bp (genomic positions 717,698–
Clostridium perfringens were identified. 746,830 bp). The LAP/thiopeptide region contained four
The E. lacertideformus assembly was additionally screened core biosynthetic genes (YcaO × 2, lantibiotic biosynthesis
for prophages using PHASTER, which revealed no intact or dehydratase C-term, SagB), three additional biosynthetic
questionable prophage regions, however, a single incomplete genes (crotonyl-CoA reductase/alcohol dehydrogenase × 2,
prophage region (PHASTER score < 70) 14.8 kb in length, at phosphopantothenoylcysteine decarboxylase), five transport-
position 1,125,949 to 1,140,766 bp, and containing a total of 21 related genes (ABC transporter ATP-binding protein × 2,
proteins (11 phage hits and 10 hypothetical protein hits) was ABC transporter permease protein × 2, ABC transporter
identified (Supplementary Table 3). Seven phage-like proteins related protein), and a single regulatory gene (MarR family
remained following filtering with an E-value threshold of 1e-10. transcriptional regulator). The second region (SM-2) spanning
These prophages were from Siphoviridae and Myoviridae, with 41,158 bp (976,525–1,017,682 bp) contained Type III polyketide
Myoviridae being the most prevalent viral family. synthase (T3PKS). The T3PKS region contained one core
Insertion elements were additionally identified in biosynthetic gene (hydroxymethylglutaryl-CoA synthase), five
E. lacertideformus using ISfinder, and included ISEfa10, additional biosynthetic genes (acetyl-CoA acetyltransferase,
ISEfa5, and ISEfa11 (Supplementary Table 4). The IS elements hydroxymethylglutaryl-CoA reductase, aldo/keto reductase,
identified were small (13–43% of the total IS element), therefore, GTP-binding protein LepA, and alpha/beta hydrolase fold
their functions and contribution to the genome plasticity protein), one transport-related gene (ABC transporter
and resistance capabilities of E. lacertideformus cannot be ATP-binding protein), and a single regulatory gene (GntR
reliably inferred. family transcriptional regulator). No areas of interest were
Frontiers in Microbiology | www.frontiersin.org 7 March 2021 | Volume 12 | Article 635208Frontiers in Microbiology | www.frontiersin.org
Agius et al.
TABLE 1 | Virulence determinants, antimicrobial resistance, and biocide and metal resistance genes present in the E. lacertideformus genome.
Gene Database Product Function Nucleotide positions E-value Identity (%) Query coverage (%)
ClpP VFDB ATP-dependent Clp protease Hydrolysis of proteins to small Contig 9 660936–661529 9e-141 99.5 100.0
proteolytic subunit ClpP peptiles/degradation of misfolded
proteins
Fss3 VFDB Fibrinogen binding MSCRAMM Binding to collagen type V and Contig 17 1684933–1685949 0.0 95.0 100.0
fibrinogen
DfrE CARD Dihydrofolate reductase Resistance to trimethoprim Contig 14 1056463–1056963 2e-109 88.5 99.0
EfrB CARD Multidrug efflux ABC transporter Efflux pump conferring resistance to Contig 9 658166–659182 0.0 95.3 100.0
subunit EfrB macrolide, rifamycin and
fluoroquinolone
mgtA EC Magnesium-transporting ATPase, Mediates magnesium influx to the Contig 8 595875–598523 0.0 100.0 100.0
P-type 1 cytosol
copB EC Copper-exporting P-type ATPase B Required for the copper-inducible Contig 17 1713336–1713836 1.0e-103 91.6 100.0
expression of copper resistance
8
copA EC Copper-importing P-type ATPase A Copper import under copper limiting Contig 17 1716144–1717397 0.0 86.1 99.0
conditions
ziaA EC Zinc-transporting ATPase Zinc-transporting ATPase ziaA Contig 17 1721452–1723533 0.0 100.0 100.0
cadA/yvgW EC Cadmium, zinc and cobalt-transporting Couples the hydrolysis of ATP with the Contig 17 1716144–1717397 0.0 86.1 99.0
ATPase transport of cadmium, zinc and cobalt
out of the cell
recG EC ATP-dependent DNA helicase RecG Can confer resistance to tellurite and Contig 2 112412–114448 0.0 100.0 100.0
selenite
tcrB EC Cation transport ATPase (P-type) The transferable, plasmid-localized Contig 17 1713858–1714784 1.0e-178 86.6 96.0
copper resistance efflux ATPase
chtR EC Cognate DNA-binding response Chlorhexidine tolerance response Contig 20 2035895–2036569 5.0e-162 100.0 100.0
regulator regulator
Enterococcus and Christmas Island Reptiles
March 2021 | Volume 12 | Article 635208
mgtA PR Magnesium-translocating P-type Magnesium transmembrane transporter Contig 8 595875–598523 0.0 100.0 100.0
ATPase activity
CARD, comprehensive antibiotic resistance database; EC, experimentally confirmed resistance database; VFDB, virulence factor database; PR, predicted resistance database.Agius et al. Enterococcus and Christmas Island Reptiles
discovered when E. lacertideformus was mined for RiPPs and
Contig 23 2380171–2380261
bacteriocins using BAGEL4.
Contig 3/4 216238–216307
Contig 8 576,235–576,975
Contig 8 577,029–577,352
Contig 9 646250–646330
Nucleotide positions
2,203,903–2,204,763
2,203,559–2,303,870
2,202,913–2,203,581
Tandem Repeats
CRISPR positions
A total of 118 tandem repeats (TRs) were identified in the
E. lacertideformus assembly with period sizes ranging from to 1 to
Contig 22
Contig 22
Contig 22
285 bp. The total TR length and percentage of genome coverage
for period size were 4,049 bp and 0.167%, respectively. Many of
the TRs identified in E. lacertideformus were minisatellites (10–
100 bp), with 56% of all repeats located in protein-coding regions
(Supplementary Table 7).
Query/identity %
CRISPR length
100.0/84.3
100.0/85.4
100.0/86.4
100.0/94.4
96.0/74.0
Biofilm-Associated Genotypes
69
80
90
Screening E. lacertideformus for genotypes encoding biofilm
formation and pili expression revealed three putative genes with
an E-value threshold of 1e-10 and percentage identical sites
>60%. The genes EfaAfs (2,054,498–2,055,305 bp) (E. faecalis
KUB3006), srtC (1,634,471–1,634,826 bp) (E. faecalis OG1RF),
and scm (702,666–702, 835 bp) (E. faecium DO) returned an
Spacers count
E-value and percent identity of 3.77e-73 and 68.7%; 1.08e-16 and
1.1e-180
E-value
66.3%; and 1.16e-22 and 75.1%, respectively.
4e-158
3e-61
6e-68
7e-98
1
1
1
Phylogenetic Analysis
The entire 16S rDNA sequence of E. lacertideformus was
compared with the 16S rDNA sequences of other members
of the Enterococcus genus (n = 30), along with two strains
TTGTATGTTTTTAGCTAATTCA
from the genus Vagococcus (L. penaei, V. martis) that were
Mandatory/general-class 2
used as outgroups (Supplementary Table 8). The maximum
TTTTTTTTTTTTTTGATCTA
TGTTTACTTTATCTAACAA
Accessory/general-class 1
Accessory/general-class 2
Accessory/general-class 1
Accessory/general-class 2
TAGCAGAAAAGCAACCA
GAATCGGAAGACAAGA
likelihood phylogeny placed E. lacertideformus within the
Gene status/system
Spacer sequence
E. faecium clade (Supplementary Figure 1), clustering with
both E. villorum strains (F1129D and NBRC 100699). The
maximum sequence identity of E. lacertideformus 16S rDNA
to the reference sequences included in the phylogram was
99.39% (E. villorum F1129D). The phylogeny additionally
showed that the E. lacertideformus and E. villorum cluster
were closely related to Enterococcus mundtii, but distant from
Number of copies
TABLE 2 | CRISPR-Cas elements present in the E. lacertideformus assembly.
Enterococcus durans and E. faecium strains. However, the
DR length
evolutionary relationships of E. lacertideformus to members
25
24
25
2
2
1
of the Enterococcus genus could not be adequately defined
using 16S rDNA sequences due to poor clustering support.
The multi-locus phylogenetic tree provided a more reliable
estimate of the evolutionary relationships across enterococci,
CRISPR-associated endoribonuclease
dividing all 31 strains of Enterococcus into five distinct species
type II-A CRISPR-associated protein
CTGTTTTATCAGAAAAGGTGCAAT
AATTTTTCTTCATTTCCTAGTATCT
CRISPR associated endonuclease
groups (E. faecalis, Enterococcus pallens, Enterococcus dispar,
TTTTTTTTTTTTTTTTTTTTTTTTT
Enterococcus casseliflavus, and E. faecium) (Holzapfel and Wood,
2014; Zhong et al., 2017). Indeed, the multi-locus phylogeny
estimated using the seven concatenated house-keeping genes,
in agreement with the 16S rDNA phylogeny, shows that
DR consensus
E. lacertideformus is a member of the E. faecium species group,
and is a sister species to both E. villorum strains (Figure 2). The
Product
E. lacertideformus and E. villorum cluster were closely related to
DR, direct repeat.
E. hirae, but distant from E. mundtii and E. faecium strains. The
bootstrap support for the multi-locus phylogeny was significantly
CRISPR 1
CRISPR 2
CRISPR 3
improved on comparison to the 16S rDNA phylogeny, with
all nodes in the E. faecium clade providing support greater
Gene
Gene
csn2
cas1
cas2
than 60 percent.
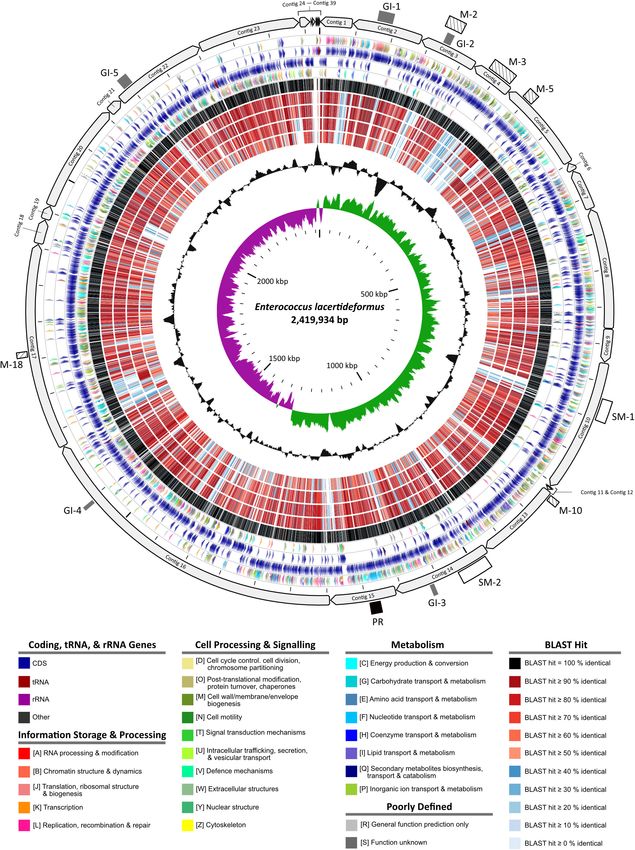
Frontiers in Microbiology | www.frontiersin.org 9 March 2021 | Volume 12 | Article 635208Agius et al. Enterococcus and Christmas Island Reptiles FIGURE 2 | Multi-locus phylogenetic tree. The evolutionary history using seven enterococcal house-keeping genes (atpA, adk, ddl, gdh, gyd, pstS, and purK) was inferred by the Maximum Likelihood method, employing the General-Time-Reversible model with Gamma distributed plus Invariant sites (GTR + G + I), with 33 nucleotide sequences including the novel E. lacertideformus. The percentage of trees in which the associated taxa clustered together is shown next to the branches and is derived from 1,000 bootstraps (bootstraps > 50% shown). There was a total of 3,461 positions in the final dataset. The various enterococcus clades are shaded, with the E. faecium species group highlighted in blue, and novel E. lacertideformus denoted in bold (dark blue shading). Comparative Genomics The COGs of E. lacertideformus were classified into 20 Pairwise comparisons and MLST analysis of house-keeping genes features. A significant majority of them were assigned to between the E. lacertideformus assembly (sample 10702.133) and well-defined functional features; however, the two single largest the other samples – 10706.10 and 10706.1 – indicated that all categories were represented by functionally uncharacterized three individual samples were highly clonal and likely represented COGs (categories [R] general function prediction, and a dominant strain. Re-mapping the sequence reads from sample [S] function unknown) (Figure 3A). Other significant 10702.133 back onto the 10702.133-derived E. lacertideformus proportions of COGs included [G] carbohydrate transport assembly revealed a total of 14 SNPs present likely from and metabolism, [M] cell wall/membrane/envelope biogenesis, assembly errors. Samples 10706.10 and 10706.1 showed a and [K] transcription. The functional features [Z] cytoskeleton greater but not dissimilar number of SNPs when compared and [N] cell motility represented the minority of COGs. to the E. lacertideformus assembly, including 20 and 35 SNPs, The COG features and their proportions common across respectively (Table 3). Furthermore, an analysis of the key MLST E. lacertideformus and the comparator genomes E. villorum genes revealed no SNPs between the three samples. F1129D, E. hirae R17, E. faecium AUS0085, and E. faecalis Frontiers in Microbiology | www.frontiersin.org 10 March 2021 | Volume 12 | Article 635208
Agius et al.                                                                                                                     Enterococcus and Christmas Island Reptiles

TABLE 3 | Pairwise comparisons (SNPs and nucleotide similarity percentage) of three E. lacertideformus sample reads to the final E. lacertideformus assembly
(sample: 10702.133).

                                                                              10702.133                               10706.10                                10706.1

E. lacertideformus assembly (sample: 10702.133)                         SNPs = 14 99.9994%                     SNPs = 20 99.9992%                      SNPs = 35 99.9986%

  FIGURE 3 | Classification of COGs in E. lacertideformus and comparator genomes by feature categories. The proportions of COGs by features common across
  (A) E. lacertideformus, (B) E. villorum F1129D, (C) E. hirae R17, (D) E. faecium AUS0085, and (E) E. faecalis OG1RF are illustrated. A total count of these common
  COGs for each genome are shown below the respective chart. One letter abbreviations for the features: [C], energy production and conversion; [D], cell cycle
  control, cell division, chromosome partitioning; [E], amino acid transport and metabolism; [F], nucleotide transport and metabolism; [G], carbohydrate transport and
  metabolism; [H], coenzyme transport and metabolism; [I], lipid transport and metabolism; [J], translation, ribosomal structure and biogenesis; [K], transcription; [L],
  replication, recombination and repair; [M], cell wall/membrane/envelope biogenesis; [N], cell motility; [O], posttranslational modification, protein turnover, chaperones;
  [P], inorganic ion transport and metabolism; [Q], secondary metabolites biosynthesis, transport and catabolism; [R], general function prediction only; [S], function
  unknown; [T], signal transduction mechanisms; [U], intracellular trafficking, secretion and vesicular transport; [V], defense mechanisms. The bar chart (F) illustrates
  the number of COGs (y-axis) for the [M] (green) and [I] (purple) functional groups which showed the largest disparity between (A) E. lacertideformus, and comparator
  genomes (B) E. villorum, (C) E. hirae, (D) E. faecium, and (E) E. faecalis.

OG1RF were illustrated (Figures 3A–E). Comparative genomic                                E. hirae R17, E. faecium AUS0085 and E. faecalis OG1RF,
analysis of COG features revealed that E. lacertideformus                                 respectively (Figure 3).
contained 29.7, 37.2, 19.0, and 62.1% more genes encoding                                    The number of core and E. lacertideformus-specific individual
cell wall/membrane/envelope biogenesis [M]; and 23.5, 16.7,                               COGs for a particular feature totalled 1,022 (1923 genes) and 27
21.2, and 12.5% encoding lipid transport and metabolism [I]                               (37 genes), respectively (Table 4). Core COGs with a functional
when assessed against comparator genomes E. villorum F1129D,                              prediction were assigned to 18 of 23 COG features, and the

Frontiers in Microbiology | www.frontiersin.org                                      11                                             March 2021 | Volume 12 | Article 635208
Agius et al. Enterococcus and Christmas Island Reptiles
TABLE 4 | Features of core and strain-specific COGs present in the E. lacertideformus assembly.
Function of each feature Core COGs Specific COGs Function Core COGs Specific COGs
[A] RNA processing and 0 0 [Y] Nuclear structure 0 0
modification
[B] Chromatin structure and 0 0 [Z] Cytoskeleton 0 0
dynamics
[J] Translation, ribosomal 130 (156) 0 [C] Energy production and 40 (67) 3 (4)
structure and biogenesis conversion
[K] Transcription 64 (163) 0 [G] Carbohydrate transport and 72 (183) 2 (5)
metabolism
[L] Replication, recombination 75 (111) 1 (1) [E] Amino acid transport and 65 (143) 2 (2)
and repair metabolism
[D] Cell cycle control, cell 13 (26) 0 [F] Nucleotide transport and 52 (76) 0
division, chromosome metabolism
partitioning
[O] Posttranslational 37 (55) 0 [H] Coenzyme transport and 28 (43) 0
modification, protein turnover, metabolism
chaperones
[M] Cell 56 (150) 2 (3) [I] Lipid transport and 32 (57) 2 (3)
wall/membrane/envelope metabolism
biogenesis
[N] Cell motility 4 (9) 0 [Q] Secondary metabolites 9 (23) 1 (1)
biosynthesis, transport and
catabolism
[T] Signal transduction 29 (61) 1 (1) [P] Inorganic ion transport and 49 (112) 3 (5)
mechanisms metabolism
[U] Intracellular trafficking, 18 (24) 0 [R] General function prediction 111 (237) 5 (5)
secretion and vesicular only
transport
[V] Defense mechanisms 8 (36) 0 [S] Function unknown 130 (191) 5 (7)
[W] Extracellular structures 0 0 Total 1022 (1923) 27 (37)
number of COGs (n = 347, 44.5%) and genes (n = 704, 47.1%) periplasmic protein, and ABC-type maltose transport system
for class metabolism were most prevalent in comparison to permease component).
the remaining functional classes: cell processing and signaling Counts for ‘Core COGs’ represent the number of individual
(COGs, n = 165, 21.1%; genes, n = 361, 24.1%), and information, COG IDs for each feature only when they were present in all
storage, and processing (n = 269, 34.4%; genes, n = 430, the five enterococcus genomes examined (E. lacertideformus,
28.8%). Of the core metabolic features, carbohydrate transport E. villorum F1129D, E. hirae R17, E. faecium AUS0085, and
and metabolism had the greatest number of COGs (n = 72). E. faecalis OG1RF). Counts for the ‘Specific COGs’ indicate the
Specific COGs unique to E. lacertideformus and with a functional number of COG IDs identified only in the E. lacertideformus
prediction were identified across 9 features (Table 4), and were assembly, and not in the other enterococcal comparator
mainly associated with class metabolism (COGs, n = 13, 48.1%; genomes examined.
genes, n = 20, 62.5%), particularly for features [C] energy The number of core COGs listed for each feature do not
production and conversion (COGs, n = 3; genes, n = 4), [P] represent the total number of core COGs as some counts were
inorganic ion transport and metabolism (COGs, n = 3; genes, not considered because particular COG IDs did not occur across
n = 5), and [G] carbohydrate transport and metabolism (COGs, all five genomes.
n = 2; genes, n = 5) (Supplementary Table 9). Bracketed values in the ‘Core COGs’ and ‘Specific COGs’
The number of individual COGs for a particular feature columns indicate the number of genes identified for each COG
absent from E. lacertideformus but present in all comparator feature in E. lacertideformus.
enterococci totalled 54 (50 individual genes) (Supplementary
Table 10). Of the 54 COGs, 37 were annotated with a functional Regions Unique to E. lacertideformus
prediction, and the remaining 17 as function unknown or general Comparison of the E. lacertideformus assembly to E. villorum
function prediction. The majority of COGs with a functional F1199D, E. hirae R17 and E. faecium AUS0085 revealed a total of
characterization (n = 27, 73.0%) occurred in features representing 19 unique regions greater than 5,000 bp in length present in the
metabolism ([C] = 5, [E] = 10, [F] = 3, [G] = 6, [H] = 1, E. lacertideformus genome and absent in at least two of the three
[P] = 2), particularly iron (flavodoxin/ferredoxin oxidoreductase, comparator genomes (Figure 4). Of the 19 regions, the entire
ferredoxin, and ferrous transport systems) and sugar-related length of 12 insertions were absent in all comparator genomes
metabolism (trehalose and maltose hydrolase, maltose binding (box marked with X), an additional three were partially absent
Frontiers in Microbiology | www.frontiersin.org 12 March 2021 | Volume 12 | Article 635208Agius et al. Enterococcus and Christmas Island Reptiles
FIGURE 4 | Regions unique to E. lacertideformus. The unique regions present in the E. lacertideformus whole genome scaffold and absent in at least two of the
comparator genomes E. villorum, E. hirae and E. faecium are illustrated. Individual regions unique to E. lacertideformus are numbered (1–19) according to their order
in the genome. Boxes adjacent to numbered regions indicate the presence and/or absence of the specific region in comparator genomes. Boxes from left to right
refer to E. villorum F1129D, E. hirae R17 and E. faecium AUS0085, respectively. Boxes marked [X] indicate that the novel region displayed is absent in a particular
comparator genome. Genes are colored according to their classification into different COG functional categories. Genes encoding the cell wall/membrane/envelope
biogenesis [M] feature are alphabetically labeled for further reference to tabulated data describing gene functionality (Supplementary Table 11). Clusters of genes
within a unique region highlighted in red refer to genes also present in a particular comparator genome (check box also marked red). Numbers above the genes
indicate nucleotide positions.
across all comparators (red shading), and four were present and metabolism functionality were also commonly identified
in a single comparator genome only (box shaded with white). within these predicted operons (Figure 4).
Genes with [M] cell wall/membrane/envelope functionality were
most prominent across all unique regions (green shading)
(n = 56), followed by genes with [G] carbohydrate transport DISCUSSION
and metabolism functionality (turquoise shading) (n = 49). The
The emergence of this multi-systemic and fatal bacterium
56 genes with cell wall/membrane/envelope biogenesis were
prompted a thorough metagenomics investigation to gain
identified in nine of the 19 unique regions (M-2, M-3, M-4,
insights into the genomic content of E. lacertideformus, and to
M-5, M-7, M-10, M-15, M-17, and M-18). Regions completely
investigate the genetic basis underpinning its unique biofilm
unique to E. lacertideformus and containing [M] functionality
phenotype, pathogenic nature, and inability to grow in vitro.
were identified in regions M-2, M-3, and M-10, regions M-5 and
Comparative genomics were further undertaken to understand
M-18 were classified into this category but also occurred in a
the evolutionary history of E. lacertideformus.
single comparator enterococcus. All [M] category genes across
unique regions one to 19 were queried and the majority exhibited
similarity to enterococcal organisms, with their sequence identity
The Evolutionary History of
ranging from 36.8 to 95.4% (mean 72.9%) (Supplementary Enterococcus lacertideformus and Its
Table 11). A total of 13 operons (black shading) were predicted Clonality
for [M] category genes in the unique regions of E. lacertideformus The MLST phylogeny of concatenated house-keeping genes
and belonged to M-2 (n = 1), M-3 (n = 5), M-4 (n = 1), provided stronger discriminatory power, and the evolutionary
M-5 (n = 4), M-7 (n = 1), and M-10 (n = 1) (Figure 4). relationships among enterococci were more consistent with the
Hypothetical proteins and proteins with carbohydrate transport topology of robust phylogenies and previous studies (Holzapfel
Frontiers in Microbiology | www.frontiersin.org 13 March 2021 | Volume 12 | Article 635208Agius et al. Enterococcus and Christmas Island Reptiles
and Wood, 2014). The MLST phylogeny divided the enterococci Each of the carbohydrate genes specific to E. lacertideformus
into five distinct lineages: E. faecalis, pallens, dispar, casseliflavus, encoded various subunits of sugar phosphotransferase
and faecium, and placed E. lacertideformus in a monophyletic system (PTS) transporters. Sugar phosphotransferase system
cluster within the E. faecium clade, and a sister species to transporters are involved in signal transduction and in the
both E. villorum strains. As expected, the phylogenetic tree transport and metabolism of sugars, all essential for modulating
based on the 16S rDNA gene provided poor reliability (low biofilm formation and EPS synthesis (Loo et al., 2003; Lazazzera,
bootstrap support) and delineation of enterococci at the species- 2010; Kawada-Matsuo et al., 2016; Heo et al., 2019). An
level, as has been previously demonstrated (Rose et al., 2017; additional E. lacertideformus-specific COG; glycerol-3-phosphate
Zhong et al., 2017). cytidylyltransferase (COG0615) may further correlate with the
The MLST results and low number of SNPs identified across biofilm-forming capacity of this bacterium. Four genes encoding
the E. lacertideformus assemblies indicated that the sequences this enzyme were identified in features [M] (n = 2) and [I]
were indistinguishable, and therefore appear to represent a (n = 2). Glycerol-3-phosphate cytidylyltransferase is involved
clonal expansion of a specific E. lacertideformus strain, a trait in the biosynthesis of teichoic acid linkage units, which are
characteristic of highly pathogenic enterococci (Homan et al., important for cell wall biogenesis in Gram-positive bacteria
2002; Ruiz-Garbajosa et al., 2006). The variant frequency for (Rodrigues et al., 2016). Therefore, the identification of these
several of these SNPs approached the 50% cut-off, which is likely E. lacertideformus-specific genes may explain its unique biofilm
due to base calling errors in sequencing, or the presence of phenotype and should be considered as pertinent candidates
a mixed sample population. Therefore, each sample analyzed for future experimental tests. Further work incorporating
may in effect contain fewer SNPs than reported, subsequently transcriptomic analyses of these targets, particularly glycerol-
the number of SNPs was considered negligible. The presence 3-phosphate should be undertaken in concert with molecular
of non-target organisms within the assemblies was considered. cloning experiments. Molecular cloning of target genes
E. lacertideformus was suggested to be the dominant variant expressed by the bacterium into strains of non-biofilm-forming,
because of the lack of SNPs identified, the use of the aseptic phylogenetically related enterococci will provide insights into
sample collection technique, the absence of enterococcal growth their precise function, and whether they contribute to the biofilm
in vitro, along with cytological and histological evidence of only phenotype of E. lacertideformus.
E. lacertideformus organisms (Rose et al., 2017). However, as Several unique regions containing genes with [M]
sequencing was not performed on a pure culture, this assembly functionality occurred in predicted operons and were
should be considered as a group rather than a single strain. frequently clustered with genes of unknown function.
Considering enterococcal biofilm formation is often encoded
by complementary, overlapping and potentially redundant
Comparative Genomics Highlights gene clusters (e.g., bee locus, locus and fsr locus) (Hashem
Genes Linked to Cell Wall and Biofilm et al., 2017), the proteins containing domains of unknown
Formation and Novel Metabolism function identified in E. lacertideformus may be involved in
Enriched COGs assigned to the features cell biofilm formation as a result of their loci. Additionally, several
wall/membrane/envelope biogenesis [M] and lipid transport uncharacterized enterococcal loci are involved or expressed
and metabolism [I] in E. lacertideformus relative to comparator during the development of biofilms (Ballering et al., 2009) in
enterococci indicate a strong selective pressure and niche animal models of infection (Frank et al., 2015), further suggesting
selection for these genes. The enriched COGs for [I] suggests their potential role in enterococcal biofilm production. The
that lipid utilization capacity in E. lacertideformus is extensive identification of these regions, particularly those predominating
relative to comparator enterococci. Lipids are critical elements in [M] category genes, and their occurrence in multiple distinct
of bacterial cell walls and membranes, and are responsible operons are likely responsible for the distinctively thick matrix
for biomembrane synthesis, cell membrane physical and and fibrillar capsular projections surrounding this bacterium and
chemical properties (Bogdanov et al., 2002), and modulating its immune evasion strategies. As this research identified core
biofilm formation of Gram-positive bacteria in vivo (Theilacker and E. lacertideformus-specific genes based on COG IDs, future
et al., 2009). The physiological associations between these studies will be required to incorporate more reliable methods to
features, and the biofilm phenotype and pathogenic nature of identify COGs at a gene-level basis.
E. lacertideformus supports the functional enrichment of [M]
and [I] features. Further investigation into the functions of the
enriched genes/gene pathways will aid in understanding their Genomics of Enterococcus
importance in contributing to the fitness of E. lacertideformus. lacertideformus Pathogenesis
The high prevalence of core and E. lacertideformus-specific Virulence factors encoding for structural elements including pili
COGs for class metabolism, particularly carbohydrate transport and the capacity to form biofilms have been identified across
and metabolism functionality [G] suggests an extensive several species of enterococci (Ch’ng et al., 2019). The molecular
carbohydrate utilization capacity by E. lacertideformus. mechanisms that promote or inhibit this complex process (Ch’ng
Carbohydrate transport and metabolism plays a pivotal role in et al., 2019) are not well characterized (Hashem et al., 2017), with
biofilm formation of Gram-positive bacteria, particularly in the nearly one quarter of the 100 genetic loci involved in enterococcal
clinically significant E. faecalis and E. faecium (Pillai et al., 2004). biofilm formation encoding products annotated as hypothetical
Frontiers in Microbiology | www.frontiersin.org 14 March 2021 | Volume 12 | Article 635208You can also read