Helicopter-borne observations of the continental background aerosol in combination with remote sensing and ground-based measurements - Atmos ...
←
→
Page content transcription
If your browser does not render page correctly, please read the page content below
Atmos. Chem. Phys., 18, 1263–1290, 2018
https://doi.org/10.5194/acp-18-1263-2018
© Author(s) 2018. This work is distributed under
the Creative Commons Attribution 4.0 License.

Helicopter-borne observations of the continental background
aerosol in combination with remote sensing and
ground-based measurements
Sebastian Düsing1 , Birgit Wehner1 , Patric Seifert1 , Albert Ansmann1 , Holger Baars1 , Florian Ditas1,2 ,
Silvia Henning1 , Nan Ma1 , Laurent Poulain1 , Holger Siebert1 , Alfred Wiedensohler1 , and Andreas Macke1
1 Leibniz   Institute for Tropospheric Research (TROPOS), 04318 Leipzig, Germany
2 Multiphase    Chemistry Department, Max Planck Institute for Chemistry, P.O. Box 3060, 55020, Mainz, Germany

Correspondence: Sebastian Düsing (duesing@tropos.de)

Received: 30 June 2017 – Discussion started: 20 July 2017
Revised: 8 November 2017 – Accepted: 24 November 2017 – Published: 31 January 2018

Abstract. This paper examines the representativeness of           resentative of the PBL when the PBL is well mixed. Locally
ground-based in situ measurements for the planetary bound-        isolated new particle formation events on the ground or at
ary layer (PBL) and conducts a closure study between air-         the top of the PBL led to vertical variability in the cases pre-
borne in situ and ground-based lidar measurements up to an        sented here and ground-based measurements are not entirely
altitude of 2300 m. The related measurements were carried         representative of the PBL.
out in a field campaign within the framework of the High-            Based on Mie theory (Mie, 1908), optical aerosol proper-
Definition Clouds and Precipitation for Advancing Climate         ties under ambient conditions for different altitudes were de-
Prediction (HD(CP)2 ) Observational Prototype Experiment          termined using the airborne in situ measurements and were
(HOPE) in September 2013 in a rural background area of            compared with the lidar measurements. The investigation of
central Europe.                                                   the optical properties shows that on average the airborne-
   The helicopter-borne probe ACTOS (Airborne Cloud and           based particle light backscatter coefficient is 50.1 % smaller
Turbulence Observation System) provided measurements              for 1064 nm, 27.4 % smaller for 532 nm, and 29.5 % smaller
of the aerosol particle number size distribution (PNSD),          for 355 nm than the measurements of the lidar system. These
the aerosol particle number concentration (PNC), the num-         results are quite promising, since in situ measurement-based
ber concentration of cloud condensation nuclei (CCN-NC),          Mie calculations of the particle light backscattering are
and meteorological atmospheric parameters (e.g., tempera-         scarce and the modeling is quite challenging. In contrast,
ture and relative humidity). These measurements were sup-         for the particle light extinction coefficient we found a good
ported by the ground-based 3 + 2 wavelength polarization          agreement. The airborne-based particle light extinction coef-
lidar system PollyXT , which provided profiles of the parti-      ficient was just 8.2 % larger for 532 nm and 3 % smaller for
cle backscatter coefficient (σbsc ) for three wavelengths (355,   355 nm, for an assumed LR of 55 sr. The particle light extinc-
532, and 1064 nm). Particle extinction coefficient (σext ) pro-   tion coefficient for 1064 nm was derived with a LR of 30 sr.
files were obtained by using a fixed backscatter-to-extinction    For this wavelength, the airborne-based particle light extinc-
ratio (also lidar ratio, LR). A new approach was used to deter-   tion coefficient is 5.2 % smaller than the lidar measurements.
mine profiles of CCN-NC for continental aerosol. The results      For the first time, the lidar ratio of 30 sr for 1064 nm was de-
of this new approach were consistent with the airborne in situ    termined on the basis of in situ measurements and the LR of
measurements within the uncertainties.                            55 sr for 355 and 532 nm wavelength was reproduced for Eu-
   In terms of representativeness, the PNSD measurements          ropean continental aerosol on the basis of this comparison.
on the ground showed a good agreement with the mea-               Lidar observations and the in situ based aerosol optical prop-
surements provided with ACTOS for lower altitudes. The            erties agree within the uncertainties. However, our observa-
ground-based measurements of PNC and CCN-NC are rep-              tions indicate that a determination of the PNSD for a large

Published by Copernicus Publications on behalf of the European Geosciences Union.
1264                                               S. Düsing et al.: Airborne in situ and remote sensing aerosol observations

size range is important for a reliable modeling of aerosol par-     ties, as well as to account for changes in the scattering prop-
ticle backscattering.                                               erties due to hygroscopic-growth effects (Pilinis et. al, 1995).
                                                                       In particular, aerosol particle properties in the planetary
                                                                    boundary layer (PBL) require a thorough characterization,
                                                                    because the majority of the global aerosol mass is emitted,
                                                                    formed (Rosati et al., 2016b), and also trapped there (Summa
1   Introduction                                                    et al., 2013). For instance, for a residential area in the Czech
                                                                    Republic, Hovorka et al. (2016) found aerosol particle mass
Aerosol particles are a ubiquitous constituent of the Earth’s       concentrations at the top of the PBL to be 5 times larger than
atmosphere (Vaughan and Cracknell, 2013). Their sources             just above the PBL (50 µg m−3 in contrast to 10 µg m−3 ).
are manifold, reaching from natural ones such as the oceans,           In order to derive the aerosol radiative forcing in an at-
deserts, and the biosphere to anthropogenic ones such as            mospheric air column, profiles of the aerosol particle light
biomass-burning activity, transportation, agricultural, and re-     extinction coefficient (σext ), which is the sum of the aerosol
suspended dust or industrial pollution (Pöschl, 2005; Sein-         particle light absorption and scattering coefficient, are a fea-
feld and Pandis, 2006). Once aerosol particles are formed           sible measure. Height-resolved aerosol particle light extinc-
from precursor gases or suspended in air, they can be car-          tion coefficients can be obtained either by airborne in situ
ried over hundreds to thousands of kilometers before they           measurements or with remote sensing techniques such as li-
are removed from the atmosphere by dry or wet deposi-               dar. Ground-based remote sensing observations with lidar are
tion. The lifetime in the boundary layer counts from hours          suitable to derive long-term temporally resolved profiles of
to approximately 2 weeks (Seinfeld and Pandis, 2006). Dur-          the mentioned coefficients detecting the backscattered light
ing their residence time in the atmosphere, aerosol parti-          of the total aerosol particle population in its ambient state
cles have impacts on atmospheric chemistry, cloud forma-            (Baars et al., 2016; Engelmann et al., 2016). However, li-
tion, and microphysics (change of cloud albedo; Twomey              dar measurements are restricted to the retrieval of the total
et al., 1977) as well as on the radiation budget by changing        aerosol particle light extinction coefficient. The separation
cloud albedo and cloud lifetime (Twomey et al., 1977). Con-         into the contributions of scattering and absorption relies on
sequently, aerosol particles have both a natural and an an-         complex inversion schemes, which are restricted to night-
thropogenic influence on weather and climate (IPCC, 2013).          time observations, long averaging times, and rather low ver-
The direct climatic effect of aerosols is based on their ra-        tical resolution (Müller et al., 1999, 2000). Recently, novel
diative cooling or heating of the atmosphere due to scatter-        approaches based on the combination of daytime lidar ob-
ing and absorption of solar radiation (Bohren and Huffman,          servations with sun photometer measurements of column-
1983; Chauvigné et al., 2016; Seinfeld and Pandis, 2006).           integrated aerosol particle light scattering properties were
The estimate of the radiative forcing by aerosol–radiation in-      developed, which allow estimating the contributions of ab-
teraction of −0.35 W m−2 is very uncertain within the bor-          sorption and scattering. This is for instance the case for
ders of −0.85 to +0.15 W m−2 (IPCC, 2013). The type of              the Generalized Aerosol Retrieval from Radiometer and Li-
aerosol is important in this consideration. For instance, inor-     dar Combined data (GARRLiC) algorithm (Lopatin et al.,
ganic salts such as sulfate or nitrate aerosols lead to an es-      2013). However, these techniques are in general still based
timated negative radiative forcing of −0.4 W m−2 and there-         on column-integrated measurements and thus are still subject
fore have a cooling effect on the atmosphere. The absorbing         to considerable uncertainties when the aerosol load is low
behavior of black carbon (BC) particles in contrast warms           (Bond et al., 2013). Furthermore, these methods are limited
the atmosphere and leads to a positive radiative forcing of         to certain conditions, such as the requirements of cloud-free
approximately +0.71 W m−2 (90 % uncertainty bounds from             conditions and high aerosol optical depths of at least 0.5 at
+0.08 to +1.27 W m−2 ) (Bond et al., 2013). These estimates         a wavelength of 440 nm (Dubovik et al., 2002).
are subject to uncertainties of 50 to 100 %. A considerable            A benefit of airborne and ground-based in situ measure-
fraction of this uncertainty arises from the highly uncertain       ments is that they allow us to obtain high-quality mea-
knowledge of the vertical distribution of the aerosol parti-        surements of the aerosol particle number size distribution
cles in the atmosphere. As an example, Zarzycki and Bond            (PNSD), optical properties of the aerosol, and consequently
(2010) found that small changes of the vertical BC distribu-        the relationship between aerosol microphysical properties,
tion at cloud interfaces lead to a change in global radiative       chemical properties, and resulting aerosol particle light ab-
forcing by 5 to 10 %. Samset et al. (2013) furthermore stated       sorption, scattering, and extinction coefficients. In particular,
that at least 20 % of the uncertainty in radiative forcing due to   a large number of long-term observations exist on the ground.
the BC is caused by the diversity of the modeled BC particle        For instance, in Germany the German Ultra-fine Aerosol Net-
mass vertical distribution. For aerosol types which contain         work (GUAN; Birmili et al., 2016) is operative. The Global
hydrophilic aerosol compounds such as inorganic salts, the          Atmosphere Watch (GAW) network includes a large number
vertical profile of the relative humidity (RH) also needs to be     of operating stations (http://www.wmo.int/pages/prog/arep/
known to determine the actual particle hygroscopic proper-          gaw/measurements.html). Disadvantageously, with ground-

Atmos. Chem. Phys., 18, 1263–1290, 2018                                              www.atmos-chem-phys.net/18/1263/2018/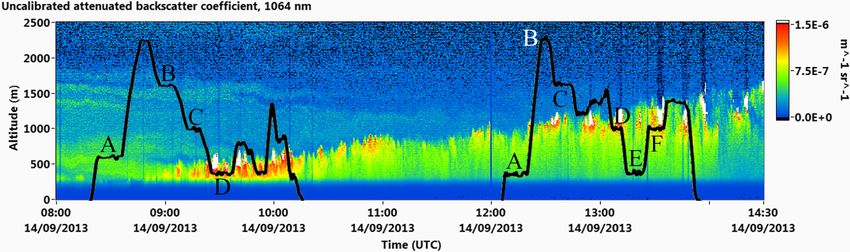
S. Düsing et al.: Airborne in situ and remote sensing aerosol observations                                                       1265

based in situ measurements no vertically resolved informa-           many. In particular, lidar-based aerosol optical properties are
tion about aerosol properties is available, which is needed to       compared to respective values obtained from airborne in situ
ascertain aerosol–cloud interaction (Breon, 2006). Without           measurements, based on modeled optical properties for the
vertically resolved information, ground-based observations           regional background aerosol under consideration of the hy-
are usually assumed to be representative of the entire PBL           groscopic growth of the aerosol particles. We focus on the
and even ground-based measurements are often extrapolated            aerosol particle light backscatter coefficient (σbsc ), since this
to larger scales (Väänänen et al., 2016). Thus, as stated, e.g.,     is the directly measured property of a lidar system. Its con-
by Rosati et al. (2016a), it is of scientific interest to bet-       version from the extinction-to-backscatter ratio (lidar ratio,
ter understand whether ground-based in situ measurements             LR) to the particle light extinction coefficient is also the sub-
can be used to investigate aerosol properties, in particular         ject of this investigation.
their optical properties, for elevated atmospheric layers. This         Additionally, the representativeness of ground-based ob-
general approach leads to biases in modeling aerosol radia-          servations of CCN-NC and thereby directly connected
tive effects. In particular, indirect effects indicated by anthro-   the aerosol hygroscopicity, particle number concentration
pogenic emitted aerosol particles acting as cloud condensa-          (PNC), and the PNSD for different conditions in the PBL are
tion nuclei (CCN) contribute strongest to the uncertainty in         studied by comparing the airborne in situ measurements with
aerosol total radiative forcing (IPCC, 2007; Schwartz et al.,        the observations at Melpitz. Furthermore, CCN-NC profiles
2010). Recently, Mamouri and Ansmann (2016) provided                 derived with the approach of Mamouri and Ansmann (2016)
a method to derive CCN number concentration (CCN-NC)                 are compared with in situ measured CCN-NCs for 0.2 % su-
profiles from lidar measurements. This method is the first           persaturation.
step to evaluate CCN-NC’s profiles with ground-based tech-              The results of this work are presented as follows. Section 2
niques. However, this method produces significant uncertain-         describes the experiment with all instruments used. In doing
ties of factor 2 to 3.                                               so, we will deal separately with the ground and airborne mea-
   Opposed to the ground-based in situ measurements, air-            surements. A description of the meteorological conditions
borne measurements, such as from aircraft (Wex et al., 2002),        on the measurement days and an explanation of the algo-
tethered-balloon systems (Ferrero et al., 2014; Mazzola et al.,      rithm for determining the optical properties of the aerosol
2016; Ran et al., 2016), zeppelin systems (Rosati et al.,            under ambient conditions are described in Sect. 3. Section 4
2016a, b), unmanned aerial systems (Altstädter et al., 2015),        uses case studies to clarify the representativeness of ground-
or helicopter-borne payload (Siebert et al., 2006), are capable      based measurements for the planetary boundary layer. Fur-
to provide spatiotemporal highly resolved measurements of            thermore, a closure between lidar measurements and airborne
optical and microphysical aerosol particle properties in a ver-      measurements is shown. Optical and microphysical aerosol
tical and horizontal manner. However, these observations are         properties (CCN) are discussed. Finally, the results are sum-
rather expensive in cost and limited in time.                        marized in Sect. 5.
   Disadvantageously, both airborne and ground-based in situ
measurements alter the humidity state of the aerosol. There-
fore, the aerosol is often dried before the particle properties      2   Experiment
are characterized to achieve comparability between different
measurements (Wiedensohler et al., 2012). A comparability            HOPE-Melpitz was one of two field experiments within
with lidar measurements can be achieved by simulating the            the scope of the “High Definition Clouds and Precipitation
environmental condition (e.g., size) of the particles. The hy-       for advancing climate prediction” project (see http://www.
groscopic properties of the particles that can be either mea-        hdcp2.eu). The project’s aims have been to reduce uncertain-
sured or calculated are relevant in this context. The parame-        ties in the representation of cloud and precipitation in atmo-
terization by Petters et al. (2007) is for this purpose a useful     spheric models (detailed information for HOPE is given in
approach to ascertain the hygroscopic growth of the aerosol          Macke et al., 2017).
particles on the basis of their hygroscopicity parameter (κ).           HOPE-Melpitz took place between 9 and 27 Septem-
   Within the scope of this article, two of the abovemen-            ber 2013, at the central European research observatory
tioned challenges are addressed by means of sophisticated            Melpitz, Saxony, Germany (51◦ 320 N, 12◦ 560 E; 84 m a.s.l.).
closure studies: (a) ground-based in situ observations were          Melpitz is located in a rural area, 44 km northeast of Leipzig.
compared to airborne in situ observations to investigate the         The approximate distance to the Baltic Sea in the north is
representativeness of ground-based in situ measurements for          400 km, 500 km to the North Sea, and 1000 km to the At-
the planetary boundary layer and (b) airborne in situ ob-            lantic Ocean. The TROPOS field observatory Melpitz is sit-
servations were compared to ground-based remote sensing              uated in a plain open landscape, bound by the Ore Moun-
to cross-check assumptions made in lidar remote sensing.             tains to the further south, Berlin to the north, Leipzig to the
These were corroborated in the frame of the HD(CP)2 Obser-           west, and Polish industrial areas to the east. The measure-
vational Prototype Experiment HOPE (Macke et al., 2017)              ments are therefore representative of the central European
at the central European research observatory Melpitz, Ger-           regional background aerosol.

www.atmos-chem-phys.net/18/1263/2018/                                                 Atmos. Chem. Phys., 18, 1263–1290, 2018
1266                                            S. Düsing et al.: Airborne in situ and remote sensing aerosol observations

                                                                2.1     Ground-based in situ instrumentation

                                                                2.1.1    Particle number size distribution

                                                                The PNSD was derived using two instruments under con-
                                                                trolled dry conditions as recommended in Wiedensohler
                                                                et al. (2012). A dual mobility particle size spectrometer
                                                                (TROPOS-type T-MPSS; Birmili et al., 1999) was used to
                                                                measure the PNSD in the mobility diameter Dem range from
                                                                3 to 800 nm. Each scan of the PNSD lasts 10 min and is avail-
                                                                able every 20 min. An aerodynamic particle size spectrome-
                                                                ter (model APS-3320, TSI Inc., Shoreview, MN, USA) was
                                                                employed to determine the PNSD in aerodynamic diameter
                                                                Da range from 0.8 to 10 µm, also with a time resolution of
                                                                10 min. The T-MPSS PNSD was derived using the inversion
                                                                algorithm of Pfeifer et al. (2014) and corrected with respect
                                                                to internal and inlet diffusional losses, using the method of
                                                                “equivalent pipe length” (Wiedensohler et al., 2012).
                                                                   Both size distributions were merged to a continuous distri-
                                                                bution after converting the Da of the APS to Dem by using
                                                                            r
                                                                                χ ρ0
Figure 1. Scheme of the measurement setup used during HOPE-     Dem = Da                                                    (1)
Melpitz (from Macke et al., 2017).
                                                                                 ρa

                                                                according to DeCarlo et al. (2004), whereby the aerosol parti-
                                                                cle density is assigned by ρa and ρ0 is the standard density of
   The Melpitz Observatory is included in several obser-
                                                                1.0 g cm−3 . The dynamic shape factor is represented by χ. In
vational networks and setups, such as LACROS (Leipzig
                                                                this study we assumed an effective aerosol particle density of
Aerosol and Cloud Remote Observations System), GUAN,
                                                                1.6 g cm−3 , according to Ma et al. (2014), for the fine-mode
ACTRIS (Aerosols, Clouds and Trace gases Research Infras-
                                                                aerosol. The effective density combines the particle density
tructure; www.actris.eu), and GAW. A ground stock of in-
                                                                and dynamic shape factor.
struments is implemented for permanent, high-quality, long-
term measurements, including PNSD, CCN-NC, aerosol par-
                                                                2.1.2    Chemical composition
ticle light scattering and absorption, and aerosol chemical
composition. A detailed description of this measurement site    This section introduces instruments used for measuring the
is given in Spindler et al. (2013, 2010).                       aerosol particle composition, including non-refractory par-
   In addition to the continuously operating instrumenta-       ticulate matter and water-insoluble BC.
tion, several ground-based remote sensing instruments (e.g.,
the Raman lidar system PollyXT ; Engelmann et al., 2016)        Non-refractory chemical compounds
were installed during the intensive campaign period, pro-
viding a detailed overview of the atmospheres constitution      In this study, a dataset of the continuously running
(see Fig. 1). These measurements were complimented by           Quadrupole Aerosol Chemical Speciation Monitor (Q-
the helicopter-borne payload ACTOS (Airborne Cloud and          ACSM, Aerodyne Res. Inc, ARI, Billerica, MA.; Ng et al.,
Turbulence Observation System; Siebert et al., 2006) infer-     2011) was used. The Q-ACSM detects non-refractory partic-
ring microphysical aerosol particle and cloud properties with   ulate matter in the fine regime (NR-PM1) that vaporizes at
a high spatiotemporal resolution. Figure 1 shows a scheme of    around 600 ◦ C with a time resolution of about 25 min. The
the installed instrumentation during the HOPE-Melpitz cam-      included mass spectrometer separates the vaporized material
paign.                                                          into SO−2        −3       +4
                                                                         4 , NO , NH , and organics (Ng et al., 2011).
   The following section will provide a detailed description    A detailed description of the instrument is provided by Ng
of the instrumentation used within the scope of this work.      et al. (2011) and Fröhlich et al. (2015).
                                                                   Based on these ion measurements, the chemical composi-
                                                                tion of the aerosol particles itself was derived by a simple ion
                                                                pairing scheme published by Gysel et al. (2007). Although
                                                                the measurements can be influenced by water-insoluble hy-
                                                                drocarbons, we consider the species of the aerosol com-
                                                                pounds derived with the Q-ACSM to be water soluble, since

Atmos. Chem. Phys., 18, 1263–1290, 2018                                            www.atmos-chem-phys.net/18/1263/2018/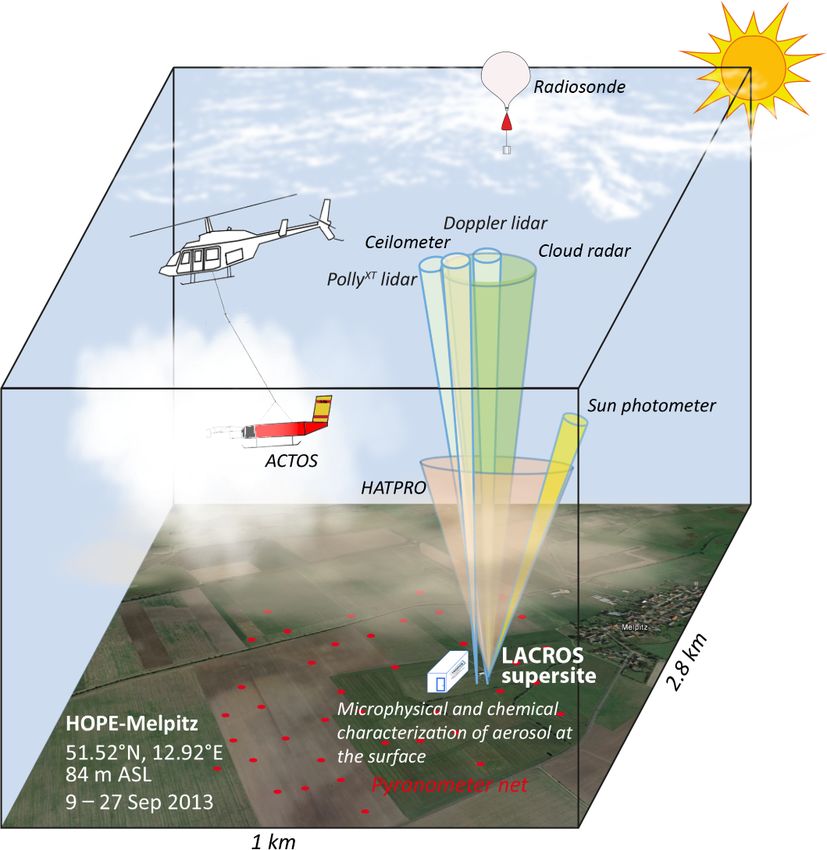
S. Düsing et al.: Airborne in situ and remote sensing aerosol observations                                                    1267

Table 1. Hygroscopicity κ and density ρ of each considered aerosol   Table 2. Summary of takeoff and landing times of the respective
particle compound.                                                   flights of HOPE.

               Component               κi     ρi [g cm−3 ]                          Flight           Takeoff   Landing
                                                                                    [yyyymmdd a/b]   [UTC]      [UTC]
               eBC                    01               1.54
               Organics             0.12              1.273                         20130912a         13:02     13:41
               NH4 NO3             0.672             1.7355                         20130913a         08:51     10:36
               H2 SO4               0.92              1.845                         20130914a         08:19     10:16
               NH4 HSO4            0.612              1.785                         20130914b         12:05     13:54
                                                                                    20130917a         08:36     10:31
               (NH4 )2 SO4         0.612              1.765
                                                                                    20130921a         11:15     13:07
             1 Wu et al. (2013); assumed to be 0. 2 Zaveri                          20130922a         08:56     10:48
             et al. (2010). 3 Ma et al. (2014). 4 Cross                             20130927a         08:08     10:10
             et al. (2007). 5 Lin et al. (2014).

                                                                     The relative uncertainty of the supersaturation can be esti-
Crippa et al. (2014) have found that all over in Europe              mated to be within 10 % (Henning et al., 2014).
the mass fraction of hydrocarbons in organic compounds                  Briefly, the measurement method is as follows: a differ-
is 11 ± 6 %. The major mass fraction of the non-refractory           ential mobility analyzer (DMA) selects aerosol particles ac-
chemical compounds are in PM1 and are thus also represen-            cording to their mobility diameter, which are then counted
tative of PM2.5 .                                                    in total number at this size with a particle counter (model
                                                                     CPC-3010, TSI Inc., Shoreview, MN, USA; Ntot (Dp )) and at
Equivalent black carbon (eBC)                                        a certain water supersaturation with the CCNc (NCCN (Dp )).
                                                                     The size-dependent activated fraction (AF) was calculated by
The Multi-Angle Absorption Photometer (MAAP; model                   the ratio of the PNC of activated particles and the total PNC
5012, Thermo Scientific) was used to derive the equivalent           of a certain size measured after the DMA. The AF was de-
mass concentration of the non-water-soluble eBC for PM10             rived on the basis of diameter scans in the size range from 20
aerosol. MAAP determines the aerosol particle light absorp-          to 440 nm (dry diameter of the aerosol particles) and for dif-
tion coefficient (σabs ) by measuring the attenuation of light       ferent supersaturations in the range from 0.1 to 0.7 %. With
at a wavelength of 637 nm (Müller et al., 2011) due to partic-       a Gaussian error function the AF can be fitted according to
ulate matter deposited on a filter band and by reflected light               a+b

                                                                                               D − Dc

at two angles. The eBC particle mass concentration is calcu-         AF =            1 + erf     √       ,                      (2)
                                                                               2                σ 2
lated by a mass absorption cross section of 6.6 m2 g−1 . With
the assumption that all of the measured eBC is elemental car-        where a and b denote the upper and the lower limit for the
bon (EC), according to Spindler et al. (2013) and Poulain            calculation of the critical diameter Dc (Henning et al., 2014).
et al. (2014), we assume here that PM1 aerosol contains 90 %         Dc is the diameter from which on 50 % of the particles are ac-
of the PM10 eBC (EC) mass derived with the MAAP.                     tivated to droplets. With the single-parameter parameteriza-
   The particle volume concentration and as a consequence            tion by Petters and Kreidenweis (2007) and Dc from Eq. (2)
thereof the volume fraction of each aerosol particle com-            the hygroscopicity parameter can be derived by using
pound was calculated by using the density of the individual                     4A3
species (see Table 1). Like Tsekeri et al. (2017), we assumed        κ=                      ,                                  (3)
                                                                            27Dc3 (ln SS)2
that the aerosol particles in PM2.5 and PM1 had the similar
chemical composition since no highly time-resolved chemi-            with
cal composition measurements for coarse-mode aerosol par-                   4σs/a MW
ticles were available during the campaign.                           A=              .                                          (4)
                                                                             RT ρW
                                                                     In Eqs. (3) and (4), ρW is the density of water, MW the molec-
2.1.3   Cloud condensation nuclei number concentration
                                                                     ular weight of the water, SS the supersaturation inside the
                                                                     CCNc, σs/a = 0.072 J m−2 the surface tension of the solution,
Ground-based monodisperse CCN-NC measurements at                     R = 8.314 J mol−1 K−1 the universal gas constant, and T the
Melpitz are part of the standard measurements within                 temperature.
the ACTRIS network. A stream-wise thermal gradient
cloud condensation nuclei counter (CCNc; model CCN-                  2.2    Airborne measurements
100, Droplet Measurement Technologies, Boulder, USA;
Roberts and Nenes, 2005) is operated to investigate the              ACTOS (Siebert et al., 2006) was deployed at a 140 m long
supersaturation-dependent growth activation of particles.            rope below a helicopter (Siebert et al., 2006). Airborne in

www.atmos-chem-phys.net/18/1263/2018/                                                    Atmos. Chem. Phys., 18, 1263–1290, 2018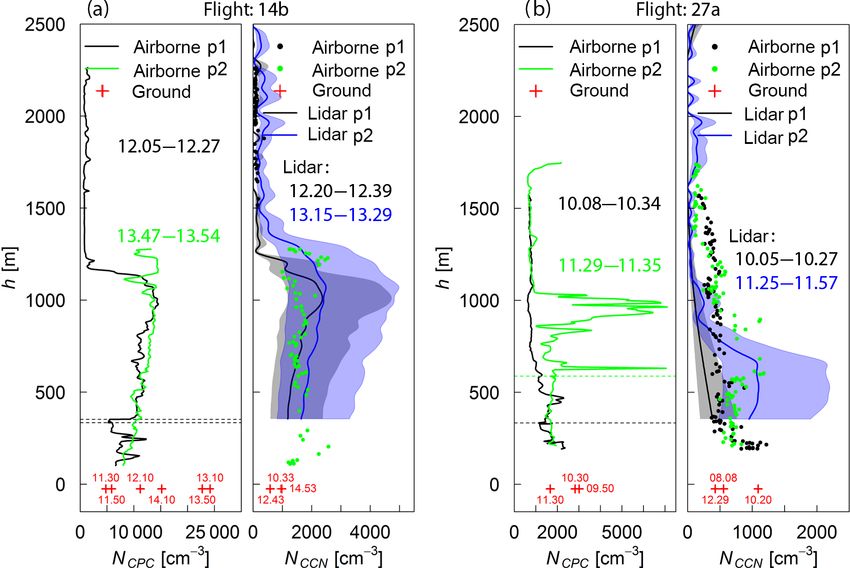
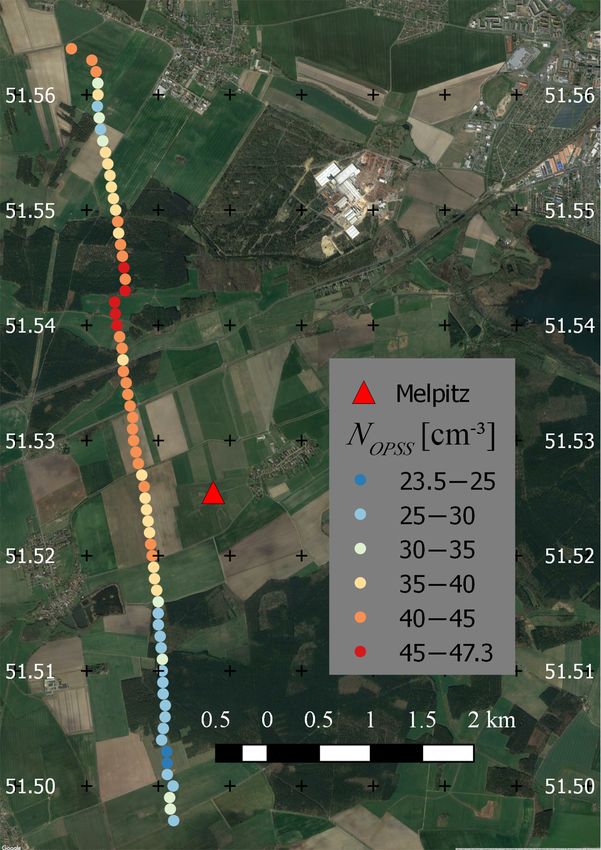
1268                                              S. Düsing et al.: Airborne in situ and remote sensing aerosol observations

situ measurements were performed on 7 days between 12 and
28 September 2013. Each flight lasted typically between 90
and 120 min (see Table 2). The measurement flights started
at the small airport of Beilrode approximately 11 km ton
the northeast of Melpitz (see Fig. 2). The flights were usu-
ally performed as follows: after the arrival in the measure-
ment area of Melpitz, a vertical profile up to an altitude of
2300 m aboveground was performed first to determine the
layer structure of the atmosphere. In a second step, legs of
up to 20 min with constant heights were carried out. In this
study, these parts are indicated as horizontal legs.
   ACTOS includes instruments to provide meteorological
parameters, including RH and temperature T with a time res-
olution of 100 Hz. ACTOS probes the atmosphere with a true
air speed of around 20 m s−1 . Real-time data allow the on-
board scientist to observe actual atmospheric conditions and
to adjust the flight pattern accordingly.                          Figure 2. Location of the measurement sites Melpitz and the airfield
   In addition to the meteorological sensors, also the PNC         in Beilrode. Map from https://www.google.com/maps.
and PNSD were determined on ACTOS (Wehner et al., 2010,
2015; Ditas et al., 2012). According to recommendations
given in Wiedensohler et al. (2012), the aerosol flow was          Furthermore, the measured PNC of ultrafine particles is influ-
dried, using a silca-based diffusion dryer to obtain a RH          enced by diffusional losses. Following Kulkarni et al. (2011)
below 40 %. A mobility and an optical particle size spec-          and Wiedensohler et al. (2012) these losses were corrected
trometer (MPSS and OPSS) were employed to determine the            using the method of the “equivalent pipe length”. A sec-
PNSD in the size range of 8 nm to 2.8 µm. In the further           ond CPC, identical to the CPC consisting in the MPSS, was
course of this work, PNSD connotes dry-state PNSD.                 installed to determine PNC (NCPC ) of the aerosol sampled
   A TROPOS-type MPSS measured the PNSD in the size                through the same inlet of the MPSS with a temporal resolu-
range from 8 to 226 nm (mobility diameter Dem ) with a time        tion of 1 Hz and a lower cutoff of ∼ 8 nm. This second CPC
resolution of 120 s. A Grimm OPSS (model 1.129 (skyOPC);           also allowed us to evaluate the quality of the PNSD measure-
Grimm Aerosol Technik, Ainring, Germany) was used to ob-           ments.
tain the PNSD in the size range from 356 nm to 2.8 µm (op-            Since the Grimm OPSS was not calibrated with spheri-
tical diameter Do ) with time resolution of 1 s. A full PNSD       cal polystyrene latex (PSL) particle size standards, it was not
was derived by combining each of the MPSS–PNSD with                possible to adjust the optical PNSD with a refractive index
the respective 120 s median OPSS–PNSD. This setup causes           typical for the atmospheric aerosol in Germany. Therefore,
uncertainties in integration-based aerosol properties, such as     the here used OPSS measurements deviate from the “real”
the total aerosol particle number concentration, because inte-     PNSD to some extent.
grals of the non-observed size range were approximated with           Furthermore, the polydisperse CCN-NC was determined
a trapezoid.                                                       with a mini cloud condensation nuclei counter (mCCNc, cus-
   The MPSS consists of (a) a bipolar diffusion charger            tom built by Gregory C. Roberts) also installed on ACTOS.
to bring the aerosol particle population into the bipolar          The CCN-NC derived with the mCCNc (NCCN,mCCNc ) was
charge equilibrium (Fuchs, 1963; Wiedensohler, 1988), (b)          measured at a supersaturation of 0.2 % (within an accuracy
a TROPOS-type DMA (Hauke-type, short) to select the                of 10 %; Henning et al., 2014).
aerosol particles with respect to their electrical mobility, and
(c) a condensation particle counter (CPC, model 3762A,             2.3   Ground-based remote sensing
TSI Inc., Shoreview, MN, USA) with a lower detection ef-
ficiency diameter of 8 nm and a counting efficiency of 10 %.       A 3 + 2 wavelength (three channels for backscatter and two
This setup was also used in Wehner et al. (2010) and Ditas         channels for extinction) polarization lidar system, called
et al. (2012). The measured raw PNSD of the MPSS was pro-          PollyXT and introduced by Engelmann et al. (2016), was used
cessed using the inversion algorithm of Pfeifer et al. (2014)      to evaluate vertical profiles of optical aerosol properties. In
by enhancing the inversion with the PNSD obtained with             particular, the particle backscatter coefficient σbsc was de-
the OPSS. The PNSD was also corrected with respect to              rived for 355, 532, and 1064 nm. Furthermore, PollyXT is
the sampling efficiency of the inlet according to Kulkarni         capable of deriving the σext for 355 and 532 nm. In this pa-
et al. (2011). With a sampling angle αs = 85◦ and a volume         per, aerosol particle optical properties derived with the lidar
flow of 3.7 L min−1 the inlet had a theoretical upper 50 % cut-    system are assigned with the subscript “lid”.
off aerodynamic diameter of approximately Dp, 50 = 2 µm.

Atmos. Chem. Phys., 18, 1263–1290, 2018                                              www.atmos-chem-phys.net/18/1263/2018/
S. Düsing et al.: Airborne in situ and remote sensing aerosol observations                                                    1269

   Briefly, the lidar system used here contains a Nd:YAG           the shorter average windows we consider 15 % as a max-
laser, which emits laser pulses at 20 Hz. The full overlap of      imum uncertainty as appropriate even though we are well
the laser beam and the receiver field of view (FOV) for this       aware that the uncertainty is usually lower.
system is at about 800 m height. Below this height, an over-          Besides the validation of the LR for the three wavelengths,
lap correction can be applied. The experimental determina-         we also considered a new method provided by Mamouri and
tion of the overlap height is described in Wandinger and Ans-      Ansmann (2016) to derive CCN-NC profiles from lidar mea-
mann (2002). Measurements of the lidar system were avail-          surements (NCCN,lid ). This method converts particle light ex-
able each 30 s with a vertical resolution of 7.5 m.                tinction coefficients to number concentration of CCN for dif-
   As the signal-to-noise ratio in the channels of the Raman       ferent supersaturations and different aerosol types. For con-
scattered light is too weak during daytime, no independent         tinental aerosol (subscript “c”),
particle light extinction profiles are available. Therefore, the
extinction-to-backscatter ratio, or LR (in sr), an aerosol-type-   nCCN, SS, c (z) = fSS, c × n50, c, dry (z),                  (6)
dependent intensive property, was used to convert σbsc to σext
                                                                   with
by
                                                                                               xc
σext = LR × σbsc .                                          (5)    n50, c, dry (z) = c60, c × σext (z) ,                        (7)

Several studies (e.g., Tao et al., 2008; Lu et al., 2011; Fer-     which has to be applied (Mamouri and Ansmann, 2016) in
rare et al., 2001; Müller et al., 2007; Haarig et al., 2016) in-   accordance to Shinozuka et al. (2015). Here, nCCN, ss, c as-
vestigated the LR for different atmospheric conditions and         signs the CCN-NC at given supersaturation SS and height z
aerosol types, like dust in Groß et al. (2011) and volcanic        in cm−3 . The PNC of particles with a diameter larger than
ash in Ansmann et al. (2010). The studies showed that the          100 nm is symbolized by n50, c, dry (50 nm radius). c60, c as-
LR is a highly variable parameter depending on the predom-         signs the conversion factor in cm−3 for the ambient aerosol
inant aerosol. In this study we used a height-constant LR of       particle light extinction coefficient (σext ) in Mm−1 . xc is the
55 sr to derive profiles of σext for 355 and 532. These fixed      aerosol extinction exponent.
LR are in agreement with the Raman measurements (direct               For the cases presented here, Mamouri and Ansmann
measurement of LR; Ansmann et al., 1992) during night at           (2016) provided a value of 1.0 for fss, c for a supersatura-
the respective period and location. Also the LR fit to long-       tion of 0.15 %. Therefore, retrieved concentrations of CCN
term observations of different aerosol types at other Euro-        may underestimate direct measured CCN concentrations of
pean continental sides and aerosol types (clean and polluted       the mCCNc on ACTOS. Furthermore, for xc they estimated
continental aerosol, mineral desert dust, and smoke, Baars         0.94 ± 0.03 for Germany and a lidar wavelength of 532 nm.
et al., 2016; Groß et al., 2013; Mattis et al., 2004; Müller       They also provided for c60, c a value of 25.3 ± 3.3. n50, c, dry
et al., 2007; Schwarz, 2016).                                      and consequently nCCN, ss, c can be retrieved with an uncer-
   A height-independent LR of 30 sr for 1064 nm provided           tainty of a factor of 2 (uncertainty of half or double of the
by Omar et al. (2009) was used in this study. This assump-         retrieved value; Mamouri and Ansmann, 2016).
tion might introduce errors in the retrieval of σext . Integrat-      CCN-NC profiles are obtained from particle extinction
ing the derived profiles of σext, lid yields the aerosol opti-     profiles. These are calculated in this study on the basis of
cal thickness (AOD), which was compared with ongoing               a height-constant LR from the particle backscattering coef-
AERONET (Aerosol Robotic Network; http://aeronet.gsfc.             ficients. This assumption cannot represent any possible lay-
nasa.gov/; station: Melpitz) sun-photometer measurements           ers with different aerosol types, as different aerosols differ in
at wavelengths of 340, 500, and 1020 nm. Both measure-             LR. The assumption of a constant LR would underestimate
ments agree well within the uncertainties, which were rel-         or overestimate the particle extinction coefficient compared
atively high due to the very low AOD (e.g., on 14 Septem-          to an aerosol with a higher or lower LR and thus also the
ber: 0.014±0.001 for 1020 nm, 0.087±0.004 for 500 nm and           CCN number concentration.
0.158 ± 0.004 for 340 nm between 11:50 and 12:20 UTC).
   Overall, we consider an uncertainty in the lidar measure-
                                                                   3     Methodology
ments of up to 15 %. Wandinger et al. (2016) provide an in-
tercomparison campaign of different EARLINET (European             In this chapter we will provide an overview of the dataset
Aerosol Research LIdar NETwork, https://www.earlinet.org/          used in this investigation and the model that is used to deter-
index.php?id=earlinet_homepage) instruments, including the         mine the aerosol particle optical properties.
lidar system used in this work (PollyXT ). All shown instru-
ments in Wandinger et al. (2016) had a relative deviation of       3.1    Case studies
maximum 10 to 20 % to a reference in both extinction and
backscattering. PollyXT (le02 in Wandinger et al., 2016) had       From the eight ACTOS flights of the intensive measuring
maximum deviation of less than 10 %. Taking into account           period (see Table 2), three were taken due to preferred
the uncertainty increase due to the assumed lidar ratio and        conditions and thus will be intensively discussed (flights:

www.atmos-chem-phys.net/18/1263/2018/                                                 Atmos. Chem. Phys., 18, 1263–1290, 2018
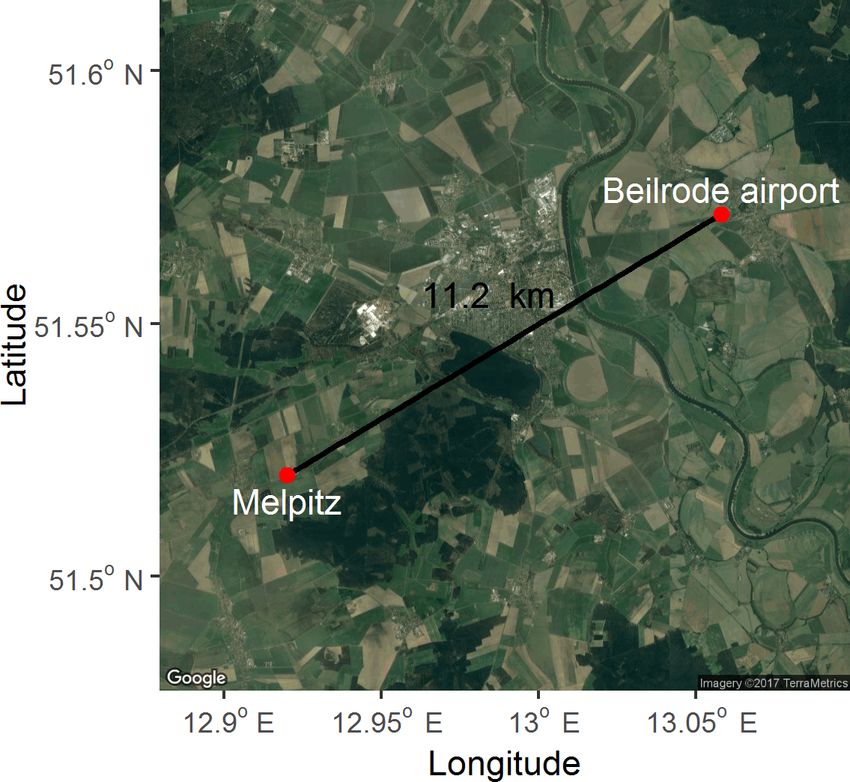
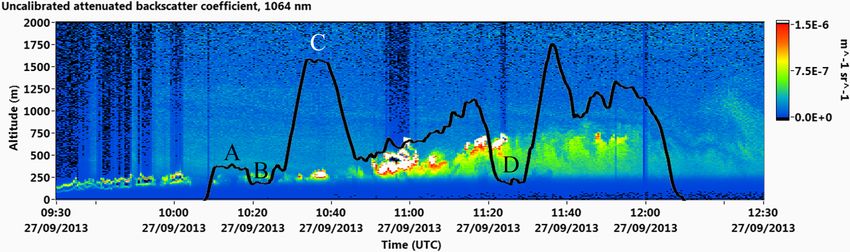
1270                                               S. Düsing et al.: Airborne in situ and remote sensing aerosol observations

Figure 3. Range-corrected backscatter signal for 1064 nm derived with PollyXT on 14 September. The more reddish, the larger is the
backscatter signal. The black lines represent the flight patterns of flights 14a and b. White colors indicate very high backscattering.

Figure 4. Range-corrected backscatter signal for 1064 nm derived with PollyXT on 27 September. The more reddish, the larger is the
backscatter signal. The black lines represent the flight patterns of flight 27a. White colors indicate very high backscattering.

20130914a, 20130914b, 20130927a, in the following abbre-              a sharp gradient of the backscatter signal (Fig. 3). The de-
viated as 14a, 14b, 27a). The major preferential condition            velopment of the mixing layer is visible in the lidar mea-
was clear skies in all altitudes levels in order to prevent the       surements from 09:00 UTC and it reached a height of about
influence of the clouds on AOD measurements of the sun                1600 m at 14:00 UTC.
photometer and to ensure that the lidar covers the entire at-            During the measurement flights, Melpitz was dominated
mospheric column.                                                     by marine air masses influenced by continental pollution. For
   Figures 3 and 4 show the time–elevation plot of the range-         example, for 14 and 27 September 2013, three 72 h back-
corrected attenuated backscatter signal of the lidar system.          ward trajectories for the height of 500 (red lines), 1000 (blue
White areas in the figures represent high backscattering,             lines), and 1500 m (green lines) aboveground are shown in
mostly by clouds. Blue or black areas represent low light             Figs. 5 and 6. These trajectories where calculated using
backscattering and thus regions of very clean air. Red and            the Hybrid Single-Particle Lagrangian Integrated Trajectory
yellowish colors indicate enhanced light backscattering by            (HYSPLIT) model of the Air Resource Laboratory (ARL)
aerosol particles. The overlaying solid black line indicates          of the National Oceanic and Atmospheric Administration
the height of ACTOS during a measurement flight. Capital              (NOAA). HYSPLIT is available at http://www.ready.noaa.
letters mark horizontal parts of the flight investigated later in     gov. A detailed description of the model is available in Stein
this study.                                                           et al. (2015).
   In particular, during the flights on 14 September 2013,               On 14 September 2013, a westerly flow in all heights
episodes of a cloud-free air column above the lidar were              was apparent. The air masses crossed the North Sea before
apparent (before leg D on flight 14a, between 10:15 and               traveling across the continent to Melpitz. Furthermore, on
12:30 UTC, during leg D on flight 14b). Cloud-free periods            27 September 2013, the air masses subsided during the last
did occur during flight 27a (clouds visible around 10:35, and         36 h crossing the Baltic Sea. The three air parcels reaching
from 10:50 to 11:30). Furthermore, on 14 September 2013,              Melpitz in 500, 1000, and 1500 m originated from Scandi-
a residual layer is visible between 08:00 and 10:00 UTC               navia and proceeded southwards. In contrast to 14 Septem-
reaching a height of up to 1800 m. Its thickness decreased            ber 2013, the air parcel with the lowest height in the be-
during daytime and the residual layer vanished at around              ginning (green line) in roughly 1500 m aboveground and
12:00 UTC. At the same time, a well-pronounced mixing                 reached Melpitz at a higher altitude (1500 m) than the air par-
layer was built up. Its upper boundary is characterized by

Atmos. Chem. Phys., 18, 1263–1290, 2018                                                 www.atmos-chem-phys.net/18/1263/2018/
S. Düsing et al.: Airborne in situ and remote sensing aerosol observations                                                   1271

Figure 5. Three 72 h backward trajectories for 500 (red), 1000     Figure 6. Three 72 h backward trajectories for 500 (red), 1000
(blue), and 1500 m (green) aboveground for Melpitz, ending at      (blue), and 1500 m (green) aboveground for Melpitz, ending at
14 September, 12:00 UTC.                                           27 September, 12:00 UTC.

cel marked by the red and blue, originating from a height of
roughly 3000 m.                                                    cially when the core of light-absorbing carbon is small com-
                                                                   pared to the shell. In contrast, for particle light scattering
3.2   Airborne in situ aerosol optical properties                  they did not observe a significant difference between both
                                                                   approaches. Kahnert et al. (2012) showed that the core–shell
In this study, the calculation of aerosol optical properties was   model underestimates the particle light absorption but repro-
performed on the basis of Bohren and Huffman (1983). The           duces the particle light extinction sufficient. In conclusion,
complex refractive index, the hygroscopicity, and the mixing       the mixing approach used in this study is applicable for mod-
of the aerosol particles are needed to compare calculated op-      eling aerosol particle light extinction.
tical properties with measured ones. A scheme of our method           This discussion in the previous paragraph implies, al-
is shown in Fig. 7. The method and its application are de-         though the particle light absorption is overestimated, that the
scribed in the following.                                          core–shell mixing assumption is satisfying for the aerosol ap-
   The mixing state can be assumed by different mix-               parent in Melpitz. That means that in this work it is assumed
ing approaches. The dry-state optical closure study by Ma          that the aerosol particles consist of a core of water-insoluble
et al. (2014) shows that the approach of internally mixed          highly absorbing soot (eBC) and a shell of non-refractory
coated (aerosol particles consists of a core surrounded by         less-absorbing material, which includes organic matter, am-
a shell; core–shell approach) aerosol particles results in the     monia nitrate, and sulfate species.
best agreement between modeled and measured hemispheric               The Mie code (based on Mie theory; Mie, 1908) calcu-
backscatter coefficients for Melpitz. Furthermore, Zhang and       lates the scatter, extinction, absorption, and backscatter ef-
Thompson (2014) and Kahnert et al. (2012) discussed the            ficiency of a single, spherically symmetric aerosol particle
mixing morphology and its influence on particle light ab-          with a given complex refractive index of its shell and core
sorption and scattering. Zhang and Thompson found that the         and a given diameter of the core and thickness of the shell.
core–shell mixing assumption leads to higher modeled parti-           The goal of this study is to investigate the aerosol parti-
cle absorption than the approach of internally homogeneous         cle light extinction (σext ) and backscatter coefficient (σbsc )
mixed particles (24 % difference, 115 % in maximum), espe-         in ambient state. σbsc can be calculated with Eq. (6) and

www.atmos-chem-phys.net/18/1263/2018/                                               Atmos. Chem. Phys., 18, 1263–1290, 2018
1272 S. Düsing et al.: Airborne in situ and remote sensing aerosol observations
Figure 7. Flowchart of the algorithm to convert airborne in situ measurements to aerosol particle optical properties in ambient state.
σext with Eq. (7) (adapted and modified from Virkkula et al., Table 3. Real (nre ) and imaginary part (nim ) of the complex re-
2011): fractive index (n) of the aerosol components used for the volume-
weighted mixing in the algorithm to derive n of the core and the
shell of the aerosol particles. Also the SD (σ ) of each part of n is
π Dp2 dN (Dp )
Z
1 given in which the algorithm varies the n of each compound to pro-
σbsc (λ) = Qbsc (λ, Dp , n) dDp , (8)
4π 4 d log Dp vide a possible range of values for σext and σbsc . The values in this
Z
π Dp2 dN (Dp ) table where taken out of Ma et al. (2014).
σext (λ) = Qext (λ, Dp , n) dDp . (9)
4 d log Dp Component nre σ (nre ) nim σ (nim )
Hereby Qbsc (λ, Dp , n) and Qext (λ, Dp , n) are the backscat- Soluble 1.53 0.5 % 1 × 10⁻⁶ –
eBC 1.75 4% 0.55 6.6 %
ter and extinction efficiency, respectively, of aerosol parti-
Water 1.33 0.5 % 0 –
cles with a diameter Dp and a complex refractive index n
at a wavelength λ (Virkkula et al., 2011). The equation to
derive the particle light scattering efficiency for coated par-
ticles is provided by Bohren and Huffman (1983) and Dom- Here, we assumed that in the dry state each aerosol particle
brovsky (2011). [dN (Dp )]/[d log Dp ] denotes the PNSD of consists of the same constant volume fraction of each compo-
the aerosol and can be measured by particle size spectrome- nent, because no size-resolved particle chemical composition
ters (see Sect. 2.2 and 2.3.2). measurements with a high time resolution were available.
Aerosol particles in humid ambient conditions are under- Petters and Kreidenweis (2007) provided a semi-empirical
lying a growth due to water vapor uptake. The magnitude parameterization for the diameter of a particle with a given
of growth depends on particle size, hygroscopicity parame- hygroscopicity in ambient conditions as a function of RH and
ter κ, and ambient RH. Hygroscopic growth changes size, T . Using this parameterization allows us to derive the PNSD
shape, and the complex refractive index of aerosol particles. in ambient state.
The change of shape is not considered in this study because The difference in the volume of the aerosol particles in
the particles are assumed to be spherical in dry state anyway. ambient and dry state is the total volume of the water Vwat =
Measurements of the aerosol particle chemical composi- Vaer, ambient − Vaer, dry accumulated on the aerosol particles
tion (see Sect. 2.2.2) provided volume fractions of aerosol (green rectangle in the scheme). A detailed description of the
particle compounds such as organic and black carbon, am- Köhler theory is given in Köhler (1936).
monium nitrate, and ammonium sulfate. A volume-weighted The complex refractive index of the particle core (eBC)
sum of κ of the aerosol particle compounds provided a mean is known. In dry state, the shell consists of different non-
κ of the entire aerosol particle. Measurements of cloud con- refractory compounds (subscript “s”), which are assumed to
densation nuclei may also provide κ as described in Henning have the same complex refractive index (see Table 3). In am-
et al. (2014) and Sect. 2.2.3 (see Fig. 7, rhombus with ques- bient state the aerosol particle shell is made up of the non-
tion marks). refractory material and the water (subscript “w”) itself. The
Atmos. Chem. Phys., 18, 1263–1290, 2018 www.atmos-chem-phys.net/18/1263/2018/S. Düsing et al.: Airborne in situ and remote sensing aerosol observations 1273
algorithm used here applied a volume-weighted sum to de- 4 Results
rive the complex refractive index n = nre −inim of the aerosol
particle shell in the ambient state: In this section ground-based measurements will be related
to vertical profiles to investigate the representativeness of in
nshell, amb = fv, s nre, s + i nim, s situ measurements on the ground for the PBL. Furthermore,
+ fv, w nre, w + i nim, w , (10) the results of the in situ based calculations and measurements
from the lidar will be shown and compared.
where fv, s is the volume fraction of the non-refractory com-
pounds in the shell and fv, w the volume fraction of the water. 4.1 Representativeness of ground in situ measurements
nre, s , nre, w are the real part of the complex refractive index for the PBL
of the non-refractory material and the water, respectively, and
nim, s and nim, s denote the imaginary part of the refractive in-
In this section we compare the PNSD, the aerosol PNC and
dex of the soluble material and the water, respectively. The
the CCN-NC measured on the ground and aboveground with
complex refractive index of water and the non-refractory ma-
ACTOS.
terial is shown in Table 3.
Furthermore, the diameter of the light-absorbing eBC core
for each aerosol particle has to be taken into account for the 4.1.1 Particle number size distribution
calculation of the aerosol optical properties. With the volume
fraction of the eBC (fv, eBC ) derived from the chemical com- The scans of PNSD in legs A, D, E, and F of flight 14b
position measurements (see Sect. 2.2.2), the diameter of the were performed within the mixing layer (see Fig. 3), while
eBC core (DeBC ) of each aerosol particle with a diameter of the scans of legs B and C were done above the mixing layer.
Dp can be calculated according to Ma et al. (2014): A comparison of PNSDs measured during legs C and B with
ground-based measurements is thus not useful. We focus
1/3 therefore on the PNSD of legs A, D, E, and F.
DeBC Dp , fv, eBC = Dp fv, eBC . (11)
The averaged PNSDs at standard conditions of legs A, D,
A Monte Carlo simulation, also used in Ma et al. (2014), is E, and F are shown in Fig. 8 (solid lines). The corresponding
implemented in the here provided method to cover a possible PNSD measured at Melpitz observatory is shown as dashed
range of results of σext and σbsc introduced by measurement line with the respective color in each figure. Since there was
uncertainties in the input parameters and due to their spa- no scan of ground-based PNSD available during legs D and
tiotemporal variability. A calculation of σext and σbsc grounds E, the average of the PNSD one scan before and after the re-
on a PNSD of the aerosol. The Monte Carlo simulation re- spective leg was taken for these legs. For the selected case,
peats the calculation of σext and σbsc 50 times, varying the the ground-based PNSD agrees with the PNSD of legs A,
input parameters within the respective uncertainties and SDs E, and F in the size range of 30 to 100 nm within 10 %. For
of mean uniformly distributed. aerosol particles smaller than 30 nm, the difference between
For the considered period (e.g., length of a horizontal leg) the curves increases, but the shape of both number size dis-
the mean and the respective standard deviation (SD) was cal- tributions is similar. In the size range of the accumulation
culated from the measurements of the PNSD and the preva- mode (100 to 500 nm) the mean airborne PNSD of legs E
lent ambient RH and T . The aerosol hygroscopicity was and F was up to 2 times larger than the PNSD observed on
derived by averaging the volume fractions of each consid- the ground at the same time. This clearly corresponds with
ered species on the basis of the Q-ACSM and MAAP mea- the integrated aerosol PNC recorded with the OPSS (NOPSS )
surements determined between 08:00 and 15:30 UTC, which on ACTOS (see Fig. 9), where the total PNC derived with
cover the range of the flight times. The complex refractive the CPC (NCPC ) increases with height. During the first pro-
index of the aerosol particles was calculated according to the file of flight 14b NOPSS increases with increasing height up
mixing rule introduced by Eq. (10), where each complex re- to ∼ 650 m (18 to ∼ 45 cm−3 ). The measurements in leg D
fractive index of the considered aerosol component (water, were performed at the top of the planetary boundary layer
water soluble and insoluble) was varied within its uncertain- and therefore probably may have been influenced by mixing
ties given in Table 3. By calculating the average of the output processes of clean air of the free troposphere and the more
of the 50 simulations the algorithm provides the average op- polluted air within the PBL. This explains the different shape
tical properties for the aerosol particles in their ambient state and concentration of the PNSD of leg D in comparison to the
as well as the uncertainty range due to the variability of the ground-based measurements.
input parameters. A larger number of simulations does not Differences in the airborne and ground-based PNSD may
change the SD of the output. also occur due to horizontal inhomogeneity. For example,
In the following, the aerosol optical properties calculated Fig. 9 shows the mean NOPSS measured within a layer be-
with this algorithm on the basis of in situ measurements are tween 950 and 1050 m height between 13:06 and 13:34 UTC
assigned with the subscript “mie”. on 14 September (measurements during legs D and F). The
www.atmos-chem-phys.net/18/1263/2018/ Atmos. Chem. Phys., 18, 1263–1290, 20181274 S. Düsing et al.: Airborne in situ and remote sensing aerosol observations
Figure 8. Airborne (solid lines) mean PNSD of flight 14b at standard conditions recorded during legs A (black), D (red), E (green), and
F (blue) with the corresponding PNSD measured at Melpitz (dashed lines). Error bars and shaded areas represent the TROPOS standard
uncertainty of TROPOS-built MPSS systems of 10 %.
red triangle symbolize the measurement site in Melpitz. The each panel) measured at the Melpitz observatory are shown
more reddish the color is, the larger the PNC. (red crosses). Furthermore, CCN-NC profiles are shown de-
During legs D and F of flight 14b, the horizontal distance rived on the basis of the approach of Mamouri and Ans-
between ACTOS and Melpitz was between 500 and 4700 m. mann (2016) (solid lines in left panels, shaded area marks
Within this distance the aerosol PNC, PNSD, and chemical the uncertainty). The first profile of flight 14a (black) was
composition may differ in the observed altitude. During the measured between 12:05 and 12:27 UTC. The second (blue)
leg from south to north, the PNC varied by a factor of 2, was measured between 13:47 and 13:54 UTC. The respec-
probably due to local influences on the transported pollution. tive measurements of the integrated PNC were sampled at
This example demonstrates the horizontal variation of num- 11:30, 11:50, and 12:10 UTC. For the second profile, the re-
ber concentration and potential deviation between ground- spective PNC at Melpitz observatory was measured at 13:10,
based and vertical measurements due to the horizontal dis- 13:50, and 14:10 UTC and the CCN-NC at 10:33, 12:43, and
tance. 14:53 UTC. The first profile of flight 27a (black) was taken
In conclusion, for aerosol particles larger than 30 nm we at the beginning of the measurement flight (between 10:24
can state for the case presented here that ground-based mea- and 10:34 UTC) whereas the second profile (blue) was con-
surements of the PNSD are representative of higher atmo- ducted in the fully developed mixing layer between 11:29
spheric layers within the PBL. For smaller particles, local and 11:36 UTC (see Fig. 4; ascending part after leg D of the
events alter the PNSD and cannot be detected by ground- flight 27a).
based measurements. The agreement is best for measure- The first profile of flight 14a (Fig. 10a, black) shows an
ments of the PNSD in the lowest available altitude. Ground- inversion at 1150 m altitude where NCPC decreased from
based measurements are not representative of the observa- 13 000 to around 1000 cm−3 (top of PBL). The layer below
tions near the top of the PBL. Here, entrainment and mixing 350 m altitude (part of the flight from Beilrode to Melpitz)
processes affect the aerosol. shows a 2 times smaller concentration than the layer above.
Since the first part of the profile was performed on the way
4.1.2 Aerosol particle total number and cloud to Melpitz, a horizontal variability of the aerosol might be
condensation nuclei concentration the reason for this behavior. The two distinct peaks (up to
12 000 cm−3 ) in the lower part of the NCPC profile are prob-
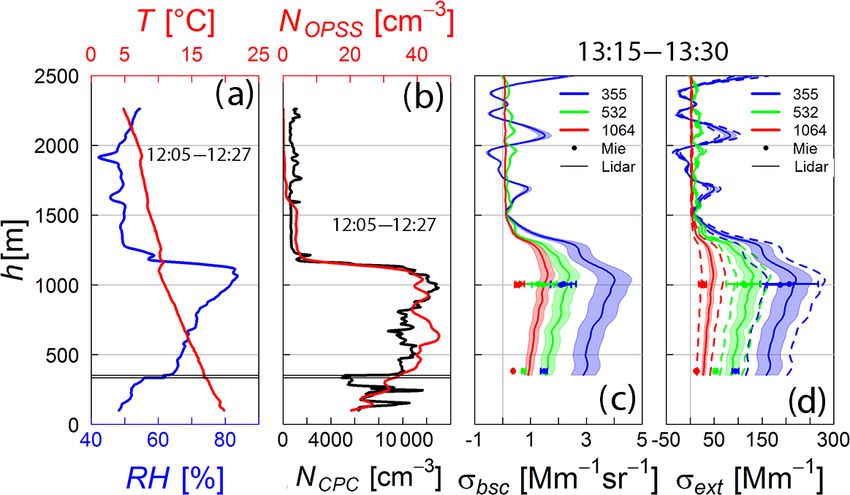
Figure 10a and b each show two different profiles (black and ably caused by exhaust gases of the helicopter because an in-
blue) of the PNC measured with the CPC on ACTOS (NCPC , creased CO2 concentration was measured at the same time.
left in each panel) and the CCN-NC (NCCN , right in each Above the lower part, the atmosphere is well mixed between
panel) recorded with the mCCNc on ACTOS for flights 14b 350 and 1150 m altitude with a stable NCPC in the range from
(panel a) and 27a (panel b). Additionally, the integrated PNC 10 000 to 12 000 cm−3 and slightly larger PNC below the
(left of each panel) of the PNSD and the CCN-NC (right of
Atmos. Chem. Phys., 18, 1263–1290, 2018 www.atmos-chem-phys.net/18/1263/2018/S. Düsing et al.: Airborne in situ and remote sensing aerosol observations 1275
2474 cm−3 with an average of 1456 ± 301 cm−3 . The second
profile was taken between two ground-based measurements
(12:43 and 14:53 UTC). At both times the ground-based
measurements in Melpitz resulted in smaller CCN-NC (600
and 976 cm−3 ) than in higher altitudes. In contrast, the low-
ermost measurements of the mCCNc (1279±91 cm−3 within
100 and 130 m altitude) on ACTOS (considered as measure-
ment on the ground) in Beilrode do represent the measure-
ments during the last profile of flight 14b. Spatial variabil-
ity may explains that the ground-based CCN-NC measure-
ments in Melpitz are not representative of collocated vertical
profiles. In contrast, the lowermost CCN-NC measurements
(∼ 700 cm−3 ) derived with the mCCNc on ACTOS are rep-
resentative of the higher atmospheric layers.
In the first profile of flight 27a (black) the top of the mix-
ing layer is around 250 m altitude marked by a sharp de-
crease in both NCPC and NCCN,mCCNc . In the second pro-
file (blue) three distinct layers are apparent. Up to a height
of around 600 m NCPC and NCCN,mCCNc are almost constant
at around 2000 and 600 cm−3 , respectively. Between 600
and 1050 m altitude an atmospheric layer was apparent with
aerosol highly variable in NCCN,mCCNc and NCPC . Compared
to the layer below NCPC is up to 6 times and NCCN,mCCNc
up to 2 times larger. Above that NCPC is constant at around
1000 cm−3 with a sharp increase in the highest 50 m of the
Figure 9. Horizontal distribution of the mean PNC (NOPSS ) for
particles with an optical diameter of 356 nm to 2.8 µm within profile. Note that NCPC in the highest layers shows the same
layer of 950 to 1050 m aboveground recorded between 13:06 and values as in the first profile in this height. In the layer above
13:34 UTC on 14 September (legs D and F of flight 14b). The more 1050 m NCCN,mCCNc shows a slight decrease from around
reddish the symbol the higher is the concentration. The red triangle 500 to 100 cm−3 .
represents the measurement site in Melpitz. For both profiles, the ground-based measurements (Mel-
pitz) of both the PNC and the CCN-NC agree with the air-
borne measurements within the mixing layer (except in the
inversion. The NCPC recorded during the second profile of second profile for heights between ∼ 500 and ∼ 1000 m).
flight 14b (blue) increases slightly with height. The second During the first profile the mixing layer height was very
profile of flight 14b was completely located within the PBL low (250 m) and therefore only a small part of the profile
since no sharp decrease of NCPC with height was observed. was situated within the mixing layer. However, extrapolating
Aerosol measurements at the observatory in Melpitz the measured values of NCPC and NCCN,mCCNc in the low-
showed an event of high PNC between 12:00 and 14:00 UTC. est available altitude to the ground leads to a good agreement
The elevated PNC is probably caused by a transported plume with the respective ground-based measurements at Melpitz at
since the SO2 concentration increased by a factor of 10 at the 09:50 and 10:30 UTC for the PNC and 10:20 UTC for CCN-
same time (see Fig. 11). This advected plume was obviously NC, respectively.
not lifted into higher atmospheric layers. Thus, the ground- In the second profile of NCPC and NCCN,mCCNc (each blue)
based measurements are decoupled from those in higher alti- two distinct layers in a height of around 600 m and between
tudes and are therefore not representative of the PBL in this 800 and 1100 m altitude were observed. These layers are
case. characterized by an up to 6 times higher PNC and up to 2
In contrast to the ground-based measurements in Melpitz times higher CCN-NC than below. The lower layer is located
and excluding the case when the exhaust gases influenced the within the PBL at its top, whereas the upper layer is located
airborne measurements, the measurements of the CPC at the within the residual layer above the PBL. The higher PNC was
surface in Beilrode were representative of the atmospheric caused by a new particle formation event within the resid-
layers above, since the PNC is as high as in higher atmo- ual layer, which also was observed by Wehner et al. (2010).
spheric layers. These new particle formation events can also lead to higher
Airborne measurements of NCCN during the first profile PNC via mixing and entrainment processes at the top of
of flight 14b (black dots) started above the top of the mix- the PBL, which was present at around 600 m altitude (see
ing layer and are therefore not of further interest. In the sec- Fig. 10b left panel sharp decrease in NCCN,mCCNc derived
ond profile (blue dots) NCCN,mCCNc varies between 886 and with the lidar). Below, within the well mixed PBL, the in
www.atmos-chem-phys.net/18/1263/2018/ Atmos. Chem. Phys., 18, 1263–1290, 2018You can also read