AUSSEN WIRTSCHAFT BRANCHENREPORT PHILIPPINEN
←
→
Page content transcription
If your browser does not render page correctly, please read the page content below

AUSSEN
WIRTSCHAFT
BRANCHENREPORT
PHILIPPINEN
FOOD & BEVERAGE

FOOD & BEVERAGE INDUSTRIES IN THE PHILIPPINES
AUSTRIAN-PHILIPPINE TRADE
IMPORTANT SECTORS OF THE FOOD PRODUCTION/PROCESSING INDUSTRY
MARKET ENTRY AND MARKET TRENDS
MARKET OPPORTUNITIES FOR AUSTRIAN COMPANIES
RESOURCES, CONTACTS, FAIRS

AUSSENWIRTSCHAFTSCENTER MANILA
MÄRZ 2021

2

 Unser vollständiges Angebot zum Thema Nahrungsmittel und Softdrinks (Veranstaltungen, Publikationen,
 Schlagzeilen etc.) finden Sie unter www.wko.at/service/aussenwirtschaft/Nahrungsmittel-Softdrinks.html,
 zu Wein, Bier und Spirituosen unter www.wko.at/service/aussenwirtschaft/wein-bier-spirituosen.html .

                                            Eine Information des

                                     AußenwirtschaftsCenters Manila
                                           T +63 2 8818 1581
                                           F +63 2 8810 3713
                                           E manila@wko.at
                                      W wko.at/aussenwirtschaft/ph

                                            fb.com/aussenwirtschaft
                                              twitter.com/wko_aw
                               linkedIn.com/company/aussenwirtschaft-austria
                                         youtube.com/aussenwirtschaft
                                      flickr.com/aussenwirtschaftaustria
                                          www.austria-ist-ueberall.at

Dieser Branchenreport wurde im Rahmen der Internationalisierungsoffensive go-international, einer
Förderinitiative des Bundesministeriums für Digitalisierung und Wirtschaftsstandort und der Wirt-
schaftskammer Österreich erstellt.

Das Werk ist urheberrechtlich geschützt. Alle Rechte, insbesondere die Rechte der Verbreitung, der Verviel-
   fältigung, der Übersetzung, des Nachdrucks und die Wiedergabe auf fotomechanischem oder ähnlichem
Wege durch Fotokopie, Mikrofilm oder andere elektronische Verfahren sowie der Speicherung in Datenverar-
beitungsanlagen bleiben, auch bei nur auszugsweiser Verwertung, der Wirtschaftskammer Österreich – AUS-
 SENWIRTSCHAFT AUSTRIA vorbehalten. Die Wiedergabe mit Quellenangabe ist vorbehaltlich anders lauten-
                                        der Bestimmungen gestattet.
Es wird darauf hingewiesen, dass alle Angaben trotz sorgfältiger Bearbeitung ohne Gewähr erfolgen und eine
       Haftung der Wirtschaftskammer Österreich – AUSSENWIRTSCHAFT AUSTRIA ausgeschlossen ist.
       Darüber hinaus ist jede gewerbliche Nutzung dieses Werkes der Wirtschaftskammer Österreich –
                                 AUSSENWIRTSCHAFT AUSTRIA vorbehalten.

                                  © AUSSENWIRTSCHAFT AUSTRIA DER WKÖ
                                  Offenlegung nach § 25 Mediengesetz i.d.g.F.

                            Herausgeber, Medieninhaber (Verleger) und Hersteller:
                     WIRTSCHAFTSKAMMER ÖSTERREICH / AUSSENWIRTSCHAFT AUSTRIA
                                    Wiedner Hauptstraße 63, 1045 Wien
                     Redaktion: AUSSENWIRTSCHAFTSCENTER MANILA, T +63 2 8818 1581
                               E manila@wko.at, W wko.at/aussenwirtschaft/ph

                                  Ein Service der AUSSENWIRTSCHAFT AUSTRIA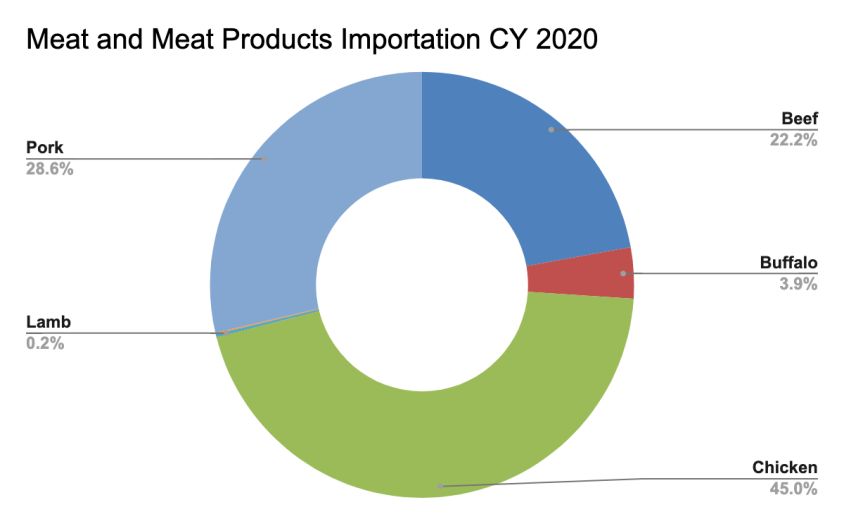
3

3.1   Key Figures on Country and Population .............................................................................................7
3.2   Average Household Expenditure on Food and Beverage.................................................................11
3.3   Food & Beverage Sales in Wholesale and Retail .............................................................................12
3.4   Import and Export of Food &Beverage .............................................................................................13

4.1   Imports from Austria .........................................................................................................................15
4.2   Exports to Austria ..............................................................................................................................16

5.1   Structure of Agricultural Land ..........................................................................................................17
5.2   Structure of the Food and Beverage Processing Industry ..............................................................21
5.3   Meat Processing Industry ..................................................................................................................21
5.4   Milk and Milk Processing Industry ....................................................................................................25
5.5   Grain, Bread and Bakery Industry .....................................................................................................26
5.6   Fruit and Vegetable Industry .............................................................................................................28
5.7   Beverage Industry ..............................................................................................................................29
5.8   Sales Channels ...................................................................................................................................31
5.9   Retail Chains and Current Development Trends .............................................................................31

6.1   Market Development..........................................................................................................................34
6.2   Market Entry .......................................................................................................................................34
6.3   General Guidelines for the registration of food products ................................................................35
6.4   Terms of Delivery and Payment ........................................................................................................37
6.5   Customs and Foreign Trade Regulations .........................................................................................38

7.1   Deliveries of Food and Beverage.......................................................................................................39
7.2   Technology Cluster Smart Factory ...................................................................................................39

8.1   Further Information and Links ..........................................................................................................46
8.2   List of Annual Fairs for Food & Beverages in the Philippines .........................................................49

                                     Ein Service der AUSSENWIRTSCHAFT AUSTRIA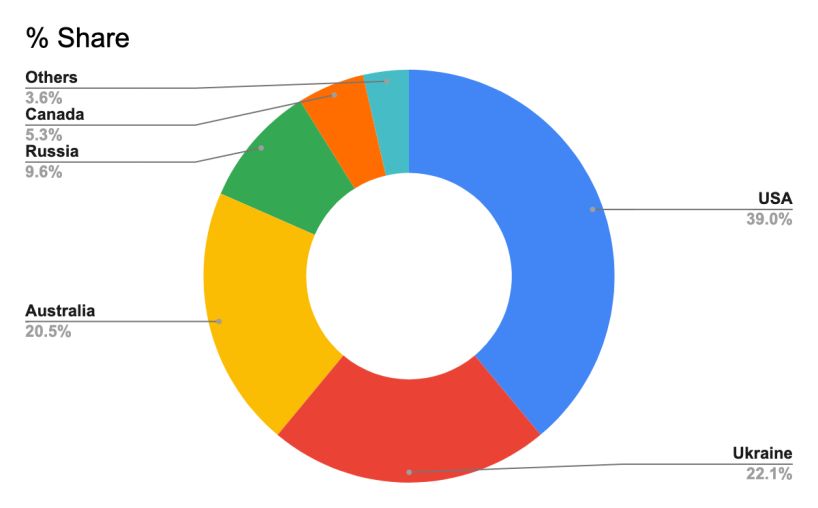
4

     INTRODUCTION

The Philippines is one of the fastest growing consumer-driven economies in the world. With a population of
about 110 million and a young demographic divide, the country exhibits continuous growth in retail, food ser-
vices and food manufacturing industries. Together with a growing young population and its increased spend-
ing capabilities also the positive perception for foreign products are drivers in this development. Due to the
low supply from within the country itself of products such as meat, dairy, bakery confectionery, food pro-
cessing ingredients and food processing machineries, the Philippines relies to a substantial part on imports.
It is, therefore, an interesting market for exporting companies from Austria.

Over the past years, we have seen Austrian products gaining market shares in the local market. The energy
drink Red Bull has been consistently the number one energy drink in the country in spite of the presence of
many other imported and locally manufactured energy drinks. Red Bull was able to position its product to
cater to the middle- and upper-class bracket of Filipino consumers. Aside from being an energy drink con-
nected to extreme sports, it became popular as a party drink mixer for cocktails which are attractive for the
young and vibrant millennial consumers. As in other countries around the world, the success of Red Bull
was the result of continuous active marketing strategies and promotion of the brand.

Other successful Austrian products which boast a strong presence in the country are the Happy Day fruit
juices and Nativa green teas from Rauch and juices from Hermann Pfanner. Consumers can now find Rauch
and Pfanner juices on the shelves of all the supermarkets, convenience and grocery stores all over the coun-
try. through product promotions and presence at various events, Rauch and Pfanner were able to tame the
sweet taste of Filipinos for juices and to embrace the healthy attributes of these brands.

Adolf Darbo AG is another success story in the Philippines with their D’Arbo honey, jams and marmelades.
Due to the availability of D’Arbo products in different packaging sizes and volumes, it caters not only to the
retail consumers but also to hotels, restaurants and confectionery product manufacturers. So, for example,
the small, portioned items are served at all Starbucks outlets in the country and in many other hotels, cof-
fee-shops and restaurants. Darbo also delivers its products in big tubs to business clients such as cake
shops and confectionery manufacturers.

Since food manufacturing is one of the key drivers in the food and beverage industry, Laska machineries is
another Austrian company which is gaining a foothold in this sector.

But Austria is also present on the savory side of taste in the Philippines. In 2016, our country received an ac-
creditation for six meat establishments to export frozen pork, beef and processed meat products to the Phil-
ippines. Although Austria is not yet among the top-exporters of meat products, the export volume from Aus-
tria is poised to continuously increase over the years to come.

In the second semester of 2019, the Philippine hog industry was hit by African Swine Fever (ASF). While the
demand for meat products particularly pork and chicken is continuously going up in spite of the COVID-19
pandemic, the slow recovery from ASF resulted in dwindling supply. In view of this, the Philippine govern-
ment took initiatives to make sure that the demand is met through importation. This April 2021, President
Rodrigo Duterte issued Executive Order 128 which temporarily lowers the tariff on importation of pork and
chicken and at the same time increased the Minimum Access Volume (MAV) for the importation of said prod-
ucts.

At the moment of writing this report, the meat producing and processing industry of Austria is scheduled to
be audited by the Philippine Department of Agriculture Inspection Mission as soon as post-pandemic travels
are possible again. This Inspection Mission is set for the renewal of the current accreditation and at the
same time constitutes an application for a system-wide accreditation of the Austrian meat industry.

                                  Ein Service der AUSSENWIRTSCHAFT AUSTRIA
5
Apart from the abovementioned industry trends, the COVID-19 pandemic substantially changed many as-
pects of the food & beverage sector in the Philippines: Since families must stay at home, home cooking and
take-out deliveries became prevalent. E-Commerce moved on a faster pace as consumers shifted to on-line
shopping and on-line food deliveries. Bigger companies made a quick adaptation and created their own on-
line platforms while many others offered their products on existing platforms like Lazada and Shopee.
COVID-19 put an immense focus on healthy nutrition. Consequently, the demand for healthier food and bev-
erage products increased. Functional food and organic products have become prominent “allies” for Philip-
pine consumers in their quest to survive the current pandemic.
Ein Service der AUSSENWIRTSCHAFT AUSTRIA6
EXECUTIVE SUMMARY
This industry report aims to provide an overview of the Philippines’ food and beverage industry as well as
identify possible business opportunities for Austrian suppliers. The report contains current statistics on the
key sectors of the Philippine food industry and insights on the import-export process in the Philippines.
The Food and Beverage industry is one of the largest sub-sectors of the Philippine manufacturing sector,
contributing about 23-24% of the country’s GDP, and is one of the biggest food producers in Asia with its food
processing sector valuing at over EUR 24 billion. Retail sales from processed foods in the country have also
grown throughout the years and are estimated to amount to USD 12.3 billion in 2019 posting a growth rate of
28.7% since 2015. Food retail in the country has also expanded with the increase of different modern retail
formats such as supermarkets, hypermarkets, mini marts, and convenience stores not only in the urban ar-
eas but also increasingly in rural areas.
In terms of agricultural products, the Philippines main exports are edible fruit and nuts, and peel of citrus
fruits or melons which amounted to USD 2.63 billion or 39.4% of the total agricultural exports while the top
commodity for import is cereals posting a 21.8% (USD 3.174 million) share of the total agricultural imports in
2019. The country is a net importer of meat, wheat, and dairy due to the limited local production for the said
commodities.
While the CoVID-19 pandemic has indeed affected the overall growth and disrupted day-to-day operations of
the companies in the sector, the Philippine food and beverage sector remains to be competitive and brim-
ming with market opportunities for foreign investors.
Ein Service der AUSSENWIRTSCHAFT AUSTRIA7
FOOD & BEVERAGE INDUSTRIES IN THE PHILIPPINES
3.1 Key Figures on Country and Population
Situated in Southeast Asia, between the Philippine Sea and the South China Sea, the Philippines is an archi-
pelago made up of over 7.100 islands divided into three main geographical areas namely, Luzon, Visayas, and
Mindanao. As of the latest population census by the Philippine Statistics Authority in 2015, the country has a
population of 100,981.437, which is 8.64 million higher than the recorded population of 92.34 million in 2010.
Out of the reported population, the top three contributors are Region IV-A (CALABARZON) with a population
of 14.41 million, National Capital Region (NCR) with a population of 12.88 million, and Region III (Central Lu-
zon) with a population of 11.22 million. More recently, the World Bank has reported that as of 2019 the Phil-
ippines now has a total population of 108,116.615.
The Philippines, like other countries, has been greatly affected by the CoVID-19 pandemic. In 2019, prior to
the virus outbreak, the Philippines enjoyed an overall increasing GDP (+ 5.9%) which was in line with many
years of continuous economic expansion. with the last quarter of the year posting a growth rate of 6.7% year-
on-year (YoY). However, at the onslaught of the CoVID-19 pandemic and several disruptions such as the Taal
Volcano eruption, the Philippines GDP posted a significant drop from 6.7% to -0.7% in the first quarter of
2020 alone. At the end of 2020, the Philippines had to mark the strongest decline in GDP since 1947 at –
9.5%.
Table 1: Gross Domestic Product Year-on-Year Growth Rates:
Source: Philippine Statistics Authority
Industry growth in the country shrank by 9.9% in Q4 2020 but is a slight improvement from the recorded in-
dustry growth rate of 17.2% in Q3 2020, accounting for 30.6% of the country’s GDP in 2020. This is a slight
decrease from its 31.1% share in the previous year. Overall, the industry posted a decrease of 13.1% on an
annual basis. The construction sector, which has a share of 22.1% to total industry, had the biggest impact
on industry growth as it contracted by 25.3% during the fourth quarter of the year. Manufacturing also de-
clined by 4.3% due to the decline in the production of coke and refined petroleum’s, beverages, and other
non-metallic mineral products among others.
Ein Service der AUSSENWIRTSCHAFT AUSTRIA8
Table 2: Industry, Q1 2018 to Q3 2020 Growth Rates, at constant 2018 prices
Source: Philippine Statistics Authority
In addition to the already difficult economic situation for most of the population, inflation rate in the country
is also seen to be at an upward trend with the headline inflation reaching 3.5% in December 2020 from the
reported headline inflation rate of 3.3% and 2.5% in November and October 2020 respectively. Overall, in
2020, the Philippines reported a slight increase in its annual inflation rate at 2.5% in 2019 to 2.6%. In 2021
the government expected the inflation to range between 2% and 4%. However, already in March 2021, the
government adjusted their inflation-projection to 4.2% for the entire year.
According to the PSA, the record-high increase in inflation rate was attributed to (1) usual surge in prices
due to holiday festivities, (2) increase in transportation costs due to the pandemic, and (3) limited supply of
goods, especially vegetables and pork, as an after effect of the strong typhoons that the country experienced
in 2020 and the continuing presence of African Swine Fever in the country.
The items that posted a higher price index are vegetables at 19.7% and meat at 10%. On the other hand, al-
coholic beverages and tobacco posted a slower annual average rate of 12.2% compared to the 18.4% annual
increase last December 2019.
A spike in the country’s unemployment rate was also observed as numerous establishments were forced to
close due to various state-wide and local lockdowns imposed by the government throughout the duration of
the pandemic. A sharp increase in unemployment was reported in April 2020 posting an unemployment rate
of 17.7% that accounts to 7.3 million unemployed persons in the labor force while the employment rate de-
clined from 94.7% or 41.8 million employed persons in January 2020 to 82.3% or 33.8 million employed per-
sons in April 2020. As of Q3 2020, the employment situation in the Philippines is slowly recovering with the
employment rate increasing from 82.4% in April to 91.3% in October.
Ein Service der AUSSENWIRTSCHAFT AUSTRIA9
Table 3: Results from the October 2020 Labor Force Survey (LFS)
Results from the October 2020 Labor Force Survey (LFS)
October October
July 2020 April 2020
2020 2019
Population 15 years old and over (in 000) 74,307 74,061 73,722 72,603
Labor Force Participation Rate (%) 58.7 61.9 55.7 61.4
Employment Rate (%) 91.3 90.0 82.4 95.4
Underemployment Rate (%) 14.4 17.3 18.9 12.8
Unemployment Rate (%) 8.7 10.0 17.6 4.6
Source: Philippine Statistics Authority
Meanwhile, a downward trend was observed in the country’s Net Primary Income (NPI) and Gross National
Income (GNI). According to the PSA, the NPI contracted by 28.2% in Q3 2020 leading to the GNI to record a
decline of 13.0%.
Table 4: Net Primary Income, Q1 2018 to Q3 2020 Growth Rates, at constant 2018 prices
Source: Philippine Statistics Authority
Ein Service der AUSSENWIRTSCHAFT AUSTRIA10
Table 5 and 6: Gross National Income, Q1 2018 to Q3 2020 Growth Rates, at constant 2018 prices
Source: Philippine Statistics Authority
On expenditure, household consumption in Q3 2020 posted a negative growth rate of 9.3% which is a slight
improvement from the previous quarter wherein household consumption fell from 0.2% in Q1 2020 to -15.3%
in the said period. The steep dip is mostly owed to the adverse impact of the CoVID-19 pandemic on the
country’s employment rate which bolsters household consumption.
Source: Philippine Statistics Authority
Food and non-alcoholic beverages remain to have the largest share in the domestic consumption accounting
to 37.7% of the domestic consumption and posted a growth rate of 4.6%. Other items that recorded growth
rates are housing, water, electricity, gas and other fuels (6.7%) and communication (5.7%). Meanwhile, rec-
reation and culture posted the – obvious - highest decline (-59.3%) in all 12 items due to the travel re-
strictions imposed by the government to combat the COVID-19 pandemic. Other items that were adversely
affected by the pandemic resulting in a decline in growth rate are restaurants and hotels; transportation;
education; alcoholic beverages and tobacco.
Ein Service der AUSSENWIRTSCHAFT AUSTRIA11
Table 7: Household Final Consumption Expenditure, by Purpose, at Constant 2018 Prices (growth rate in %)
Household Final Consumption Expenditure, by Purpose
Growth Rates (%), at Constant 2018 Prices
2019 - 2020
Purpose Q1 Q2 Q3
Food and non-alcoholic beverages 4.7 4.6 4.6
Alcoholic beverages, tobacco -17.5 -42.0 -25.5
Clothing and footwear 0.1 -40.2 -13.9
Housing, water, electricity, gas and other fuels 2.4 7.6 6.7
Furnishings, household equipment and routine household
-9.4 -27.0 -9.1
maintenance
Health 9.1 -12.0 -2.3
Transport -7.4 -60.1 -33.4
Communication 5.2 8.0 5.7
Recreation and culture -5.7 -66.3 -59.3
Education 0.6 -15.7 -20.8
Restaurants and hotels -14.3 -65.8 -49.9
Miscellaneous goods and services 8.2 -0.9 2.2
Source: Philippine Statistics Authority
3.2 Average Household Expenditure on Food and Beverage
Based on the final 2018 Family Income and Expenditure Survey (FIES) released last June 2020, the average
annual family income in the Philippines amounted to PHP 313,348. Out of this amount, a significant share
goes to food expenditure, which remains to be the biggest expenditure of a household. In fact, food expendi-
ture accounts for 42.6% of the total expenditure by all families in the Philippines. This is an increase from
the reported 41.8% share of food expenditure in the average annual family expenditure indicated in the 2015
(FIES). Meanwhile, alcoholic beverages accounted for 0.5% of the total family expenditure.
It has been observed that families at the upper 70% of the income group have a lower share in the food ex-
penditure at 39.5% while families belonging to the lower 30% of the income group spent a higher amount on
food accounting for 58.2% of the food expenditure. Bread and cereals had the largest share among the items
in food expenditure, accounting for 11.0%, followed by meat at 5.7%, and fish and seafood at 5.0% as shown
in table below.
Ein Service der AUSSENWIRTSCHAFT AUSTRIA12
3.3 Food & Beverage Sales in Wholesale and Retail
Food retail sales in the Philippines amounted to USD 50 billion in 2019 and was projected to increase in 2020
as the population opts to cook and dine in the comfort of their houses due to the outbreak of the pandemic.
Processed seafood and meat have the largest revenue out of packaged foods in the Philippines in terms of
retail sales at an estimate of USD 2.1 billion, posting an increase from USD 1.96 billion in the previous year.
This is followed by packaged dairy amounting to USD 2.4 billion, and savory snacks at USD 2.06 billion.
Item Retail Sales Value (in billion USD)
Processed Meat and Seafood 2.64
Dairy 2.44
Savory Snacks 2.06
Rice, pasta and noodles 1.31
Edible oils 1.29
Baked goods 1.25
Baby Food 1.1
Confectionery 1.04
Ein Service der AUSSENWIRTSCHAFT AUSTRIA13
Sauces, dressings, and condiments 0.86
Sweet biscuits, snack bars and fruit snacks 0.69
Ice cream and frozen desserts 0.38
Processed fruits and vegetables 0.32
Breakfast Cereals 0.16
Sweet Spreads 0.11
Ready Meals 0.09
Soup 0.05
Source: Statista
As of April 2020, top items that were bought in bulk were packaged rice, noodles, and pasta amounting to
USD 1 billion and canned goods as indicated in the survey conducted by Insights Rakuten.
3.4 Import and Export of Food &Beverage
Throughout the years, the Philippines has strived to improve agricultural and food market access within the
country. One example of this initiative is the country’s commitment to Free Trade Agreements (FTA) like that
of the Philippines-European Free Trade Agreement (EFTA)1 FTA and the ASEAN Free Trade Area (AFTA).
1 The European Free Trade Association is a regional trade organization and free trade area consisting of four European states: Iceland, Liechtenstein, Norway, and Switzerland.
Ein Service der AUSSENWIRTSCHAFT AUSTRIA14
In 2018, processed food and beverage was listed in the top ten leading exports of the Philippines amounting
to USD 68.42 million which accounted for 1.4% of the total export and posting a growth rate of 61.8%. Mean-
while, total-agro based products had a share of USD 381.21 million or 8.1% of the total export. On imports,
other food and live animals ranked seventh in the top ten imports amounting to USD 247.50 million or 2.9%
of the total exports while cereals and cereal preparations ranked eight amounting to USD 217.48 million or
2.6% of the total export.
In 2017, processed foods and beverages exports amounted to USD 1.62 billion. Prepared/preserved pineap-
ple had the largest share accounting for 17% of the total processed foods export, which amounted to USD1.7
billion. This was followed by desiccated coconut at 16%; centrifugal sugar at 9%; coconut water and banana
chips/crackers both at 5%; pineapple juice at 4%; malt extract and dried mango both at 3%; and other cereal
preparations and banana catsup both at 2%. The USA was the largest market of the mentioned food exports
accounting for 52% of the total export, followed by Japan and Canada, each accounted for 3% of the total ex-
port. On beverages, the top 5 exports are lemonade, brandy, beer, spirits/liquors, and sparkling mineral/aer-
ated water.
Meanwhile, on agriculture products, export revenue was reported to have declined in Q3 2020 from USD 1.67
billion to USD 1.52 billion accounting for 8.7% of the country’s total exports. Top 5 commodities are edible
fruits and nuts (96.6%) amounting to USD 545.60 million; animal or vegetable oils amounting to USD 227.15
million.
Ein Service der AUSSENWIRTSCHAFT AUSTRIA15
AUSTRIAN-PHILIPPINE FOREIGN TRADE IN AGRICULTURAL PRODUCTS AND FOOD
4.1 Imports from Austria
Bilateral economic relations between Austria and the Philippines goes way back to the 1970s wherein devel-
opment aids were granted by Austria to help develop the Philippines’ energy sector. Since then, trade be-
tween the two countries has continuously developed throughout the years.
In terms of agricultural products, the Philippines’ main import from Austria for the period of Jan-Dec 2020 is
preparations of cereals, flour, starch, milk; bakery products at EUR 2.875.148. This is followed by beverages,
alcoholic liquids, vinegar at EUR 1.394.430, and various edible preparations at EUR 861.634. Meanwhile, im-
ports of living animals, which were valued at EUR 98.323 in 2019 contracted by 100% during the said period.
Change. in 2020/Jan.- Change. in
Label 2018 (E) 2019 (E)
% Dec. (V) %
Living animals 13.095 98.323 650.8 0 -100
Meat, offal, slaughterhouse waste 640.717 1.193.356 86.3 504.115 -57.8
Fish, crustaceans, and mollusks 0 0 - 0 -
Milk, dairy products, bird eggs, honey 320.030 421.086 31.6 323.258 -23.2
Other products of animal origin 0 0 - 0 -
Live trees, plants, cut flowers 0 0 - 0 -
Vegetables, edible plants, roots, tubers 0 0 - 1.797 -
Edible fruits, citrus peel, melons 2.959 0 -100 10 -
Coffee, tea, mate and spices 5.601 14.179 153.2 23.683 67.0
Grain/Corn/Cereal 131 0 -100 0 -
Milling products, malt, starch and the
14.255 7.950 -44.2 0 -100
like
Oil seeds, oleaginous fruits, grains,
482 263 -45.4 1.212 360.8
seeds, fruits
Shellac, gums, resins; Plant juices 0 0 - 0 -
Plaiting materials, other goods of
0 0 - 0 -
vegetable origin
Animal and vegetable fats and oils 0 1.416.915 - 0 -100
Preparations of meat, fish and shellfish 74.740 3.450 -95.4 0 -100
Sugar and confectionery 137.143 19.592 -85.7 786 -96.0
Cocoa and cocoa preparations 0 24 - 17.074 71041.7
Preparations of cereals, flour, starch,
2.181.653 3.038.196 39.3 2.875.148 -5.4
milk; Bakery products
Preparations of vegetables, fruits and
731.954 657.488 -10.2 624.856 -5.0
other plants
Various edible preparations 493.056 402.339 -18.4 861.634 114.2
Beverages, alcoholic liquids, vinegar 2.363.091 2.818.796 19.3 1.394.430 -50.5
Source: Foreign Trade Statistics/Austria Statistics
Ein Service der AUSSENWIRTSCHAFT AUSTRIA16
4.2 Exports to Austria
In terms of exports, the Philippines top agricultural product for the period of Jan-Dec 2020 was preparations
of vegetables, fruits and other plants amounting to EUR 3.219.255 followed by preparations of meat, fish and
shellfish and beverages, alcoholic liquids, vinegar valued at EUR 1.674.959 and EUR 747.895 respectively.
Meanwhile, exports of vegetables, edible plants, roots, tubers and milling products, malt, starch and the like
contracted by 100% and 66.9% respectively.
Change in 2020/Jan.- Change.
Label 2018 (E) 2019 (E)
% Dec. (V) in %
Living animals 0 0 - 0 -
Meat, offal, slaughterhouse waste 145 0 -100 0 -
Fish, crustaceans, and mollusks 64.796 72.196 11.4 51.401 -28.8
Milk, dairy products, bird eggs, honey 0 0 - 105 -
Other products of animal origin 16.442 50.537 207.4 8.876 -82.4
Live trees, plants, cut flowers 16.326 29.434 80.3 50.752 72.4
Vegetables, edible plants, roots, tubers 5.609 360 -93.6 0 -100
Edible fruits, citrus peel, melons 639.663 359.358 -43.8 873.509 143.1
Coffee, tea, mate and spices 10.662 1.603 -85 964 -39.9
Grain/Corn/Cereal 0 16 - 35 118.8
Milling products, malt, starch and the
13.976 4.317 -69.1 1.428 -66.9
like
Oil seeds, oleaginous fruits, grains,
2.060 47 -97.7 0 -100
seeds, fruits
Shellac, gums, resins; Plant juices 427.178 796.201 86.4 503.755 -36.7
Plaiting materials, other goods of vege-
585 25 -95.7 67 168
table origin
Animal and vegetable fats and oils 352.192 349.162 -0.9 514.822 47.4
Preparations of meat, fish and shellfish 1.916.005 1.625.186 -15.2 1.674.959 3.1
Sugar and confectionery 53.899 39.893 -26 49.750 24.7
Cocoa and cocoa preparations 1.064 1.855 74.3 14.633 688.8
Preparations of cereals, flour, starch,
45.762 49.668 8.5 75.299 51.6
milk; Bakery products
Preparations of vegetables, fruits and
2.551.062 2.736.210 7.3 3.219.255 17.7
other plants
Various edible preparations 46.534 38.666 -16.9 179.600 364.5
Beverages, alcoholic liquids, vinegar 404.515 670.640 65.8 747.895 11.5
Source: Foreign Trade Statistics/Austria Statistics
Ein Service der AUSSENWIRTSCHAFT AUSTRIA17
THE MOST IMPORTANT SECTORS OF THE FOOD PRODUCTION/PROCESSING INDUSTRY
5.1 Structure of Agricultural Land
Despite the initial plan to transform the country into an industrialized economy in 2000, the Philippines pri-
marily remains an agricultural country with 41.7% of its land being used for agriculture-related activities.
The Philippines is one of the biggest archipelago nations in the world and has physical features of mountain-
ous terrains, plains, dense forests, and coastal areas. 2 Based on the decennial publication of the PSA Census
of Agriculture and Fisheries in 2012, there is a total of 5.56 million farms/holdings stretching to 7.19 million
hectares in the country. This translates to an average area of 1.29 hectares per farm/holding. Region VI-
Western Visayas posted the highest number of farms at 518,000 farms/holdings or a total area of 460.45
thousand hectares. Meanwhile, on average area per fam/holding, Region XIII-CARAGA, Region IX-Zambo-
anga Peninsula, and Region XI-Davao, Region IVB-MIMAROPA, Region XII-SOCCSKSARGEN, and Region V-
Bicol had more than 1.5 hectare per farm/holding.
Based on the same data, approximately 99% of the total farms/holdings were run by households or individu-
als covering over 6.78 million hectares or an average area of 1.23 hectares per farm/holding. Meanwhile, a
small percentage of farms/holdings is run by partnerships, corporations, government institutions, private
institutions, etc. On ownership, it was reported that 3 of 5 or 3.45 million farms/holdings are under full own-
ership or in an owner-like possession while an estimate of 15% were tanated and 3% were rented. About
one-third of the total farms/holdings covering 1.8 million hectares are connected to an irrigation structure.
Out of the regions, Region 1I - Ilocos, Region II - Central Luzon, and Cordillera Administrative Region re-
ported that more than 50% of the total number of farms/holdings were provided with water through the use
of irrigation structures.
The country’s agricultural sector is classified into four sub-sectors namely, livestock, fisheries, forestry, and
farming with crop cultivation being the main agricultural enterprise in the country. The main crops of the
country are rice, corn, coconut, sugarcane, banana, cassava, pineapple, and vegetables. In the third quarter
of 2020, the sector accounted for 10.8% of the country’s GDP which is an increase from the 10.1% share in
comparison from the same period in 2019. On the other hand, the growth rate of the sector contracted by
2.5% leading to a 0.2% decline for 2020. Some of the sub-industries that contributed to the decline are live-
stock, fishing and aquaculture, and poultry and egg production. Meanwhile, some of the sub-industries that
posted growth rates during the quarter are supporting activities to agriculture, forestry, and fishing, sugar-
cane production, banana, rubber, and pineapple. 3
2 https://www.ph.undp.org/content/philippines/en/home/countryinfo.html
3 https://psa.gov.ph/national-accounts/sector/Agriculture,%20Forestry%20and%20Fishing
Ein Service der AUSSENWIRTSCHAFT AUSTRIA18
Agriculture, forestry and fishing, Q1 2018 to Q4 2020 Growth Rates, At constant 2018 prices
Source: Philippine Statistics Authority
Agricultural commodities form part of the major commodities in the country’s external trade. In 2019, the
Philippines agricultural trade totaled to USD2 1.22 billion accounting for 11.6% of the country’s total trade
thereby posting a 5% increase in comparison with the figure in 2018 which amounted to USD 20.22 billion.
Out of this figure, 31.5% or USD 6.68 billion were from agricultural exports while 68.5% or USD 14.64 billion
came from agricultural imports.
Source: Philippine Statistics Authority
The country’s top agricultural exports are edible fruit and nuts, and peel of citrus fruits or melons which
amounted to USD 2.63 billion or 39.4% of the total agricultural exports. Agricultural exports in 2019 recorded
an annual growth rate of 10.8% from the previous year which amounted to USD 5.77 billion. Among the
ASEAN, Malaysia had the largest share in exports at USD 251.16 million accounting for 33.1% of the total ag-
ricultural exports to the ASEAN which came to USD 757.73 million making up 7% of the total exports to
ASEAN. This is followed by Thailand at USD 147.35 million and Vietnam at USD 119.47. The top agricultural
exports to ASEAN are tobacco and manufactured tobacco substitutes (USD 277.36 million), animal or vegeta-
ble fats and oils (USD 117 million), and preparations of cereals, flour, starch or milk (USD 78.29).
Ein Service der AUSSENWIRTSCHAFT AUSTRIA19
Source: Philippine Statistics Authority
Meanwhile, in the European Union, the Netherlands recorded the largest share in agricultural commodities
exports in 2019 amounting to USD 486.13 million or 44.1% of the USD 1,102.45 million worth of agricultural
commodities exports to the bloc. Top agricultural exports to the EU are animal or vegetable fats and oils and
their cleavage products (USD 431.56 million); preparations of meat, fish, and crustaceans (USD2 52.71 mil-
lion); and preparation of vegetables, fruits, nuts, or other parts of plants (USD 122.25 million).
Source: Philippine Statistics Authority
On agricultural imports, the top commodity is cereals posting a 21.8% (USD3,174.28 million) share of the to-
tal agricultural imports in 2019. Following this are residues and waste from food industries, prepared animal
fodder (USD 1,817.13 million), and miscellaneous edible preparations (USD 1,792.39 million). The country’s
top market for import in ASEAN is Vietnam with agricultural imports valued at USD 1,346.43 million or 27.7%
of the total agricultural imports from ASEAN amounting to USD 4,855.36. The top imports from ASEAN are
edible preparations (USD 1,210.97 million), cereals (USD 1,135.22 million), and animal or vegetable fats and
oils and their cleavage products (USD 790.72 million) during the same period.
Ein Service der AUSSENWIRTSCHAFT AUSTRIA20
Source: Philippine Statistics Authority
Meanwhile, in the European Union, the Netherlands also had the largest share in the country’s agricultural
imports in 2019. Agricultural imports from the EU registered an amount of USD 1,708.48 million. Out of this
figure, the Netherlands contributed 18.5 % or USD 315.68 million worth of agricultural commodities. The top
three agricultural commodities from the EU are meat and edible meat offal (USD 523.97 million); dairy prod-
ucts and edible products of animal origin (USD 285.38 million); and residues and waste from the food indus-
tries (USD 189.75 million).
Source: Philippine Statistics Authority
Ein Service der AUSSENWIRTSCHAFT AUSTRIA21
5.2 Structure of the Food and Beverage Processing Industry
The Food and Beverage sector is the biggest sub-sector of the country’s manufacturing industry accounting
for 51.2% of its nominal gross value added (GVA) and 10% of the Philippines’ GDP as reported by the PSA in
20174. In the latest edition of the Annual Survey of the Philippine Business and Industry - Manufacturing Sec-
tor in the same year5, food manufacturing accounted for 32.6% (7,880 establishments) of the total number of
manufacturing establishments in the country. Similarly, in 20186, food manufacturing remained to have the
largest number of establishments in the manufacturing industry with an increased number of 9,084 estab-
lishments or 31.4% of the total 28,968 establishments engaged in the industry from the previous year. Simi-
larly, establishments engaged in beverage manufacturing also saw an increase at 3,986 establishments or
13.8% of the total establishments engaged in the manufacturing industry.
On the employment side, food manufacturing had the highest number of workers employed in 2018 with
151,514 or 12% of the 1,260,512 employees in the manufacturing industry. This is higher than the recorded
number of over 146,000 employees accounting for 11.5% of the total workforce in the manufacturing sector
of 1.3 million workers in the previous year. In terms of volume production, the food industry had a yearly in-
crease of 5.38% and from the period of 2012-2017.
Top companies in the food and beverage manufacturing industries in 2019 are Nestlé Philippines, San Miguel
Brewery, Universal Robina Corporation, and Coca-Cola Beverages Philippines. Nestlé, as the leading food
and beverage manufacturers in the country, earned an estimated amount of USD 2.4 billion in the same
year.7 In terms of consumption, the majority of the processed food products are consumed domestically, with
household staples such as canned goods, frozen processed foods, snack foods, etc. were reported to have an
increase in sales during the implementation of the country-wide community quarantine in 2020.8
Despite the high number of manufacturing companies active, it is important to note the following: One of the
major bottlenecks that food processing companies encounter in their activities is the delay in the processing
and acquisition of the required permits or clearances from government agencies leading to opportunity and
revenue losses. Furthermore, due to the number of permits that are needed to be acquired, compliance
costs in the Philippines are also quite high in comparison to other countries. Aside from these, the sector
also faces challenges brought about by the pandemic which requires manufacturers to incorporate costly
safety measures against the virus in their day-to-day operations.
5.3 Meat Processing Industry
Throughout the years, the Philippine processed meat industry has exhibited a stable growth due to the in-
crease of demand and improvements in the economy leading to increased purchasing power. It has six prod-
uct categories such as cured meat, pre-cooked products, dried meat, fresh processed meat products, raw
fermented sausages, and raw-cooked products. There are a total of 175 meat processors in the Philippines,
most of which can be found in the National Capital Region, Region III, and Region IV-A.
4 https://www.businesswire.com/news/home/20180412005810/en/Philippines-Food-and-Beverage-Market-Analysis-Forecast-2018-2019---ResearchAndMarkets.com
5 https://psa.gov.ph/manufacturing/aspbi-id/160272
6 https://psa.gov.ph/manufacturing/cpbi-id/163605
7https://www.statista.com/statistics/1179099/philippines-leading-food-beverage-processing-companies/#:~:text=In%202019%2C%20the%20leading%20food,Brew-
ery%20and%20Universal%20Robina%20Corporation.
8https://apps.fas.usda.gov/newgainapi/api/Report/DownloadReportByFileName?fileName=Food%20Service%20-%20Hotel%20Restaurant%20Institutional_Manila_Philippines_09-
30-2020
Ein Service der AUSSENWIRTSCHAFT AUSTRIA22
According to the Department of Trade and Industry - Bureau of Investment (DTI-BOI), the country is gener-
ally considered as a net exporter of processed meat. In fact, from the period of 2010 to 2015, exports of pro-
cessed meat posted an annual growth rate of 13.8% with UAE, Qatar, Japan, Saudi Arabia, USA, Kuwait,
ASEAN countries, Canada, Guam, and Taiwan as its major export markets. Meanwhile most of its raw mate-
rials (about 85 %) are imported due to the following reasons: (1) mismatch in the quality needed by the meat
processors and local produce; (2) international meat products are relatively cheaper than locally produced
meat especially for the production of hotdogs, sausages, and corned beef; and (3) quality of support facilities
like that of refrigeration requirements that are not met by local meat producers.
In 2020, the Philippines reached a new record in terms of meat imports at 895,000,000 kilograms which is
6% higher than the 844.971 million kg in 2019 and the previous record-high import value at 848.647 million
kg in 2018. Out of the meat imports, chicken had the largest share accounting for 45 % of the total volume at
402.7 million kg. Out of this volume, an estimate of 68% consisted of mechanically deboned meat which is a
commonly used raw material for processed meat products that is not available in the local market. This is
followed by pork at 256 million kg with offal having the largest share of the total pork imports, and beef at
198.385 million kg with beef cuts stipulating the largest proportion at 115.962 million kg.
MEAT AND MEAT PRODUCTS IMPORTATION CY 2020
Sum of Net
Meat Weight(kgs)
Beef 198,385,327
Buffalo 34,606,228
Chicken 402,700,069
Duck 97,421
Lamb 1,912,058
Turkey 979,968
Pork 256,017,459
Grand Total 894,698,528
Source: Bureau of Animal Industry
The United States of America, the Netherlands, and Brazil are the top three sources of meat products at
160.052 million kg, 157.779 million kg, and 131.717 million kg respectively. Both the USA and the Nether-
lands have chicken as its top meat import at 99.822 million kg and 124.274 million kg respectively. Mean-
while, for Brazil, its main meat import is Turkey at 135 million kg.
Ein Service der AUSSENWIRTSCHAFT AUSTRIA23
Origin Beef Buffalo Chicken Duck Lamb Turkey Pork Grand Total
Argentina 458,873 458,873
Australia 87,291,541 1,174,550 16,408 1,644,487 3,966,773 94,093,760
Austria 638,654 549,757 1,188,411
Belgium 1,666,156 35,423,798 37,089,954
Brazil 44,928,478 78,417,147 135,000 8,236,420 131,717,045
Canada 1,574,493 22,903,706 526,000 45,282,945 70,287,144
Denmark 385,988 165,000 6,527,867 7,078,856
France 720,497 8,871,459 19,733 2,400 29,799,472 39,413,561
India 34,606,228 34,606,228
Ireland 26,908,398 4,388,850 31,297,248
Italy 870,466 870,466
Japan 183,223 183,223
Netherlands 8,496,403 124,274,434 25,008,175 157,779,011
New Zealand 5,713,534 28,438 20,000 258,000 6,019,972
Poland 1,589,000 1,589,000
Spain 77,423,506 77,423,506
Turkey 14,233,457 14,233,457
Sweden 595,500 595,500
United King-
dom 4,115,829 15,796,458 8,808,328 28,720,615
United States 15,303,259 99,822,623 41,280 9,571 316,568 44,559,399 160,052,699
Grand Total 198,385,327 34,606,228 402,700,069 97,421 1,912,058 979,968 256,017,459 894,698,528
Source: Bureau of Animal Industry
As of 23 December 2020, the Department of Agriculture has listed 14 countries that are accredited to export
meat into the Philippines. The list includes Australia, Belgium, Canada, Denmark, France, Germany, Ireland,
Japan, Netherlands, New Zealand, Spain, Sweden, United Kingdom, and the United States of America. In
terms of individual accreditation for meat establishments, Brazil has the greatest number of accredited es-
tablishments at 54. Austria has currently only six establishments with the necessary accreditation. However,
a request for a new inspection visit by the Philippine Department of Agriculture has already been filed.
Ein Service der AUSSENWIRTSCHAFT AUSTRIA24
On the other hand, the Philippines has imposed temporary restrictions on the importation of certain meat
products from 8 countries including Germany, Australia, Belgium, France, Netherlands, United Kingdom,
United States of America, and Poland. Especially with the European Union, discussions about the regionali-
zation of such import restrictions are being conducted.
List of Countries with Temporary Bans on the Importation of Meat
(as of 23 December 2020)
Country Commodity Area Coverage
Pork Countrywide
Germany
Poultry Countrywide
Australia Poultry Regionalized (Lethebridge,
Victoria, Australia)
Belgium Poultry Regionalized (Menen,
West-Vlaanderen, Belgium)
France Poultry Regionalized (Lucciana,
Haute-Corse, France)
Netherlands Poultry Regionalized (Gelderland and
Groningen, Netherlands)
United Kingdom Poultry Regionalized (England, United
Kingdom)
United States of America Poultry Regionalized (Chesterfield
County, South Carolina, USA)
Poland Poultry Countrywide
In a joint report published by the United Nations’ Food and Agriculture Organization (FAO) and the Organiza-
tion for Economic Cooperation and Development (OECD), it was forecasted that local production for meat
products will fall short to the population’s demand leading to a further increase in meat imports to cater to
the demand by 2028. All this despite the projected annual increase of 1.85% in the production of meat in the
Philippines. Furthermore, according to the report, meat consumption in the country is expected to increase
by 28.67% or 5.197 MMT by 2028. A Filipino is estimated to have an annual consumption of at least 34.6 kg of
meat, which is higher than the reported per capita consumption of an average of 31.2 kg from 2015 to 2017.
Meanwhile, production of pork is still at a downward trend due to the spread of the African Swine Fever (ASF)
in the country beginning in 2019. According to the PSA, swine inventory as of 01 January 2021 is estimated at
9.72 million heads, which is a decline from the 12.80 million heads tallied in 2019. On a positive note, the
Philippine Department of Agriculture has reported that the spread of ASF is tapering down and that they
have a positive outlook for swine production in 2021. Meanwhile, local production for chicken in 2020 re-
ported a slight increase at 179.78 million, which is 0.9 % higher than the recorded 178.26 million birds in
2019.
Ein Service der AUSSENWIRTSCHAFT AUSTRIA25
5.4 Milk and Milk Processing Industry
The Philippines is known to be a big importer of dairy products due to the insufficient local production to
meet the demand of about 3.0 MMT liquid milk equivalent (LME) annually. However, for the year 2020, a de-
crease in the country’s dairy imports was recorded at 2,163.08 thousand MT-in LME or an equivalent of USD
805.32 million, which is lower than the reported, number in 2019 at 2,969.83 thousand MT-in LME or USD
1,129.32 million. Its top dairy imports for the same year are milk and cream products (1,847.17 thousand MT-
in LME) such as skim milk powder (1,051.73 thousand MT-in LME), and whey products (265.34 thousand MT-
in LME). The top sources of the country’s dairy supplies for the period of January-September 2020 are New
Zealand (32.63%), United States of America (30.44%), Australia (5.45%), the Netherlands (5.05%), and Ger-
many (3.45%).
Volume of Milk & Milk Products Imports
(‘000 MT or mil. liters, in LME)
Products 2016 2017 2018 2019 2020 (Jan-Sep)
1. Milk and Cream
Skim Milk Powder 1,435.85 1,121.44 1,276.15 1,336.99 1,051.73
Whole Milk Powder 166.17 150.51 168.52 228.52 153.75
Evaporated Milk 0.60 6.73 1.35 0.02 -
Buttermilk/
237.18 241.44 291.04 287.32 238.11
Buttermilk Powder
Whey Powder 403.93 422.34 441.14 432.41 265.34
Liquid (RTD Milk) 65.60 61.49 79.39 87.20 67.76
Cream 28.84 3.78 195.68 135.10 46.21
Condensed Milk 16.70 19.63 23.01 5.40 1.96
Total Milk and Cream 1,409.49 2,086.36 2,503.44 2,546.19 1,847.17
2. Butter/ Butterfat 232.21 247.65 259.80 262.24 190.43
3. Cheese 127.32 108.20 125.40 121.29 89.81
4. Curd 3.55 44.00 50.96 40.11 35.67
5. Others 54.62 59.00 27.16 33.23 22.37
Total 2,772.57 2,486.29 2,939.60 2,969.83 2,163.08
Source: National Dairy Authority
On local production, data from the Philippines Statistics Authority shows that production has increased in the
last year of about 9.5 % from 24.38 million liters in 2019 to 26.71 million liters in 2020. Main sources of local
milk production is from cow’s milk accounting for 65 %, followed by carabao’s milk at 31%, and goat’s milk
at 4% as reported by the National Dairy Authority. The increase is mainly attributed to the increase in the
number of dairy animals in the milk line.
Ein Service der AUSSENWIRTSCHAFT AUSTRIA26
According to the inventory of the PSA, the total inventory for cattle from the period of October to December
2020 increased by 1.7% at 2.59 million heads from the 2.54 million heads reported in the same period in
2019. Similarly, both inventories for carabaos and goats increased by 1 % from 2.87 million heads in Octo-
ber-December in 2019 to 2.92 million heads in the same period last year for carabaos, and by 2.5% from the
3.81 million heads in 2019 to 3.91 million heads in the same period last year for goats. The increase in the
cattle inventory is brought about by the importation of new dairy breeds as part of the NDA’s Herd Build-Up
Program with the objective of increasing the dairy production in the country via the importation of equip-
ment, dairy animals, among others, as well as the conduct of breeding programs to upgrade the local ani-
mals to dairy breeds.
The Philippines has four main types of dairy farms. These are individual smallholder producers, smallholder
cooperatives, commercial farms, and government farms. In terms of goat production, Central Visayas was
reported as the top producer of goat for the period of October-December 2020 at 3.07 thousand MT, live-
weight followed by Central Luzon at 2.32 thousand MT, liveweight and Ilocos Region at 2.21 thousand MT,
liveweight accounting for 37% of the total goat production. Meanwhile, Ilocos Region, Central Visayas, and
CALABARZON are the top regions for cattle production contributing 35% of the total cattle inventory. Lastly,
for carabao production, Bicol Region, Western Visayas, and Central Luzon comprised 29 % of the total cara-
bao inventory in the Philippines.
Milk’s average farm-gate price increased from PHP 42.06 per liter in 2019 to PHP 44.24 per liter in 2020.
Meanwhile, the average milk production per animal remains quite low at 8 liters per day in comparison to
other countries such as the United Kingdom which has an average daily milk yield of 20 liters per day and the
United States of America which has around 30 liters per day. This is most likely due to some challenges that
companies/farms face in terms of milk production such as high production costs, inadequate dairy infra-
structure and limited quality of feed. Despite these, the Philippines continues to implement initiatives to in-
crease local supply of milk, particularly of fresh milk in the country. Some of these initiatives include the al-
ready mentioned Herd Build-Up Program.
In terms of ready-to-drink milk products, Swiss multinational company Nestlé Philippines Inc. remains to be
the most successful company in 2020. Among the company’s top selling products are chocolate milk Chuckie
and Milo, and Nestlé fresh milk. The company has launched additional RTD products at the start of 2020,
which includes RTD format of Bear Brand Fortified and Adult Plus. Consumption of RTD milk products saw
an increase in the same year as the local population became more interested in their wellbeing. Other
known brands of RTD milk products are Alaska Milk Corporation, Fonterra Philippines, and RFM Corpora-
tion.
Recently bought by Dutch national Royal FrieslandCampina, Alaska Milk Corporation has been operating in
the Philippines for more than 45 years. Some of its ready-to-drink products that are available in the market
are Alaska Fresh Milk, Alaska Fortified Milk Drink, Alaska Choco Milk Drink, and Alaska Yogurt Drink. Fon-
terra Philippines is owned by a co-op of farmers from New Zealand. Its top selling products in the Philip-
pines are Anlene (adult milk), Anmum (best for pregnant women), and Anchor Milk. Lastly, RFM Corporation
is known as one of the biggest food and beverage companies in the country. First established in 1958 as a
flour-milling company, RFM has now grown to include manufacturing of several food and beverage products
including pasta, milk, ice cream, etc. Selecta Dairy Philippines, Inc. is the corporation’s subsidiary for dairy
products. Among its top products are, Selecta Fortified Milk and Moo (chocolate milk drink).
5.5 Grain, Bread and Bakery Industry
The Philippines is a major importer of grains, as the country does not have a local production of wheat or
small grains (rye, barley, and oats) due to its tropical climate. In 2019, imports for wheat (including spelt and
meslin) amounted to USD 7.5 million, an increase from the reported figure in 2018 amounting to USD 7.1
million as reported by the PSA. For the year 2020/21, however, importation of wheat is projected to decline
due to lower demand for hog feed as a result of the African Swine Fever.
Ein Service der AUSSENWIRTSCHAFT AUSTRIA27
Value of Wheat (including Spelt) and Meslin
*in million USD
Year *Value
2014 3,095.30
2015 4,770.39
2016 5,243.11
2017 5,827.94
2018 7,141.34
Source: PSA
The country’s top supplier of wheat is the United States of America with imports amounting to USD 705.44
million accounting for 39% of the total imports for wheat in 2018, and USD 708 million in 2019. The Philip-
pines is the USA's second largest market for wheat exports. Following the USA, is Ukraine at USD 399.83
million contributing 22% of the total wheat imports, and Australia at USD 371.67 million or 22%.
Wheat (including Spelt) and Meslin Imports Major Country of Origin, 2018
*in million USD
Country Volume Value*
USA 2,574.97 705.44
Ukraine 1,730.26 399.83
Australia 1,515.93 371.67
Russia 760.98 173.29
Canada 321.98 95.41
Others 237.23 65.43
In terms of consumption, the Philippines is an increasing consumer country of wheat-based products includ-
ing bread, flour, noodles, etc. According to the recent report of the Foreign Agricultural Service - United
States Department of Agriculture in March 2020, consumption of wheat-based products have posted an an-
nual growth of 4-7% over the last ten years. About 70 % of the overall milling wheat consumption consists of
bakery products such as pan desal, buns and rolls, loaf bread, and other pastries while the remaining 30%
consists of noodles, pasta, and cookies and crackers. The country is the only Southeast Asian country that
has more consumption of bread than rice.
Ein Service der AUSSENWIRTSCHAFT AUSTRIA28
The Philippine milling and grain processing industry continues to flourish as local demands for wheat-based
products continue to grow. As of writing, there are 22 companies in the country that engage in flour produc-
tion producing over 83 million bags of flour every year. As of December 2019, the country’s aggregate milling
capacity reached 6.2 million tons posting a growth rate of 46% from 4.2 million tons in 2014.
5.6 Fruit and Vegetable Industry
As an overall agricultural country, the Philippines fruit and vegetable production is highly competitive. The
country has four major fruit crops, which are banana, calamansi, mango and pineapple. In the quarterly re-
port of the PSA, banana production for October-December 2020 was estimated at 2.40 million metric tons
with cavendish variety having the largest share in production at 1.21 million metric tons or 50.4% of the total
production followed by saba variety at 28.5 %. Most of the produce came from Davao Region accounting for
35.3% or 846.23 thousand metric tons.
For calamansi, local production was recorded at 25.39 thousand metric tons, posting a decrease of 3.2 %
from the total number of productions in the same period in 2019 at 26.24 thousand metric tons. The top
source of calamansi production is Caraga Administrative Region with 4.01 thousand metric tons accounting
for 15.8 % of the total production for the said period. Similarly, mango production also posted a decrease by
0.9 % at 27.53 thousand metric tons in comparison to the 27.78 thousand metric tons produced in the same
quarter in 2019.
Caraga was also reported to have the largest share of mango production at 24.8% or 6.84 thousand metric
tons. Lastly, for pineapple production, it had a 0.1% growth rate at 712.64 thousand metric tons from the
same quarter in 2019 at 711.94 thousand metric tons. The top supplier of pineapple is Northern Mindanao
contributing to about 462.32 thousand metric tons to the total production.
For vegetable production, the major produce is mung bean, potato, cabbage, eggplant, tomato, jambalaya,
onion, sweet potato, and cassava. Mung Bean production for the last quarter of 2020 posted a 0.4% growth
rate at 3.13 thousand metric tons from 3.12 thousand metric tons in the same quarter in 2019. The Bang-
samoro Autonomous Region in Muslim Mindanao (BARMM) contributed the most with more than half of the
total output coming from the region.
Banana remained to have the largest share in agricultural exports in 2019 at 29% with a volume of 4.40 mil-
lion metric tons posting a 4 1% growth rate than the reported figure in 2018. Exports for pineapple and
mango both recorded an increase in its export volume at 631,486 metric tons and 14,212 metric tons respec-
tively. Similarly, an increase in the Philippine export of onion, calamansi, mongo, and potato was also re-
ported in the same year.
Volume, value, and percentage of fruits and vegetables in the total agricultural exports 2018-2019
2018 2019
Volume Value Volume Value
Commodity (in MT) (in MT)
PhP (‘000) % Share PhP (‘000) % Share
Banana 3,126,203.3 72,779,319.4 22.591 4,403,496.3 101,177,609.3 29.262
Coconut 1,309.3 35,738.8 0.011 1,380.9 36,919.7 0.011
Mango 13,562.2 990,941.7 0.308 14,211.8 1,017,482.3 0.294
Sugarcane 0.5 13.5 0.000 1.6 47.4 0.000
Pineapple 391,982.1 8,651,209.1 2.685 631,486.2 16,824,913.1 4.866
Cassava 905.9 44,438.6 0.014 808.6 47,425.5 0.014
Ein Service der AUSSENWIRTSCHAFT AUSTRIAYou can also read


