Food losses in cassava and maize value chains in Nigeria - Analysis and recommendations for reduction strategies
←
→
Page content transcription
If your browser does not render page correctly, please read the page content below
Food losses in cassava
and maize value chains
in Nigeria
Analysis and recommendations for reduction strategies

Published by
2                                                                                          Table of CONTENTS

Table of Contents

0   Executuve summary                                                                                    5

1   Introduction                                                                                        10
    1.1 Aim of the study                                                                                 10
    1.2 Concept of food losses                                                                           10
    1.3 Concept of food value chain                                                                      11

2   Methodology                                                                                         14

3   Cassava		                                                                                           17
  3.1     Cassava in Nigeria                                                                             17
  3.2     Cassava value chains                                                                           19
		        3.2.1 Cassava production                                                                       22
		        3.2.2 Cassava processing                                                                       22
		        3.2.3 Cassava marketing                                                                        28
  3.3     Quantitative and qualitative analysis of losses in the cassava value chain                     28
		        3.3.1 Incidence of losses in the cassava value chain                                           28
		        3.3.2 Quantification of losses in the cassava value chain                                      31
		        3.3.3 Monetary quantification of losses in the cassava value chain                             33

4   Maize			                                                                                            37
  4.1     Maize in Nigeria                                                                               37
  4.2     Value chains of maize grain and green maize                                                    39
		        4.2.1 Maize production                                                                         41
		        4.2.2 Processing of maize into feed                                                            42
		        4.2.3 Maize marketing                                                                          43
  4.3     Quantitative and qualitative analysis of losses in the maize value chain                       43
		        4.3.1 Incidence of losses in maize value chain                                                 43
		        4.3.2 Quantification of losses in maize value chain                                            45
		        4.3.3 Monetary quantification of losses in the maize value chain                               47
		        4.3.4 Maize storage facilities in the study areas                                              51

5   BY-PRODUCTS ALONG THE MAIZE AND CASSAVA VALUE CHAINS	                                               52

6	OPTIONS FOR REDUCING FOOD LOSSES	                                                                     53
    6.1   Technology                                                                                     53
    6.2   Organisation of farmers along the value chain                                                  53
    6.3   Infrastructure                                                                                 54
    6.4   Human capacity development                                                                     55
    6.5   Credit policy                                                                                  55
    6.6   Handling and processing policy                                                                 55
    6.7   Costs and benefits of intervention options                                                     55
    6.8   Actors and Partners with potential roles in the control of post-harvest losses                 56

Annexe				                                                                                              58
Table of CONTENTS                                                                                        3

List of tables
Table 1:    Generic food supply chain and examples of food wastage (Parfitt et al. 2010)            12
Table 2:    Traditional measures and their metric conversions                                       14
Table 3:    Number of respondents in each sample                                                    15
Table 4:    Description of key variables in cassava production per average cassava farm             22
Table 5:    Estimates of losses in the cassava value chain – farmers’ assessment                    32
Table 6:    Estimates of losses in the cassava value chain – gari processors’ assessment            32
Table 7:    Estimates of losses in the Cassava value chain – starch processors’ assessment          33
Table 8:    Estimates of losses in the cassava value chain – gari marketers’ assessment             33
Table 9:    Monetary assessment of losses of fresh cassava tubers at the farm gate                  34
Table 10:   Monetary assessment of losses of fresh cassava tubers during gari processing phase      34
Table 11:   Monetary assessment of losses during gari processing                                    35
Table 12:   Monetary assessment of losses of gari during marketing                                  35
Table 13:   Monetary assessment of losses of cassava starch during processing and storage           36
Table 14:   Summary of cassava PHL monetary assessment                                              36
Table 15:   Description of key variables in maize production                                        41
Table 16:   Estimates of losses in the maize value chain – farmers’ assessment                      45
Table 17:   Estimates of losses in the maize value chain – marketers’ assessment                    46
Table 18:   Estimates of losses in the maize value chain – feed millers’ assessment                 46
Table 19:   Duration of storage of maize grain and products (feed)                                  47
Table 20:   Quantification of losses of maize cobs (green and dry) at the farm gate                 47
Table 21:   Quantification of losses of maize grain at the farm gate                                48
Table 22:   Quantification of losses of maize grain during marketing (storage and transportation)   48
Table 23:   Quantification of losses of maize grain during feed milling                             49
Table 24:   Quantification of losses of feed during marketing                                       49
Table 25:   Summary of quantification of maize losses                                               50
Table 26:   Actors and partners’ potential roles in post-harvest losses                             56
Table 27:   Cost of gari processing equipment and tools                                             58
Table 28:   Description of key variables in gari processing                                         58
Table 29:   Farmers experiencing cassava losses                                                     58
Table 30:   Starch processors experiencing losses                                                   59
Table 31:   Gari processors experiencing losses                                                     59
Table 32:   Gari marketers experiencing losses                                                      59
Table 33:   Maize farmers experiencing losses                                                       60
Table 34:   Maize marketers experiencing losses                                                     60
Table 35:   Feed millers experiencing losses                                                        60
4                                                                   Table of CONTENTS

List of Figures

Figure 1: Synopsis of losses in the cassava value chain                            6
Figure 2: Synopsis of losses in the maize value chain                              8
Figure 3: Wastage of food products along the supply chain                         11
Figure 4: Generic elements of a basic linear value chain                          13
Figure 5: Cassava growing regions in Nigeria                                      17
Figure 6: Output of cassava in Nigeria (1990 – 2010)                              18
Figure 7: Gari destination markets in Nigeria                                     19
Figure 8: Cassava value chain map                                                 21
Figure 9: Stages of gari processing                                               23
Figure 10: Cassava peeler                                                         23
Figure 11: Cassava peeler                                                         23
Figure 12: Cassava hand peeler                                                    24
Figure 13: Gari frying                                                            24
Figure 14: Cassava grater and lister engine                                       24
Figure 15: Cassava grater                                                         25
Figure 16: Stages of starch processing                                            26
Figure 17: Mass flow from fresh cassava tubers to gari and starch                 27
Figure 18: Losses experienced by cassava farmers                                  29
Figure 19: Losses experienced by cassava starch processors                        30
Figure 20: Losses experienced by Gari processors                                  30
Figure 21: Losses experienced by gari marketers                                   31
Figure 22: Distribution of cassava loss values in Mio EUR                         36
Figure 23: Maize production in Nigeria in 2005                                    37
Figure 24: Output of maize in Nigeria (1990 – 2010)                               38
Figure 25: Maize value chain map                                                  40
Figure 26: Stages of maize feed processing                                        42
Figure 27: Losses experienced by maize farmers                                    43
Figure 28: Losses experienced by maize marketers                                  44
Figure 29: Losses experienced by feed millers                                     45
Figure 30: Distribution of maize loss values in Mio EUR                           50
Figure 31: Pick-up van being used for cassava transportation                      61
Figure 32: Land Rover being used for cassava transportation                       61
Figure 33: Peeled fresh cassava tubers                                            62
Figure 34: Screw cassava press                                                    62
Figure 35: Hydraulic cassava press                                                62
Executive Summary and Conclusion                                                                                              5

0 Executive Summary and
  Conclusion

Each year, a significant proportion of food produced for          quantitative and qualitative analysis of food losses, iden-
human consumption is lost or wasted. Annual losses                tify hot spots for losses, determine causes of food losses
have been estimated at about 1.3 billion tonnes by the            and positive or negative incentives, identify important
FAO (2011)1. In light of rising food prices, growing              actors and partners in the private and public sectors and
pressure on natural resources and severe famine in parts          the research and donor communities, and examine the
of eastern and western Africa in recent years, avoidable          role of these actors in reducing food losses along value
loss and waste of food cannot be tolerated. The world’s           chains. Finally, it aimed to provide recommendations for
natural resources, such as soil, water, fossil energy and         reducing food losses at the operational and policy level
nutrients, are limited, and must be used in a more                and for future engagement of the German Federal Minis-
efficient and responsible manner.                                 try for Economic Cooperation and Development (BMZ).

The term food wastage, as used by the FAO, encompasses            The survey comprised 400 cassava and maize farmers, 54
both food loss and food waste. Wastage occurs along the           marketers and 63 processors. Results show that losses in
entire food/value chain and varies in extent depending            cassava and maize value chains are significant, but also
on the product and region. The concept of food wastage            that their distribution within the value chains is irregu-
is defined differently in different parts of the world. In        lar. Data have been obtained by assessment, not by meas-
developed countries, food waste arises at the consumer            urement, and are therefore dependent on the perception
stage and concerns food which is processed and ready              of the interviewees. In order to ensure the data collected
to eat. In developing countries, food losses occur at the         was representative, 400 respondents took part in the
post-harvest stages; during marketing and processing              study and specially trained field interviewers were used.
(Godfray et al., 20102).
                                                                  Field data have been supplemented with official national
This study focuses on food losses at the harvesting, pro-         statistics, mostly data of the FAO (Food and Agriculture
cessing and marketing stages. Its main aim is to improve          Organisation of the UN), to provide a better overview of
data availability concerning food losses in important             national losses in the two value chains studied. The quality
food value chains in the showcase country of Nigeria,             of the nationwide data is therefore dictated by the quality
contribute to methodological discourse on the assess-             of the underlying official statistics. Due to the complexity
ment of food losses, and identify options for German              of interactions in the value chains, the chains have been
Development Cooperation to engage in food loss reduc-             slightly simplified in order to demonstrate the main re-
tion programmes.                                                  source flows. Short cuts in the value chains have not been
                                                                  considered, which may have led to a tendency to overes-
Cassava and maize, which are important staple foods               timate loss data. Percentage loss data in the value chains
for many Africans both in rural areas and in the rapidly          are presented for every cluster in the chain (farmers,
growing cities, were selected as the focus of the study.3         processors, marketers) and cannot be added up, because
Both crops are cultivated across different agro-ecological        they base on different quantities. They show nevertheless
zones in Nigeria, mostly by smallholder farmers. Both             significant hot spots and challenges in post- harvest losses.
are processed into different foodstuffs at household and
industrial level. They also serve as feed for animals. There      The results of this study show crude loss data without
are also industrial utilisations for cassava and maize            considering the economics of losses. In reality, it is not
which are not related to the production of food or feed.          feasible to achieve zero losses, as protection measures
                                                                  to secure 100 percent of the harvest will inevitably be
The scope of the study was to describe at least one               disproportionately costly. Losses have to be accepted to a
typical value chain for cassava and maize (from harvest           certain extent, depending on market prices and existing
to retailer) along with its system boundaries, provide            infrastructure. Actual losses for farmers, processors and

1 Food and Agriculture Organization of the United Nations, Rome, Italy, 2011: Global food losses and food waste extent: causes
and prevention
2 Godfray, H. C. et al. 2010: Food Security: The Challenge of Feeding 9 Billion People; Science; 12 February 2010; 327
3 Nigeria annual production figure; FAOSTAT, 2012 http://faostat.fao.org/site/567/DesktopDefault.aspx?PageID=567#ancor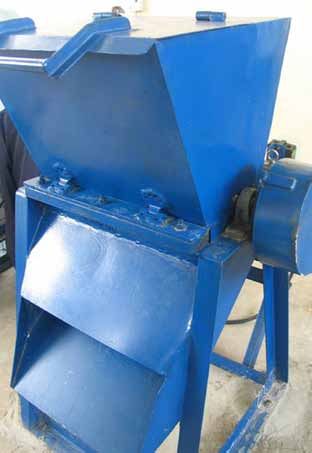
6                                                                                         Executive Summary and Conclusion

marketers are therefore smaller than estimated in this                        Losses in the cassava value chain relate to measurable
study.                                                                        quantitative and qualitative losses in the course of trans-
                                                                              forming cassava into various products. It is difficult to
The study on losses is followed by a second study which                       assess the loss of quality in gari due to the absence of
estimates, on the basis of these data, the impact of food                     measurable criteria that are easy for consumers to use.
losses on natural resources such as soil, water, biodiver-                    In the case of starch used for industrial purposes, quality
sity and climate (ecological footprint).4                                     criteria include moisture content and other impurities.

Cassava is a tuber crop that is grown and consumed                            Cassava farmers indicate that the most significant losses
across all the agro-ecological zones in Nigeria. With an                      occur during harvest (4.95%), due to inappropriate har-
annual production of over 40 million metric tons (mt),                        vesting technologies (machetes) and poor soil conditions
Nigeria is widely acknowledged as the largest producer of                     (dry and stony). According to the respondents, the main
cassava in the world. The major growers are the southern                      challenges for gari processors are tubers that are too
and Middle Belt states of the Federation.                                     small (5.8%) and too woody (4.1%), as these cannot be
                                                                              peeled correctly and have to be thrown away. This prob-
Cassava is processed into gari for human consumption                          lem appears to be less significant when gari is processed
and into starch for the food and beverage industries.                         for home consumption at the farm level. This could be
Furthermore, it is used in the pulp and paper as well as                      attributed to the fact that farmers are more reluctant to
the furniture and plywood industries. It is also an im-                       discard their harvest or that they use better adapted peel-
portant raw material in the textile and pharmaceutical                        ing technology than gari processors. Improved cassava
industries in Nigeria. Inability to meet local demand for                     peeling technology would be a key element in reducing
starch from local sources has led to Nigeria importing                        these losses.
significant quantities of corn starch each year.

Figure 1: Synopsis of losses in the cassava value chain

                                                       Losses along the cassava value chain

                                          Farm                                                    Gari Processor
                                          8.51%

                   Harvest          Spoilage during        Too small               Loss of fresh tuber                      Loss of Gari
                   4.95%               storage              1.93%                        12.1%                                2.71%
                                         1.63%

                                                                                   Too woody                        Processing        Storage/
                                                                       Transport                   Too small
                                                                                     4.1%                             1.6 %           Spoilage
                                                                         2.2%                        5.8%
                                                                                                                                        1.1%

                                   Starch Factory                                                     Gari Market
                                       11.8 %                                                            9.5 %

                             Processing               Storage
                                5.5%                   6.3%                               Transport                      Storage
                                                                                            2.5%                          7.0 %

                                                                                                         Moisture                Rodents
                                                                                                          4.5%                    2.5%

4 PE International/ GIZ 2013: Life Cycle Assessment of Maize and Cassava: Post-Harvest Losses in Nigeria
Executive Summary and Conclusion                                                                                            7

The main reasons for losses of gari at the marketing level      the FAO currently only defines food products which were
are moisture (4.5%) and rodents (2.5%) during storage,          originally meant for human consumption and are then
whereas transportation accounts for around 2.5% of losses.      used for other purposes (e.g. feed, biofuel) as “food waste”,
                                                                this study also considers losses along the value chain of
Losses during starch production are significant, amount-        maize for feed production. Maize is a very important feed
ing to nearly 12%. The most significant losses occur            in Nigeria and its affect food security indirectly because
during processing of tubers (5.5%) and during storage of        it competes with the production and use of maize for hu-
starch (6.3%).                                                  man consumption.

Extrapolation of the losses from the assessment to the          In the case of maize destined for human consumption,
whole of Nigeria indicates that they are significant in         farmers harvest the crop when it is fully ripe. Green
both, gari and starch value chains. Loss of fresh cas-          maize is harvested before the grain has ripened. Maize
sava tubers at the farm gate and during gari processing         to be sold as grain is allowed to dry on the plant and is
amounts to more than 6.3 million mt, corresponding to           then further sun-dried to reduce the moisture content
annual mean losses of 37 kg per capita5. This does not          and shelled by hand. Shelled grain is bagged and stored
include losses of gari during and after processing, which       until the time of sale. Trade in maize grain is dominated
amount to around 800,000 mt a year and losses in cassava        by grain merchants. Retailers buy the product from the
starch production of around 106,000 mt per year. The            wholesale markets and sell it to consumers in small
total sum of monetary losses of cassava at the farm gate        quantities.
and during processing, storage, transport and marketing
amounts to 144 billion Naira, which corresponds to              The farmers identified four main causes of losses. The
EUR 686 million.                                                most significant losses occur before harvesting and are
                                                                attributed to pests and disease. As these are not strictly
Maize is cultivated in the forest, derived savannah and         post-harvest losses, they have not been further con-
southern Guinea savannah zones of Nigeria as a sole or          sidered in the study, but the issue should be addressed
mixed crop. It is harvested either as green maize or maize      in any integrated approach to increasing agricultural
grain. The major end-users of maize are feed and flour          productivity. Losses during harvesting were estimated at
mills. The feed mills supply the poultry and aquaculture        4.03% of the total harvest, while shelling, storage of dry
industry while the products of the flour mills are meant        maize cobs and dry maize grain and transport of fresh
for direct human consumption. The value chain exam-             maize to the market entailed losses of between 1.53% and
ined in detail in this study is feed production. Although       2.27%. Altogether, losses at farm level were around 13.7%.

5 Population of Nigeria approximately 167 million in October 2011, German Federal Foreign Office
8                                                                                              Executive Summary and Conclusion

Figure 2: Synopsis of losses in the maize value chain

                                                      Losses along the maize value chain

                                   Farm
                                   9.83%

                                                                    Transport of fresh maize to market
                                      Harvest                                      1.95 %
                                      4.03%

                        Shelling                Storage dry
                         1.53%                   maize cob
                                                  2.27%

                                                               Transport to market                            Storage market
                                                                     3.7 %                                        22.9 %
                   Storage dry maize grain                                                     Spillage       Rodents       Weevils      Moisture
                            2.0%                              Transport to feed miller          5.0%           6.0%          8.5%         2.5%
                                                                      2.0 %

                                                Feed miller (storage)                     Transport of feed                  Storage of feed
                                                      5.8 %                                    3.0 %                              4.0%

                                                                                                                        Spillage 2.0%   Weevils 2.0%
                                    Spoilage 2.0%      Rodents 2.8%      Weevils 1.0%

The most significant losses in the maize value chain                                 a mean per capita loss of 11.6 kg. Feed milling and feed
occur at the marketing stage (26.6%), mostly due to                                  marketing account for around 233,600 mt of feed losses.
storage problems (spillage, rodents, weevils (Sitophilus                             The total sum of monetary losses in maize value chains
zeamais) and moisture) and to a lesser extent during                                 amounts to around 120 billion Naira, which corresponds
transportation (3.7%).                                                               to approximately EUR 576 million.

Feed millers cited storage of grain (5.8%) and storage of                            Options for food loss reduction
feed (4%) as the most important areas in which losses                                Technology: Inappropriate technology appears to be the
occur. Transportation accounts for 3% of losses. Total                               dominant cause of food losses. In the case of cassava,
losses at the feed miller level amount to 12.8%.                                     areas requiring attention are harvesting, peeling and
                                                                                     storage of fresh cassava tubers and efficiency in grating
The mean period of storage of maize grain before mill-                               and milling. In the case of maize, areas requiring atten-
ing is 8.8 weeks and the period before spoilage begins                               tion are bagging, transportation and storage (especially
to manifest is around 4.0 weeks. The length of time that                             hygiene). Appropriate technologies could be developed
products can be stored before spoilage starts to set in is                           through collaborative research projects conducted by
3.0 months.                                                                          public and private actors, focussing, for example, on the
                                                                                     development of a cassava peeling machine. Appropriate
Losses of green and dry maize cobs at the farm gate                                  packaging and transportation arrangements would have
amount to 194,276 mt per year, while 257,885 mt of                                   to be made for the transportation of semi-finished prod-
maize grain are also lost annually. The biggest losses                               ucts to the starch factory.
occur during the marketing stage, which accounts for
1,943,271 mt of maize grain per year. This corresponds to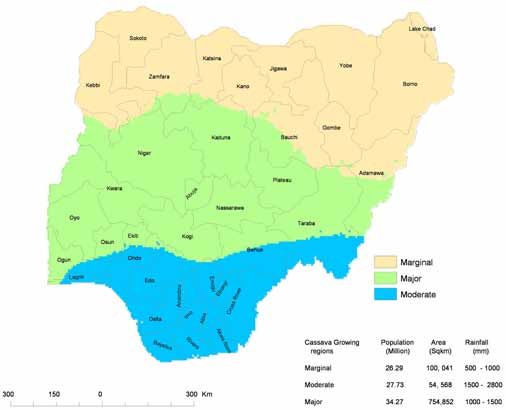
Executive Summary and Conclusion                                                                                       9

Organisation of farmers and the value chain: Due to the      industrial or food-grade starch. The transportation of
decline of farmers’ organisations and cooperatives, farm-    fresh tubers to pre-processing centres that are only a
ers no longer have the capacity to influence the produc-     short distance away would reduce the potential for loss
tion, processing, transportation and marketing of agri-      and minimise the cost of transporting water and fibre
cultural commodities. Farmers can pool their resources       (wastes) along with the cassava.
and create economic incentives to improve transporta-
tion and storage facilities, thus helping to reduce food     Market: Poor market infrastructure and marketing sys-
losses and enhance their own incomes. As groups and          tems contribute to significant losses, especially in maize
cooperatives, they will be able to receive credit from       value chains. In recent times there have been attempts
agricultural financial institutions or advance payments      in some states to improve market infrastructure. Within
from buyers of their produce. It would be advisable for      markets, sections are often created for specific agricul-
the Department of Cooperatives at the state and federal      tural products. It should therefore be easy to address the
levels to collaborate with the State Offices of the          market operators for each type of agricultural product in
Nigerian Ministry of Agriculture and Rural Development       a targeted manner.
to promote farmers’ organisations.
                                                             Standards for handling and processing of agricultural
Processors, public sector actors and donors should           raw materials (maize grain and cassava tubers) should
collaborate in promoting and strengthening farmers’          be established and appropriate informational materials
organisations and cooperative societies and linking          developed to teach actors along the value chain about
them with processors to create efficient commodity           appropriate handling, packaging, transportation and pro-
supply chains that could reduce losses in the production,    cessing techniques that will minimise losses in the value
processing, transportation and marketing of maize grain      chains while ensuring cost effectiveness.
and cassava tubers.
                                                             Human capacity development: Appropriate advocacy and
Processors of cassava tubers should work with Agri-          training can be provided to operators in the wholesale
cultural Development Programmes in specific states to        and retail sections of the gari market to improve the
develop out-grower schemes, which could be used to           handling (especially bagging) and storage of the product
provide farmers with inputs and technical guidance for       with a view to maintaining quality and reducing physical
efficient cassava production, while the processors           losses.
undertake the harvesting, collection and transportation
of fresh tubers at maturity.                                 A thorough cost-benefit analysis is the basis of economi-
                                                             cally sustainable investment. Low prices for commodities
Infrastructure: Poor transportation and storage facili-      frequently restrict investment in improving post-harvest
ties and lack of other infrastructure contribute to losses   management. In many cases, accepting losses is cheaper
in value chains. Areas to focus on are infrastructure for    than investing in protection. Technology transfer and
transportation, storage and marketing that is appropri-      training can only be successful if there is genuine eco-
ate to the tropical environment and the road network. It     nomic benefit for the farmers. Whether this benefit is
appears there are currently no economic incentives for       generated through higher market prices or, for an in-
private sector operators to deploy appropriate vehicles      termediate period, through state support and subsidies
for the transportation of farm-fresh products in Nigeria.    depends on the situation. Innovations often need initial
The establishment of small-scale pre-processing centres      support in order to become accepted and widespread, but
located among clusters of cassava farmers and/or             they should be always based on sound economic analysis.
farming communities, and thus close to the farm gate,
would allow cassava to be transformed into semi-             The steady increase in food prices over recent years
finished, dewatered starch products which could then         would seem to offer the right impetus for investment in
be transported to starch factories for processing into       post-harvest management.
10                                                                                                        Introduction

1 Introduction

1.1     Aim of the study                                         As Figure 3 shows, the distribution of losses across the
                                                                 value chain in developed economies differs from that in
The aim of this study is to improve the availability of          developing economies. In the latter, more losses occur
data on food losses in important food value chains in the        towards the production stage, while in the developed
showcase country of Nigeria, more precisely the north-           economies more occur towards the consumption stage.
ern state of Kaduna and the southern state of Ondo. The
study aims to contribute to methodological discourse             A review of existing literature on the subject showed that
on the assessment of food losses and to identify options         accurately monitoring food losses continues to represent
for German Development Cooperation to engage in                  a considerable challenge. There are a number of reasons
food loss reduction programmes.                                  for this, the most important being major differences in
                                                                 crops, the multiplicity of routes a typical crop can fol-
1.2	Concept of food losses                                       low from farm to end-user and the time it takes a crop
                                                                 to reach the end-user. The situation for cereals differs
Each year, a significant proportion of food produced for         significantly from that for roots and tubers. There are
human consumption is lost or wasted. Annual losses               also variations among the cereals, with the handling and
have been estimated at about 1.3 billion tonnes. In light        processing routes for maize, for instance, deviating sig-
of rising food prices, growing pressure on natural re-           nificantly from those that other cereals pass along. Simi-
sources and severe famine in parts of eastern and west-          larly, the handling of maize harvested when green is very
ern Africa in recent years, avoidable loss and wastage of        different from that of maize harvested as grain.
food cannot be tolerated. The world’s natural resources,
such as soil, water, energy and nutrients, are limited, and      The term ‘food loss’ can refer to a loss of quantity and/or
must be used in a more efficient and responsible manner.         quality. Loss of quantity is measured in terms of weight
                                                                 and volume while loss of quality requires subjective
The term food wastage, as used by the FAO, encompasses           evaluation, in most cases in the absence of appropriate
both food loss and food waste. Wastage occurs along the          standards and tools. Loss of weight due to a reduction in
entire food/value chain and varies in extent depending           moisture content cannot be described as loss since the
on the product and region (FAO 2011)6. In developed              nutritional quality of the food remains intact. The term
countries, food waste arises at the consumer stage and           ‘damage’ refers to loss which affects quality more than
concerns food which is processed and ready to eat. In            quantity, though this loss may still result in economic
developing countries, food losses occur at the post-             loss. A frequent form of damage is broken grain. In addi-
harvest stages (Godfray et al., 20107).                          tion to these, losses can occur as a result of spillage from
                                                                 bags, consumption by pests, deterioration and road ac-
This study focuses on food losses at the pre-harvest,            cidents during long distance transportation.
harvest, post-harvest and processing stages, which are
most relevant in developing countries. Pre-harvest               The main reason why previous projects aiming to avoid
losses are not further considered in this study, because         food losses have not succeeded is that they have given
preventing them would require specific crop protection           insufficient consideration to the complexity of causes.
measures. Post-harvest losses take place at the time of          Solutions have therefore been too narrow in focus. The
harvest and during various post-harvest operations from          underlying causes of food losses (drivers) have to be fully
the farm gate to the first level of the market. They can be      investigated in order to understand why farmers and
of physical nature (weight and quality) and/or economic          other economic operators act the way they do. The public
nature (loss of value due to bad storage facilities or infor-    and private sectors should share the investment costs
mation systems). Losses in food value chains are highly          and risks involved in carrying out targeted interventions.
variable, ranging from 5% to 30%.                                It should also be borne in mind that the economic impli-

6 Food and Agriculture Organization of the United Nations, Rome, 2011: Global food losses and food waste extent: causes and
prevention
7 Godfray, H. C. et al. 2010: Food Security: The Challenge of Feeding 9 Billion People; Science, 12 February 2010, 327
Introduction 11
Figure 3: Wastage of food products along the supply chain (WEF)8
Developing Developed
countries Planted crop countries
Pre -harvest losses
26-40%
Ready to harvest crop
Harvesting and processing losses
12-21%
Raw material
Secondary processing losses
10-50% 1-10%
Processed food
Retail losses
2-26%
Food at consumer
Consumption losses
0-10% 3-40%
Eaten food
cations of post-harvest losses (PHL) can motivate opera- Value chain analysis is a useful strategy in understand-
tors along the value chains to reduce these losses for the ing overall trends of industrial reorganisation. It can be
sake of their own profitability. used to identify key players, change agents and leverage
points for policy and technical interventions. Value chain
analysis involves breaking a process into its constituent
1.3 Concept of food value chain parts in order to better understand its nature, structure
and functioning. Actors at each stage of the chain are
A value chain is a sequence of related business activities identified, along with their functions and relationships.
(functions), beginning with the provision of specific in- This knowledge facilitates and strengthens efforts to in-
puts for a particular product, moving through the phases fluence the chain.
of primary production, transformation and marketing,
and ending with the final sale of the product to consum- The flow of goods, information and finance through
ers. the various stages of the chain is evaluated in order to
detect problems or identify opportunities to improve
The enterprises (operators) performing these functions the contribution of specific actors and the overall perfor-
comprise producers, processors, traders and distributors mance of the chain. The analysis usually goes beyond the
of a particular product. These enterprises are linked by production stage. It examines interactions and linkages
a series of business transactions as the product is passed among key players as well as between the business and
on in stages from primary producers to end consumers. policy environment.
These stages represent the links in the value chain.
8 World Economic Forum, Driving Sustainable Consumption: Value Chain Waste - Overview Briefing;
https://members.weforum.org/pdf/sustainableconsumption/DSC%20Overview%20Briefing%20-%20Value%20Chain%20Waste.pdf12 Introduction
Table 1: Generic food supply chain and examples of food wastage9
Stage Examples of food waste/loss characteristics
Edible crops left in field, ploughed into soil, eaten by birds, rodents, timing
of harvest not optimal: loss in quality
Harvesting – handling at harvest
Crop damaged during harvesting/poor harvesting technique
Outgrades at farm to improve quality of produce
Threshing Loss through poor technique
Drying – transportation and distribution10 Poor transport infrastructure, loss owing to spillage/bruising
Storage Pests, disease, spillage, contamination, natural drying out of food
Primary processing – cleaning, classification, Process losses
dehulling, pounding, grinding, packaging,
soaking, winnowing, drying, sieving, milling Contamination in process causing loss of quality
Secondary processing – mixing, cooking, frying, Process losses
moulding, cutting, extrusion Contamination in process causing loss of quality
Product evaluation – quality control: standard
Product discarded/outgrades in supply chain
recipes
Inappropriate packaging damages produce
Packaging – weighing, labelling, sealing Grain spillage from sack
Losses caused by rodents
Damage during transport: spoilage
Marketing – publicity, sale, distribution Poor handling in wet market
Losses caused by lack of cooling/cold storage
Plate scrapings
Post-consumer recipes elaboration: traditional Poor storage/stock management in homes: discarded before serving
dishes, new dishes product evaluation,
consumer education, discards Poor food preparation technique: edible food discarded with inedible
Food discarded in packaging: confusion over 'best before' and 'use by' dates
End of life – disposal of food waste/loss at Food waste discarded may be separately treated, fed to livestock/poultry,
different stages of supply chain mixed with other wastes or land-filled
9 Parfitt, J.,Barthel, M., and Macnaughton, S. (2010). Food waste within food supply chains: quantification and potential for
change to 2050. Phil. Trans. R. Soc. B 2010 365, 3065-3081. References doi: 10.1098/rstb.2010.0126
10 Drying usually takes place on the farm and/or farmstead. The grain must also be transported to a storage facility and loss
can occur in this process.Introduction 13
Figure 4: Generic elements of a basic linear value chain11
Basic functions (chain links)
Provision of
Production Transformation Trade Final sale
specific inputs
Provide -Grow -Classify -Transport Specific consumer
- equipment -Harvest -Process -Distribute market
-inputs -Dry -Pack -Sell
Categories of chain operators and their relations
Specific input Primary Logistics centres, Final sale point
Traders
provider producers Industry / Retailer
11 GTZ (2007), Value Links Manual: The Methodology of Value Chain Promotion, First Edition14 Methodology
2 Methodology
This study has been based essentially on information Wherever information was available, previously docu-
from primary and secondary sources. Most of the in- mented input-output data were used. This was neces-
formation on cross-sector value chain institutions and sitated by the fact that different measures were being
policy issues was obtained from secondary sources while used for business transactions across the sampled states,
the information on enterprise-specific value chain issues meaning prices and quantities were difficult to standard-
and the percentage of food losses at different levels came ise. Various measures are currently in use, such as heaps,
from primary sources. A specially designed questionnaire portions and baskets of cassava tubers; kongos (mudus)
was developed to collect field data from actors along and basins of gari; baskets, wheelbarrows and pick-up
cassava and maize value chains (questionnaires can be vans of cassava, etc. This made it difficult to compute an
found in annexe IV). These actors comprise cassava farm- appropriate and representative cost and returns frame-
ers, starch processors, marketers of cassava tubers, gari work based strictly on the field data. Efforts were there-
processors, maize farmers, marketers of maize grain and fore made to obtain standard measures and prices from
feed millers. The data collected were reviewed and the other sources. For example, rather than working with 200
information required to address the specific aspects of heaps of cassava at a farm gate price of ₦ 5,000, we used
the study was extracted and utilised. the prevailing cassava tuber purchase price of ₦ 9,000
per mt set by MATNA Foods Company, a starch factory
For each actor surveyed, variables on costs, returns, post- in Ondo State. To convert prices for gari from Naira per
harvest losses (PHL), storage, transportation, production, kongo to Naira per kg, we ascertained the weights of dif-
etc. were solicited from respondents. To adequately esti- ferent kongos of gari and found out that a kongo of gari
mate the net benefits of the ventures focused on in the weighs 1.1 kg on average. We also found that a kongo of
study, certain assumptions were made regarding aspects dry maize grain weighs 1.25 kg on average. This informa-
such as soil quality and agronomic practices. Smallholder tion, coupled with the price data collected from the field,
cassava yield ranges between 8 and 12 metric tons (mt) was used to calculate and confirm the price of gari and
per hectare (ha). However, on experimental stations, the maize per mt. A further finding was that a pick-up van of
yield could exceed 20 mt per ha. cassava tubers was equivalent to 400 heaps, which trans-
lates to 4.08 mt.
Table 2: Traditional measures and their metric conversions
Product Local measure unit Respective value in Kilograms (rounded)
Cassava tubers 1 Pick-up van (≈ 400 heaps) 4080
Maize grain 1 Kongo 1.25
Gari 1 Kongo 1.1
A comprehensive review of existing literature was The value chain maps for cassava and maize were devel-
carried out. Subject areas covered included production, oped based on the literature review. The system bounda-
processing, handling, storage and marketing of cassava ries are delineated, in line with Gustavsson et al. (2011)12,
and maize, value chain analysis, post-harvest losses and as field (agricultural production), farm storage facilities
food waste. (post-harvest handling and storage), farm industry (pro-
cessing and packaging), wholesale and retail markets (dis-
tribution) and household food services (consumption).
12 Gustavsson, J., Cederberg, C., Sonesson, U., Otterdijk, R. and Meybeck, A. (2011): Global Food Losses and Wastes, Swedish
Institute for Food and Biotechnology (SIK), Gothenburg, Sweden and FAO, Rome, ItalyMethodology 15
Specific potential respondents within the value chain therefore could not complete the questionnaire without
were targeted for data collection in accordance with assistance. A multistage sampling technique was adopted
these boundaries. to select the farmers that would constitute the sample.
In the first stage two states which are major producers of
Data were collected from published sources, through key cassava and maize were selected. These were Ondo in the
informants and focus group interviews and where neces- south and Kaduna in the north. In each of the two states,
sary through the use of questionnaires and/or surveys. two local government areas which are high producers
Data collection covered major participants along the of cassava and maize were selected. The study was thus
value chain, the major sources and causes of losses and carried out in four local government areas. Lists of cas-
waste, and information on loss quantities. Other infor- sava and maize farmers were obtained from the respec-
mation collected included costs and returns for various tive Agricultural Development Programme (ADP) and
players in the value chain. To collect data from the farm- 50 cassava farmers and 50 maize farmers were randomly
ers, specific questionnaires were developed (annexe IV). selected for each local government area, making a total
The questionnaire was used as an interview guide by of 200 cassava and 200 maize farmers. As shown in Table
trained enumerators to elicit information from the farm- 3 below, other specific actors along the value chain were
ers, since many of the farmers were not able to read and also interviewed.
Table 3: Number of respondents in each sample
State Ondo Kaduna Total
Local government area Ifedore Akure North Lere Gema
Maize farmers 50 50 50 50 200
Cassava farmers 50 50 50 50 200
Gari processors 10 10 5 5 30
Maize grain marketers 2 2 10 10 24
Fresh cassava tuber marketers 10 10 5 5 30
Feed millers 6 2 8
Cassava starch processors 15 10 25
Total 517
The data that were collected from cassava and maize 4. Extent of mechanisation - type of farm machinery
farmers to determine the environmental footprint of used and for which operations
food losses include:
5. Crop rotation – crop succession on the same plot
1. Type and quantity of fertiliser used per unit area
6. Type of transport and distances usually covered to
2. Cropping system: mono-cropping/mixed cropping reach the store/warehouse, market, retailer, etc.
(crop combinations, percentage of mixture with
other crop)
3. Type and quantity of pesticides and fertilisers (if any)
used per unit area16 Methodology
There appears to be no generally accepted methodology Measurement on the other hand is a more precise quan-
for determining post-production losses in root/tuber titative observation with less subjectivity. With meas-
crops. A publication by the National Academy of Sciences urements there is a high expectation of reproducibility
(USA) from the year 1978 on post-harvest losses13 makes without observer bias.
the following differentiation between assessment,
measurement and estimation of losses: In light of the above, and considering the expected deliv-
erable of this study in respect of quantitative and quali-
Assessment is a rough quantitative approximation of food tative analysis of food losses, the work was undertaken
loss or the characterisation of the relative points of loss as an ‘assessment of food losses’, using structured ques-
in a particular food supply system. This approach implies tionnaires to elicit information from farmers, marketers
a measure of subjectivity resulting from a lack of suffi- and processors (especially in the case of cassava). For
cient information. industrial users and other actors along the value chain,
consultation with experts and key informant interviews
were conducted.
13 National Academy of Sciences: Post-harvest Food Losses in Developing Countries. Washington D.C. 1978, 202p.CASSAVA 17
3 Cassava
3.1 Cassava in Nigeria production in West Africa. From 1990 to 2005, Cassava
production increased from around 20 million mt to
Cassava is a tuber crop that is grown and consumed around 45 million mt, before falling to around 37 mil-
across all the agro-ecological zones in Nigeria. With an lion mt in 2010 (see Figure 6). Cassava is produced across
annual production of over 40 million mt, Nigeria is virtually all Nigeria’s agro-ecological zones (NBS, 2007)14.
widely acknowledged as the largest producer in the However, the major growers are the Middle Belt states of
world, also accounting for over 70% of the total the Federation (Figure 5).
Figure 5: Cassava growing regions in Nigeria15
Cassava growing regions
14 NBS (2007) Filling the Data Gaps, National Bureau of Statistics
15 Ezedinma (2006) Structure and Profitability of Cassava Enterprises in Nigeria, paper presented at the Root and Tuber
Expansion Programme (RTEP) Training Workshop on Rural Enterprise Management and Community-Driven Development at
ARMTI, Ilorin18 CASSAVA Figure 6: Output of cassava in Nigeria (1990 – 2010)16 There are different varieties of cassava with different tion and herbicide spraying, all other farm activities are attributes and yield levels. Where maize seed can eas- conducted manually and largely by groups of externally ily be procured from input suppliers, it is often difficult sourced day labourers working with machetes and hoes. to obtain stem cuttings for cassava. Farmers tend to use stem cuttings from past harvests from their own fields Fertiliser is not commonly applied. However, where or from friends and family members. Sometimes they cassava and maize are intercropped, the maize may re- are forced to buy them from other farmers. Most farmers ceive some fertiliser from which cassava also benefits. find it difficult to distinguish between the different Generally, the belief is that cassava can perform well varieties of cassava just by looking at the stem cuttings. without fertiliser. Cassava is cultivated either as a sole crop or mixed The harvest is brought in within 12-18 months of the with other crops. In mixed cassava-maize plots, maize planting period. Due to the highly perishable nature of is usually planted first. When the maize is fully grown, cassava tubers, harvesting of the tubers is staggered in the cassava cuttings are planted on the same ridges as a manner that is consistent with household needs and the maize. After the maize is harvested, the cassava takes market demand. over the field completely. The cost of land preparation and initial weeding is thus shared between maize and The two broad markets for cassava in Nigeria are tradi- cassava. Under standard agronomic practices, 10,000 tional food and industrial products. Most of the cassava ridges (stands) are planted per ha. Whether it is grown as grown in Nigeria is processed and sold as traditional a mixed or sole crop, cassava cultivation is very labour food. Just as production of cassava is spread across all intensive. It comprises four main activities: land prepa- Nigeria’s agro-ecological zones, so too are the markets ration (clearing, packing); planting (laying-out, tilling, for the common cassava food products, especially gari. planting); weeding/farm maintenance and harvesting/ However, the market is particularly dense in the south- transportation for off-farm activities. With the excep- ern states of the Federation (see Figure 7). tion of value-chain-operators involved in land prepara- 16 FAOSTAT 2012
CASSAVA                                                                                                                                    19

Figure 7: Gari destination markets in Nigeria17

                                                                                             Rural market for Gari

The industrial product market for cassava includes the                    and the Roots and Tubers Expansion Programme (RTEP).
starch, food-grade ethanol and cassava flour markets.                     They all provide stem cuttings: the most significant
Of the three markets, the starch market is the most pro-                  input after labour. Cassava cultivation is dominated by
nounced. It comprises the native starch and the modified                  smallholder farmers and household members who are
starch markets (Knipscheer, 2003)18. Most of the indus-                   engaged in both upstream (production) and downstream
trial players in this market are also concentrated in the                 (homestead processing and marketing) activities. Differ-
southern states of Nigeria.                                               ent levels of processing can be observed. These include
                                                                          homestead processing by farmers’ wives, commercial
                                                                          processing by women who buy tubers for processing and
3.2      Cassava value chains                                             selling in product form, and toll processing in which spe-
                                                                          cialised professionals provide peeling, milling (grating),
The cassava value chains examined in this study were                      pressing and frying services. There are also some indus-
selected based on a review of existing literature, consul-                trial processors who buy cassava on a large scale for pro-
tation with experts, and previous field work done in the                  cessing into starch and other derivatives for use in other
context of this study.                                                    industries as well as gari,fufu and lafun for the domestic
                                                                          market. Between these actors there are middlemen and
The critical input suppliers for cassava cultivation are                  women who perform various marketing functions.
farmers, international research institutions (such as IITA
or CIAT), Agricultural Development Programs (ADPs),

17 Ezedinma, C., Ojiako, I. A., Okechukwu, R. U., Lemchi, J., R., Umar, A. M., Sanni, L., Akoroda, M., Ogbe, F., Okoro, E., Tarawai, E., and
Dixon, A. (2007). The cassava food commodity market and trade network in Nigeria. IITA, Ibadan, ISBN 978-131-200-5. 296 pp.
18 Knipscheer (2003) Opportunities in the Industrial Cassava Market in Nigeria, Winrock/IITA
20 CASSAVA
The value chain map for cassava is presented in Figure 8, For the purpose of providing a detailed description of
and is supplemented by a functional analysis of key vari- the traditional and industrial sectors, the following value
ables (Table 4). The map indicates the operators and the chains will be considered:
products at each stage of the value chain. It also shows
links between the operators across the stages. As shown i. fresh cassava tubers passing through the marketing
in the map, the end products of cassava transformation and processing stages and reaching households as
in Nigeria are gari, lafun, fufu19, composite flour, textiles, gari;
starch, glucose syrup, medicines, livestock feed and alco-
hol. These products emanate from both traditional and ii. fresh cassava tubers passing through the marketing
industrial sectors in the cassava value chain. and processing stages and reaching industry as starch.
These end products (gari and starch) are the most traded
of all the cassava products in Nigeria.
19 Gari is a creamy white, partially gelatinised, roasted, free flowing granular flour with a slightly fermented and sour flavour. Fufu
is a fermented wet paste widely consumed in eastern and south-western Nigeria. Lafun is a whitish cassava powder which is mixed
with hot water to form a paste and is widely consumed in south-western Nigeria.Figure 8: Cassava value chain map
CASSAVA
Post Harvest End-Users/
Inputs On-Farm Handling / Primary Marke ng/
Stage Supply Produc on marke ng Processing Trading Consumers
Credit
Households
Providers Farmers
Research Middlemen Tex
le
Farmers Co age
Ins tutes /women industries
Middlemen entre-
/women preneurs
Stem Pharma-
Cu
ng ceu
cal
Suppliers companies
Operators
Agro Pulp, paper
Chemical &
Dealers packaging
Industrial
Agro- companies
Equipment Industrial processors Industrial
Dealers processing
processors processors
companies
Labour Other
Suppliers industries
Garri, Lafun,
Garri, Garri, Fufu, Composite
Chips, Lafun, Chips, Lafun, flour, Tex
les,
Product (s) Inputs Cassava Tubers Cassava Tubers Fufu, Starch, Fufu, Starch, Glucose syrup,
Flour Flour Drugs, Livestock
feed, Alcohol
2122 CASSAVA
3.2.1 Cassava production
The field survey carried out in the course of this study yielded information on the key variables of cassava production
(Table 4).
Table 4: Description of key variables in cassava production per average cassava farm
Variable Mean
Farm size (all crops) ha 3.75
Farm size (cassava) ha 1.22
20
Quantity of cassava cuttings (pick-up van) 3.91
Amount spent on cassava cuttings (₦) 8,046.79
Distance from household residence to farm (km) 4.18
Quantity of fertiliser applied (kg) 109.68
Amount spent on fertiliser (₦) 9,948.39
Quantity of insecticide (l) 1.80
Amount spent on Insecticides (₦) 1,513.82
Quantity of fungicide (l) 3.60
Amount spent on fungicides (₦) 684.00
Quantity of herbicide (l) 2.66
Amount spent on herbicides (₦) 4,395.33
Amount of damaged tubers during harvest (%) 4.95
Yield of cassava tubers in a year with very good weather (mt/ha) 7.64
Yield of cassava tubers in a year with normal weather (mt/ha) 5.06
The table shows that the mean size of cassava farms was 3.2.2 Cassava processing
1.22 hectares. The yield of cassava tubers was 7.64 tonnes 3.2.2.1 Gari
in years with very good weather and 5.06 tonnes in years Gari is the most popular product made from cassava tu-
with normal weather. The table reveals that cassava bers. In recent years, it has become the most important
farmers applied fertilisers and other agro-chemicals. Fer- staple food consumed in the southern states of Nigeria.
tilisers and agro-chemicals are even more used in maize It is also consumed in some of the states in the north of
production. When the maize is later inter-cropped with the country. It comes in two forms – creamy white or
cassava, the cassava crop also becomes a beneficiary of yellow. The creamy white form is more common. It is
the fertilisers and other agro-chemicals. partially gelatinised, roasted, free-flowing granular flour.
The white form of gari has a slightly fermented and sour
flavour.
20 One pick up van carries 40 bundles (200 stems, 1000 stem cuttings, 30 bundles are needed for one hectarCASSAVA 23
Figure 9: Stages of gari processing
1. Peeling the 2. Washing the 3. Grating into
tubers peeled tubers mash
6. Frying the 4. Fermentation
sieved particles 5. Sieving and dewatering
and cooling (pressing)
7. Packaging for
sale
Peeling continues to represent a challenge as it has not tools that are used in gari processing are shown in the
yet been successfully mechanised. The equipment and following pictures (Figures 10 – 15).
Figure 10: Cassava peeler (FUTA AKURE)21 Figure 11: Cassava peeler (IITA & ARCEDEM)22
21 + 22 Ezedinma (2006), Structure and Profitability of Cassava Enterprises in Nigeria, Paper Presented at the Root and Tuber
Expansion Programme (RTEP) Training Workshop on Rural Enterprise Management and Community-Driven Development at
ARMTI, Ilorin24 CASSAVA
Figure 12: Cassava hand peeler23 Two main types of equipment are available at the centres
for use under a hire arrangement. There is a motorised
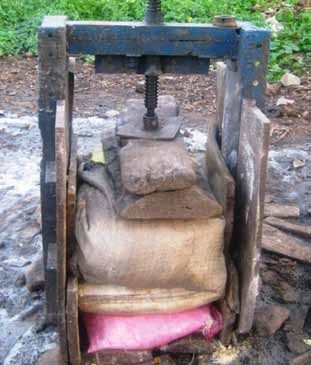
mechanical grater (mill) and a screw press for dewatering
the cassava mash. These are two critical stages that can
slow down the processing of cassava into gari. A diesel
lister engine serves as the source of power for the motor-
ised mechanical grater. The lister engine for grating is the
costliest item of equipment used.
The price per kg of gari at the processing centre was
Gari processing is undertaken using traditional (house- ₦ 78 while the corresponding market price was ₦ 118.30
hold processors) and mechanical or commercial meth- (2012).
ods. The traditional equipment includes manual hand
graters, stones/logs for dewatering, manual sieves and Figure 14: Cassava grater and lister engine24
local gari fryers.
Figure 13: Gari frying24
There are specialised processing groups comprising
mainly women (normally 5-6) that carry out all the
processing activities. Usually three of the women are
dedicated to frying. The groups are paid according to the
number of cassava loads processed, the quantity pro-
duced, the wage for a day’s labour or payments in-kind
(gari) and are often found at the commercial processing
centres.
23 Ezedinma (2006), Structure and Profitability of Cassava Enterprises in Nigeria, Paper Presented at the Root and Tuber
Expansion Programme (RTEP) Training Workshop on Rural Enterprise Management and Community-Driven Development at
ARMTI, Ilorin
24 Kindly provided by Dr. Adegboyega Eyitayo OguntadeCASSAVA 25
Figure 15: Cassava grater25 3.2.2.2 Starch
Starch is the major constituent of cassava tubers. Litera-
ture indicates that cassava roots have a starch content of
between 25-35% depending on their age. The starch has
thickening and binding qualities which are used in the
food and beverage industries and in the manufacture of
convenience and baby foods. Starch is also an important
raw material for textile and pharmaceutical products.
Furthermore, the modified starch dextrin, which has ad-
hesive properties, is commonly used in the pulp and pa-
per industries in the production of corrugated cardboard
and cartons for packaging as well as in the furniture and
plywood industries.
Starch is produced using traditional and industrial
methods. Some elements of the traditional process are
similar to those used in gari manufacturing. The
activities involved in the production of starch are:
25 Ezedinma (2006), Structure and Profitability of Cassava Enterprises in Nigeria, Paper Presented at the Root and Tuber
Expansion Programme (RTEP) Training Workshop on Rural Enterprise Management and Community-Driven Development at
ARMTI, Ilorin26 CASSAVA
Figure 16: Stages of starch processing
1. Peeling the 2. Washing the 3. Grating into
tubers peeled tubers mash
5. 4. Mixing with
6. Drying Sedimentation water and
of starch sieving
7. Packaging
for sale
As is the case for gari processing, grating can be carried MATNA has an integrated plant with a capacity of 4,500
out manually using hand graters. Alternatively, there are mt of food grade starch per year. In 2012, MATNA bought
mechanical graters powered by lister engines (mills). cassava tubers at ₦ 9,000 per metric ton at the factory
gate. Its customers include multi-national food process-
Industrial manufacturers of starch in Nigeria include ing companies, such as Nestlé and Unilever, who use the
MATNA in Ogbese, Ondo State, Sunshine Cassava starch as binders in the manufacture of food seasoning
Processing Factory in Ondo, Ondo State, Nigerian Starch products. Non-food manufacturing companies use starch
Mill in Ihialla, Anambra State and Peak Starch Factory in in the production of dry cell batteries, mosquito repel-
Abeokuta, Ogun State. lent coils, and packaging glue.
Figure 17 shows the flow of mass from fresh cassava
tubers to gari and starch.CASSAVA 27 Figure 17: Mass flow from fresh cassava tubers to gari and starch
28                                                                                                                 CASSAVA

3.2.3	Cassava marketing                                         Starch trade at commercial level is more significant than
There is some trade in fresh tubers but it is not as wide-      that at subsistence and retail level. This is due to the large
spread as trade in gari and starch. Farmers usually sell        demand for starch in industry which cannot be met
their cassava as stands on the farm. Harvesting is the          locally. Large-scale industries tend to buy directly from
responsibility of the buyer and to that extent it is also the   processors such as MATNA while at the same time utilis-
buyer who bears the risk of the yield. Frequently, these        ing the services of contract suppliers. The packing indus-
customers are female entrepreneurs who then engage              tries that do not require food-grade starch rely more on
labourers to harvest and pack the cassava. They then hire       contract suppliers. Inability to meet demand for starch
vehicles to transport the goods to processing centres.          from local sources has led to Nigeria importing signifi-
There are some farmers who sell their cassava to indus-         cant quantities of corn starch each year.
trial processors like MATNA. In this instance, they bear
the cost of harvesting, packing and transportation to the
factory gate.                                                   3.3 Quantitative and qualitative
                                                                    analysis of losses in the cassava
In the case of the most traded cassava product, gari,               value chain
different operators are involved in production. These
include:                                                        When we talk about losses in the cassava value chain, we
                                                                are referring to measurable quantitative and qualitative
• household farmers/gari processors who retail at               losses in the course of transforming cassava into vari-
  subsistence level;                                            ous products. The two products under consideration in
                                                                this study are gari and starch. Quantitative loss implies
• wives of cassava farmers who sell gari as wholesalers         a reduction in the physical substance of the product, re-
  on specific market days;                                      flected in weight loss. Loss of product quality (qualitative
                                                                loss) is also important, but is more difficult to measure
• gari merchants who buy cassava on the farm and sell           and/or quantify. This is because, in the case of gari, there
  gari on a wholesale basis;                                    is a lack of quality criteria that are easily measurable and
                                                                used by consumers. In the case of starch used for indus-
• commercial millers who also sell to traders and               trial purposes, quality criteria are applied which include
  institutional buyers on a wholesale basis;                    moisture content and other impurities. Their measure-
                                                                ment requires the use of specialised equipment and is
• market traders (often women) selling gari.                    beyond the scope of this study. The focus of the study is
                                                                therefore on quantitative losses along the value chain.
These operators market varying volumes of products at
the processing centres and the markets. Competition is          3.3.1 Incidence of losses in the cassava value chain
keen and it is rarely possible for any category of operator     An investigation into the incidence of post-harvest
to control the market.                                          losses among cassava farmers yielded the information
                                                                presented in Figure 18.
You can also read