FAIRTRADE CERTIFICATION OF SUGAR CANE IN VANUA LEVU, FIJI: AN ECONOMIC ASSESSMENT - The EU-Funded Facilitating Agricultural Commodity Trade ...
←
→
Page content transcription
If your browser does not render page correctly, please read the page content below
FAIRTRADE CERTIFICATION
OF SUGAR CANE IN VANUA
LEVU, FIJI: AN ECONOMIC
ASSESSMENT
Jonathan Bower
Land Resources Division
Secretariat of the Pacific Community

          The EU-Funded Facilitating
     Agricultural Commodity Trade Project
© Secretariat of the Pacific Community (SPC) 2013

All rights for commercial / for profit reproduction or translation, in any form, reserved. SPC authorizes the
partial reproduction or translation of this material for scientific, educational or research purposes, provid-
ed that SPC and the source document are properly acknowledged. Permission to reproduce the document
and/or translate in whole, in any form, whether for commercial / for profit or non-profit purposes, must be
requested in writing. Original SPC artwork may not be altered or separately published without permission.

                                               Original text: English

                     Secretariat of the Pacific Community Cataloguing-in-publication data

Bower, Jonathan

Fairtrade certification of sugar cane in Vanua Levu, Fiji: an economic assessment / Jonathan Bower

      1. Sugarcane — Fiji.

      2. Sugar trade — Fiji.

      3. Sugarcane industry — Fiji.

I. Bower, Jonathan

II. Title. III. Secretariat of the Pacific Community

633.61099611							                                             AACR2

ISBN: 978-982-00-0652-2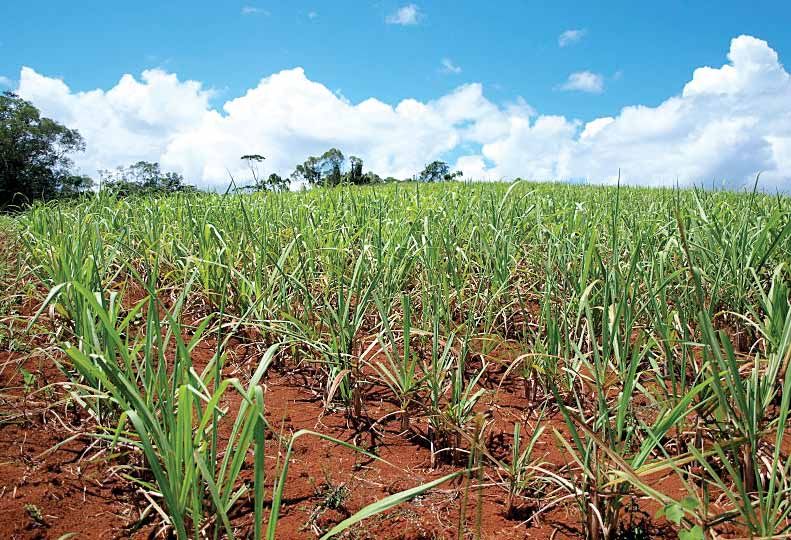
ACKNOWLEDGEMENTS

Many thanks to Mohammed Habib, former Executive Manager of LCPA and Technical Manager of the EU’s
Fiji-based Coordination Unit, who kindly answered numerous industry and technical queries; to former
Environmental Officer and current Executive Manager of LCPA, Mukesh Kumar, who offered competent logistical
support, hospitality and patience in fielding a large number of technical and data queries; and, not least, to the
sugar cane farmers of Labasa: LCPA Board members and Gang delegates offered kind hospitality and forbear-
ance in answering my questions. Thanks to Paula Holland, Manager of Natural Resources Governance at SPC’s
Applied Geoscience and Technology (SOPAC) Division, for her time, invaluable advice and comments. And much
gratitude to Dr Andrew McGregor for his peer review of the document and helpful discussion.

This publication has been produced with the financial assistance of the Facilitating Agricultural Commodity Trade
(FACT) Project, funded by the European Union and implemented by the Secretariat of the Pacific Community. The
data presented, conclusions drawn and the recommendations made are the sole responsibility of the author.

Author: Jonathan Bower, Resource Economist, Land Resources Division, Secretariat of the Pacific Community
Date of Publication: August 2012
CONTENTS

Acronyms			                                                                                      05
1.         Fairtrade Certification of Sugar cane in Vanua Levu: An Economic Assessment           06
2          Background to Fairtrade and the Fiji Sugar Industry                                   10
2.1        Overview                                                                              11
2.2        What did Fairtrade certification involve for cane sugar in Vanua Levu?                12
2.3        Background to certification and the sugar industry in Fiji                            15
2.4        Scepticism about Fairtrade certification                                              17
3.         Assessment methodology                                                                18
3.1        With and without analysis                                                             19
3.2        Perspective                                                                           20
3.3        Valuing costs and benefits                                                            20
3.4        Net present value and treatment of time                                               21
3.5        Assumptions                                                                           21
4.         Economic impact of Fairtrade certification in Vanua Levu                              28
4.1        Data sources                                                                          29
4.2        Costs and benefits of Fairtrade certification                                         30
4.3        Main results                                                                          33
5.         Sensitivity analysis                                                                  35
5.1        Fairtrade certification for 3 years                                                   36
5.2        Lower tonnage Fairtrade certified                                                     36
5.3        Lower Fairtrade Premiums per tonne                                                    36
5.4        Premium is badly spent on community projects                                          36
5.5        Pessimistic scenario                                                                  36
5.6        Optimistic scenario                                                                   37
5.7        Discount rates                                                                        37
5.8        If Fairtrade certification of sugar meant that all money goes into farmers’ pockets   37
6          Conclusion and recommendations                                                        38
Bibliography                                                                                     40
Appendix 1: Principles of Fairtrade certification                                                44
Appendix 2: Economic challenges facing the Fiji sugar industry                                   46
Appendix 3: LCPA Premium expenditure 2011 and 2012 in detail                                     51
A3.1.      Community development project case studies                                            51
A3.2.      Community development projects in 2011                                                54
A3.3.      LCPA Premium Plan, 2012                                                               56
A3.4.      Summary of Fairtrade Premium expenditure and percentages                              59
Appendix 4: Cost to the farmer per tonne of production of sugar cane, with
and without Fairtrade certification, in 2011                                                     60
Appendix 5: Full results                                                                         62
ACRONYMS

EU     European Union

FJD    Fiji dollar

FLO    Fairtrade Labelling Organisation International (also known as Fairtrade International)

FSC    Fiji Sugar Corporation

LCPA   Labasa Cane Producers Association

PMU    The European Union’s Project Management Unit, based in Lautoka

SCGC   Sugar Cane Growers Council

SPC    Secretariat of the Pacific Community

SPO    Small producer organisation

TLS    Tate and Lyle Sugars Limited

USD    United States dollar
01 FAIRTRADE
         CERTIFICATION
         OF SUGAR CANE
         IN VANUA LEVU:
         AN ECONOMIC
         ASSESSMENT

     The EU-Funded Facilitating
Agricultural Commodity Trade Project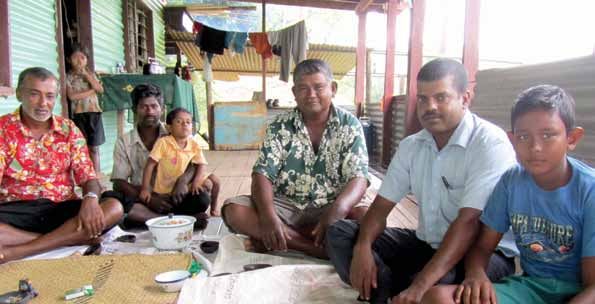
1.     EXECUTIVE SUMMARY
This study is an assessment of the benefits and costs of Fairtrade certification of sugar cane in Vanua Levu,
Fiji, from the perspective of both cane growing communities and donors. In early 2011, the Labasa Cane
Producers Association (LCPA) on the island of Vanua Levu, Fiji became Fairtrade certified, becoming the first
organisation in Fiji to receive this recognition. LCPA collected its first Fairtrade Premium funds from Fiji’s sole
sugar buyer, the British firm Tate and Lyle Sugars Limited (TLS), and sugar cane farmers and their communi-
ties in Vanua Levu began to reap benefits from the Premium funds. These benefits consisted of subsidies to
farm inputs and community development projects targeting essential infrastructure, education and sanita-
tion. Allocation of funds was democratically decided by LCPA’s Board and General Assembly, both of which
are composed solely of sugar cane growers. Furthermore, an environmental plan was put in place to phase
out the use of illegal herbicide and to spray and store existing herbicides safely. These significant benefits will
continue for the foreseeable future and are in accordance with the three principles of Fairtrade certification:
social development, economic development and environmental development.

From the farmer perspective, Fairtrade certification is not without its costs and challenges. All of the approxi-
mately 3,971 sugar cane growers in Vanua Levu are obliged to form and participate in a democratic Small
Producer Organisation, in this case the Labasa Cane Producers Association (LCPA), which entails attending a
number of training sessions conducted by the LCPA executive team of administrators who work to maintain
Fairtrade certification standards. A subset of Gang delegates, who represent Gangs of an average of 10 grow-
ers, must attend LCPA General Assembly meetings in Labasa, Vanua Levu to vote on LCPA expenditures, and
Board members must invest significant time and effort in responding to the requests of their constituents.
Farmers must change the way they store herbicides and some farmers must change the herbicides they are
accustomed to using. All farmers must continue to attend training sessions and meetings to retain certifica-
tion status. Moreover, there is a risk that certification status could be lost for Vanua Levu if key compliance
standards are not met. Given the necessary administrative organisation and the commitments required from
farmers, certification is not guaranteed a priori to be of net benefit.

Beyond the immediate perspective of farmers, the sugar cane industry in Fiji faces a number of economic
challenges, including:

•    cane yields (tonnes per acre) that are in danger of being too low to be viable for many farmers;
•    decreasing availability of land due to expiration and non-renewal of land leases;
•    land degradation;
•    migration to urban centres;
•    insufficient capital investment to maintain essential infrastructure such as railways and mill equipment;
•    natural disasters including the 1999 drought and flood damage in 2009 and 2012 in Fiji’s main cane
     growing area of western Viti Levu; and
•    a cane payment system that does not align the incentives of grower and miller and that has resulted in a
     decline in the quality of sugar cane transported to the mill in the last decade.

Moreover, the ending of the European Union’s Sugar Protocol meant that the price Fiji received for sugar
dropped by 36% on 1 October 2009, further reducing the profitability of sugar cane and increasing the pressure
to deal with fundamental industry challenges.

                                                       07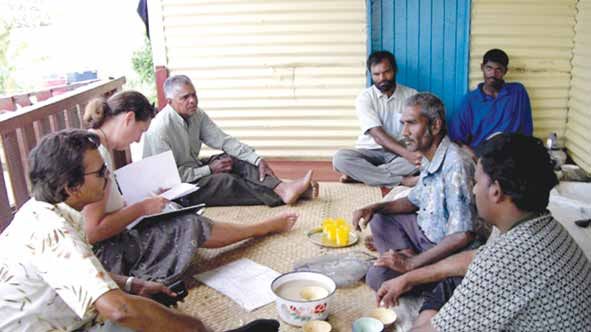
This study attempts to quantify the costs and benefits noted above of Fairtrade certification, both overall and
to sugar cane growers and their communities in Vanua Levu. The result provides firm support to Fairtrade
certification as a way to alleviate poverty in this context: the benefits of certification of sugar cane in Vanua
Levu to cane farming communities exceed the costs, including the costs to donors, by a significant margin. A
mid-range estimate of the net benefit1 of Fairtrade certification is FJD 9,094,473 with a return of an impres-
sive 6.48 dollars for every dollar invested by donors and farmers; the return on cost to farming communities
alone amounts to net benefits of FJD 9,220,459, or a return of 7.01 dollars for every dollar spent.

The most pessimistic estimate of net benefit of certification is FJD 3,339,770, with a benefit-cost ratio of 3.28,
if Premium funds per tonne unexpectedly halve from USD 60 to USD 30 from 2012 onwards, cane yield is lower
than expected, and certification lasts just 3 years. An optimistic estimate gives a net benefit of FJD 10,966,503
and a net benefit ratio of 6.66, assuming a certification period of 10 years instead of the standard 7. 2

     Photo 1: Former LCPA Executive Manager Mohammed Habib (first from left), Tate and Lyle representative Julia
     Clarke (second from left), and LCPA Chairman Shiu Dayal (third from left) discussing community needs with sugar
     cane Growers in Natabe Daku Sector, Vanua Levu, Fiji. Source: LCPA

         1 Net present value discounted at 7%.
         2 The latter two estimates are derived from sensitivity analysis, which changes uncertain parameters
           to reflect possible changes in future events in a positive or negative direction from the perspective
           of net benefit.

                                                         08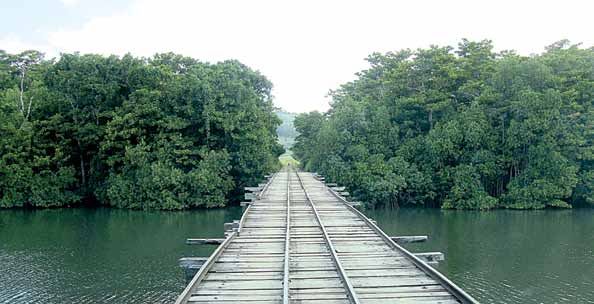
Putting these figures in some context, the Fiji Sugar Corporation (FSC) Annual Report 2011 stated that the
proceeds from sugar and molasses received by all growers in Fiji was 126,400,000 FJD in 2010 and 85,100,000
FJD in 2011, and Labasa growers constitute 30% of growers in Fiji.
Costs and benefits are documented from the overall perspective, which includes both the donor perspective
and the farmer perspective in this study. There are little or no significant costs and benefits of certification
incurred by the Fiji economy that are not listed in this study except for LCPA Executive wages and expenses
which would manifest themselves as a net benefit principally in the urban area of Labasa, capital of Vanua
Levu. All costs of certification that were not immediately paid for by Fairtrade Premium funds – including initial
costs of setting up LCPA – were met by the EU and the EU-funded FACT team of SPC, and not, for instance,
by the Government of Fiji or Fiji Sugar Corporation; however if Fairtrade certification or other certification of
goods is attempted by the Government of Fiji, the figures for cost of initial certification listed herein may be of
interest.
Two features were key to the success of certification. First, the institutional and technical support provided
by the European Union’s Project Management Unit (PMU), experience of former FSC staff who were involved
in LCPA, and financial support from the EU-funded FACT team of Secretariat of the Pacific Community (SPC)
for an environmental plan may have lowered the costs to farmers and increased the speed of certification
compared to a crop with less institutional support. However, the importance of this support raises questions
of sustainability: will Fairtrade certification continue if international donor support is withdrawn? Second, the
scale of production by LCPA member farmers was large enough to generate substantial Fairtrade Premium
funds relative to those accruing to small producer organisations (SPOs) that have been Fairtrade certified in
other parts of the Pacific.
Potential benefits from other certification schemes such as organic or single origin schemes may also be
substantial, and thus these options are also worth exploring.
The results in this study endorse earlier efforts of the EU’s Fiji-based Coordination Unit and latterly, continu-
ing work by Secretariat of the Pacific Community, to Fairtrade certify two additional groups of growers in Fiji’s
largest island, Viti Levu. They also underline the strong economic incentive to stay certified as long as pos-
sible, with the caveat that farmers must see the benefits to increase the chances they will remain supportive.
Fairtrade certification of all of Fiji sugar will not single-handedly make sugar profitable; however, it has proven
helpful for poverty alleviation and thus both Fairtrade certification in Vanua Levu and its expansion to Viti Levu
are robustly supported from an economic perspective.
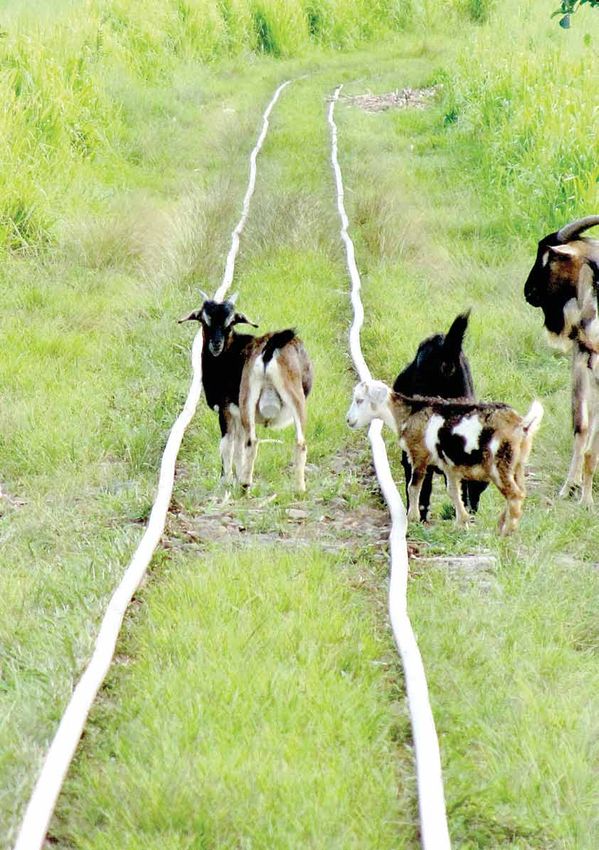
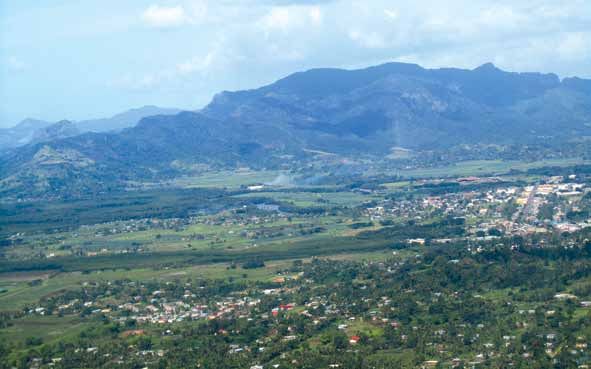
Photo 2: Sugar cane railway bridge on Vanua Levu. Source: SPC
09
02 BACKGROUND TO
           FAIRTRADE AND
           THE FIJI SUGAR
           INDUSTRY

     The EU-Funded Facilitating
Agricultural Commodity Trade Project
OVERVIEW
All sugar exported from Fiji is sold to British sugar firm Tate and Lyle Sugars Limited (TLS) (FSC, 2010; FSC,
2011)., In February 2008, TLS committed to convert 100% of its retail branded sugar to Fairtrade. Fiji’s Sugar
Cane Growers’ Council began its Fairtrade certification process in 2008, but certification finally took place in
early 2011 through the newly created Labasa Cane Producers Association, representing cane growers on Vanua
Levu who supply Labasa mill, one of four sugar cane processing mills in Fiji.
Fairtrade certification is regulated by the Fairtrade Labelling Organisation (FLO). According to the FLO website:
Fairtrade is an alternative approach to conventional trade and is based on a partnership
between producers and consumers. Fairtrade offers producers a better deal and improved
terms of trade. This allows them the opportunity to improve their lives and plan for their future.
Fairtrade offers consumers a powerful way to reduce poverty through their every day shopping.
For sugar cane, farmers receive Fairtrade Premium payments from buyers calculated as a fixed amount per
tonne. The payments go to a democratic growers’ association to be spent on the social and economic needs of
the grower community. For other agricultural crops (but not sugar for reasons unexplained on the FLO website
at the time of writing) this can also involve a guaranteed minimum price per unit weight paid from the buyer to
the grower. Although buyers such as TLS have to agree to make Fairtrade Premium payments to growers, they
may potentially benefit by increasing market share, improving brand image and most importantly, selling to
retailers at prices that more than cover the Fairtrade Premium.
2.1 WHAT DOES FAIRTRADE CERTIFICATION INVOLVE?
According to the Fairtrade Labelling Organisations International website, the aims of Fairtrade
certification are to:
• provide an additional Fairtrade Premium which can be invested in projects that enhance social, economic
and environmental development;
• ensure that producers receive prices that cover their average costs of sustainable production;
• enable pre-financing for producers who require it;
• facilitate long-term trading partnerships and enable greater producer control over the trading process;
• set clear minimum and progressive criteria to ensure that the conditions of production and trade of all
Fairtrade certified products are socially, economically fair and environmentally responsible
The principles of Fairtrade certification are available in full in Appendix 1. The main principles are divided into
the three themes of social development, economic development and environmental development. There are
also two additional sets of principles, one that applies to small producer organisations – which applies in the Fiji
sugar industry – and one that applies to hired labour situations.
11BOX 1: FAIRTRADE PRINCIPLES
All Fairtrade certification is conducted according to three Fairtrade principles or standards,
which are described below.
The social development principles state that ‘for small-scale producers Fairtrade Standards
require an organisational structure that allows the producers to actually bring a product to the
market. All members of the organisation need to have access to democratic decision-making
processes and as far as possible participate in the activities of the organisation.’
The economic development principles state that ‘for all products Fairtrade Standards require
the buyers to pay a Fairtrade Minimum Price and/or a Fairtrade Premium to the producers...
Premium money in this sense is meant to improve the situation of workers, farmers and local
communities in health, education, environment, economy etc. The farmers or workers decide
the most important priorities for themselves and manage the use of the Fairtrade Premium.’
The environmental development principles state that the focus of Fairtrade standards on envi-
ronmentally sound agricultural practices are: ‘minimized and safe use of agrochemicals, prop-
er and safe management of waste, maintenance of soil fertility and water resources and no use
of genetically modified organisms.’
The standards that operationalise these principles are fairly large documents so are not included
here. However, the two standards that apply to sugar cane in Vanua Levu are as follows, and their
implications for farmers on Vanua Levu are described below in the main body of this document.
• Standard for Small Producer Organizations – available from the FLO website
(http://www.fairtrade.net/)
• Cane Sugar Product Standard for small producer organisations – available from the FLO
website (http://www.fairtrade.net/).
2.2 WHAT DID FAIRTRADE CERTIFICATION INVOLVE
FOR CANE SUGAR IN VANUA LEVU?
Box 1 describes the three Fairtrade principles of social development, economic development and environmental
development. It is not within the scope of this document to catalogue everything that certification involved; the
analysis will be limited to the aspects of certification that have a bearing on the economic benefits and costs
for sugar cane farmers in Vanua Levu. Below is a description of how each of the Fairtrade principles was made
operational for sugar cane in Vanua Levu.
SOCIAL DEVELOPMENT
The social development principles referred to in Box 1 are manifested in the requirement to create a small
producer organisation representing sugar cane farmers in Vanua Levu and run it according to the Fairtrade
Standard for Small Producer Organizations. The Labasa Cane Producers Association was created for this pur-
pose, and covers all cane producers in Vanua Levu. These cane producers supply the Labasa-based mill. The
Fairtrade Standard for Small Producer Organizations states that the function of the organisation is to administer
the Fairtrade Premium funds it receives from the buyer, TLS, in a democratic, fair and transparent way that
represents the wishes of members.
12FIGURE 1: LABASA CANE PRODUCERS ASSOCIATION’S ORGANISATIONAL STRUCTURE
THE LABASA CANE PRODUCERS ASSOCIATION ORGANISATIONAL STRUCTURE
47 Elected Buceisau
DECISION 10 BOARD Sector 554
Gang Reps
MAKING MEMBERS WITH Gowers
1 PRESIDENT, 2
VICE PRESIDENTS
62 Elected Wailevu
Gang Reps Sector 545
Growers
40 Elected Wainikoro
Gang Reps Sector 413
Growers
EXECUTIVE EXECUTIVE
MANAGER
37 Elected Labasa
Gang Reps Sector 429
Growers
52 Elected Vunimoli
GENERAL Gang Reps Sector 511 3961
ACCOUNTANT ASSEMBLY: Growers REGISTERED
432 ELECTED LABASA MILL
GANG REPS CANE GROWERS
63 Elected Waiqele
Gang Reps Sector 499
Growers
ICS OFFICER
43 Elected Daku Sector
Gang Reps 377
Growers
ICS ASSISTANT
26 Elected Natua
Gang Reps Sector 186
Growers
ENVIRONMENT
OFFICER 37 Elected Solove
Gang Reps Sector 265
Growers
OFFICE Bulivou
25 Elected
ASSISTANT Sector 182
Gang Reps
Growers
CONTROL COMMITTEE*
*The Control Committee became defunct in May 2011 after the requirements of Fairtrade SPO Standards changed
Source: LCPA, 2011
LCPA’s organisational structure is represented in Figure 1. It comprises nearly 4,000 farmers in 10 administra-
tive ‘sectors’. Every farmer is a member of a registered ‘Gang’, a pre-existing well-established grouping in Fiji
sugar cane production that is a requirement of the Fiji Sugar Corporation. Gangs organise for the purpose of
harvesting cane and sharing a hired workforce. Each Gang sends a representative to the General Assembly of
the LCPA, which has 432 members. Each of the 10 sectors that serves the Labasa mill is represented by a Board
member. The LCPA executive team manages the administration of the Fairtrade Premium funds on the basis of
decisions made by the General Assembly and by Board members.
13The main economic costs incurred by farmers to meet the social development standards result from the re-
quirement that farmers attend Fairtrade awareness training and that Gang delegates attend the General As-
sembly, as well as the time and expense required of the Board members.
There are potential ‘social’ benefits from successful democratic organisation and decision-making, such as
empowerment and fairness, that are hard to measure economically; moreover, the additional economic benefits
stemming from this are administered through the formation of LCPA. Thus the formation of LCPA is a neces-
sary precondition for economic benefits even though they do not stem directly from it. However, such benefits
may not necessarily be realised: an Oxfam paper claims that democratic, cooperative organisations are not
well suited to the Pacific region. The report notes that the Pacific has ‘a long history of failed attempts to create
cooperatives’ and states that they are better integrated into extended family and clan structures (Oxfam New
Zealand 2010). Relative to the rest of the Pacific, LCPA operates in a particularly large, majority Indo-Fijian
farming community, so it may not be appropriate to extrapolate the conclusions from this Oxfam report to the
Fiji sugar context. LCPA appeared to work as a democratic structure without too many problems in its first year.
ECONOMIC DEVELOPMENT
The economic development principles are manifested in the receipt by LCPA of Fairtrade Premium funds. There
is no Fairtrade minimum price for sugar cane production in Vanua Levu, but there is a Fairtrade Premium of
USD 60 per tonne of sugar exported. For the 2010 crop, this amounted to a Premium payment of FJD 4.2 million,
which was paid in March 2011. The Fairtrade Premium is paid by TLS after the product has been sold, and after
LCPA and Fiji Sugar Corporation have sent ‘flow of goods’ reports to FLO, which verify the volume of Fairtrade
product sold (LCPA).
The Premium funds are never paid straight to the farmers but instead are administered by LCPA; this is an
FLO regulation.
In Vanua Levu the Premium funds have been invested in three broad categories:
• Community projects
• Subsidy and purchase of farmer inputs
• Operational costs of LCPA
According to LCPA, cane farmers initially demanded that funds received be distributed to them directly, and not
handled by LCPA, but after they understood the conditions of receipt of Fairtrade Premium funds and the po-
tential benefits, they acquiesced and cooperated with the organisation. The Sensitivity analysis section contains
figures on what the net benefits would have been had all Premium funds been given directly to farmers.
ENVIRONMENTAL DEVELOPMENT
The environmental development principles instigated the creation of an Environmental Management Plan and
a plan to phase out the use of a toxic herbicide, paraquat dichloride, which is on FLO’s prohibited materials list,
and a programme to support farmers to store chemicals in a safe location.
The costs resulting from LCPA’s Environmental Management Plan thus far have mainly been through compul-
sory farmer attendance of training sessions on paraquat replacement and safe chemical storage, which will
continue in the next few years. These are quantified in section 4.
142.3 BACKGROUND TO CERTIFICATION AND THE SUGAR INDUSTRY IN FIJI
In early 2008 the Sugar Cane Growers Council began pursuing Fairtrade certification. The Fairtrade Label-
ling Organisation (FLO) carried out a pre-assessment survey in Fiji in September 2008 to evaluate prospects
for Fairtrade certification, in particular whether the Sugar Cane Growers Council (SCGC) would be a suitable
candidate to be the democratically representative Small Producers’ Organisation required by the Fairtrade La-
belling Organisation. The conclusion was that SCGC would be suitable in principle. However, in 2009 SCGC’s
Board was revoked and its representative function diminished sufficiently that certification was no longer
feasible (FLO 2009). A meeting was conducted between stakeholders in the Fiji sugar industry and an FLO rep-
resentative in November 2009 and attendees agreed that it was unlikely that the Fiji government would allow
SCGC to organise and represent sugar cane growers at that time in a way that would meet Fairtrade require-
ments. Stakeholders at the meeting unanimously agreed to form four separate small producer organisations
and certify each separately, beginning with the Labasa mill cane farmers (FLO 2009).
Certification efforts continued and in 2010 the Labasa Cane Producers Association was founded, led by its
former Executive Manager, Mohammed Habib, who was also the head of the new Fairtrade Coordination Unit.
The association became Fairtrade certified in early 2011. At the time of writing Mohammed Habib continues
to work to certify growers belonging to three mills into two further small producers organisations: Rarawai &
Penang Cane Producers’ Organization (RPCPA) and Lautoka Cane Producers’ Organization (LtCPA).
The Fiji sugar industry has been ‘a mainstay of Fiji’s economy for the last 125 years’. However, some have
said that it is ‘on the verge of collapse’ (Narayan and Prasad, 2004). The current government is committed to
turning the industry around (Fiji Live News, 2011; Fiji Village, 2011; Fiji Government, 2011) but faces a number
of large challenges. According to the Fiji Sugar Corporation (see Table 1 below), the number of active growers
fell from 18,615 in 2001 to 13,251 in 2010. The number of tonnes of sugar cane crushed dropped from a high
of 3,422,000 tonnes in 2002 to 1,780,000 tonnes in 2010. Cane yields per hectare are too low to be viable, and
sugar yields per hectare are deteriorating. An unpublished report from the preparation mission for the Asian
Development Bank Alternative Livelihoods Development Project states that yields averaged 52.9 tonnes of
cane per hectare in the 1970s and 50.9 tonnes per hectare in 2000–2002, with tonnes of sugar per hectare de-
creasing from 6.74 to 4.96 in the same period. The national average tonnes of cane to tonnes of sugar (TCTS)
ratio, a measure related to the amount of sugar per unit of sugar cane, rose from 10.0 to 14.0 between 2001
and 2010, indicating a fall in the quality of cane delivered to mills. Moreover, the Fiji sugar industry as a whole
faces a number of challenges, including decreasing land availability, land degradation, reduction of skilled and
unskilled labour available to the industry, lack of capital investment, the reduction of the sugar price in 2009
following the removal of the EU Sugar Protocol, and a lack of alignment of growers and millers’ incentives
through the current cane payment system (Lal 2006). More details on this are available in Appendix 2.
15TABLE 1: TEN-YEAR STATISTICAL REVIEW OF THE FIJI SUGAR INDUSTRY
FIELD STATISTICS
SEASON 2001 2002 2003 2004 2005 2006 2007 2008 2009 2010
Number of Growers 21,882 21,253 20,693 20,492 20,290 18,649 18,691 18,683 17,762 16,609
Number of Active Growers 18,615 17,773 17,362 17,639 16,527 15,730 14,948 14,096 13,903 13,251
Tonnes Cane per Hectare 42 42 43 40 48 58 46 46 46 40
Number of Cane Cutters 15,280 16,772 15,285 15,270 15,652 15,205 11,360 9,993 9,649 9,650
Output per cutter 184 204 170 196 172 212 117 225 228 184
Burnt Cane(%) 43 36 33 34 36 51 33 50 32 23
PRODUCTION STATISTICS
SEASON 2001 2002 2003 2004 2005 2006 2007 2008 2009 2010
Cane Crushed (000 tonnes) 2,805 3,422 2,610 3,001 2,789 3,226 2,479 2,321 2,247 1,780
Sugar Produced (000 tonnes) 293 330 294 314 289 310 237 208 168 132
Mclasses produced (000 tonnes) 106 149 107 113 118 157 115 120 136 113
Tonnes Cane/Tonnes Sugar 10.0 10.0 9.0 10.0 10.0 10.4 10.0 11.2 13.0 14.0
Mclasses % Cane 4.0 4.0 4.0 4.0 4.0 4.9 5.0 5.2 6.0 6.0
POCS % 12.0 11.0 13.0 12.0 11.0 11.3 11.0 10.8 10.0 10.0
Cane Purity 83.0 82.0 84.0 83.0 82.0 81.4 81.0 80.4 78.8 79.3
Fibre in Cane % 12.0 12.0 12.0 12.0 12.0 11.6 11.4 12.0 12.0 12.0
Average Crushing Rate
for all mills (TCPH 1,083 978 895 972 953 919 885 843 789 794
Actual crushing time as
% of available time 71 76 82 79 75 76 68 68 60 53
PRICE AND REVENUE STATISTICS (CURRENT PRICES)
SEASON 2001 2002 2003 2004 2005 2006 2007 2008 2009 2010
Price per tonne cane ($) 60.8 53.8 60.12 55.48 58.13 59.06 58.21 61.65 56.23 49.16
Proceeds from Sugar &
Molasses ($m) 239.4 261.1 223.6 237.8 231.6 272.1 206.1 204.5 180.5 121.6
Fiji Sugar Corporation’s
share of proceeds ($m) 71.8 78.2 67.1 71.4 69.5 81.6 61.8 61.3 54.1 36.5
Growers’ share of proceeds ($m) 167.6 182.9 156.5 166.4 162.1 190.5 144.3 143.2 126.4 85.1
SUGAR EXPORTS - DESTINATIONS AND QUANTITIES (METRIC TONNES)
SEASON 2001 2002 2003 2004 2005 2006 2007 2008 2009 2010
UK/EU 152,255 175,825 167,585 170,742 178,905 209,055 187,858 207,575 152,906 110,731
USA 9,065 9,035 9,061 9,006 10,111 13,442 9,157
Japan 46,615 58,637 37,008 62,000 57,481 40,000 20,000
China 25,000 25,000
Indonesia 25,425
Special Preferential Market 39,460 20,445 6,475
Portugal 17,000
TOTAL 247,373 288,942 255,654 273,648 246,497 262,495 217,015 207,575 152,906 110,731
Source: Fiji Sugar Corporation (2011)
162.4 SCEPTICISM ABOUT FAIRTRADE CERTIFICATION
Fairtrade certification generally has a positive image in the countries in which Fairtrade goods are sold, but
not every attempt to certify will necessarily be of positive net benefit to growers, especially in the Pacific, due
to the size of the fixed cost of certification relative to the scale of production. A report on certification schemes
(McGregor 2012) states that an investigation into the feasibility of Fairtrade certification for spices in Vanuatu
concluded that ‘Fairtrade certification, as it currently exists, is inappropriate’, due mainly to the small scale of
production in Vanuatu, a minimum price that does not sufficiently benefit farmers, the high prospective costs
of certification and the inappropriateness of the democratic farmer cooperative model, a factor highlighted
in the Oxfam (2010) report. Sugar in Fiji faces different circumstances: the minimum price is not a relevant
concern, scale is not an issue, and the democratic structure may prove itself feasible in the Vanua Levu sugar
context.
A report by the International Insitute for Environment and Development (IIED 2012) lists the challenges of
certification schemes in general, including the risk that only better connected, larger farmers can afford the
individual costs of certification. This study shows that although this critique may be valid in a broader sense,
all Vanua Levu cane farmers are included in Fairtrade certification and the scheme does not exclude the poor-
est cane farmers.
However, the IIED report makes a point that is salient not only for Asia but also for the Fiji situation:
It is unlikely that any certification scheme will emerge as a clear, pro-poor winner for farmers in
remote locations of Asia. Location-specific factors are highly likely to affect the success of various
certification schemes. These factors include environmental conditions, soil characteristics,
likelihood and ability to form farmers groups or democratic associations, previous farming
systems employed (low input versus high input), local extension services and support from
exporters, other agents in the value chain or non-governmental organisations (NGOs).
Other certification schemes for sugar with high price premiums such as organic or ‘single origin’ schemes
could potentially be more lucrative than Fairtrade 3 or may at least be worth exploring in conjunction with
Fairtrade. Such schemes may require the elimination of the use of agrochemicals, which are widespread in
Fiji cane farming, especially weedicide; however, a good certification scheme can offer incentives for more
sustainable production practices such as addition of lime to the run down acid sulphate soil, composting mill
mud, and use of advances in biochar technology and agroforestry. Such additions could boost yields and begin
to address land degradation issues. Analysis conducted for a United States Agency for International Develop-
ment (USAID) project in Fiji two decades ago established the financial viability of organic certification for which
lime and composting of mill mud were elements; the scheme was viable due to the high price premium then
available for organic sugar. 4
3 Especially as Fairtrade certification of sugar does not entail a minimum price
4 Pers. Comm., Email Correspondence, Andrew McGregor, 15 June 2012
1703 ASSESSMENT
METHODOLOGY
The EU-Funded Facilitating
Agricultural Commodity Trade Project3.1 WITH AND WITHOUT ANALYSIS
A straightforward ‘with and without’ approach is used. The aim is to measure the difference between the pro-
ject scenario and a baseline scenario without the project. Table 2 shows the ‘with project’ and ‘without project’
scenarios, from the perspective of farmers and their communities.
The economic analysis in this study consists of analysis of benefits and costs of Fairtrade certification of sugar
cane farmers in Vanua Levu. This is a mid-term review in which costs and benefits incurred in 2011 are taken
into account.
TABLE 2: WITH AND WITHOUT FAIRTRADE CERTIFICATION
PROJECT ELEMENT WITHOUT FAIRTRADE CERTIFICATION WITH FAIRTRADE CERTIFICATION
SOCIAL DEVELOPMENT
Formation of Labasa Cane Farmers are not organised or democratically Farmers are organised and democrati-
Producers Association represented by any group. Farmers do not cally represented at LCPA. Ten farmers
spend time in meetings or training. become Board members and over 400
become General Assembly representa-
tives, and some of their time is spent in
LCPA meetings. Farmers incur expenses
and spend time on LCPA participation.
Farmers required to adjust socially to
democratic organisation.
ECONOMIC DEVELOPMENT
Fairtrade Premiums No Fairtrade Premiums received. Fairtrade Premiums are given to LCPA,
which decides how to spend them.
Community infrastructure, health and
education projects take place, funded
by Fairtrade Premiums. Farmer costs
are reduced by Fairtrade Premium
funds spent on sugar cane inputs such
as fertiliser and weedicide. Farmers
incur expenses and spend time on LCPA
participation.
ENVIRONMENTAL
DEVELOPMENT
Paraquat phase-out Approximately 20% of farmers use danger- Eventually, no farmers use paraquat
programme ous paraquat weedicide. Farmers do not weedicide. Farmers attend meetings.
attend training meetings. Costs of alternative weedicides are met
by Fairtrade Premium funding. Alterna-
tive weedicides may be less immediately
visually effective than paraquat but more
effective than paraquat over a period
of days and weeks, saving labour and
increasing productivity. Farmers spend
time on LCPA training.
Safe chemical and fertiliser Farmers do not attend training. Chemicals Farmers attend training sessions. More
storage training may be stored in unsafe conditions by some farmers store chemicals safely. Less
farmers. Damage to human health and the damage to human health and the envi-
environment. ronment. Farmers incur expenses and
spend time on LCPA participation.
193.2 PERSPECTIVE
Economic assessment of Fairtrade certification of sugar cane cultivation in Vanua Levu is undertaken from the
perspective of sugar cane farmers and their rural communities, and from the perspective of the donors who
supported initial certification costs: the EU and the EU-funded FACT team of SPC. The Government of Fiji and
Fiji Sugar Corporation did not meet the costs of certification in this case, but may wish to do so for certification
of other goods in the future.
Taking the perspective of farmers and their rural communities implies that any costs or expenditures by the
Labasa Cane Producers Association are only relevant if they impact on the well-being of farmers and farming
communities – LCPA executive team wages, for instance, are counted neither as a benefit nor a cost because
such staff are generally not farmers or members of farming communities but live and work in Labasa or
Lautoka. However, Premium funds spent on necessary farm inputs are an economic benefit to farmers, and
farmers’ time spent in meetings is an economic cost to farmers.
A caveat is that LCPA wage and capital expenditures are likely to accrue largely to the Fijian economy, assum-
ing that they are largely spent domestically, so figures in the main analysis do underestimate net benefits to
the Fiji economy, but the focus has been deliberately kept on benefits accruing to cane farming communities.
3.3 VALUING COSTS AND BENEFITS
A cost–benefit analysis (CBA) estimates the costs and benefits of an activity to the relevant party. CBA is a
broader measure of net benefit than financial analysis alone and aspires to capture both direct financial costs
and benefits and non-market, non-tangible costs and benefits that may not be captured in an accounting bal-
ance sheet but may nonetheless have an impact on human welfare.
On the benefit side, improvements to human health or safety and environmental health may be important
considerations when considering allocation of resources for a project. However, it is not always straightfor-
ward to measure these types of costs. For example benefits from social development might include greater
social cohesion or self-esteem brought by the new capability of democratically organised sugar cane grow-
ers to solve community problems through the use of Fairtrade Premiums. Other benefits that are not readily
quantified include the probable positive externalities from Fairtrade Premium expenditure on education or
infrastructure projects, due to the large number of projects (43 in 2011) and the impracticability of accurately
measuring the magnitude of externalities from all projects. Thus in this analysis the benefits from these pro-
jects are quantified simply as the size of the contribution of the Fairtrade Premium, as if certification simply
saved communities money on projects they were going to carry out with or without certification. Put another
way, every dollar of Fairtrade Premiums is assumed to represent one dollar in the pocket of cane-farming
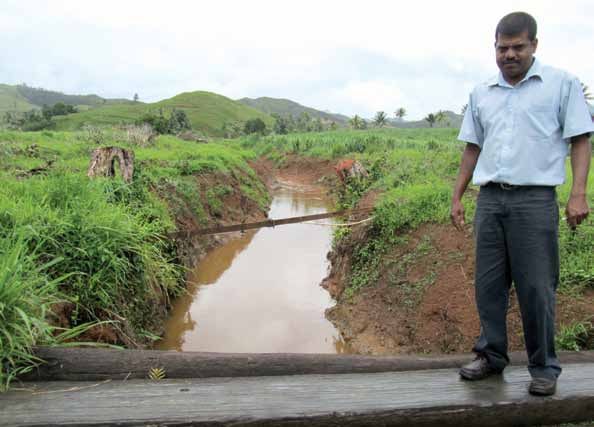
communities. If Fairtrade Premium funding contributes the FJD 2,000 needed to build a drain, the benefit is
valued at FJD 2,000 and other significant benefits that may accrue such as reduced crop loss from flooding,
reduction in school days lost due to flooding or additional health and business benefits due to year-round road
access, are not included. However, an expenditure of FJD 6,000 on repairing a footbridge in a small village may
not be worth the total amount spent on it to farmers – although it is still beneficial; but this item is still valued
at FJD 6,000. Thus the assumption is that the average benefit per dollar spent is one dollar. It is impractical
to assess the true economic contribution these expenditures make per dollar spent, hence the assumption
of a one for one ratio in the main analysis; a lower benefit to farmers of 50 cents per dollar spent is assessed
in the Sensitivity analysis section, accounting for poorly executed community projects, badly spent money or
otherwise decreased returns to community expenditure.
On the cost side, opportunity costs of resources used free of financial cost, or environmental costs of a project
may be important but hard to measure. In this project, however, the vast majority of costs of certification
consist of time and expenses spent by farmers and are more readily quantifiable than some of the benefits of
certification.
203.4 NET PRESENT VALUE AND TREATMENT OF TIME
A key figure estimated in this study is the overall net present value of Fairtrade certification. This is given at
2011 prices. Net present value is the sum of the present values of all benefits net of the present values of the
costs, and is an expression of the additional value represented by a project. It takes into account inflation, the
opportunity cost of investment and the time-period in which benefits and costs occur. Before summing the
benefits and costs, two processes are undertaken. market. For Samoa, the major constraint to expanding taro
exports to New Zealand is the shortage of planting material for desired varieties (pers. comm, Tolo Iosefa).
First, costs and benefits are expressed in constant prices and any nominal values occurring in future are ad-
justed for inflation; for instance, Fairtrade Premiums are likely to be set at 60 USD or 106.2 FJD per tonne for
the foreseeable future (see section 3.5), but 106.2 FJD is a nominal figure that has to be adjusted, for inflation if
LCPA receipt of this nominal amount occurs in any year after 2011 which is the base year used in this study.
Second, once all costs and benefits are converted into ‘constant’, 2011 prices, the time at which the costs and
benefits are incurred is also taken into account through the use of a discount rate. Benefits and costs of Fair-
trade certification occur at different times: for instance, every year that Fairtrade Premium funds are received,
the benefits of their expenditure are realised and the costs of administering the funds are incurred. People –
whether investors or consumers – usually prefer to receive benefits sooner rather than later, a phenomenon
known as ‘time preference’. This preference is accommodated in CBA by weighting later values of costs and
benefits more lightly than earlier values of costs and benefits, in a process known as discounting. Costs and
benefits that have been weighted using discounting have been converted to their present values; for example,
the value of benefits incurred in 2015, once discounted, is expressed from the perspective of the year chosen
as the ‘present’ – in this case, 2011. The net present value of a project is the total present value of benefits
minus the total present value of costs.
Discounting is widely used in CBA, but the rate at which values in the future should be discounted in compari-
son to earlier values is under constant debate in economic literature and is unlikely to be resolved (Pearce,
Groom & Hepburn 2003). According to Woodruff & Holland (2008), discount values used in Pacific Island coun-
tries, both nationally and regionally, varied between 3% and 12% in recent years. Therefore throughout this
study a mid-range discount rate of 7% is used in the main analysis, and sensitivity analysis is later conducted
with discount rates of 3% and 10%, consistent with other SPC analyses and analyses by SOPAC (previously the
Pacific Islands Applied Geoscience Commission, now the Applied Geoscience and Technology Division of SPC)
(Holland 2008; Ambroz 2009; Gerber 2010).
3.5 ASSUMPTIONS
The size of benefits resulting from this project is related directly to the amount of Fairtrade Premium funds
received by LCPA. The Premium is calculated by multiplying the number of tonnes of Fairtrade certified sugar
per year sold to TLS by the Premium amount per tonne. Table 3 presents predictions of future receipt and
expenditure of Fairtrade Premiums. This section lays out how the data that underlie the predictions of future
Fairtrade Premium funds are calculated. It explains the future estimates of project lifespan, Premium Funds
received per tonne, inflation and quantity of certified tonnes per year. It also explains valuation of farmer time.
Project lifespan: This study takes into account costs and benefits for as long as they are incurred by this
project, which in this case is the same as the project lifespan. The project lifespan of Fairtrade certification for
farmers and their rural communities hinges on the number of years for which Premium funds are received.
The main analysis assumes that Premium funds will be received for 7 years – from 2011 to 2017.
21This is a mid-range LCPA estimate.5 The Sensitivity analysis section also analyses the net benefit of the pro-
ject given more pessimistic and optimistic scenarios. The pessimistic scenario assumes that certification lasts
for just 3 years, and the optimistic scenario assumes a longer certification period of 10 years. The greatest risk
of losing of Fairtrade Premium funds, according to Mohammed Habib, former Executive Manager of LCPA,
comes from the danger of LCPA losing its certification status because it no longer meets FLO social and envi-
ronmental standards.6 However, if certification status is lost in one year, it can be regained the following year
if compliance is judged to be sufficient for certification. Given the continual growth of the Fairtrade movement
and demand for Fairtrade sugar (Reuters 2012), and the market strength of TLS in Britain (Guardian 2008) (see
Box 2 for a summary of demand for Fairtrade sugar in Britain), there is little risk that demand for Fairtrade
sugar will collapse; thus Premiums are unlikely to be cut for this reason.
A third reason Premium Funds could stop is the possibility of a hastening decline or collapse in the Fiji sugar
industry. There has been significant financial and political investment made by the Fiji government in the in-
dustry; (Fiji Live News, 2011; Fiji Village, 2011; Fiji Government, 2011) however, issues of land productivity, land
degradation and inappropriate use of marginal lands may prove more intractable. The scenario of a particu-
larly rapid decline is accounted for in the Sensitivity analysis section, in which the current production level of
cane is assumed to drop from the 2011 level of 44,015 tonnes to 24,000 tonnes from 2015 onwards.
Premium funds – amount per tonne of sugar: This study assumes that Premium Funds are fixed at a nominal
amount of USD 60 per tonne of sugar. Email correspondence with the Fairtrade Labelling Organisation 7
revealed that Fairtrade Premium amounts per tonne are reviewed periodically or on demand if stakehold-
ers call for a review. No indication was given that the USD 60 figure would either decrease or increase; for
instance there is no systematic increase in Premium amounts to keep up with inflation. The USD 60 amount
for sugar was last reviewed in 2009. With no certainty about the time of the next review in Premium amounts
per tonne, it is assumed that the nominal USD 60 amount will remain unchanged. This implies that Premium
Funds will reduce per tonne in real terms, once the nominal amounts adjusted for inflation. Given the uncer-
tainty about the future value of the Premium paid to LCPA per tonne of sugar produced, a scenario in which
the Fairtrade Premium falls to USD 30 from 2012 onwards has been accounted for in the Sensitivity analysis.
An exchange rate of FJD 1.77 per USD 1 is used, giving a nominal amount of FJD 106.20 per tonne, which is
assumed fixed for the duration of the project in the absence of systematic predictions about future movements
of the USD/FJD exchange rate.8
Table 3 shows the nominal amounts received converted into real values at 2011 prices. The inflation rate used
to adjust the FJD 106.20 figure into 2011 prices is 5.06%. This is calculated from the average annual inflation
rate for 2005-2010 for the Northern Division of Fiji, which was taken from the Fiji Bureau of Statistics website.9
5 Pers. Comm., Mohammed Habib, former Executive Manager, Labasa Cane Producers Association, 2012.
6 Ibid.
7 Pers comm., Monika Berresheim-Kleinke, Global Project Manager, Sugar, Fairtrade Labelling
Organisation, 1 March 2012
8 Exchange rate taken from the Financial Times Currencies page, accessed on 14 March 2012.
http://markets.ft.com/research/Markets/Currencies. Since depreciation in 2009, the exchange
rate has fallen from a high of 2.24 FJD/USD to a low of 1.71 and risen back up to hover
around the 1.8 mark, according to Google Finance, accessed on 14 March 2012 -
http://www.google.com/finance?q=USDFJD# 1.77 seems a reasonable approximation in the face
of uncertainty about the future.
9 Fiji Bureau of Statistics website. www.statsfiji.gov.fj/Key%20Stats/Prices/8.5%20CPI_northern.pdf
Accessed 23 May 2012. An inflation rate of 5.06% was reached by taking the CPI from 2005, 100.0, and the
CPI from 2010, 128.0, and calculating the average inflation rate between the two years through the
following equation: (((128/100)^1/5)-1) = 5.06%
22BOX 2: THE UK MARKET FOR FAIRTRADE SUGAR
The assumption of continued certification and the recommendation in the conclusion of this
study to continue certification of sugar from the rest of Fiji, rests on the assumption that demand
for Fairtrade certified sugar is robust and will continue. As mentioned at the start of Section 2,
all sugar exported from Fiji is sold to British sugar firm Tate and Lyle Sugars Limited (TLS) and in
February 2008, TLS committed to convert 100% of its retail branded sugar to Fairtrade.
The following table shows the increasing size of the market for Fairtrade sugar in the UK (figures
from FLO website), which is currently dominated by Tate and Lyle, and the tiny revenue earned
by Fiji in comparision to UK Fairtrade sugar sales in 2011. The figures for Fiji are not directly
comparable with the UK figures as they are taken at an earlier stage in the processing and value
chain, but their small size compared to the UK Fairtrade sugar revenue probably does show that
expansion of certification in Fiji is unlikely to glut the UK market for sugar, as the Fiji annual
certified sugar revenue figure of FJD 35.4 million is likely to no more than triple if the two other
cane producing areas in Fiji become certified.
According to the UK’s Guardian newspaper on 27 February 2012, referring to British
supermarkets:
The Fairtrade cocoa and sugar sectors have seen the most significant growth in
the past year, with 34% and 21% increases over 2010 respectively. Morrisons will
announce this week that it will join other major retailers, including the Co-op,
M&S, Waitrose, Sainsbury’s and Tesco, who have committed to converting all
their bagged sugar stocks to Fairtrade sugar from Tate & Lyle. This move will
bring Fairtrade’s share of the UK retail bagged sugar market to 42%, and will
make sugar the biggest single Fairtrade product.
Given the climbing level of Fairtrade share in the UK sugar market, there is a risk of national or
global market saturation; and this may put downward pressure on the Fairtrade premium of USD
60 per tonne of sugar. This scenario has been accounted for in the Sensitivity analysis section.
Year Fiji revenue from Fiji- estimated Amount of UK Fairtrade sugar
sugar and molasses revenue from Fairtrade sugar as proportion of
(million FJD) Fairtrade-certified sales (million UK sugar retail
sugar (million FJD) FJD) market
2009 204.5 0 477 no data
2010 180.5 0 1,114 no data
2011 121.6 35.4 1,346 33%
This table was compiled from the following sources: Fiji revenue from sugar and molasses - Fiji Sugar Corporation Annual Re-
port 2011; Fiji estimated revenue from Fairtrade certified sugar excludes premium income and is calculated as follows: ((LCPA
figures for quantity of certified sugar) / (FSC Annual Report figures for total sugar and molasses production)) x (total Fiji sugar
revenue); Amount of UK Fairtrade sugar sales (FJD) = estimated retail sales of sugar products (from Fairtrade Foundation
website - http://www.fairtrade.org.uk/what_is_fairtrade/facts_and_figures.aspx) multiplied by an average GBP/FJD exchange
rate of 2.9 which is taken from XE web site, accessed 25/06/2012 http://www.xe.com/currencycharts/?from=GBP&to=FJD&vie
w=5Y); Fairtrade sugar as proportion of UK sugar retail market is taken from the Sugar Online web site, accessed 25/06/2012
http://www.sugaronline.com/home/website_contents/view/1185261
23Premium funds – number of tonnes: There was an initial Premium payout in 2011 for 38,400 tonnes of sugar
produced in 2010. The number of tonnes of certified sugar from Vanua Levu is estimated at 30,000 tonnes in
2012 and 2013, rising to 36,000 by 2015 and remaining at 36,000 until the end of 2016. A key assumption behind
the main result (and all results except the result in subsection 5.2 of the sensitivity analysis in Section 5) is that
sugar production will fall at the same rate from 2012 onwards as it did in the period from 2000 to 2011. On this
assumption, the number of tonnes of sugar produced by the Labasa mill is predicted to decrease at the same
percentage per year until it reaches 28,269 tonnes in 2022. Note that before 2017, as not all sugar produced on
Vanua Levu is expected to be certified, total tonnage of sugar produced is predicted to be above 36,000. How-
ever after 2017, every tonne produced is predicted to be certified. In Table 3 the number of predicted tonnes of
sugar produced is multiplied by the real value of Premium Funds per tonne to give predicted values of Premium
receipts up to 2017. These figures come from LCPA estimates10 and estimates based on Labasa mill sugar
production figures for 2000–2011 acquired by the author through LCPA.
Premium funds – percentages of funds spent on LCPA: The percentages of Premium Funds spent on different
projects are available for 2011 from the actual LCPA expenditures. For 2012 onwards, these are taken from the
2012 Premium Plan. These are shown in Table 4, and the predicted amounts of expenditure on each category
are shown in Table 5.
The percentage of Premiums saved starts out very high at 65.5% in 2011, from observed data, decreases to 30%
in 2012–2016, according to the 2012 Premium Plan, and decreases again to 20% in 2017 as per LCPA estimates.
After 2017, Premium Funds are assumed to cease, so Premiums that were saved up to the end of 2017 are then
spent from 2017 until they run out, which turns out to be in 2022. After Premium funding stops, expenditure is
assumed to continue at the same nominal amount per year as in 2017–202011 until it comes to an end. This
nominal amount is adjusted downwards for this analysis, due an annual inflation rate of 5.06% and the annual
discount rate of 7% employed.
It is also assumed throughout that Premiums saved by LCPA earn enough interest to offset inflation and thus
maintain their real value from year to year.
Value of farmers’ time: In the absence of a large amount of data and analysis, it is hard to find the exact value of
one hour of a farmers’ time, so here the recommendation of the Asian Development Bank (1999) is followed: as
an approximation, the value of farmer time taken up (a cost) or saved (a benefit) by Fairtrade certification is cal-
culated on the basis of the local minimum wage rate for casual unskilled labour. According to interviews held,
the market wage in 2011 was approximately FJD 20 per day; this can be provided in cash or FJD 10 cash plus
FJD 10 worth of food. Excluding lunch time, the work day is 7 hours long; thus the daily wage of FJD 20 divided
by 7 hours gives a 2011 rate of FJD 2.86 per hour.
10 Future estimates and past data given by Mohammed Habib, former Executive Manager, LCPA.
11 For 2021–2022, the nominal amount of Fairtrade premium funding received was calculated at FJD 106.20/
tonne * each year’s tonnage certified, then adjusted for inflation to get the real amount in 2011 prices.
24PARAMETERS 2010 2011 2012 2013 2014 2015 2016 2017 2018 2019 2020 2021 2022
Fairtrade
Premium per 106.2 106.2 106.2 106.2 106.2 106.2 106.2 n/a n/a n/a n/a n/a n/a
tonne of sugar
sold to TLS
(nominal FJD)
Real Fairtrade
Premium per 111.6 106.2 101.1 96.2 91.6 87.2 83.0 n/a n/a n/a n/a n/a n/a
tonne of sugar
sold to TLS
(2011 FJD)
Tonnes of sugar 38,400 36,497 30,000 30,000 33,000 36,000 36,000 34,811 33,476 32,192 30,958 29,770 28,629
produced
Premium
received for cane 4,216,148 3,876,000 3,032,521 2,886,435 3,022,125 3,138,044 2,986,875 0.0 0.0 0.0 0.0 0.0 0.0
25
produced in this
year (FJD)
Premium spent
0.0 1,453,156 2,713,200 2,122,765 2,020,505 2,115,488 2,196,631 2,389,500 2,199,249 2,013,033 1,842,584 1,686,568 405,471
(FJD)
Premium saved 0.0 2,762,992 1,162,800 909,756 865,931 906,638 941,413 597,375 0.0 0.0 0.0 0.0 0.0
(FJD)
TABLE 3: RECEIPT AND EXPENDITURE OF FAIRTRADE PREMIUM FUNDS – OVERVIEW
Cumulative
Premium 0.0 2,762,992 3,925,792 4,835,548 5,701,479 6,608,116 7,549,530 8,146,905 5,947,656 3,934,623 2,092,039 405,471 0.0
savings (FJD)You can also read