High-resolution 14C bomb peak dating and climate response analyses of subseasonal stable isotope signals in wood of the African baobab - a case ...
←
→
Page content transcription
If your browser does not render page correctly, please read the page content below
Biogeosciences, 18, 3539–3564, 2021
https://doi.org/10.5194/bg-18-3539-2021
© Author(s) 2021. This work is distributed under
the Creative Commons Attribution 4.0 License.

High-resolution 14C bomb peak dating and climate response
analyses of subseasonal stable isotope signals in wood of the
African baobab – a case study from Oman
Franziska Slotta1,2 , Lukas Wacker3 , Frank Riedel1 , Karl-Uwe Heußner4 , Kai Hartmann1 , and Gerhard Helle1,2
1 Institute of Geological Sciences, Freie Universität Berlin, Berlin, Germany
2 Section  4.3 Climate Dynamics and Landscape Evolution, GFZ German Research Centre for Geosciences,
Potsdam, Germany
3 Laboratory of Ion Beam Physics, ETH Zürich, Zurich, Switzerland
4 Scientific Department of the Head Office, Deutsches Archäologisches Institut, Berlin, Germany

Correspondence: Gerhard Helle (ghelle@gfz-potsdam.de) and Lukas Wacker (wacker@phys.ethz.ch)

Received: 16 August 2019 – Discussion started: 26 August 2019
Revised: 10 April 2021 – Accepted: 19 April 2021 – Published: 17 June 2021

Abstract. The African baobab, Adansonia digitata L., has          stable isotope ratios revealed radial stem growth and the geo-
great paleoclimatological potential because of its wide dis-      chemistry of wood cellulose are influenced by fluctuations in
tributional range and millennial length life span. However,       the hydroclimate. In particular, δ 18 O was found to be a good
dendroclimatological approaches are hampered by dating un-        climate proxy, followed by tree-ring width and δ 13 C. Tree-
certainties due to its unique, parenchyma-dominated stem          ring width and intra-ring δ 18 Omin correlated well with each
anatomy. Here, securely dated time series of annual wood in-      other and with precipitation amount for the period from pre-
crement growth and intra-ring stable isotopes of carbon and       monsoon May to the end of the monsoon season in Septem-
oxygen of cellulose for a baobab tree from Oman covering          ber/October. Intra-annual stable isotope courses were found
1941 to 2005 were established and tested for relationships        to be rather similar for both δ 13 C and δ 18 O. Years with par-
to hydroclimate variability. Precise dating with the atomic       ticularly low monsoon rain were reflected by increased sta-
bomb peak (ABP) using highly resolved 14 C measurements           ble isotope values in the mid-section of intra-annual courses.
confirmed the annual character of the baobab’s growth rings.      Distinct patterns with low subseasonal isotope values seem
F14 C values of tree-ring cellulose were found up to 8.8 %        indicative for years with heavy rainfall events from pre-
lower than in the corresponding atmospheric CO2 for the           monsoonal cyclones. Rain events from post-monsoonal cy-
period around the ABP, which in conjunction with a con-           clones may also be recorded; however, only 2 years of obser-
siderable autocorrelation of the δ 13 C series points to the      vation prevented a more conclusive evaluation.
incorporation of previous year’s carbon contributing to the
average age of intra-ring wood samples. F14 C of terminal
parenchyma bands, marking the tree-ring boundaries, were
found to be considerably younger than their corresponding         1   Introduction
tree ring, indicating that parenchyma tissue is alive for many
years, probably undergoing cell division and structural re-       The African baobab, Adansonia digitata L., has received
organization and contributing to secondary growth. In con-        growing interest from the paleoclimatology community due
trast to the δ 13 C time series, no significant autocorrelation   to its widespread distribution and longevity. As revealed by
was found in the δ 18 O series of tree-ring cellulose despite     radiocarbon dating, individuals can reach ages of 1000 up to
the enormous water storage potential of this stem-succulent       2500 years (Swart, 1963; Riedel et al., 2014; Patrut et al.,
tree species. Year-to-year variability in tree-ring width and     2017, 2018). Radiocarbon dating has not just helped to re-
                                                                  veal baobabs to be the longest-living angiosperm tree species

Published by Copernicus Publications on behalf of the European Geosciences Union.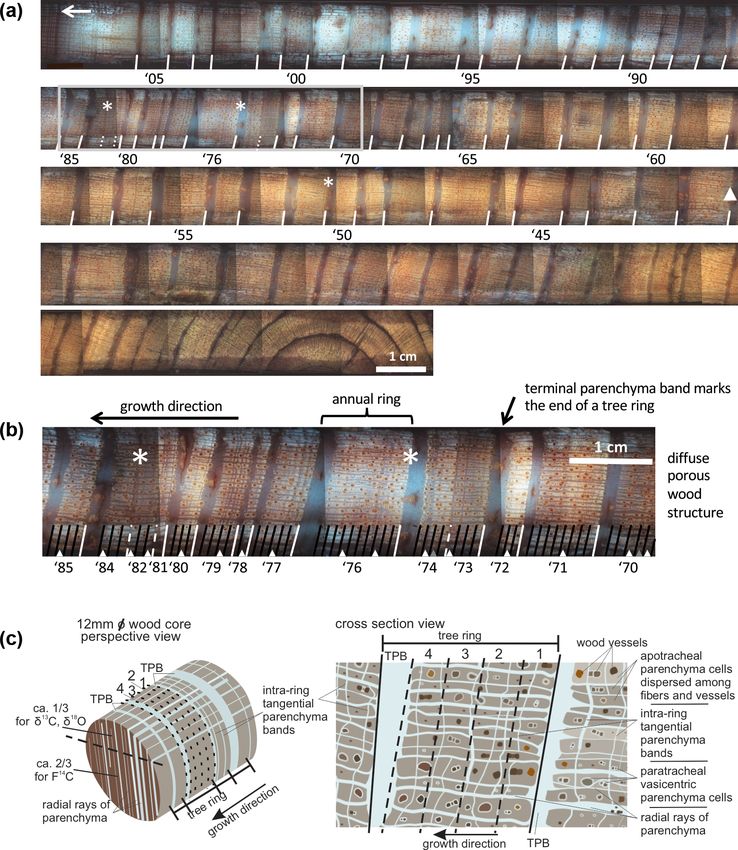
3540                                   F. Slotta et al.: High-resolution 14 C bomb peak dating and climate response analyses

on earth but also resolved the age of specific multi-stem tree      in identifying the wood anatomical details of baobab trees
structures of the biggest, monumental individuals in Africa         (Slotta et al., 2017). Nevertheless, false and missing rings
(Patrut et al., 2015a, b, 2017, 2018). Deciduous A. digitata        together with differences in tree age and site of origin have
inhabits (semi-)arid areas across the African continent and         caused conventional cross dating to fail (Slotta et al., 2017).
the southeastern Arabian Peninsula (Wickens, 1979; Wick-            In order to allow accurate comparison of baobab stable iso-
ens and Lowe, 2008) and is considered an important archive          tope data with meteorological data, highly resolved 14 C mea-
for past rainfall information stored in the layers of its wood      surements around the atomic bomb peak (ABP) could be uti-
(Robertson et al., 2006; Slotta et al., 2017; Woodborne et          lized to ensure proper identification, counting and dating of
al., 2015, 2016, 2018). Facing the potential impacts of cli-        growth rings.
mate change, A. digitata can, on the one hand, help in under-          Radiocarbon dating of organic material has long been ap-
standing past climate patterns in order to better model future      plied to obtain reliable age estimates of tropical and subtrop-
climate scenarios across the African continent, a great chal-       ical trees with unique and complex stem anatomy (Swart,
lenge considering the current lack of high-resolution trans-        1963; Worbes, 1989). Parallel to the development of modern
regional proxy data (IPCC, 2007, 2013). On the other hand,          accelerator mass spectrometry (AMS) techniques the number
baobabs may be threatened by recent climate warming as the          of radiocarbon-aided dendrochronological studies on trees
mortality of monumental baobabs in southern Africa appears          with indistinct growth boundaries has increased in recent
to have increased over the last decade (Patrut et al., 2018), de-   years (Fichtler et al., 2003; Hua et al., 2003; Robertson et
spite the high probability that the species has endured more        al., 2006; Andreu-Hayles et al., 2015; Ohashi et al., 2016;
severe climate conditions during the earth’s history. In this       Baker et al., 2017; Linares et al., 2017; Witt et al., 2017). The
respect conclusive evidence is lacking, and a better under-         vast majority of atomic bomb tests have been carried out in
standing of baobab ecophysiology and how they generally             the Northern Hemisphere, resulting in a delay in atmospheric
respond to temperature and rainfall variations, as well as to       mixing and five different zones separated by atmospheric cell
extremes like drought but also to heavy, cyclone-related rain-      boundaries (three in the Northern Hemisphere, two in the
fall events that can occur in parts of their distribution area      Southern Hemisphere) (Fig. 1a) (Hua et al., 2013). Despite
(e.g., South Africa, Mozambique or Oman), is required.              an increasing number of studies that reconstruct the atmo-
   At a few baobab locations, tree-ring parameters such as          spheric radiocarbon content of the bomb peak period from
stable isotopes (δ 13 C, δ 18 O) of wood cellulose and also tree-   tree rings (e.g., Hua et al., 2013; Turney et al., 2018), tree-
ring width were shown to correlate significantly with climate       ring radiocarbon studies in zones close to the Equator (NH3 ,
parameters (Robertson et al., 2006; Woodborne et al., 2015,         SH3 ) remain scarce and need to be refined. In this regard,
2016; Slotta et al., 2017). However, initial dendrochronolog-       our study contributes to the growing body of tree-ring radio-
ical and subsequent dendroclimatological analyses are ham-          carbon records from these zones; however, because of the
pered by the baobab’s complex stem anatomy (Fig. 2a–d). A           peculiar stem anatomy and its high content of parenchyma,
baobab tree ring generally consists of a diffuse porous wood        long-lived baobab trees may not be the best candidates for
section dominated by woody fibers and vessels followed by           high-precision reconstruction of the atmospheric radiocarbon
a terminal parenchyma band (TPB). Since the stems are spe-          content.
cialized for water storage, parenchyma cells make up 69 %–             The baobab site selected for this study is in the Dhofar re-
88 % of their total wood content (Chapotin et al., 2006a).          gion of Oman and is located along the northeastern edge of
Apart from TPBs, parenchyma cells form a sheath around              the species’ natural distribution (Wickens and Lowe, 2008).
associated vessels (paratracheal vasicentric), as well as in        This follows a common approach in dendroecology and den-
fine bands, clusters or rays (apotracheal) that are irregularly     droclimatology to select sites close to the ecological limit
dispersed among fibers and lack an association with vessels         of a species to ensure a clearer signal of the limiting envi-
(Fisher, 1981; Neumann et al., 2001; Rajput, 2004; Wickens          ronmental and climatic factors (Fritts, 1976; Smith, 2008).
and Lowe, 2008). Except for abundant parenchyma cells dis-          The woodlands and forests along the Dhofar Mountains are
persed among wood fibers and vessels, the different forms of        a paleo-African relict of a moist vegetation belt that once
baobab parenchyma are illustrated in the schematic drawing          stretched beyond the southern Arabian Peninsula into Asia
of Fig. 2d. The extraordinary high abundance of parenchy-           (Kürschner et al., 2004; Hildebrandt and Eltahir, 2006). Up-
mal tissue creates difficulties in distinguishing TPBs from         welling along the southern coast of Oman lowers the Ara-
other tangentially oriented non-annual parenchyma bands             bian Sea’s surface temperature and consequently cools the
throughout the woody tissue, especially because the thick-          moisture-rich air masses of the southwest monsoon winds.
ness of TPBs can vary greatly around the stem (Chapotin et          Once the dew point is reached, fog and low clouds form and
al., 2006c; Slotta et al., 2017). Ring counting on baobabs of       then drift inshore towards the mountain range (Kürschner
known age can result in about 98 % accuracy of the actual           et al., 2004). Compared to other baobab populations, this
tree age (Guy, 1970), but even opposing radii of the same in-       site is therefore characterized by mostly horizontal precipita-
dividual may differ in absolute numbers (Johansson, 1999).          tion (i.e., cloud water interception within the canopy; Hilde-
UV-light-induced fluorescence was found to be very helpful          brandt and Eltahir, 2006). Nevertheless, precipitation season-

Biogeosciences, 18, 3539–3564, 2021                                                    https://doi.org/10.5194/bg-18-3539-2021
F. Slotta et al.: High-resolution 14 C bomb peak dating and climate response analyses                                                   3541

Figure 1. Context of the study site. (a) World map showing the northern hemispheric (NH) and southern hemispheric (SH) zones of atmo-
spheric bomb 14 C (after Hua et al., 2013). Zones close to the Equator (NH3 , SH3 ) are still underrepresented in studies reconstructing the
atmospheric radiocarbon indicate content. The star indicates the study site; sites labeled with letters (a)–(i) correspond to sample locations
of F14 C studies referred to in Fig. 5. (b) Map showing the location (yellow star) of the tree site Wadi Hinna (318 m a.s.l.) at the edge of
the Dhofar Mountains in southern Oman (17◦ 030 N, 54◦ 360 E) (map topography based on SRTM and bathymetry data from Becker et al.,
2009). Prevailing seasonal wind patterns are shown by blue (summer monsoon, rainfall season) and purple arrows (winter monsoon, dry
season). Light blue arrows indicate upwelling of deep waters from the Arabian Sea. (c) Climate diagram for the area around Wadi Hinna
(17.0–17.5◦ N, 54.0–54.5◦ S) with average mean precipitation (bars indicating minima and maxima; source: GPCC, gpcc_V7_05) and tem-
perature for 1942–2013 (dotted lines representing Tmin and Tmax , respectively; source: CRU TS4.01, GPCC V7_05). The isotopic signature
of the Arabian Sea water and the precipitation around the study site is indicated in dark grey and varies significantly between monsoonal and
non-monsoonal precipitation (Wushiki, 1991; Strauch et al., 2014). Average daily sunshine hours are given in orange (1979–1990, NOAA:
ftp://ftp.atdd.noaa.gov/pub/GCOS/WMO-Normals/RA-II/OM/41316.TXT (last access: 25 May 2021), and the timing of the summer mon-
soon and the approximate growing season of the baobab trees is indicated in green. (d) Sampled baobab tree at Wadi Hinna.

ality within a calendar year is defined by a single wet period,          climate data. Usually, tree-ring stable isotopes show a high
and the deciduous habit of the species in general should favor           sensitivity to external drivers, such as weather conditions,
the formation of annual tree rings.                                      making them a valuable tool to reconstruct the environmen-
   Where tree rings are anatomically non-distinct, intra-                tal and climatic influences during tree growth (e.g., Fichtler
annual analysis of stable isotopes (δ 13 C, δ 18 O) can help to          et al., 2010; Hartl-Meier et al., 2015; Szejner et al., 2016;
identify annual growth increment provided that a general sea-            van der Sleen et al., 2017). The climate signature of tree-ring
sonally recurring pattern prevails in the intra-annual stable            width and δ 13 C basically originates from internal climate re-
isotope records (e.g., Poussart et al., 2004; Anchukaitis et             sponse mechanisms, driven by species-specific physiology,
al., 2008; Pons and Helle, 2011; Xu et al., 2014; Ohashi                 as well as carbon isotope fractionations during photosynthe-
et al., 2016). Hence, we wanted to test for recurring pat-               sis at leaf level. Elevated δ 13 C values in tree rings are mainly
terns in the intra-annual stable isotope data from a well-dated          caused by a reduction in stomatal conductance (as a result of
baobab tree-ring record consolidated by radiocarbon dating.              drought stress) and/or an increase in photosynthetic activity
After discerning intra-annual trends, referred to in this study          (Scheidegger et al., 2000). In both cases the leaf internal CO2
as isotope courses, we aimed at establishing the relationship            concentration declines and leads to a reduced enzymatic dis-
between the inter-annual variability of stable isotope param-            crimination against 13 C (Farquhar et al., 1982; Farquhar and
eters, minimum, maximum and mean values with monthly                     Cernusak, 2012). However, since increased photosynthetic

https://doi.org/10.5194/bg-18-3539-2021                                                           Biogeosciences, 18, 3539–3564, 2021
3542                                    F. Slotta et al.: High-resolution 14 C bomb peak dating and climate response analyses

Figure 2. Wood anatomy of the sampled baobab core. The right side of each photograph is unintentionally darker, causing vertical cutoffs
in the stitched panorama. White asterisks mark positions of missing rings identified by radiocarbon dating. (a) Stitched core picture pho-
tographed under ultra-violet light with automatic white balance showing alternating diffuse porous wood sections and clearly defined terminal
parenchyma bands. Tree-ring boundaries and years of growth are indicated for the analyzed core section, i.e., from cambium (white arrow,
top left) until 1941 (white triangle). (b) Enlarged core section (grey frame on top) with indicated tree-ring boundaries (white lines), intra-
annual subsamples (black lines), radiocarbon-dated samples (white triangles: holocellulose; grey triangles (1970, 1974): alpha cellulose) and
years of growth. Boundaries indicated by dashed white lines were only identified after additional 14 C analyses. (c) Schematic drawing of an
increment core section indicating the high abundance of radial and tangential parenchyma bands. Tree rings end with a terminal parenchyma
band (TPB); however, they also contain intra-annual tangential parenchyma bands of various thicknesses. Intra-annual tangential slices of
ca. 1 mm thickness were dissected with a scalpel (dashed lines). Two-thirds of each slice was kept for F14 C, and one-third was used for
stable isotope analysis. (d) Schematic drawing of a cross-section view illustrating different peculiarities of parenchyma tissue in baobabs
(parenchyma cells dispersed among wood fibers and vessels not shown). For details, see text.

Biogeosciences, 18, 3539–3564, 2021                                                           https://doi.org/10.5194/bg-18-3539-2021
F. Slotta et al.: High-resolution 14 C bomb peak dating and climate response analyses                                           3543

activity is unlikely under drought stress, high δ 13 C values        2     Materials and methods
are typically interpreted as a drought signal in areas where
growth is limited by moisture availability (Brienen et al.,          2.1    Study site and climate
2011; Schollaen et al., 2013; Woodborne et al., 2015, 2016).
Following this approach, the higher the δ 13 C values become,        The baobab tree analyzed for this study is one of more than
the more severe the drought episode is. δ 18 O of tree-ring cel-     60 individuals growing in Wadi Hinna (17◦ 030 N, 54◦ 360 E;
lulose is first related to the δ 18 O of the precipitation source    318 m above sea level (m a.s.l.)) at the edge of the Dho-
via soil water and then later by internal processes. δ 18 O of       far Mountains in southern Oman (Fig. 1b, d). The Dho-
soil water constitutes the δ 18 O input to the arboreal system       far Mountains reach elevations of about 1450 m a.s.l. and
and usually represents an average δ 18 O over several precip-        are separated from the Arabian Sea by a narrow coastal
itation events modified by partial evaporation from the soil         plain. The prevailing wind system is defined by four differ-
(depending on soil texture and porosity) and by a possible           ent seasons (Walters and Sjoberg, 1990; Charabi et al., 2011):
time lag, depending on rooting depth (Sprenger et al., 2017;         (1) winter (December–March), in which the region is dom-
Treydte et al., 2014). δ 18 O of tree-ring cellulose is dependent    inated by the northeast monsoon; (2) the spring transition
on two internal processes: evaporative 18 O enrichment of leaf       (around April–May), during which the northeasterly circula-
water via transpiration and leaf-to-air vapor pressure deficit       tion breaks down while southwesterly trade winds enter the
(VPD), as well as biochemical fractionations and isotopic ex-        region; (3) summer (around mid-June–September), in which
change of 18 O with trunk water during cellulose biosynthe-          damp air masses of the southwest monsoon (also khareef)
sis (Roden et al., 2000; Kahmen et al., 2011; Treydte et al.,        encounter the mountain range and bring dense fog and light
2014, and citations therein). In this regard, δ 18 O in tree rings   rain (Kwarteng et al., 2009); and (4) the autumn transition
from (sub-)tropical timber has been proven to strongly repre-        (around October–November), during which the northeasterly
sent the isotopic composition of rain, i.e., source water (e.g.,     flow is re-established.
Evans and Schrag, 2004; Brienen et al., 2012, 2013; Boy-                The closest meteorological station to the study site is
sen et al., 2014; Baker et al., 2015, 2016; van der Sleen et         located at Salalah airport (17◦ 010 N, 54◦ 040 E; 20 m a.s.l.),
al., 2015, 2017). Variation of δ 18 O in rainfall is determined      57 km west from Wadi Hinna. Due to the distance and al-
by several factors where the amount of rain (Araguas et al.,         titudinal difference between station and study site, the use
1996) plays a key role in producing a strong inverse corre-          of Climate Research Unit (CRU TS4.01; modified after Har-
lation. Apart from isotopic composition of the source water,         ris et al., 2020) interpolated grid data was considered more
drought conditions with increasing VPD can lead to increas-          appropriate for defining the monthly climatology and for cli-
ingly unfavorable growth conditions (with reduced tree-ring          mate response analysis. The mean annual temperature for the
widths) paralleled by high δ 18 O values of corresponding tree-      reference period 1945–2013 was 23.1 ◦ C. Precipitation data
ring cellulose (e.g., Treydte et al., 2014).                         (also CRU TS4.01) and the Global Precipitation Climatol-
   We performed highly resolved inter- and intra-annual ra-          ogy Centre data (GPCC V7_05, Schneider et al., 2015) cov-
diocarbon and stable isotope measurements on tree-ring cel-          ering the study site (17.0–17.5◦ N, 54.0–54.5◦ S) were tested
lulose of a baobab tree from Oman in order to (1) produce a          for statistical similarity against data from the Salalah station
time series of tree-ring width and intra-annual stable isotope       (1945–2013) in order to confirm which data set best repre-
ratios (δ 13 C, δ 18 O) and (2) compare 14 C data of baobab tree-    sents the temporal variability of the study region. GPCC data
ring cellulose with published reconstructions of atmospheric         showed the highest correlation (rGPCC = 0.91, p
3544                                 F. Slotta et al.: High-resolution 14 C bomb peak dating and climate response analyses

ble 1). Monsoon precipitation from the Dhofar Mountains           amounting to a total of 360 samples with resolutions between
generally correlates with the oxygen isotopic composition         1 and 11 samples per year. Because parenchyma cells can un-
of the Indian monsoon rainfall along the southeast coast of       dergo cell division within the stem independent from the vas-
Oman (Strauch et al., 2014) and shows marginal variation          cular cambium (Chapotin et al., 2006a; Spicer, 2014), rays
between −0.5 ‰ and +0.7 ‰, with values close to the mean          and other parenchymatous structures (see Fig. 2d for illustra-
δ 18 O of 0.61 ± 0.02 ‰ reported for the Arabian Sea water        tion) that may be carrying a different, non-contemporaneous
(Lambs et al., 2011). Minimal difference exists in the oxy-       radiocarbon and stable carbon isotope signal than the sur-
gen isotopic signature of monsoon rain, fog and interception      rounding wood vessels and fibers were removed from the
waters (Table 1). In contrast, water samples collected in the     wood slices to avoid possible contamination. A potential
Dhofar Mountains from cyclones that sometimes bring enor-         fraction of parenchyma cells in between vessels and fibers
mous quantities of rainfall (e.g., 1 or more years of rainfall    was considered to be small. Two-thirds of each wood slice
amount in a single day) show highly variable but significantly    were separated for radiocarbon dating while the remaining
low δ 18 O signatures down to −11 ‰ (Dansgaard, 1964).            third was kept for stable isotope analyses (Fig. 2c). Each ter-
                                                                  minal parenchyma band (TPBs) was also retained and used
2.2    Field work                                                 for radiocarbon analysis.

The sampling took place in early April 2015 when the trees        2.4   Radiocarbon dating
were still without leaves. Ten baobabs were sampled in to-
tal. Increment cores of 12 mm in diameter and up to 80 cm in      The samples were prepared for radiocarbon analysis at ETH
length were taken at breast height from four different orienta-   Zurich according to a protocol for high-precision measure-
tions (NE, SE, SW and NW). While in the field, core samples       ments (Sookdeo et al., 2019). Oxalic acid II (OXII, NIST
were stored in an airtight and cool container, and they were      SRM 4990C) was used for standard normalization. Inter-
later stored in a freezer to prevent mold growth and distor-      nal wood reference materials from 1515 CE (pine from
tion of wood anatomical features that could be caused by the      Switzerland) and two different radiocarbon-free wood blanks
dehydration of parenchyma tissue.                                 (New Zealand kauri and lignite from Reichwalde, Germany)
                                                                  were repetitively analyzed together with the annual wood
2.3    Sample preparation and wood increment dissection           samples. The wood blanks were used for blank subtraction
                                                                  in the data evaluation process, and the 1515 CE references
The baobab tree showed rather wide growth rings favor-            were used for quality control only (Brehm et al., 2021).
able for intra-annual analysis, possibly due its immedi-          In total wood 110 samples were extracted for holocellulose
ate proximity to and interaction with an ephemeral stream.        with a base–acid–base–acid-bleaching procedure (Němec et
The SW-oriented core was chosen because its parenchyma            al., 2010). Ten samples were further purified to alpha cel-
bands were very distinct and because the perpendicular            lulose with an additional base treatment (17.5 % NaOH for
orientation of vessels and fibers with respect to the long        2 h at room temperature) followed by washing and freeze-
axis of the core allowed for precise subsampling. The core        drying. The cellulose samples were then graphitized using
surface was prepared with a razor blade to expose the             an Automated Graphitization Equipment (AGE III) coupled
anatomical features of each tree ring, and photographs were       to an elemental analyzer (EA: Vario MICRO cube; Wacker et
taken with a fluorescence microscope (Nikon MULTIZOOM             al., 2010b). Once graphitized, the samples were immediately
AZ100M, V-2A: 380–420 nm; camera head: Nikon digi-                pressed into targets to minimize their interaction with air,
tal sight DS-Fi1c; light source: C-HGFI HG precentered            and their 14 C content was measured with a MICADAS mass
fiber illuminator (130 W mercury lamp); program: NIS Ele-         spectrometer (Wacker et al., 2010a). Since the tree-ring struc-
ments 4.30.01 ©Laboratory Imaging 1991–2014). Individual          ture for the outermost wood section was often hard to inter-
micro-pictures were assembled to give one complete stitched       pret (Johansson, 1999; Slotta et al., 2017), we did a five-point
panorama picture of the wood core, which was printed for          screening for the bomb peak before samples were selected
further sampling documentation (scale 1 : 7.6) and provided       from each of the clearly identifiable growth rings onwards
the basis for the tree-ring width measurements (Fig. 2a).         from what we thought to be 1942. We avoided developing
   For radiocarbon and stable isotope analyses, tangential        a longer record by including older tree rings because of a
wood slices of approximately 1 mm were cut parallel to the        lack of reliable precipitation data beyond this date that could
fiber orientation and in radial direction from the cambial zone   be used in calibration. With intention to minimize possible
towards the pith (Fig. 2b, c, d). Since the tree-ring structure   carryover effects from the implementation of previous years’
for the outermost wood section was often hard to interpret        non-structural carbohydrates (NSCs) into the current year’s
(Johansson, 1999; Slotta et al., 2017), we did a five-point       wood cellulose, the samples for dating were selected from
screening across a region of the core that based on our ring      the last third of each growth structure while steering clear
counting was estimated to be the location of the bomb peak.       of the TPB by at least one sample, where possible (Fig. 2b).
The entire bomb peak and the decade before were dissected,        For comparison, cellulose samples of five individual TPBs

Biogeosciences, 18, 3539–3564, 2021                                                  https://doi.org/10.5194/bg-18-3539-2021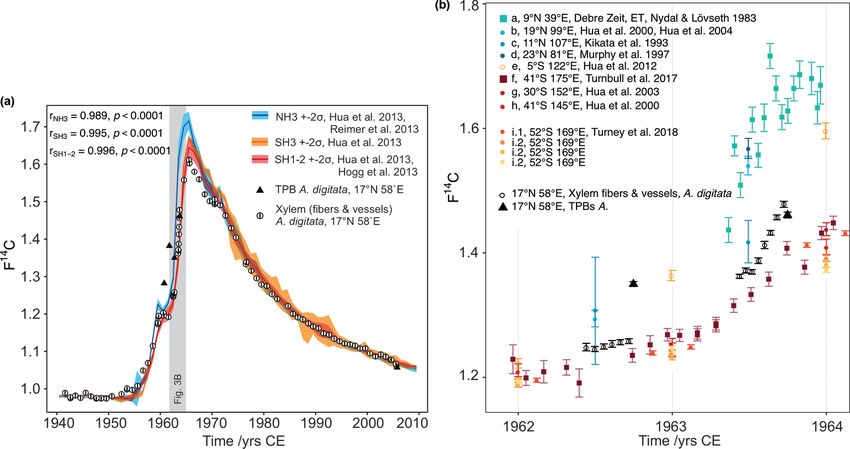
F. Slotta et al.: High-resolution 14 C bomb peak dating and climate response analyses                                                     3545

Table 1. Compilation of published oxygen stable isotope data of monsoon rainfall, fog, stemflow, throughfall and cyclone water from the
Dhofar Mountains for different years. Site coordinates are as follows: Salalah (17◦ 010 N, 54◦ 040 E), Qairoon Hairitti (17◦ 150 N, 54◦ 050 E),
Gogob (17◦ 120 N, 54◦ 060 E), Tawi Atir (17◦ 060 N, 54◦ 310 E), and Qarhanout (17◦ 070 N, 54◦ 370 E).

        Year     Sampling           Type               δ 18 O       SD      n    Site                 Altitude    Reference
                 period (mm/yy)                    ‰ VSMOW                                           (m a.s.l.)
        1988     06/01–08/12        rainfall              0.16     0.37    30    Salalah                     20   Wushiki (1991)
        1989     06/03–05/08        rainfall              0.31     0.57    25    Salalah                     20   Wushiki (1991)
        1989     07/01–08/08        rainfall             −0.52     0.26    42    Qairoon Hairitti           880   Wushiki (1991)
        2008     Jun–Aug            rainfall              0.03     0.02     2    Gogob                      450   Strauch et al. (2014)
        2009     Aug                rainfall             −0.22     0.07     4    Gogob                      450   Strauch et al. (2014)
                Average             rainfall             −0.05     0.26                                103
        2009     08/17–08/19        fog                   0.09     0.08     3    Gogob                      450   Strauch et al. (2014)
        2009     08/18–08/20        fog                  −0.08     0.16     2    Tawi Atir                  650   Strauch et al. (2014)
                Average             fog                    0.01    0.12                                 5
        2009     08/17–08/19        throughfall           0.02     0.02     3    Gogob                      450   Strauch et al. (2014)
        2009     08/18–08/20        throughfall          −0.01     0.25     2    Tawi Atir                  650   Strauch et al. (2014)
        2011     08/09–08/11        throughfall           0.04     0.32     8    Tawi Atir                  650   Strauch et al. (2014)
                Average             throughfall            0.02    0.20                                13
        2009     08/17–08/19        stemflow               0.09    0.07     3    Gogob                      450   Strauch et al. (2014)
        2009     08/18–08/20        stemflow               0.03    0.24     2    Tawi Atir                  650   Strauch et al. (2014)
                Average             stemflow               0.06    0.16                                 5
        1988     Apr                cyclone              −2.79              1    Salalah                  20      Wushiki, 1991
        2011     11/04              cyclone             −10.76              1    Qarhanout near        ∼ 940      Strauch et al. (2014)
                                                                                 Jabal Samhan

were analyzed for 1960–1963 (n = 4) and 2005. For the pe-                 width chronology (e.g., from J. excelsa, Sass-Klaassen et
riod between 2005 and 2015, for which by visual inspection                al., 2008) exists from the study region that could be used
annual rings could not be identified, 19 samples were dis-                as a reference and was available for comparison. Calendar
sected, of which 17 samples were dated. In addition, intra-               ages were calculated from the F14 C values of the TPBs us-
ring radiocarbon analysis was performed on the tree rings of              ing the program OxCal v4.3.2 (Bronk Ramsey, 2017) and
1962 (6 samples) and 1963 (8 samples).                                    the post-bomb atmospheric NH3 and SH1−2 curves (Hua et
   Comparison of 14 C of the assumed tree rings with atmo-                al., 2013). Furthermore, we visually and statistically cross-
spheric 14 C data comprising the bomb peak values (see dif-               dated (COFECHA, Holmes, 1983) time series of ring-width
ferent zones in Fig. 1a) allowed for annual dating between                and stable isotopes with the seasonally and annually resolved
1956 and 1980; before and after these dates the differentia-              precipitation amount (May–September, June–September and
tion between the atmospheric 14 C values of consecutive years             January–December) for the grid cell 17–17.5◦ N, 54–54.5◦ E
is not sufficient enough to securely designate the age of wood            (GPCC V7.05, Schneider et al., 2015).
increments (see Hua et al., 2003). The normalized 14 C ac-
tivity ratio (F14 C; Reimer et al., 2004) of the assumed tree             2.5   Stable isotope analysis
rings was plotted against the calibration curve for the corre-
sponding hemispheric zone NH3 (Hua et al., 2013) and fitted               For the stable isotope analyses (δ 13 C, δ 18 O), all 360 sam-
by peak-to-peak correlation (± 5 years). Because of an ob-                ples (excluding TPBs) were holocellulose extracted using the
served offset in the data sets, the calibration curves for SH3            devices and procedures described by Wieloch et al. (2011),
and SH1−2 (Hua et al., 2013) were also included in the com-               homogenized by ultrasonic treatment (Laumer et al., 2009),
parison (Fig. 3). Each intra-ring baobab F14 C sample posi-               and freeze-dried for at least 48 h. A thorough description of
tion on the time axis is relative to their position within the            the background and details on the methodology is given by
respective tree ring of a growing season reflecting approxi-              Helle et al. (2021). Prior to mass spectrometric analysis, 130–
mately June until September. In the case of suspected miss-               180 µg of cellulose and reference material (IAEA CH-3, CH-
ing rings, the wood anatomy was reviewed and additional                   6 and Merck cellulose), respectively, were packed in silver
samples were radiocarbon dated. No properly dated tree-ring               capsules and stored overnight at 100 ◦ C in a vacuum drying

https://doi.org/10.5194/bg-18-3539-2021                                                             Biogeosciences, 18, 3539–3564, 2021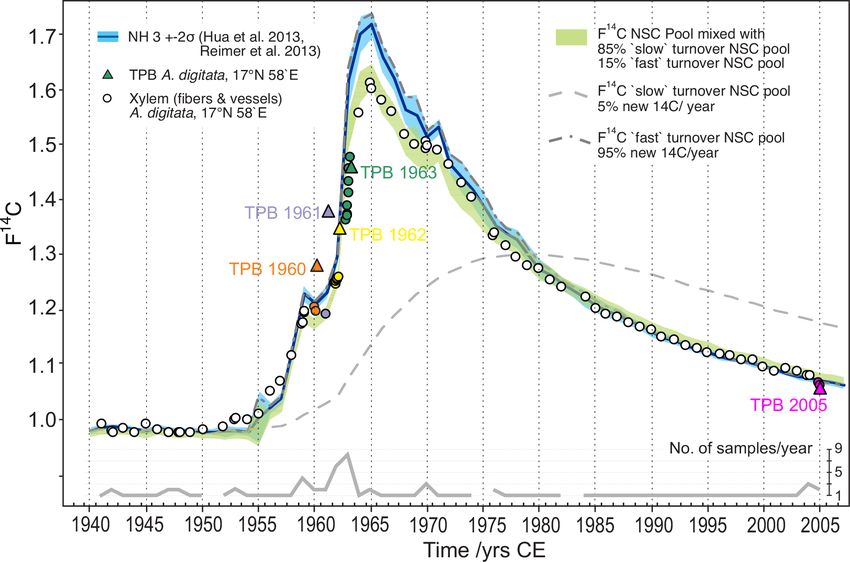
3546 F. Slotta et al.: High-resolution 14 C bomb peak dating and climate response analyses
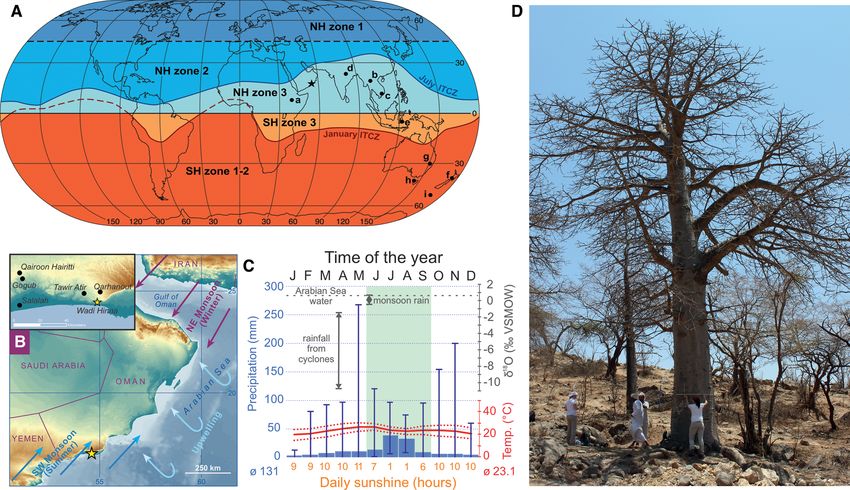
Figure 3. (a) Comparison of baobab F14 C values with F14 C curves for both hemispheres. Data prior to 1950 were taken from IntCal13 and
SHCal13 (Reimer et al., 2013, Hogg et al., 2013). Data for 1950–2010 originate from Hua et al. (2013) (line: mean value, shade: ± 2 standard
deviations (σ )). The southern hemispheric increase in atmospheric F14 C lags behind the Northern Hemisphere by about 1 year, and its peak is
considerably shallower. The overall conformity of the baobab measurements (white dots with 2σ error bar) with the course of the calibration
curves proves the annual character of the growth zones. The values for baobab tree-ring cellulose (xylem fibers and vessels) lie between the
values for both hemispheres for the steep increase in F14 C and then apparently follow the course of SH1−2 , although temporary shifted due
to different vegetation periods. Four out of five terminal parenchyma bands (TPB, black triangles; error bars are smaller than the symbol
size) show either much higher F14 C values (1960–1962) or a lower value (2005) than the corresponding tree ring. (b) Baobab measurements
in comparison to atmospheric (squares) and tree-ring data (circles) for NH3 (a–d), SH3 (e), and SH1−2 (f–i) between 1962 and 1964. These
years show strongly increasing atmospheric F14 C values and were chosen to investigate the intra-annual baobab F14 C values. For this period,
the baobab F14 C values lie between the higher NH3 / SH3 and the lower SH1−2 values. A dip within the first half of the tree ring is followed
by a slight (1962) or steep (1963) increase of the values. Note the inter- and intra-species’ variability from the same site (i.1 and i.2, Turney
et al., 2018).
oven. Simultaneous dual measurements of δ 13 C and δ 18 O crimination against 13 C, an additional moderate correction of
were performed on carbon monoxide derived from high- 0.073 ‰ per 10 ppm change (Kürschner, 1996) was applied,
temperature TC/EA pyrolysis (1400 ◦ C) coupled online via a producing a corrected δ 13 C∗ record.
ConFlo IV to an IRMS Delta V Plus (Thermo Fisher Scien- The intra-annual isotopic signatures were plotted against
tific, Bremen, Germany). Values are referred to VPDB and their relative position within the tree ring normalized to
VSMOW, respectively, with a reproducibility of ≤ 0.15 ‰ 100 % of the respective tree-ring width. Annual tree-ring sta-
for δ 13 C and ≤ 0.25 ‰ for δ 18 O. ble isotope values were obtained from averaging intra-ring
In order to use δ 13 C of baobab tree-ring cellulose δ 13 C∗ and δ 18 O values.
13
(δ Craw ) as a measure for plant response to weather condi-
tions, the δ 13 Craw values have been corrected (δ 13 C∗ ) for the 2.6 Statistical analysis
anthropogenic changes in the long-term trend of the atmo-
spheric CO2 source. Rising atmospheric CO2 concentrations Ring widths were measured for the entire core and detrended
(pCO2 ) and correspondingly declining δ 13 C of atmospheric using an exponential fit (R program, package dplR; Bunn et
CO2 (δ 13 CO2 ) prevailing since the onset of industrialization al., 2018), resulting in a ring-width index chronology (RWI).
(1850 CE) were addressed by subtracting for each tree-ring Due to different intra-annual resolution of the stable isotope
stable isotope value the annual changes in δ 13 CO2 , obtained time series (ranging from 2 to 11 samples per year), the mean
from direct measurements (White et al., 2015). Since trees annual signature might be blurred and thus may weaken the
respond to increased atmospheric pCO2 with higher dis- climate response of intra-ring isotopic records. Hence, be-
Biogeosciences, 18, 3539–3564, 2021 https://doi.org/10.5194/bg-18-3539-2021F. Slotta et al.: High-resolution 14 C bomb peak dating and climate response analyses 3547
sides mean isotopic signatures (δ 13 C∗mean , δ 18 Omean ), we also 3.2 Radiocarbon measurements and dating
tested minimum (δ 13 C∗min , δ 18 Omin ) and maximum (δ 13 C∗max ,
δ 18 Omax ) stable isotope values for their climate sensitivity. 3.2.1 Holocellulose vs. alpha cellulose
The obtained time series (RWI, δ 13 C∗min/max/mean ,
18 The values of 6 out of 10 holocellulose and alpha-cellulose
δ Omin/max/mean ) were tested for autocorrelation.
pairs were equal within 2 standard deviations and 9 out of
Moving mean, variance and correlation tests (window
10 within 3 standard deviations. Based on these indications
size = 15 years) were performed to discretize the time
it was not necessary to perform an alpha-cellulose extraction
series in terms of central tendency, variation and trend
procedure for this species.
behavior. The response of these parameters to weather
conditions was then evaluated by calculating the Pearson 3.2.2 Inter-annual F14 C variability
correlation with monthly and seasonally averaged data of
precipitation (GPCC V7.05, Schneider et al., 2015), cloud The F14 C values of the assumed tree rings (excluding the
cover, temperature (Tmin/max/mean ) and vapor pressure (CRU younger, outer stem without clearly identifiable TPBs) fit
TS4.01) for the grid cell 17–17.5◦ N, 54–54.5◦ E, as well the overall shape of the bomb peak curve relative well, thus
as relative humidity (CRU_blendnewjul08_RH_7303cf) demonstrating their annual character (Fig. 3). Anomalies in
for the area covering 15–20◦ N, 20–25◦ E. The impact of the F14 C record led to a review of the wood anatomy and con-
drought on the wood parameters was estimated using the sequently the identification of three more tree rings (bound-
Standardized Precipitation Evapotranspiration Index (SPEI) aries marked by dashed lines in Fig. 2), while the year 1975
for the grid cell 17–17.5◦ N, 54–54.5◦ E. SPEI assesses was regarded as absent from our time series. Our interpreta-
droughts by using both precipitation and temperature vari- tion of the intra-annual F14 C data was confirmed by visual
ability at different timescales (Vicente-Serrano et al., 2010a, and statistical comparison of the TRW chronology with pre-
b, 2015). Where applicable, the coefficient of determina- cipitation data. Comparison with precipitation data also indi-
tion (COD = r 2 × 100 %) has been added for explanatory cated missing rings in 1951 and 1983 that could not be con-
meaning. firmed, because year-to-year variability of atmospheric F14 C
data was too low for unambiguous detection. The last iden-
tifiable TPB corresponds to the tree ring of 2005; thus, the
3 Results
outermost 15.3 mm of wood represented 9 years of growth
3.1 Wood anatomy (2006–2014) that could not be distinguished. Due to the gen-
tle slope of the calibration curve during this period, we re-
The TPBs were generally well defined in this ca. 100- frained from assigning the measured F14 C values to a spe-
year-old tree, with a mean width of 1.5 mm (range: 0.5– cific year. Hence, the final annually dated baobab time series
2.4 mm). The only exceptions were the outermost 15.3 mm investigated further covers the period from 1941 until 2005.
of wood and three rings with TPB widths ≤ 0.1 mm (i.e., The highest correlation between the revised baobab time
1973, 1981, 1982) which were finally confirmed by the ra- series and calibration curves from different hemispheric
diocarbon dating. In general, the width of the TPBs was zones (Fig. 3a, b) was reached for a peak-to-peak fit with
significantly correlated to the width of the corresponding SH1−2 , although the study site is located in zone NH3
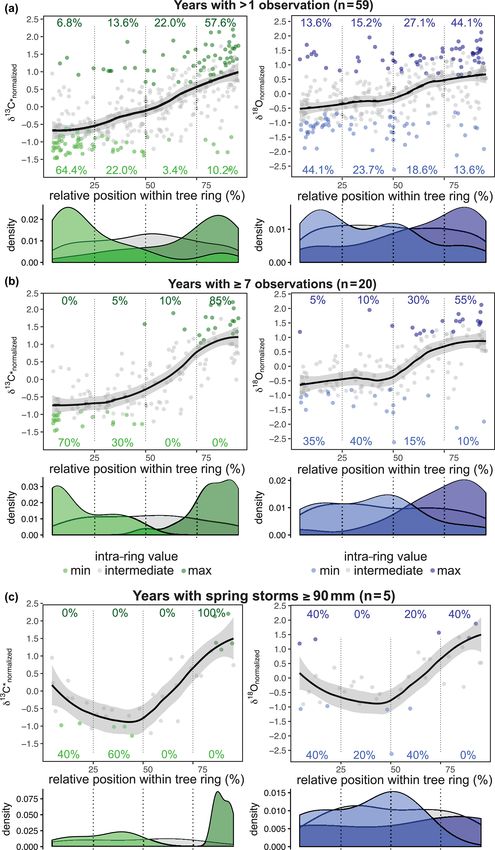
tree ring (r0 = 0.45, COD0 = 20.3 %, p3548 F. Slotta et al.: High-resolution 14 C bomb peak dating and climate response analyses
appear to be on average younger than the fibers and vessels ries with at least seven samples per year (n = 20) resulted in a
of their corresponding tree ring (Table 2). distinct intra-ring pattern (Fig. 5b). For δ 18 O, the values were
still more scattered than for δ 13 C∗ , with 75 % of δ 18 Omin oc-
3.3 Statistical characteristics of tree-ring parameter curring in the first half (35 % within the first quarter) and
time series 85 % of δ 18 Omax occurring in the second half of the tree ring
(55 % within the last quarter). The center of the tree ring re-
Despite the corrections made for atmospheric change vealed a short-term dip in δ 18 O before rising towards the end
in δ 13 C and pCO2 , the δ 13 C∗ time series shows a of the tree ring, which is in contrast to δ 13 C∗ , which showed
slightly negative trend over time (r = −0.32, COD = 10.2 %, slightly lowered but not declining values in the mid-section
p = 0.011) (Fig. 4). The mean δ 13 C∗ value was – (Fig. 5b).
26.99 ± 1.21 ‰ (min: −29.77 ‰, max: −23.43 ‰), with
an observed mean range per year of 2.27 ‰ (maxi- 3.4.1 Intra-annual isotope course in years with heavy
mum range: 4.55 ‰ in 1963). δ 13 C∗max correlated with rainfall events due to spring or autumn cyclones
RWI (r = 0.31, COD = 9.6 %, p = 0.014) and strongly with
δ 18 Omax (r = 0.61, COD = 37.2 %, pF. Slotta et al.: High-resolution 14 C bomb peak dating and climate response analyses 3549
Table 2. Comparison of the F14 C values of terminal parenchyma bands (TPBs) and the corresponding tree ring (TR). In case of multiple
measurements per ring, the mean value was taken for comparison. Considering the youngest possible calibrated age, most TPBs are signifi-
cantly younger than the corresponding tree ring. The end of growth is assumed to be at the end of September, i.e., at 0.75 of each year. Please
note that the calibration always yields age ranges on the rising side of the bomb peak as well as on the falling part. For years ≤ 1964 only the
rising side and for years ≥ 1965 only the falling side were considered for consistency. Italic calibrated ages are viable, and others are only
theoretical and given for sake of completeness.
Sample ID Year of F14 CTB (Mean) Difference TB ages calibrated TB ages calibrated
wood F14 CTR TB–TR (%) with SH1−2 (95.4 %) with NH3 (95.4 %)
formation
242.PB 1960 1.281780 1.227284 4.4 (6.1 %) (5.7 %)
1962.6 CE to 1962.96 CE 1962.34 CE to 1962.64 CE
(4.8 %) (89.7 %)
1963.18 CE to 1963.42 CE 1979.3 CE to 1980.7 CE
(4.7 %)
1979.6 CE to 1979.88 CE
(76.6 %)
1980.12 CE to 1981.34 CE
(3.2 %)
1982 CE to 1982.2 CE
237.PB 1961 1.381735 1.286768 7.4 (35.5 %) (9.8 %)
1963.52 CE to 1964.08 CE 1962.76 CE to 1963.12 CE
(59.9 %) (85.6 %)
1975.2 CE to 1976.12 CE 1974.74 CE to 1976.08 CE
231.PB 1962 1.349989 1.266081 6.6 (13.7 %) (6.2 %)
1963.34 CE to 1963.76 CE 1962.58 CE to 1963 CE
(81.7 %) (89.2 %)
1976.3 CE to 1977.48 CE 1976.1 CE to 1977.66 CE
223.PB 1963 1.460845 1.414688 3.3 (7.3 %) (8.7 %)
1964 CE to 1964.2 CE 1962.98 CE to 1963.4 CE
(88.1 %) (72.2 %)
1972.48 CE to 1973.38 CE 1972.16 CE to 1973.06 CE
(14.5 %)
1973.28 CE to 1973.96 CE
19.PB 2005 1.056946 1.061611 −0.4 (5.0 %) (2.3 %)
1957.6 CE to 1958.08 CE 1957.62 CE to 1967.88 CE
(90.4 %) (1.2 %)
2008.18 CE to 2011.1 CE 2006.22 CE to 2006.36 CE
(91.9 %)
2006.84 CE to . . .
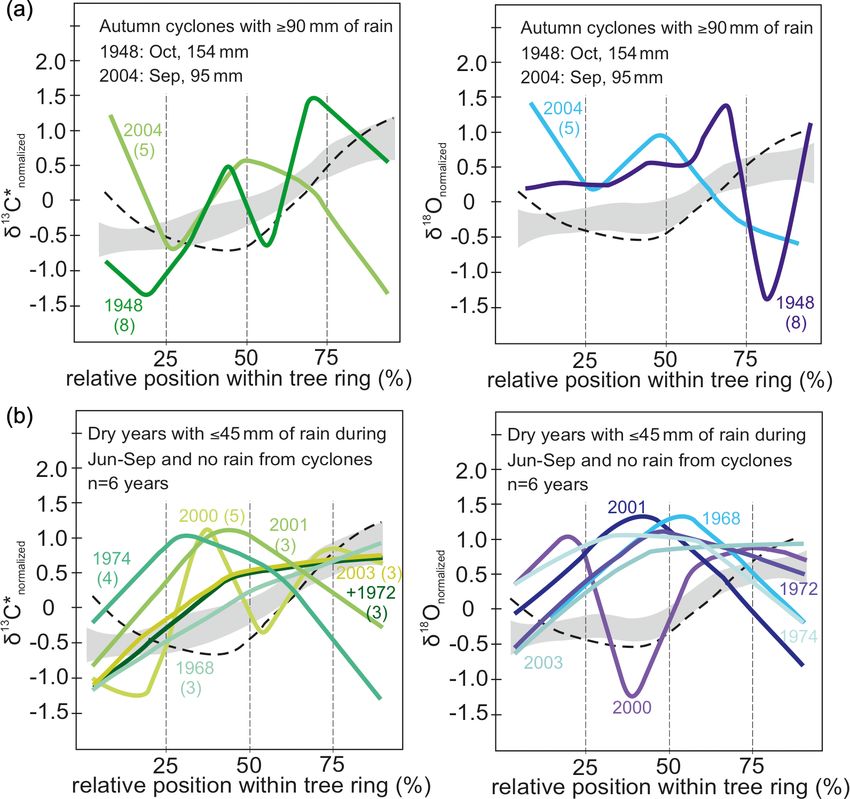
cipitation: 1968, 1972, 1974, 2000, 2001 and 2003. Except generally showed rather similar intra-ring trends in response
for the year 2000, all intra-ring δ 13 C∗ courses start with a to drought, with the highest values frequently located in the
distinct increase reaching δ 13 C∗max or values close to δ 13 C∗max mid-section of the intra-ring course (Fig. 6b).
within the first half of the tree ring (Fig. 6b). In general, intra-
ring δ 13 C∗ for the years 1968, 1972 and 2003 showed an 3.5 Statistical relations between weather conditions
increasing trend, with δ 13 C∗max reached towards the end of and tree-ring parameters
the ring, whereas in 1974, 2000 and 2001, δ 13 C∗max occurred
in the early half of the ring, followed by declining δ 13 C∗ Significant correlations between RWI, δ 13 C∗min/mean/max , and
(with the exception of 2000 that showed a complex multi- δ 18 Omin/mean/max and selected monthly climate variables re-
modal pattern). The intra-annual course for the year 2000 flecting moisture conditions at the site were observed for the
showed a much higher intra-ring stable isotope variation, but current and the previous year (Table 3, Fig. 7). RWI, com-
it was also the year with the most observations (n= 6) for prising annual radial growth, showed significant positive cor-
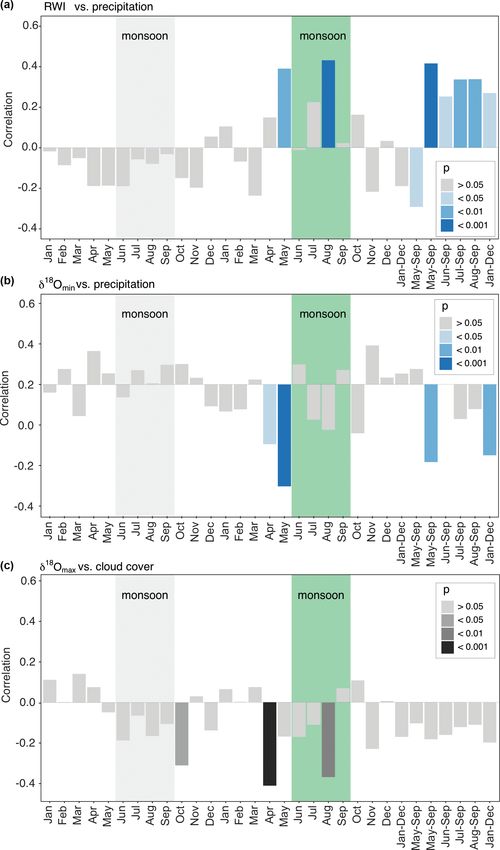
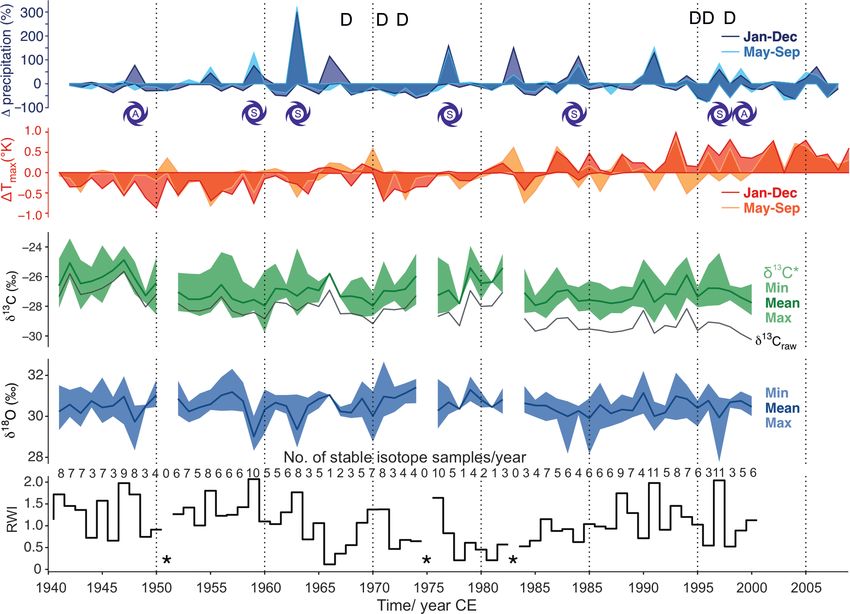
a year with low monsoon rain. In sum, both isotope species relations (p3550 F. Slotta et al.: High-resolution 14 C bomb peak dating and climate response analyses Figure 4. Analyzed baobab tree-ring parameters (ring width indices (RWI), δ 18 O, δ 13 C∗ ) together with available precipitation and Tmax data for the period 1941–2014. Precipitation is presented as percentage differences from the mean and Tmax as differences in Kelvin. Darker colors reflect differences on an annual basis and lighter colors for the monsoon period June–September. The stable isotope values (δ 13 C∗ , δ 18 O) are presented with minima, maxima and mean values for each year. Mean δ 13 C, uncorrected for effects of changing atmospheric CO2 concentration and corresponding δ 13 CCO2 , is given as a black line (δ 13 Craw ). Dry years with ≤ 45 mm of rain during the monsoon period are marked with D. Years with spring (S) or autumn (A) storms with ≥ 90 mm of rain are indicated by cyclone symbols. Missing rings caused gaps in the time series and are marked by asterisks. cipitation (Table 3, Fig. 7a). δ 13 C∗mean generally revealed January–December, February, October and November; see no relation to precipitation and only weak correlations with Table 3 for details). other climate variables. In contrast, δ 18 Omean correlated sig- nificantly and negatively with May precipitation, as well as the monthly aggregates, May–September and January– 4 Discussion December. Intra-ring minimum isotope values displayed only weak 4.1 F14 C values in baobab wood are very likely altered correlations between δ 13 C∗min and precipitation from previ- by carbohydrate metabolism ous year January and current year November, while no re- lations were found with other climate variables. Conversely, Situated in Oman, the baobab F14 C values were expected to δ 18 Omin correlated significantly with Tmax and all moisture fit the post-bomb atmospheric curve NH3 (Hua et al., 2013). related climate variables with δ 18 Omin , showing a strong re- However, they were found notably lower than NH3 and even sponse to pre-monsoonal May rainfall (Table 3, Fig. 7b). SH3 , around the bomb peak period (1964–1967, Fig. 3a). δ 13 C∗max showed more and better relationships with cli- A number of external factors can potentially be responsible mate quantities than δ 13 C∗mean and δ 13 C∗min . Significant corre- for the dilution of atmospheric 14 C: (1) fossil fuel dilution lations were found for May temperature, vapor pressure and from neighboring industrial and urban areas (Chakraborty et SPEI (1 month). The highest correlation to cloud cover was al., 1994, 2008), (2) volcanic emanations (e.g., Lefevre et revealed for δ 18 Omax in pre-monsoon April (Table 3, Fig. 7c). al., 2018), and (3) upwelling of carbon-rich waters causing Further significant correlations of δ 18 Omax were also found outgassing of “older” CO2 into the atmosphere (Takahashi with the climate conditions of the previous year (previous et al., 2009; Sreeush et al., 2018). We can exclude atmo- Biogeosciences, 18, 3539–3564, 2021 https://doi.org/10.5194/bg-18-3539-2021
F. Slotta et al.: High-resolution 14 C bomb peak dating and climate response analyses                                                           3551

Figure 5. Relative position of normalized δ 13 C∗ (green) and δ 18 O (blue) values (a–c). Smooth line illustrates the intra-annual course of the
isotope ratios with the standard error as the grey shaded area (loess fit with span = 0.6). (a) For both δ 13 C∗ and δ 18 O the first half of the tree
ring is dominated by minimum values and the second half by maximum values. (b) The common isotopic pattern becomes clearer for tree
rings with seven or more samples. δ 13 C∗ shows a gentle increase during the first two quarters and then increases strongly before leveling off
in the last quarter. δ 18 O is characterized by a dip in the mid-section before the steep rise of the values. (c) For years with spring cyclones
with ≥ 90 mm of rain (i.e., 1959, 1963, 1977, 1989, 2002) and five or more isotope values per year, δ 13 C∗ shows decreasing values within
the first half of the tree ring and a steep increase in the second half. The δ 18 O values show their minimum around the center of the tree ring,
followed by a steep rise towards the end of the tree ring.

https://doi.org/10.5194/bg-18-3539-2021                                                                 Biogeosciences, 18, 3539–3564, 2021
3552                                    F. Slotta et al.: High-resolution 14 C bomb peak dating and climate response analyses

Figure 6. (a) Intra-annual course of normalized δ 13 C∗ (green) and δ 18 O (blue) values for years with autumn cyclones bringing ≥ 90 mm
of rain (n = 2) and (b) dry years with ≥ 45 mm monsoonal precipitation and no rain from cyclones (n = 6). Numbers in brackets indicate
number of isotope samples analyzed per year. Grey shaded area marks the intra-annual course of isotope ratios with standard error for all
years with more than three observations. The dashed line indicates intra-annual course of isotopes for years with spring cyclones, illustrated
in detail in Fig. 5c. Rain from autumn cyclones may affect the intra-annual isotope signature by more strongly declining values towards the
end of a tree ring. Years with 45 mm of monsoon precipitation or less show an increase in δ 13 C∗ towards the middle of each tree ring and
then decline or increase only slightly towards the end. Rather similar seasonal trends can be observed for δ 18 O values. Hence, dry monsoon
seasons usually cause higher isotope values in the middle part of each tree ring than during normal years. Please see text for further details
on the conspicuous seasonal trends in 1948 and 2000.

spheric 14 C dilution from CO2 released by volcanic activi-              8.8 % (1964–1967) between F14 C of baobab tree-ring cellu-
ties. This effect is usually confined to obvious volcanic activ-         lose record and atmospheric F14 C of NH3 .
ity, e.g., fumaroles. Furthermore, we consider regional fossil              The baobab record of the bomb peak is further character-
fuel CO2 mixing as unlikely at this tree site in the Dhofar              ized as a period of major changes in the central tendency
Mountains. Because of its remoteness from any city or indus-             of RWI (1962–1965) as well as in the linear dependency
trial complex the site rather reflects atmospheric background.           of δ 13 C∗max (1964–1966). It is difficult to assess the driving
Due to the close proximity to the coast of the Arabian Sea               force(s) behind these major changes without further investi-
with significant upwelling, we cannot fully exclude atmo-                gations on other tree species and other sites in Oman; how-
spheric 14 C dilution. However, other studies report only sub-           ever, the notably lowered values of baobab F14 C during the
tle effects of aged CO2 released from ocean upwelling (e.g.,             bomb peak period may to some extent be explained by the
Beramendi-Orosco et al., 2018). Since the measurements for               baobabs’ carbohydrate turnover. The observed autocorrela-
the 1940s are consistent with other records for the North-               tion in the δ 13 C∗ signature points to the use of previous years’
ern Hemisphere, we suggest that dilution from 14 C-free CO2              carbon for part of the growth, which leads to a dampening in
from upwelling cannot be responsible for the large offset of             the carbon isotope record of environmental signals, includ-

Biogeosciences, 18, 3539–3564, 2021                                                           https://doi.org/10.5194/bg-18-3539-2021
F. Slotta et al.: High-resolution 14 C bomb peak dating and climate response analyses                                                3553

Figure 7. Diagrams for the strongest correlations of baobab tree-ring parameters with monthly and seasonally resolved climate parameters.
Months of the previous year are marked by lowercase abbreviations and months of the current year by uppercase abbreviations. The green
box marks the average monsoon period. (a) Ring-width indices versus precipitation amount. (b) δ 18 Omin versus precipitation. (c) δ 18 Omax
versus cloud cover. Apart from the actual monsoon season (June–September) also the pre-monsoon (April–May) has a significant influence
on wood increment growth and δ 18 O isotope signature.

https://doi.org/10.5194/bg-18-3539-2021                                                         Biogeosciences, 18, 3539–3564, 2021
3554                                   F. Slotta et al.: High-resolution 14 C bomb peak dating and climate response analyses

Table 3. Significant correlations between the obtained baobab time series and climate parameters for the area around Wadi Hinna. Corre-
lations within months of the current year are marked by uppercase abbreviations and correlations within months of the previous year by
lowercase abbreviations. Significance level values: ∗ p
F. Slotta et al.: High-resolution 14 C bomb peak dating and climate response analyses                                          3555

the observed baobab F14 C values for relative contributions        current water and nutrient budget, and may sometimes not be
between 95 % and 70 % from the fast cycling pool and 5 %           reached at all. However, parenchyma tissue may carry a gen-
to 30 % from the slow cycling NSC pool. The best approxi-          erally different radiocarbon signal than the surrounding wood
mation to the baobab F14 C time series was achieved by hold-       vessels and fibers, although both types of xylem are likely
ing stakes of 85 % fast cycling and 15 % slow cycling NSCs         being fed by the same mixed NSC pool with the only differ-
with annual renewal rates of 95 % (renewal fast cycling pool)      ence being that fibers and vessels are annual and parenchyma
and 5 % (renewal slow cycling pool) of the two respective          cells are perennial and can undergo structural changes for
pools (Fig. 8). The slow cycling NSC pool may predom-              an unknown number of years. Fractions of parenchyma tis-
inantly represent starch, the major long-term carbohydrate         sue in between vessels and fibers might be easily overlooked
reserve in trees, although starch has not always been found        during the sample dissection procedure, causing a potential
to be older than sugars, which should represent the fast cy-       shift in F14 C towards younger ages. The assumed life span is
cling NSC pool (Richardson et al., 2015). We suggest that          based on the significant correlation found between the width
the slow cycling NSC might originate from considerable cor-        of TPBs and the width of rings built 6 years later. How-
tical photosynthesis (Kotina et al., 2017) of older respiratory    ever, the TPBs seem to be more variable in their 14 C con-
CO2 . Additionally, the significant autocorrelation found for      tent than vessels and fibers, probably because their growth
δ 13 C∗ strongly indicates the incorporation of previous years’    is not continuous but rather discontinuous during their life
carbon into tree-ring cellulose from carbohydrate reserves         following the year of initialization. Presumably, parenchyma
and/or from current carbohydrates derived from old stem res-       growth depends on NSC availability and the demand of wa-
piratory CO2 recycled in cortical photosynthesis.                  ter, as well as the supply of water by the soil. A significant
   Despite our simplistic approach with assumptions based          post-cambial growth, i.e., widening of TPBs, could not be
on literature data from very different tree species and not        observed for 1973, 1981 and 1982, which is 2 years before
taking into account pool size dynamics, the offset in F14 C        the missing tree ring in 1975 and 1 and 2 years before the
between baobab cellulose and NH3 data during the time              missing tree ring in 1983. This leads to the assumption that
around the bomb peak is well captured. Nonetheless, baobab         baobabs prioritize growth of fibers and vessels over storage
F14 C values for 1945, 1952–1954, 1956 and 1957 lie slightly       enlargement, i.e., formation of new parenchyma cells. When
above the calculated range of F14 C of the NSC pool. Al-           there is not enough energy to invest in growth, baobabs seem
though to a much lesser extent, this is in common with F14 C       to refrain from broadening the initial TPBs. However, the 10
values measured for the TPBs, strongly indicating that the         TPBs prior to the missing ring in 1951 were all notably thick-
wood of these rings may have contained an unrecognized             ened; the reason for this missing ring remains unclear. The
high fraction of intraxylary parenchyma cells and did not          fact that TPBs accounting for 9 years (2006–2014) were not
consist of pure xylem fibers and vessels.                          well developed in the outer part of the wood core potentially
                                                                   indicates a particularly high stress level over the last decade,
4.2   F14 C of TPBs indicates ongoing formation and/or             which is in line with the meteorological data, i.e., increasing
      restructuring of parenchyma tissue for several               Tmax and decreasing precipitation (Fig. 4).
      years                                                           In sum, the relatively high fraction (69 %–88 %) (Chapotin
                                                                   et al., 2006c) and perennial character of parenchyma tissue
Terminal parenchyma bands (TPBs), marking the visual tree-         in stem succulent baobabs lead to shifts of the atmospheric
ring boundaries, were found to be at least up to 1.6 years         F14 C signal in their wood. The relative content and life-
younger than the corresponding tree ring when calibrated           time of intraxylary parenchyma may be also considered when
with post-bomb NH3 and assigned to the youngest possi-             reconstructing atmospheric F14 C from tree rings of other
ble age (Table 2, Fig. 8). In addition, the highest correla-       woody plant groups. Conifers were found to have the lowest
tion between the width of TPBs and RWI was found for               parenchyma fractions, followed by angiosperm trees (includ-
the ring built 1 year after the corresponding tree ring. Initial   ing shrubs), woody climbers (lianas) and succulents (Morris
parenchyma bands are being produced each year, initiated           et al., 2016). Major differences in the relative parenchyma
by the cambium between wood (xylem) and bark. However,             content of angiosperms were also found between tropical
well-defined TPBs could only be found deeper in the xylem,         species (36.2 ± 13.4 %) and temperate species (21.1 ± 7.9 %)
marking the actual tree-ring boundaries well but also explain-     (Morris et al., 2015); i.e., the atmospheric F14 C signal in tree-
ing previously described difficulties in cross dating the outer    ring cellulose may be altered in a species-specific and/or even
part of baobab core samples (Johansson, 1999; Slotta et al.,       plant-individual way. This, however, only plays a role in ra-
2017).                                                             diocarbon dating exercises utilizing the bomb peak with its
   Since parenchyma cells retain their ability to divide           dramatic changes over a few years.
throughout their life span (Spicer, 2014) it is thus possible
that the proliferation, i.e., post-cambial parenchyma growth,
starts once the existing NSC storage volume is sufficiently
refilled. This point in time may vary, depending on the tree’s

https://doi.org/10.5194/bg-18-3539-2021                                                    Biogeosciences, 18, 3539–3564, 2021
You can also read