U.S. Food and Agricultural Imports: Safeguards and Selected Issues - July 1, 2020 - Congress.gov
←
→
Page content transcription
If your browser does not render page correctly, please read the page content below
U.S. Food and Agricultural Imports:
Safeguards and Selected Issues

July 1, 2020

                               Congressional Research Service
                                https://crsreports.congress.gov
                                                       R46440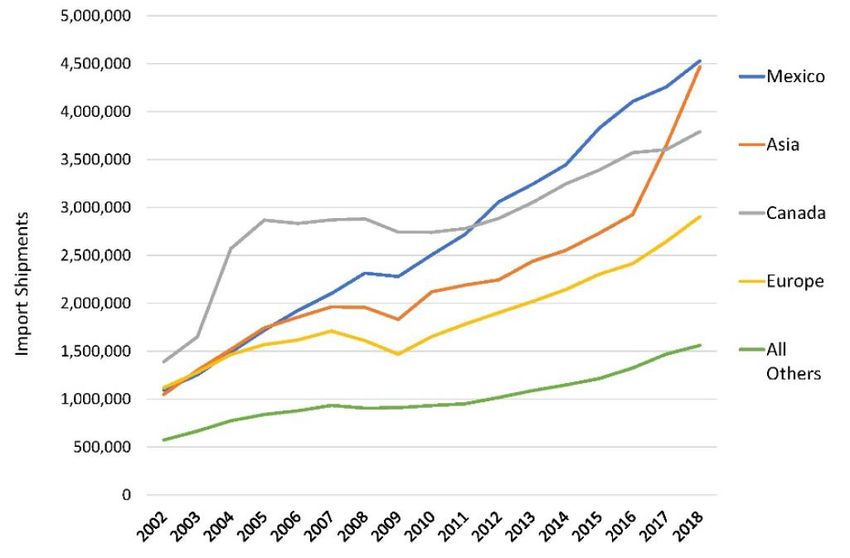
SUMMARY
R46440
U.S. Food and Agricultural Imports: Safeguards
July 1, 2020
and Selected Issues
Renée Johnson
High-profile foodborne outbreaks and incidents involving imported foods have Specialist in Agricultural
generated growing concerns about whether current federal programs sufficiently ensure Policy
the safety of these imports. Safety concerns have been associated with imported
products from China, Mexico, and nations in Central and South America, Southeast
Asia, Europe, and elsewhere. Imports of fish and seafood, fruits and vegetables, and pet
foods are among those that have been associated with foodborne outbreaks and incidents. It is unclear whether
imported foods pose a greater safety risk than domestically produced foods. Available data on foodborne illness
outbreak investigations do not readily identify whether the food is domestic or foreign sourced.
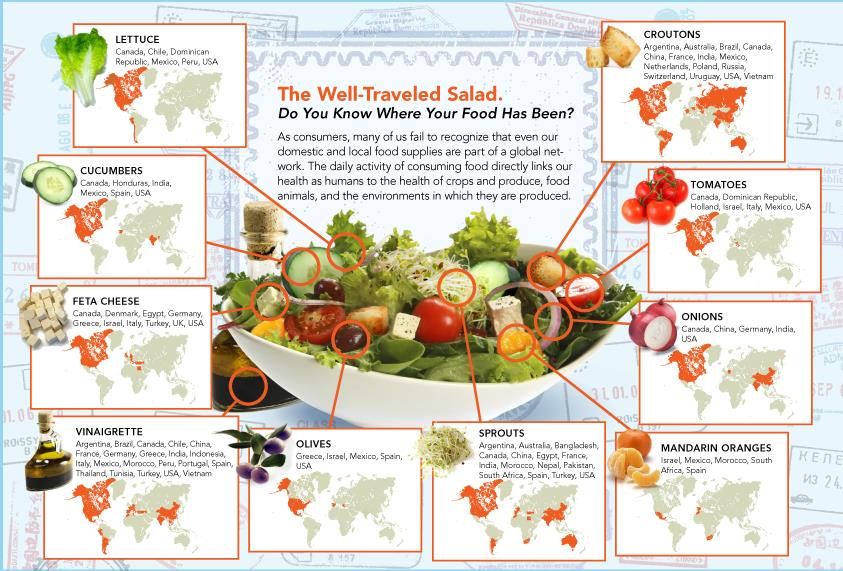
A steady increase in the volume of food imports—a result of globalization and consumer desire for a wider
variety of foods year-round—complicates efforts to secure the safety of imported foods and strains already-
challenged U.S. food inspection and oversight services. Overall, imported foods account for about one-fifth of all
foods consumed in the United States, but an even larger share for some foods, such as fish and seafood, and fruit
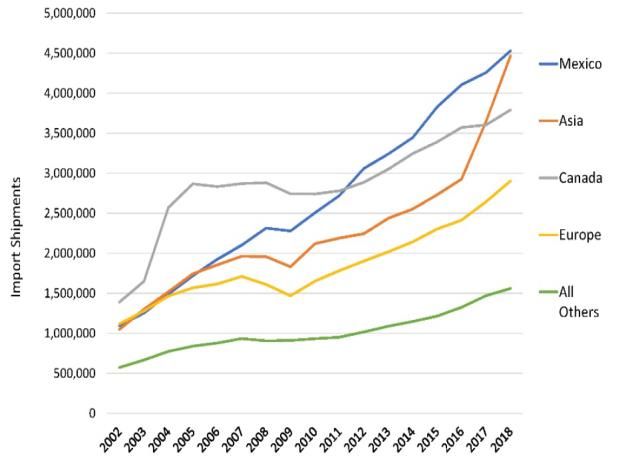
and vegetable products. Number of Imported Food Shipments to the
United States by Exporting Country/Region
Numerous federal, state, and local agencies share
responsibilities for regulating the safety of the U.S. food
supply. State and local authorities are thought to account
for as much as 90% of all the food inspections in the
United States through their routine sampling, inspection,
and food-testing work.
Federal responsibility for food safety rests primarily with
the Food and Drug Administration (FDA) and the U.S.
Department of Agriculture (USDA). FDA, an agency of
the Department of Health and Human Services, is
responsible for ensuring the safety of all domestic and
imported food products (except for most meats and
poultry). FDA also has oversight of all seafood, fish, and
shellfish products. More than 210,000 foreign food Source: FDA, FDA Strategy for the Safety of Imported Food, February 2019.
facilities are registered with FDA and are potentially
subject to inspection. USDA’s Food Safety and Inspection Service (FSIS) regulates most meat (including catfish)
and poultry and some egg products. Roughly 1,300 eligible foreign establishments fall under FSIS jurisdiction.
In FY2019, FDA inspected more than 1,700 foreign facilities and examined 17.7 million import lines (referring to
separate product lines on an entry document) of FDA-regulated foods. For meat and poultry imports, FSIS audits
the meat inspection systems of foreign countries that are approved to export meat and poultry products to the
United States. Upon entry into the United States, FSIS reinspects the imported products.
Changes enacted in the FDA Food Safety Modernization Act (FSMA, P.L. 111-353) gave FDA new tools and
authorities to ensure imported food meets the same safety standards as food produced in the United States.
However, FDA continues to examine about 1% of the total number of food import lines each year—rates similar
to that prior to FSMA. FSMA mandates requiring an increase in the number of facility inspections and an increase
in the number of FDA inspectors have also not kept pace with targets set by Congress. As part of its ongoing
oversight, Congress may wish to continue monitoring FDA’s progress in implementing FSMA and examine the
agency’s ability to ensure the safety of imported foods. Some in Congress also continue to question the safety of
imported foods under USDA’s jurisdiction and have scrutinized the agency’s process for determining the
Congressional Research Service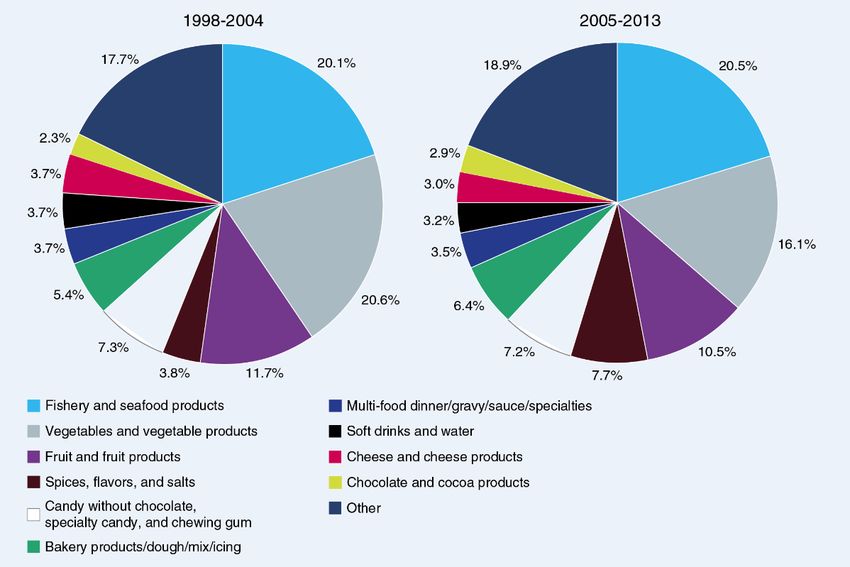
U.S. Food and Agricultural Imports: Safeguards and Selected Issues

eligibility of foreign establishments to export meat and poultry products to the United States, particularly for
products originating from certain countries. Congress may consider whether tighter requirements are necessary
regarding such imports.

Congressional Research Service
U.S. Food and Agricultural Imports: Safeguards and Selected Issues

Contents
Trends in U.S. Food Product Imports ................................................................................. 1
   Value of Trade........................................................................................................... 1
   Volume of Trade........................................................................................................ 4
   Food Imports as a Share of U.S. Consumption ............................................................... 6
Federal Food Safety Agencies and Authorities ..................................................................... 8
   Food and Drug Administration................................................................................... 10
       FSMA Provisions Addressing Imports ................................................................... 11
       FDA Foreign Facility Inspections.......................................................................... 15
       FDA Foreign Systems Recognition Assessment....................................................... 18
       Technical Assistance for Foreign Food Suppliers..................................................... 19
       FDA Inspection of Imported Foods ....................................................................... 20
       FDA’s Authority to Refuse Import Shipments......................................................... 22
       FDA’s Import Data Reporting Requirements .......................................................... 23
       Measures of Effectiveness of FSMA Mandates ....................................................... 24
   USDA, Food Safety and Inspection Service................................................................. 25
       FSIS Foreign Facility Inspection........................................................................... 26
       FSIS Inspection System Equivalency Determination ................................................ 26
       FSIS Reinspection of Imported Food ..................................................................... 27
       FSIS’s Authority to Refuse Import Shipments......................................................... 28
Food Safety Concerns Involving Imports .......................................................................... 29
   Foodborne Outbreaks Involving Imported Foods .......................................................... 32
   FDA Import Violations and Shipment Refusals............................................................. 33
   USDA Import Violations and Shipment Refusals .......................................................... 37
Congressional Considerations ......................................................................................... 38

Figures
Figure 1. Value of U.S. Agricultural and Fish/Seafood Trade, 1990-2019 ................................. 2
Figure 2. Value of Trade, Selected Fish and Shellfish Products ............................................... 4
Figure 3. Value of Trade, Fresh and Processed Fruits and Vegetables ....................................... 4
Figure 4. Number of Imported Food Shipments by Exporting Country/Region ......................... 5
Figure 5. Volume of U.S. Food Imports, by Food Group........................................................ 6
Figure 6. Volume of Trade, Selected Fish and Shellfish Products ............................................ 6
Figure 7. Actual versus FSMA-Mandated Inspections of Foreign Food Facilities .................... 16
Figure 8. Foreign Preventive Controls Inspections (FY2017-FY2019)................................... 25
Figure 9. Foreign Supplier Verification Program Inspections (FY2017-FY2019)..................... 25
Figure 10. Number of Outbreaks Caused by Imported Foods and Total Number of
  Outbreaks with a Food Reported, United States, 1996-2014.............................................. 32
Figure 11. FDA Import Refusals, by Violation Charges, 2005-2013....................................... 34
Figure 12. FDA Imported Food Refusals, by Percentage Share ............................................. 36
Figure 13. Number of Adulteration Violations, 2005-2013................................................... 36

Congressional Research Service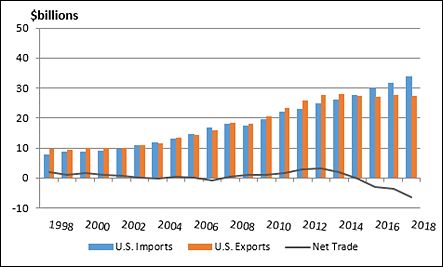
U.S. Food and Agricultural Imports: Safeguards and Selected Issues

Tables
Table 1. U.S. Imports of Agriculture, Fish and Forest Products, 1990-2019 .............................. 3
Table 2. Leading Food Exporting Countries to the United States, 2018.................................... 5
Table 3. Imports as a Share of Consumption Based on Volume of Foods Consumed .................. 7
Table 4. Imports as a Share of Consumption Based on Product Value ...................................... 8
Table 5. FDA Food Safety Inspections of Imported Foods, FY2010-FY2018.......................... 11
Table 6. Imported Meat, Poultry, Egg Product Reinspection and Refusal, 2005-2019............... 28
Table 7. Number of Violations, by Selected Charge Code for Selected Years .......................... 35

Appendixes
Appendix. Role of Other Federal Agencies........................................................................ 42

Contacts
Author Information ....................................................................................................... 49

Congressional Research Service
U.S. Food and Agricultural Imports: Safeguards and Selected Issues

         ver the past few decades, a number of high-profile foodborne illness incidents and

O        outbreaks involving imported foods have generated growing concerns about whether
         current federal programs sufficiently ensure the safety of these imports. Foodborne illness
incidents and outbreaks involving imported foods have been associated with products from
China, Mexico, nations in Central and South America, Southeast Asia, Europe, and elsewhere.
Compounding concerns about the safety of imported foods is the fact that the volume of imports
continues to steadily increase, in part given increased globalization but also rising consumer
demand for a wider variety of foods year-round. Food imports now account for a growing share
of all foods consumed in the United States. The U.S. Department of Agriculture (USDA) reports
that food imports account for about one-fifth of all U.S. food consumed (regardless of whether
measured by volume or product value of trade). Imports account for an even greater share of total
consumption for some foods, including fish and seafood, and fruit and vegetable products.
Numerous agencies share responsibility for ensuring the safety of the U.S. food imports. Federal
responsibility for food safety—covering both imported and domestically produced foods—rests
primarily with the Food and Drug Administration (FDA) at the Department of Health and Human
Services (HHS) and the Food Safety and Inspection Service (FSIS) at USDA. FDA is responsible
for regulating the safety and labeling of most foods and beverages (excluding alcohol) and the
manufacture and distribution of shell eggs, most seafood, drugs, and animal feeds. FSIS is
responsible for regulating the safety and labeling of meat, poultry, egg products, and catfish.

Trends in U.S. Food Product Imports
Value of Trade
In 2018-2019, the United States was a net importer of agricultural and fish products, reversing a
period of a U.S. trade surplus over the past decade (Figure 1). While U.S. agricultural exports
have increased, so have imports. From FY2015 to FY2019, U.S. agricultural exports averaged
about $142 billion per year, while U.S. imports averaged slightly higher at $143 billion per year.
Trade data presented here cover agricultural products as defined by USDA for the purposes of
calculating U.S. agricultural exports and imports and the agricultural trade balance. This
definition includes raw and bulk agricultural commodities (e.g., grains and oilseeds), meat and
dairy products, fruits and vegetables, nursery products, wine, and cotton fiber products (see text
box). USDA’s definition typically does not include certain other agriculture related products,
which cover fish and seafood, distilled spirits and other beverages, manufactured tobacco
products, and forestry and bioenergy products. Fish and seafood are often not included in official
U.S. agricultural statistics. This is consistent with the World Trade Organization’s (WTO’s)
Agreement on Agriculture, which excludes fish and seafood products from its list of products
covered by the agreement. 1 As the United States remains a net importer of fish and seafood
products, the inclusion of fish and seafood data as part of the overall trade picture results in a net
trade deficit (Figure 1). From FY2015 to FY2019, U.S. fish and seafood exports averaged about
$6 billion per year, while U.S. imports averaged about $11 billion per year.
Table 1 provides additional detail on a range of agricultural products and other agriculture
related products, including fish and seafood, and forestry products. It excludes distilled spirits
and agriculture-derived bioenergy products.

1WT O, Agreement on Agriculture, Annex 1, https://www.wto.org/english/docs_e/legal_e/14-ag.doc. See also USDA,
Profiles of Tariffs in Global Agricultural Markets, AER-796, Appendix, January 2001, https://www.ers.usda.gov/
publications/pub-details/?pubid=41257.

Congressional Research Service                                                                                   1
U.S. Food and Agricultural Imports: Safeguards and Selected Issues
Figure 1. Value of U.S. Agricultural and Fish/Seafood Trade, 1990-2019
Source: CRS from USDA’s Global Agricultural Trade System data (FATUS product group). As defined by
USDA, “Agricultural” trade including selected (non-ag) fish and seafood products (excluding fertilizer and
agricultural chemicals, farm machinery, and tobacco products). AIt also ex cludes distilled spirits.
Notes: Agricultural products exclude re-exports and reflect USDA-revised data for domestic exports and
imports for consumption, customs value basis.
USDA’s Definition of Agricultural Products in U.S. Trade
USDA’s definition of agricultural products (often referred to as “food and fiber" products)—for the purposes of
calculating U.S. agricultural exports and imports and the agricultural trade balance—covers a broad range of goods
from unprocessed bulk commodities, intermediate products, and consumer-oriented products. This includes
grains for human consumption and animal feed; raw cotton; meat and poultry products; milk and dairy foods; fresh
and processed specialty crops (fruits, vegetables, tree nuts, nursery products, honey, an d wine); highly processed
high-value foods and beverages (such as sausages, bakery goods, ice cream, beer, and condiments); tropical
products (such as sugar, cocoa, and coffee); fats and oils; hides and skins; wool and mohair; and unmanufactured
tobacco. Generally, most of the products in Chapters 01-23 of the U.S. Harmonized Tariff Schedule (HTS) include
agricultural products. Exceptions include fishery products (Chapters 03 and 16) and distilled spirits (Chapter 22).
Other products are also considered agricultural products. These include essential oils (Chapter 33), raw rubber
(Chapter 40), raw animal hides and skins (Chapter 41), and wool and cotton (Chapters 51 -52). These data exclude
manufactured tobacco products such as cigarettes and cigars (Chapter 2 4).
Some products derived from plants or animals are considered to be nonagricultural because of their manufactured
nature, such as cotton thread and yarn, fabrics and textiles, clothing, leather and leather goods, cigarettes and
cigars, and distilled spirits. Others are considered to be agricultural related products, such as fishery and seafood
products (given their food value) and solid wood products (given that USDA promotes U.S. exports of these
products). USDA’s definition of agricultural related products included fish and shellfish products, distilled spirits,
forest products, and ethanol and biodiesel blends.
Source: USDA, “GATS Agricultural Products Definition,” https://apps.fas.usda.gov/gats/AgriculturalProducts.aspx.
See also, for example, USDA, Profiles of Tariffs in Global Agricultural Markets, AER-796, Appendix, January 2001,
https://www.ers.usda.gov/publications/pub-details/?pubid=41257. The exclusion of fish and seafood products is
consistent with coverage under the WTO’s Agreement on Agriculture (Annex 1).
Congressional Research Service 2U.S. Food and Agricultural Imports: Safeguards and Selected Issues
Table 1. U.S. Imports of Agriculture, Fish and Forest Products, 1990-2019
1990 2000 2010 2015 2018 2019 2019
Product ($billions)
Ag, Fish & Forest Prods 33.24 64.32 107.77 148.49 171.67 170.39 100.0%
Consumer-Oriented 13.95 25.97 51.93 75.90 90.29 93.85 55.1%
Fruit, Vegetable, Tree Nut Products 5.46 9.05 20.58 29.75 36.19 37.23 21.8%
Cheese and Dairy Products 0.87 1.55 2.17 3.02 2.95 3.16 1.9%
Red Meats 2.93 3.77 4.78 9.44 8.67 9.10 5.3%
Wine and Beer 1.83 4.42 7.80 10.09 11.78 12.12 7.1%
Snack Foods 0.88 2.47 5.80 8.03 9.88 10.49 6.2%
Other Consumer-Oriented Products 1.98 4.72 10.80 15.57 20.81 21.75 12.8%
Intermediate Total 4.08 7.00 16.71 23.12 24.94 24.30 14.3%
Live Animals, Hides and Skins 1.32 2.03 2.39 3.38 2.63 2.87 1.7%
Vegetable and Tropical Oils 0.67 1.29 4.11 5.47 6.49 5.81 3.4%
Sugars, Sweeteners, Cocoa Paste 0.63 0.62 2.69 2.38 2.26 2.37 1.4%
Essential Oils 0.22 0.33 2.46 3.45 4.30 4.10 2.4%
Other Intermediate Products 1.25 2.72 5.06 8.44 9.26 9.15 5.4%
Bulk Total 4.89 6.00 13.22 14.62 13.49 12.89 7.6%
Coffee, Tea, Cocoa 2.28 3.01 5.89 7.27 6.41 6.25 3.7%
Other Bulk Products 2.60 2.99 7.33 7.35 7.08 6.64 3.9%
Seafood and Fish Products 5.2 9.9 14.6 18.6 22.3 21.9 12.8%
Tuna and Salmon 0.8 1.0 2.0 1.9 2.6 2.6 1.5%
Shrimp 1.7 3.8 4.3 5.4 6.2 6.0 3.5%
Other Seafood and Fish Products 2.7 5.2 8.3 11.2 13.5 13.3 7.8%
Forest Products 5.15 15.45 11.35 16.29 20.60 17.48 10.3%
Source: CRS from USDA’s Global Agricultural Trade System data (BICO-HS10 product group). As defined by
USDA, “Agriculture, Fish, and Forest Products” includes bulk and intermediate agricultural products, consumer-
oriented products, fish and seafood, and forest products. It excludes and other related agricultural products such
as distilled spirits and biodiesel blends.
Notes: May not add due to rounding. Data are not adjusted to account for inflation.
USDA aggregate agricultural trade surplus data often mask trade imbalances for certain traded
goods, including fish and seafood (Figure 2) and fresh and processed fruits and vegetables
(Figure 3). Currently, by value, the United States imports more fish and seafood and more fruit
and vegetables than it exports, resulting in a deficit in trade for these broad product categories. 2
2 T he deficit for fruits and vegetables cannot be solely explained by imports of bananas and other tropical fruits, which
are generally not grown in the United States. For more information, see CRS Report RL34468, The U.S. Trade
Situation for Fruit and Vegetable Products.
Congressional Research Service 3U.S. Food and Agricultural Imports: Safeguards and Selected Issues
Figure 2. Value of Trade, Selected Fish Figure 3. Value of Trade, Fresh and
and Shellfish Products Processed Fruits and Vegetables
Source: CRS from USDA Global Agricultural Source: CRS from U.S. International Trade
Trade System, calendar year data, Commission’s Trade DataWeb, calendar year data,
https://apps.fas.usda.gov/gats/default.aspx. https://dataweb.usitc.gov/. Excludes fresh nuts
(HTS 801 and 802).
Across all product categories—including fish and shellfish and other agriculture related
products—more than one-third of the value of U.S. agricultural imports in 2018 were supplied by
Canada and Mexico, with another 17% supplied by the European Union. China accounted for
about 5% of the value of U.S. agricultural imports, while Chile, India, and Indonesia supply
roughly 3% each. Table 2 lists other leading U.S. food importing countries.
Figure 4 shows the number of imported food shipments by exporting country or region. 3 These
data further indicate that the number of shipments to the United States from all major suppliers
has risen sharply over the past several years.
Not all agricultural imports enter the human food supply; some products are used as ingredients
in pet food and animal feed, in manufactured goods (e.g., rubber), and in the nursery plant trade.
Volume of Trade
By volume, food imports have steadily increased in all food product categories since the 1990s
(Figure 5). From 1999 to 2017, volume imports of selected foods rose from 32 million metric
tons (MMT) to nearly 60 MMT. 4 Increases were greatest for imports of fruits and vegetables,
prepared grain and bakery goods, and other ready-to-eat products. By value, these types of
consumer-oriented products account for more than half of all U.S. food imports (Table 1).
Other more detailed data also show increases in volume imports of fish and shellfish products,
which have increased since the 1990s, reaching over 2.8 MMT in 2018. 5 Fish products accounted
for about 60% of this total import volume in 2018, with shellfish accounting for the remainder
(Figure 6).
3FDA, “FDA Strategy for the Safety of Imported Food,” February 2019. Data are reported by FDA from data in its
Operational and Administrative System for Import Support (OASIS), 2018.
4
USDA’s U.S. Food Imports data (https://www.ers.usda.gov/data-products/us-food-imports/). Data through 2017 are
the most recent available.
5 Converted from reported pounds. USDA, “Aquaculture Data,” http://www.ers.usda.gov/data-products/aquaculture-
data.aspx. T he volume of total U.S. aquaculture exports totaled about 0.2 MMT in 2018 (excluding trade in live trout
and ornamental fish).
Congressional Research Service 4U.S. Food and Agricultural Imports: Safeguards and Selected Issues
Table 2. Leading Food Exporting Countries to the United States, 2018
Exporting Value Share
Country ($billion) (%Value) Major Food Product Imports (based on value)
Mexico 27.2 18.0% Fresh/prepared fruits/vegetables, spirits/beverages, sugar/confectionary
EU-28 26.0 17.2% Wine/spirits, baked goods, fats/oils, dairy products, prepared fruits/vegetables
Canada 25.6 16.9% Meat products, cereals/baked goods, seafood, fats/oils
China 7.5 5.0% Fresh/prepared fish/seafood, prepared fruits/vegetables
Chile 5.2 3.4% Fruit, seafood, wine/beverages
India 4.8 3.1% Fresh/prepared fish/seafood, gums/resins, tea/spices, oilseeds/legumes
Indonesia 4.2 2.8% Fresh/prepared fish/seafood, fats/oils, coffee/spices, cacao products
Vietnam 3.8 2.5% Fresh/prepared fruits, fresh/prepared fish/seafood, coffee
Brazil 3.8 2.5% Coffee, beverages, processed fruits vegetables
Thailand 3.6 2.4% Fresh/prepared fish/seafood, cereals animal feed, prepared fruits
Australia 3.2 2.1% Meat products, wine, grains
Colombia 2.7 1.8% Coffee, nursery plants, fruits
New Zealand 2.5 1.7% Meat, beverages, dairy products, fruit, fresh fish/seafood
Peru 2.5 1.7% Fresh/prepared fruits/vegetables, coffee/tea/spices, fresh fish/seafood
All Other 28.8 19.0%
Source: CRS, from trade data posted at the U.S. International Trade Commission’s Interactive Tariff and Trade
DataWeb database, covering HTS codes in chapters 1-24 (includes fish, seafood, distilled spirits, and tobacco
products). Shares based on a subtotal of $151.5 billion.
Notes: EU-28 includes the current 28 member states of the European Union, including the United Kingdom.
Figure 4. Number of Imported Food Shipments by Exporting Country/Region
Source: FDA, FDA Strategy for the Safety of Imported Food, February 2019. Data are reported by FDA from data
in its FDA’s Operational and Administrative System for Import Support (OASIS), 2018.
Notes: All products offered for entry into the United State must be declared to the U.S. Customs and Border
Protection, including commercial shipments (or imported goods brought into U.S. commerce for sale or
distribution) and items for personal use.
Congressional Research Service 5U.S. Food and Agricultural Imports: Safeguards and Selected Issues
Figure 5. Volume of U.S. Food Imports, Figure 6. Volume of Trade, Selected Fish
by Food Group and Shellfish Products
Source: CRS from USDA U.S. Food Imports data Source: CRS from USDA Global Agricultural
(fiscal year, most recent available data), Trade System, calendar year data,
https://www.ers.usda.gov/data-products/us-food- https://apps.fas.usda.gov/gats/default.aspx.
imports/. Excludes some product groups, including
live meat animals and beverages.
Food Imports as a Share of U.S. Consumption
Available data reported by USDA indicate that imports account for a growing portion of
American diets and the U.S. food supply. Table 3 and Table 4 show two sets of USDA estimates
of import shares based, respectively, on the volume of food consumed and the value of food
products. Regardless of the measure, imported foods account for an average of about one-fifth of
all foods consumed or marketed in the United States each year. There are notable differences,
however, between these two USDA datasets and estimates for individual food products.
Table 3 shows import shares based on the volume of foods consumed from a discontinued USDA
dataset that last reported estimates through 2013. 6 For 2016-2017, estimates shown are calculated
using other limited available USDA data. 7 Based on the volume of food consumed, available
USDA estimates of import shares are calculated based on the commercial disappearance of a
food product, as measured by total production adjusted for changes in beginning and ending
stocks and changes in trade (exports and imports). Estimates of import share vary widely
depending on the type of food. Import shares are greater for fish and seafood, 8 tropical products9
(imports account for more than 90% of food consumed by volume), spices (nearly 90%), tree nuts
(more than 30%), fruit juices (more than 50%), and fresh fruits and vegetables (more than 20%).
Import shares are lower for dairy (about 3% of all dairy products consumed) and meat (between
5% and 10%, depending on whether beef or poultry products). Compared to the 1990s, imports as
a share of U.S. food consumption have risen sharply for most food and agricultural products.
6
For more information, for example, see A. Jerardo, The Import Share of U.S.-Consumed Food Continues to Rise,
FAU-66-01, Economic Research Service (ERS), July 2002.
7 Calculated by CRS using ERS’s Food Availability (Per Capita) Data System, available at http://www.ers.usda.gov/
topics/international-markets-trade/us-agricultural-trade/import-share-of-consumption.aspx.
8
Other estimates by the National Oceanic and Atmospheric Administration (NOAA) report that imported seafood as a
share of consumption was 94% in 2018. See NOAA, Fisheries of the United States 2018, Current Fishery Statistics No.
2018, p. 116, https://www.fisheries.noaa.gov/resource/document/fisheries-united-states-2018-report. NOAA says its
existing model overestimates this percentage and that the agency is investigating improvements.
9 Includes coffee, cocoa, and tea—products not widely grown in the United States.
Congressional Research Service 6U.S. Food and Agricultural Imports: Safeguards and Selected Issues
Table 3. Imports as a Share of Consumption Based on Volume of Foods Consumed
1990 2000 2005 2012 2013 2016 2017
Product Category (percentage based on estimated commercial disappearance)
Total Consumed Food 12.1 14.2 17.1 18.3 19.1 N/A N/A
Beef 9.8 11.1 13.0 8.7 8.9 11.4 11.0
Pork 5.6 5.2 5.4 4.4 4.7 5.1 5.2
Poultry and eggs 0.0 0.1 0.1 0.4 0.4 0.4 0.4
Dairy products 1.9 2.7 4.2 2.2 2.1 3.2 2.7
Fish and shellfish 56.3 68.3 84.3 87.8 96.2 96.3 91.7
Grains 10.1 14.4 13.2 12.5 15.5 NA NA
Rice, milled 8.6 13.7 21.1 26.4 27.5 NA NA
Sugar, cane and beet 32.1 16.6 21.5 30.6 28.8 21.8 20.2
Spices 77.7 84.7 87.7 88.8 86.3 NA NA
Tropical products 99.8 99.2 102.0 97.5 96.4 NA NA
All fresh fruits 34.9 20.5 21.5 24.5 24.1 NA NA
All fruit juices 37.9 31.1 40.6 48.1 55.6 NA NA
All tree nuts 31.5 39.9 54.5 39.2 44.7 31.4 34.0
All fresh vegetables 8.6 11.2 14.9 20.8 22.0 NA NA
Source: 1990-2013 (USDA/ERS, discontinued dataset); 2016-2017 calculated by CRS using available limited data
from ERS as part of its Food Availability Data System (http://www.ers.usda.gov/topics/international-markets-
trade/us-agricultural-trade/import-share-of-consumption.aspx). Commercial disappearance is estimated based on
production and changes in stocks and trade (imports and exports). Tropical products include c offee, cocoa, tea,
and spices. More recent data are not available.
Table 4 shows USDA estimates based on the value of food products, both imported and
domestically produced. 10 Based on product value, available USDA estimates are measured from
the combined value of both imported and domestically produced foods. As such, these estimates
may be influenced by differences in relative prices between imported and domestic products.
Price differences may skew import shares lower in the case of lower-cost raw commodity
imports; alternatively, price differences may result in higher import shares in the case of higher
priced value-added processed foods. Among processed (manufactured) food products, grain and
oilseed milling products and sugar and confections are among the highest share imported
products (based on value). Sweeteners (sugarcane, sugar beets, honey), vegetables and melons,
and fruits and tree nuts are the highest share products of raw (nonmanufactured) goods.
Compared to 2008, these data show mostly slight increases in import shares over time.
Compared to import shares based on the volume of foods consumed, estimates shown in Table 4
often differ significantly from estimates shown in Table 3. For example, based on the volume of
food consumed, import shares for dairy products are estimated at 3%, and import shares for meat
products are estimated to range from 5% to 10%. In contrast, based on value, import shares are
much higher for these products, estimated at 9% to 11% for dairy products and 18% to 22% for
meat products. Estimates of import shares based on value are not available for fish and seafood
products. These discrepancies, along with the likelihood that differences in relative prices might
10
Available at https://www.ers.usda.gov/topics/international-markets-us-trade/us-agricultural-trade/data/.
Congressional Research Service 7U.S. Food and Agricultural Imports: Safeguards and Selected Issues
influence differences in these estimates, raise questions about the potential usefulness of USDA’s
estimates based on import value for tracking imports as a share of the U.S. market.
Table 4. Imports as a Share of Consumption Based on Product Value
2008 2010 2012 2013 2014 2015 2016
Product Category (percentage based on value)
Total Food and Beverages 12.0 11.8 13.0 13.1 13.5 14.6 14.8
Grain/oilseed milling products 31.7 31.3 43.3 48.9 54.6 47.3 45.2
Sugar and confections 31.6 33.7 37.3 36.2 37.1 36.0 36.2
Preserved fruit and vegetables 24.4 22.5 25.5 24.9 26.1 25.7 26.5
Dairy products 9.7 6.8 9.1 9.9 11.1 10.1 9.0
Meat products 14.4 13.8 18.8 18.4 21.0 21.8 18.0
Bakery products 8.2 8.5 10.4 10.4 10.4 10.7 11.4
Beverages 12.7 13.6 22.2 19.1 18.1 17.3 16.0
Food grains 28.3 18.4 14.6 29.0 22.1 24.1 21.9
Feed grains 2.0 1.0 1.6 2.3 1.6 1.9 1.7
Oilseeds 7.2 3.4 4.2 5.3 9.8 6.4 4.2
Fresh vegetables and melons 26.0 29.1 31.2 31.7 32.8 31.7 36.1
Fresh fruits and tree nuts 35.9 37.2 34.8 36.3 39.6 44.5 45.3
Sweeteners 38.4 45.0 44.1 38.9 45.8 46.9 44.5
Livestock 3.6 2.9 2.6 2.5 2.9 2.9 2.8
Source: USDA/ERS; U.S. Department of Commerce (available at https://www.ers.usda.gov/topics/international-
markets-us-trade/us-agricultural-trade/data/). More recent data are not available.
Federal Food Safety Agencies and Authorities
Numerous federal, state, and local agencies share responsibilities for regulating the safety of the
U.S. food supply, including imported foods. 11 Federal responsibility for food safety rests
primarily with FDA and USDA. FDA is responsible for ensuring the safety of all domestic and
imported food products (except for most meats and poultry). FSIS regulates most meat and
poultry and egg products and catfish. For imported foods, FDA and FSIS rely on different
regulatory systems, including how each agency determines whether foreign food suppliers have
safety systems and standards comparable to those in the United States (see text box).
The Appendix describes the role of other federal agencies in ensuring the safety of imported food
and agricultural products. For example, USDA’s Animal and Plant Health Inspection Service
(APHIS) is responsible for protecting plant and animal resources from domestic and foreign pests
and diseases. The Department of Homeland Security (DHS) is responsible for coordinating
agencies’ food security activities, including border inspections by DHS’s U.S. Customs and
Border Protection (CBP). Other federal agencies—such as USDA’s Agricultural Marketing
Service (AMS) and the National Marine Fisheries Service at the National Oceanic and
11 For more background information, see CRS Report RS22600, The Federal Food Safety System: A Primer.
Congressional Research Service 8U.S. Food and Agricultural Imports: Safeguards and Selected Issues
Atmospheric Administration (NOAA)—are involved in various food quality and inspection
programs. 12
FDA Systems Recognition Assessment Versus FSIS Equivalence Determination
Globally, there is substantial variation in the robustness of food safety systems, according to FDA, ranging from
systems in the early stages of development to highly mature food safety systems. This variability presents a
challenge to U.S. food safety regulators at both FDA and FSIS providing assurances of the safety of food and feed
imported to the United States from foreign countries.
Statutory and regulatory differences governing FDA and FSIS, along with differences in the types of products and
scale of imports shipped to the United States under each agency’s jurisdiction, has resulted in two distinctly
different approaches between FDA and FSIS when assessing the safety of imported food and feed.
FDA Systems Recognition Assessment
Following enactment of the FDA Food Safety Modernization Act (FSMA), FDA considered a range of
approaches for assessing the safety of imported foods obtained from recognized food systems or countries
with an equivalent system to that in the United States. FDA’s systems recognition assessment refers to the
process used by the agency to assess the capability of foreign food safety systems to help ensure the safety
of foods produced under the oversight of that country’s food safety authority/authorities. This process also
provides a means for FDA to establish closer regulatory partnerships and leverage work conducted by FDA
and foreign food safety authorities. As part of this process, FDA relies on information obtained from facility
registrations, border examinations, foreign facility inspections, and import certificates, among other
information.
For more information, see FDA, “Frequently Asked Questions on Systems Recognition for Foreign
Governments,” https://www.fda.gov/food/international-interagency-coordination/frequently-asked-
questions-systems-recognition-foreign-governments.
FSIS Equivalence Determination
At FSIS, equivalence refers to the process of determining whether a country’s food safety inspection system
achieves an FSIS-appropriate level of public health protection as applied domestically in the United States
and provides “standards equivalent to the FSIS to ensure other non-food safety requirements (such as
humane handling, accurate labeling, and assurance that meat, poultry, or egg products are not economically
adulterated) are met.” The country is not required to develop and implement the same procedures as
those in the United States, but rather the country must objectively demonstrate how its procedures meet
U.S. levels of protection. Countries wishing to become eligible to export meat, poultry, or egg products to
the United States must demonstrate that they have a regulatory food safety inspection system that is
equivalent to that of the United States.
For more information, see FSIS, “Equivalence Process Overview,” https://www.fsis.usda.gov/wps/
portal/fsis/topics/international-affairs/Equivalence/equivalence-process-overview.
Both of these approaches comply with U.S. international commitments and obligations under the WTO
Agreement on the Application of Sanitary and Phytosanitary Measures, under which countries may adopt and
enforce public health and safety measures “necessary to protect human, animal or plant life or health,” so long as
such measures are not applied in an arbitrary or discriminatory manner.
The following focuses on the role of federal agencies only and does not discuss the role of state
and local authorities, which reportedly account for as much as 90% of all the food inspections in
the United States through their routine sampling, inspection, and food testing work. 13
12
Guidance and information for importers and foreign suppliers who wish to ship food products into the United States
is available from FDA (https://www.fda.gov/food/food-imports-exports/importing-food-products-united-states), FSIS
(https://www.usda.gov/topics/trade/importing-goods; https://www.fsis.usda.gov/wps/portal/fsis/topics/international-
affairs/importing-products), APHIS (https://www.aphis.usda.gov/aphis/ourfocus/importexport ), and CBP
(https://help.cbp.gov/s/article/Article-83?language=en_US). T he Automated Commercial Environment is the “single
window” electronic system that went into effect in 2016, per Executive Order 13659, Streamlining the Export/Import
Process for America’s Businesses (79 Federal Register 4263, January 24, 2014).
13 Food Chemical News, “FSVP to Change Not Only FDA, but States’ Role in Regulating Imports,” June 23, 2017.
Congressional Research Service 9U.S. Food and Agricultural Imports: Safeguards and Selected Issues Food and Drug Administration FDA’s food regulatory authority comes chiefly from the Federal Food, Drug, and Cosmetic Act (FFDCA), as amended (21 U.S.C. §301 et seq.). FFDCA requires, among other things, that all domestic and foreign food manufacturing facilities adhere to FDA’s requirements for Current Good Manufacturing Practices (CGMPs)14 and prohibits the adulteration and misbranding of food. 15 The Public Health Security and Bioterrorism Preparedness and Response Act of 2002 (Bioterrorism Act, P.L. 107-188) amended FFDCA to require that all domestic and foreign food facilities register with FDA. The Bioterrorism Act also imposed prior notification requirements for FDA-regulated imported foods, as well as requirements for maintenance and submission of records sufficient to identify the immediate supplier and subsequent recipient of these products. 16 Congress further amended the FFDCA in 2010 by passing a comprehensive food safety law, the FDA Food Safety Modernization Act (FSMA, P.L. 111-353), which gave FDA new tools and authorities to ensure imported food and feed meet the same safety standards as food and feed produced in the United States. 17 For example, FSMA amended the FFDCA to require that all high-risk domestic facilities be inspected within five years of the law ’s enactment and at least once every three years after that. 18 FSMA also authorized FDA to suspend food facility registrations if there is reasonable probability of the food causing illness or death to humans or animals. 19 Pursuant to FSMA, FDA implemented regulations covering all domestic and foreign food manufacturing facilities, as well as certain farming operations. FSMA Title III specifically addressed imported foods, tightening general inspection and administrative requirements regarding imports. FSMA’s import provisions are described in more detail in the sections below. More than 300,000 domestic and foreign food facilities are registered with FDA. 20 Of the total number of registered FDA-regulated facilities, about 88,000 are U.S.-based facilities and another 212,000 are foreign facilities that are potentially subject to FDA inspection and reporting requirements. 21 Table 5 provides a summary of available data regarding FDA-regulated imported food and feed for selected years from FY2010 through FY2018. Of the more than 212,000 foreign food facilities that are potentially subject to FDA inspection and reporting requirements, more than 15% are located in the European Union. 22 Japan is the single country with the most number of foreign facilities registered to ship food products into the United States, with close to 7% of registered facilities. Another 5% of registered foreign facilities 14 21 C.F.R. Part 110. Exempt are establishments such as farms engaged solely in harvesting, storing, or distributing raw agricultural commodities normally cleaned or otherwise treated before consumption. 15 21 U.S.C. §§301(a)-(c), 342, & 343. 16 21 U.S.C. §350d and 21 U.S.C. §381(m). Regulations are at T itle 21, Part 1, Subpart I, of the Code of Federal Regulations. FSMA further expanded prior notice requirements for food imports (FSMA §304). 17 FSMA further applies to ingredient suppliers of dietary supplements. FFDCA Section 201(ff) (21 U.S.C. §321(ff)) states that dietary supplements are deemed to be foods, aside from a few exceptions. 18 21 U.S.C. §350j(a)(2). 19 21 U.S.C. §350d(b). 20 FDA, “Registration Statistics” (as of February 2016), http://www.fda.gov/food/guidanceregulation/ foodfacilityregistration/ucm236512.htm. More recent data are not available. 21 In 2012, FDA’s registration renewal removed foreign facilities that had ceased operations, even though their registration had remained in FDA’s system. T his resulted in substantial changes in the reported data over the period. (Based on CRS communication with FDA, September 5, 2014.) 22 FDA, “Registration Statistics,” http://www.fda.gov/food/guidanceregulation/foodfacilityregistration/ucm236512.htm. Congressional Research Service 10
U.S. Food and Agricultural Imports: Safeguards and Selected Issues

     are located in China, with another 6% of facilities located in other Asian nations, including South
     Korea, India, Taiwan, Vietnam, and Thailand. Nearly 8% are located in Mexico and Canada.
     FDA has 13 foreign offices intended to enable FDA staff and U.S. border officials to make
     informed decisions about products entering the United States. Foreign offices are located in China
     (posts in Beijing, Shanghai, and Guangzhou); India (posts in New Delhi and Mumbai); Latin
     America (posts in San Jose, Costa Rica; Santiago, Chile; and Mexico City, Mexico); Europe
     (posts in Brussels, Belgium; London, UK; and Parma, Italy); South Africa (Pretoria); and Jordan
     (Amman). 23 Decisions to establish a foreign post are based on the volume of imported products
     and the magnitude of problems associated with imported products, among other factors. FDA in-
     country activities include conducting foreign inspections, assisting foreign governments and
     industry to understand FDA standards and requirements, and obtaining information about
     products destined for the United States. 24

            Table 5. FDA Food Safety Inspections of Imported Foods, FY2010-FY2018
                                            FY2010       FY2012     FY2014 FY2015         FY2016     FY2017 FY2018          FY2019

FDA-Regulated Foreign Facilities              254,088    285,977         NA 212,183            NA          NA         NA           NA

Foreign Inspections                               354       1,347      1,339      1,357      1,269       1,548      1,638        1,747
Import Physical Exam Subtotal                 200,766    201,749    207,764    266,932    276,502     252,903    206,656       159,675

   Import Field Exams/Tests                   170,392    171,783    183,224    245,804    252,766     229,129    185,761       141,905
   Import Lab Samples Analyzed                 30,374     29,966      24,540     21,128     23,736     23,774     20,895        17,770

Import Line Decisions (million)                    9.7       10.8       12.2       13.1       14.0        15.3       16.9         17.7
   % Lines Physically Examined                  2.06%      1.87%       1.71%      2.04%      1.98%      1.66%      1.23%          0.9%

Prior Notice Reviews                           81,618     81,888      82,821     80,990     87,817     81,035     84,113        80,013
FDA Import (Line) Refusals                     17,080     16,386      15,709     15,223        NA          NA         NA           NA
   % Refusals (Total Import Decisions)          0.18%      0.15%       0.13%      0.12%        NA          NA         NA           NA

          Source: CRS from various sources. The number of FDA-regulated facilities is from FDA, “Registration
          Statistics,” http://www.fda.gov/food/guidanceregulation/foodfacilityregistration/ucm236512.htm. Inspections data
          are from FDA Congressional Justifications (https://www.fda.gov/about-fda/reports/budgets) and updates data for
          FY2010-FY2012 reported in FDA, Annual Report on Food Facilities, Food Imports, and FDA Foreign Offices. FDA
          import refusals are from J. Bovay, FDA Refusals of Imported Food Products by Country and Category, 2005-2013,
          March 2016. Most recent reported available data on the number of FDA-regulated facilities is for February 2016.
          Notes: Import lines refers to separate product lines on an entry document of FDA-regulated foods. Prior notice
          refers to notification to the FDA that an article of food, including food for animals, is being imported or offered
          for import into the United States in advance of the arrival of the article of food at the U.S. border. In 2012,
          FDA’s registration renewal removed foreign facilities that had ceased operations, even though their registration
          had remained in FDA’s system, resulting in a decrease in the number of registered foreign facilities.

     FSMA Provisions Addressing Imports
     Concerns about low FDA inspection rates of imported foods and available federal resources to
     ensure the safety of these imports were widely highlighted during the debate leading up to
     23
       FSMA provided the authority for FDA to establish foreign offices related to food and feed ( P.L. 111-353, §308).
     FDA had requested permission to establish an additional post in Brazil but currently has no plans for additional posts.
     24For more information, see FDA, 2012 Report to Congress on the FDA Foreign Offices, February 2012,
     https://www.fda.gov/food/food-safety-modernization-act-fsma/2012-report-congress-fda-foreign-offices.

     Congressional Research Service                                                                                         11
U.S. Food and Agricultural Imports: Safeguards and Selected Issues
Congress’ enactment of FSMA. The Government Accountability Office (GAO) conducted a
number of studies critical of FDA’s food safety oversight of both domestic and imported foods.25
Regarding imported foods, GAO noted FDA’s limited authority to ensure that food imports meet
the same food safety requirements as those for domestically produced foods. GAO also noted
FDA’s limited authority to take certain enforcement actions as well as a number of resource gaps
involving border inspections of imported foods and that federal law provided limited authority for
FDA to inspect foreign facilities. FDA only periodically visited foreign facilities to inspect their
operations, usually in response to a concern and only with the permission of the foreign
government. 26 Widely cited estimates indicated that FDA inspected about 1% of the food
imported under its jurisdiction. 27 Among the cited reasons for this low incidence in inspections
were limited resources, including too few inspectors covering U.S. ports of entry in the face of
ever-increasing import volumes. 28 Moreover, import requirements were mostly voluntary,
according to FDA’s draft guidance on Good Importer Practices. A 2011 report by FDA’s Office
of the Inspector General further indicated that the agency’s guidance for handling recalls of
imported foods prior to FSMA “was not adequate to ensure the safety of the nation’s food supply
because it was not enforceable” and that the recall process did not always operate efficiently and
effectively. 29 (For other related background, see “Food Safety Concerns Involving Imports.”)
FSMA was enacted to address these types of concerns and limitations. Leading authorities and
mandates involving imported food and feed under FSMA include the following:30
Importer Accountability and Verification: Established that food importers
have an explicit responsibility to verify that their foreign suppliers have adequate
preventive controls in place to ensure that food for human and animal
consumption meets applicable FDA safety standards.
Third-Party Certification: Provided that qualified third parties can certify that
foreign food facilities comply with U.S. food safety standards. This certification
may be used to facilitate the entry of imports.
Certification for High Risk Foods: Authorized FDA to require that high-risk
imported foods be accompanied by a credible third-party certification or other
assurance of compliance as a condition of entry into the United States.
25
See, for example, GAO, FDA Has Provided Few Details on the Resources and Strategies Needed to Implement Its
Food Protection Plan (GAO-08-909T ; June 2008); Food Safety: Selected Countries’ Systems Can Offer Insights into
Ensuring Import Safety and Responding to Foodborne Illness (GAO-08-794; June 10, 2008); Food Safety: FDA Could
Strengthen Oversight of Imported Food by Improving Enforcement and Seeking Additional Authorities (GAO-10-699T;
May 6, 2010); Food Safety: Agencies Need to Address Gaps in Enforcement and Collaboration to Enhance S afety of
Imported Food (GAO-09-873; September 15, 2009); and GAO, Food Safety: Federal Efforts to Ensure the Safety of
Imported Foods Are Inconsistent and Unreliable (RCED-98-103; April 1998).
26
For example, in 2010, FDA conducted 354 inspections of foreign facilities. T his compares to 1,747 foreign facility
inspections in FY2019. See Table 5.
27
GAO, Fundamental Changes Needed to Ensure Safe Food , GAO-02-47T , October 10, 2001.
28
See, for example, testimony of Caroline Smith DeWaal, Center for Science in the Public Interest , before the House
Energy and Commerce Committee’s Subcommittee on Oversight and Investigations, July 17, 2007, and testimony of
Jean Halloran, Consumers Union, before the House Committee on Ways and Means, October 4, 2007.
29
FDA, Office of the Inspector General, Review of the Food and Drug Administration’s Monitoring of Imported F ood
Recalls, A-01-09-01500, June 2011. T he review examined recalls of imported foods from July 2007 to June 2008.
30 See, for example, FDA, “Background on the FDA Food Safety Modernization Act,” FSMA Facts, July 2011.
Congressional Research Service 12U.S. Food and Agricultural Imports: Safeguards and Selected Issues
Authority to Deny Entry: Authorized FDA to refuse entry into the United States
of food from a foreign facility if FDA is denied access by the facility or entry to
the country in which the facility is located.
Aside from provisions that address imported food in FSMA’s Title III, other requirements apply
to imported foods and feed. These include mandatory preventive controls for food facilities and
on-farm production standards under FDA’s Produce Safety Rule that apply to both imported and
domestically produced fruits and vegetables. 31 The text box provides a summary of FSMA’s
provisions related to FDA-regulated food and feed imports. The section that follows discusses
selected topics related to imports.
FSMA’s import provisions have been described as a “paradigm” shift for foreign suppliers with
the potential to impact global food trade. 32 Since enactment, FSMA has resulted in the
implementation of a series of regulations and reporting requirements for foreign countries, U.S.
importers, and FDA. FSMA placed tighter controls on food imports, set minimum entry
requirements, required certification of imported foods, raised importer accountability, and placed
more responsibility on U.S. trading partners. Some stakeholders have expressed resistance to
FDA’s rulemaking requirements. 33
FSMA created the Foreign Supplier Verification Program (FSVP) for importers to verify that
foreign suppliers of food for human and animal consumption provide the same level of food
safety standards and public health protection as required of U.S. companies. Under FSVP,
importers are responsible for developing and maintaining a food safety plan and for conducting
supplier verification activities, as well as implementing corrective actions and maintaining
records. The appropriate verification activities and their frequency vary depending on the food,
the foreign supplier, and the types of control actions. Hazards in a food will be controlled if there
is a reasonable probability that exposure to the hazard will result in “serious adverse health
consequences or death to humans or animals,” which may result in an annual onsite audit of the
foreign supplier. 34 Verification activities include onsite auditing, sampling and testing of a food,
review of the foreign supplier’s relevant food safety records, and other activities based on the
evaluation of the risk posed by the food and foreign supplier performance. FDA is able to audit an
importer’s food safety plan and can stop imported food from entering the United States if the plan
and/or its implementation is determined to be inadequate. FDA estimates that FSVP will result in
total average annual costs of $435 million.
FSMA also established the Voluntary Qualified Importer Program (VQIP), a voluntary, fee-based
program for the expedited review and importation of foods from importers who achieve and
maintain a high level of control over the safety and security of their supply chains. By allowing
expedited review to some foreign suppliers, VQIP may help FDA manage the sheer volume of
31 See FDA, https://www.fda.gov/food/food-safety-modernization-act-fsma/fsma-final-rule-produce-safety. The
National Association of State Departments of Agriculture (NASDA) has also emphasized the need to ensure
appropriate food import activities as part of FDA’s Produce Safety Rule and the need to develop national and regional
information sharing networks and processes on producer audits and inspections, recalls, import alerts, and other
procedures. See NASDA, “Model Produce Safety Implementation Framework” February 22, 2019,
https://s3.amazonaws.com/nasda2/media/NASDA-Model-Produce-Safety-Implementation-Framework_2-22-2019.pdf?
mtime=20190906154302.
32
Comments from Michael T aylor, former FDA Deputy Commissioner for Foods, February 17, 2011. See also B. L.
Booren, “T he Relatively Unknown FSMA Rule,” OFWLAW.com blog, April 27, 2017.
33 See, for example, H. Bottemiller, “FDA Releases T wo Major Rules to Boost Oversight of Imported Foods,” Food
Safety News, July 26, 2013. See also postings from FDAImports.com blog posts available at
https://www.fdaimports.com/blog/category/food-safety-modernization-act-2/.
34 80 Federal Register 74226-74351, November 27, 2015.
Congressional Research Service 13U.S. Food and Agricultural Imports: Safeguards and Selected Issues
food imported to the United States each year and free up agency resources to better focus on
high-risk imports. FSMA further required that FDA increase the number of inspections of foreign
facilities it undertakes and established programs for building technical, scientific, and regulatory
food safety capacity in foreign countries.
FSMA Provisions Relating to FDA-Regulated Imported Food and Feed
Section 103 (Hazard Analysis and Risk-Based Preventive Controls): Established mandatory preventive
controls for domestic and foreign food facilities (21 U.S.C. §350g).
Section 105 (Standards for produce safety): Established mandatory science-based, minimum standards for
the safe production and harvesting of fruits and vegetables. Requirements apply to both domestic and foreign
operations (21 U.S.C. §350h).
Section 202 (Laboratory accreditation for analyses of food): Established a program for the testing of food
by accredited laboratories and for FDA to submit a progress report on its implementation of a national food
emergency response laboratory network (21 U.S.C. §350k).
Section 301 (Foreign Supplier Verification Program): Established a foreign supplier verification program
(FSVP) for importers to share responsibility for ensuring safety of imported foods according to types of hazards,
importers, and suppliers (21 U.S.C. §384a). Under FSVP, food importers are required to develop and maintain
systems for verifying that their foreign suppliers are manufacturing or growing food in a manner that provides the
same level of public health protection as required of U.S. companies.
Section 302 (Voluntary Qualified Importer Program): Established a Voluntary Qualified Importer Program
(VQIP) to expedite review and importation of foods from participating importers. Eligibility is limited to, among
other things, importers offering food from certified facilities (21 U.S.C. §384b).
Section 303 (Authority to require import certifications for food): Authorized FDA to require that high-
risk imported foods be accompanied by a credible third-party certification or other assurance of compliance as a
condition of entry into the United States (21 U.S.C. §384c).
Section 304 (Prior notice of imported food shipments): Established requirements for submitting prior
notice of imported food, including food for animals (21 U.S.C. §381).
Section 305 (Building capacity of foreign governments with respect to food safety): Required HHS to
develop a comprehensive plan to expand the technical, scientific, and regulatory food safety capacity of foreign
governments and their food industries that export foods to the United States.
Section 306 (Inspection of foreign food facilities): Authorized FDA to enter into agreements with foreign
governments to facilitate inspections of registered foreign facilities and to direct resources to inspections of
foreign facilities, suppliers, and higher risk foods (21 U.S.C. §384c).
Section 307 (Accreditation of third-party auditors): Required HHS to develop model standards and
recognized accreditation bodies to ensure that third-party auditors and audit agents meet such standards to qualify
third-party auditors as accredited auditors (21 U.S.C. §384d).
Section 308 (Foreign FDA offices): Required HHS to submit a report to Congress regarding the selection of
the foreign countries for established FDA offices.
Section 309 (Smuggled food): Required HHS, coordinating with DHS, to develop and implement a strategy to
identify smuggled food and prevent its entry into the United States.
Information on the requirements and implementation status of FDA’s FSMA rules and guidance for industry is available
at https://www.fda.gov/food/food-safety-modernization-act-fsma/fsma-rules-guidance-industry. For other background,
see CRS Report R43724, Implementation of the FDA Food Safety Modernization Act (FSMA, P.L. 111-353).
As of 2020, FDA has mostly completed implementation of many of the requirements under
FSMA pertaining to food and feed imports. FDA’s prior notice requirements became effective
May 30, 2013. 35 FSVP regulations were finalized in 2016, and the first compliance dates began in
35 78 Federal Register 32359-32362, May 30, 2013 (Docket Folder FDA-2011-N-0179); 21 C.F.R. 1. See also FDA,
“ Guidance for Industry: Prior Notice of Imported Food Questions and Answers,” Edition 3, June 2016,
Congressional Research Service 14You can also read