When Does Product Liability Risk Chill Innovation? Evidence from Medical Implants - Alberto Galasso Hong Luo - Harvard Business School
←
→
Page content transcription
If your browser does not render page correctly, please read the page content below
When Does Product Liability Risk
Chill Innovation? Evidence from
Medical Implants
Alberto Galasso
Hong Luo

Working Paper 19-002
When Does Product Liability Risk Chill
 Innovation? Evidence from Medical
 Implants
 Alberto Galasso
 University of Toronto

 Hong Luo
 Harvard Business School

 Working Paper 19-002

Copyright © 2018 by Alberto Galasso and Hong Luo
Working papers are in draft form. This working paper is distributed for purposes of comment and discussion only. It may
not be reproduced without permission of the copyright holder. Copies of working papers are available from the author.
When does product liability risk chill innovation? Evidence
                    from medical implants
                                  Alberto Galassoy                     Hong Luoz
                                              September 12, 2018

                                                      Abstract
          Liability laws designed to compensate for harms caused by defective products may also a¤ect in-
      novation. We examine this issue by exploiting a major quasi-exogenous increase in liability risk faced
      by US suppliers of polymers used to manufacture medical implants. Di¤erence-in-di¤erences analy-
      ses show that this surge in suppliers’liability risk had a large and negative impact on downstream
      innovation in medical implants, but it had no signi…cant e¤ect on upstream polymer patenting.
      Our …ndings suggest that liability risk can percolate throughout a vertical chain and may have a
      signi…cant chilling e¤ect on downstream innovation.

          Keywords: product liability, innovation, tort, medical devices, vertical foreclosure
          JEL Codes: O31, O32, O34, K13.

1     Introduction

The relationship between risk, uncertainty and investments is fundamental to understanding economic
growth (inter alia, see Bernanke, 1983; Bloom, 2009; Fernandez-Villaverde et al. 2015). A major source
of risk faced by …rms arises from product liability laws that are designed to protect customers from

defective or dangerous products (Jarrell and Peltzman, 1985; Hay and Spier, 2005). In 2016, product
     We thank Philippe Aghion, James Dana, Michael Frakes, Matt Grennan, Deepak Hegde, Curtis Huttenhower, Arti Rai,
Kathryn Spier, Ross Schmucki, Martin Watzinger, Rosemarie Ziedonis and seminar participants at Columbia Business
School, the University of Toronto, the Innovation conference at the London School of Economics, the IFN Stockholm
Entrepreneurship and Innovation conference, the 2018 ASSA annual meeting in Philadelphia, and the Duke Empirical
Health Law conference for helpful comments. Madeleine Rawling, Taro Tan, Melanie Vig, Esther Yan, Louise Yu, and
Darya Zotova provided excellent research assistance. We are grateful for …nancial support from the Michael Lee-Chin
Family Institute for Corporate Citizenship at the University of Toronto and the Social Sciences and Humanities Research
Council of Canada.
   y University of Toronto, CEPR, and NBER; email: Alberto.Galasso@Rotman.Utoronto.Ca.
   z Harvard Business School; email: hluo@hbs.edu.

                                                          1
liability cases accounted for roughly 70 percent of the personal injury civil cases …led in US district
courts. These cases often make the headlines because of their large damage awards. For example,
General Motors recently paid about $2.5 billion in penalties and settlements in cases involving faulty
ignition switches linked to 124 deaths and 275 injuries. Recently, advances in …elds such as arti…cial
intelligence and sophisticated robotics (e.g., driverless cars, robot-assisted surgeries, and robot caregivers
for the elderly and disabled) have rekindled lively policy debates over whether existing liability systems
constrain technological progress and present an opportunity to redesign liability rules.1
In an in‡uential book examining more than 100 industries across major trading nations, Porter
(1990) recommends “a systematic overhaul of the U.S. product liability system," arguing that in the
U.S., “product liability is so extreme and uncertain as to retard innovation." This idea that liability is
high and has a negative e¤ect on …rms’willingness to develop new technologies is common in the legal
literature (e.g., Huber, 1989; Parchomovsky and Stein, 2008; Priest, 2011); has shaped high-pro…le legal
cases (e.g., the 2007 Riegel v. Medtronic Supreme Court case); and often underlies the arguments by
proponents of tort reforms.2
Despite its intuitive appeal, this widely-adopted negative view does not seem to …nd support in the
scarce empirical evidence linking liability risk and innovation. If anything, the two large-sample empirical
studies examining this issue— Viscusi and Moore (1993) and Galasso and Luo (2017)— show that, on
average, higher liability risk induces higher R&D spending and more patenting. Theoretical frameworks
in both studies show that the impact of liability risk on innovation depends on the characteristics of
the technologies and the economic environment. In particular, while liability risk may chill innovation
due to higher costs, it may also incentivize the development of risk-mitigating technologies and safer
product designs that reduce the likelihood of injuries.
While the theoretical ambiguity and the general lack of empirical support suggest that wholesale
scaling back of the liability system may not be the appropriate policy, a natural question arises: Are
1 Indeed, in February 2017, the European Parliament adopted— by a large majority— a resolution containing recom-
mendations for EU-wide legislation to regulate “sophisticated robots, bots, androids and other manifestations of arti…cial
intelligence" and to establish legislative instruments related to the liability for their actions (European Parliament, 2017).
2 For example, in August 2017, the American Tort Reform Association (ATRA) …led an amicus brief in the Massachusetts
case of Ra¤erty vs. Merck, arguing that excessive liability risk “would substantially disrupt innovators’ ability to invest
in further innovation and their incentive to innovate."
2there conditions under which the product liability system is likely to generate unintended, negative e¤ ects
on innovation? Identi…cation and examination of such conditions can o¤er useful information to policy
makers. This paper provides new insights in this direction by characterizing and empirically analyzing
an environment in which an increase in liability risk had a substantial negative e¤ect on innovation.
Speci…cally, exploiting a quasi-exogenous surge in liability risk that a¤ected medical implants in the
early 1990s, we show that when large, common suppliers face high uncertainty about liability, the result
may be a large decline in downstream innovation.
Implants are medical devices placed inside or on the surface of the body, such as replacement joints,
intraocular lenses, …xation devices, and heart valves. The implantable device market is large and
innovative and accounts for roughly 25 percent of total medical device sales (Lind, 2017), 20 percent
of medical device patenting, and about 60 percent of Food and Drug Administration (FDA) Class III
device applications.3 Medical implants are manufactured using biomaterials that are direct or modi…ed
applications of common materials such as metals, polymers and ceramics. These raw materials are often
produced by large companies that supply to a wide range of sectors in the economy. During the 1970s
and 1980s, large …rms, such as DuPont and Dow Chemicals, were the dominant suppliers of polymers
and silicone used in many implants, including prostheses, body tissues, pacemakers, and heart valves
(Arono¤, 1995). The standard policy for these large companies was to not withhold materials from
the medical sector and to warn device producers that suppliers were not responsible for testing and
determining the safety of implants (Feder, 1994; Kerouac, 2001).
In the late 1980s, a series of unexpected and widespread problems arose with temporomandibular
joint (TMJ) jaw implants and silicone breast implants. Vitek, the leading producer of TMJ implants
at the time, …led for bankruptcy in 1990, thus inducing a large number of TMJ implant recipients to
…le lawsuits against DuPont, which was the ‘deep-pocket’polymer supplier of Vitek. During the same
time period, a leading manufacturer of silicone breast implants also …led for bankruptcy, and silicone
suppliers were named as defendants in numerous lawsuits (Feder, 1994). We present a variety of evidence
based on industry accounts, congressional hearings, …eld interviews, courts dockets and media mentions,
3 Class-III devices are devices used to support or sustain human life; devices of substantial importance in preventing
impairment of human health; or devices that present a potential, unreasonable risk of illness or injury.
3documenting how Vitek’s bankruptcy in 1990 and the subsequent TMJ and breast implant litigations
dramatically raised liability concerns for all material suppliers (not just DuPont) selling to all implant
manufacturers (not just the two types of devices directly involved in these litigations). The focus of our
analysis will be the impact that this surge in upstream suppliers’liability risk had on medical implant
innovation overall.
To illustrate the key mechanism at work, we propose a simple model in which innovation can take
place at both the upstream and the downstream stages of a vertical chain. In our model, an upstream
supplier sells a homogeneous and necessary input to multiple downstream markets. We show that when
serving one of the markets generates a high liability risk for the upstream supplier, it may choose to
withdraw from (i.e., foreclose) the risky downstream market. This would have a strong negative impact
on downstream …rms’pro…ts and innovation incentives in the foreclosed market. At the same time, when
the foreclosed market accounts for only a small fraction of upstream revenues, the upstream supplier’s
innovation incentives are only marginally a¤ected.
Our empirical analysis focuses on the impact of this surge in liability risk on implant technologies,
using non-implant technologies as the control. Our main sample includes the universe of granted medical
device patents applied for at the United States Patent and Trademark O¢ ce (USPTO) between 1985
and 1995. We develop a textual analysis algorithm to identify patents related to implant technologies,
exploiting the written description of the invention. We then use the detailed USPTO classi…cation
system to identify a set of implant subclasses— i.e., technological subclasses containing a large fraction
of implant patents.
We present estimates from a series of di¤erence-in-di¤erences regressions that compare patenting
in implant subclasses (treatment group) against patenting in other medical device subclasses (control
group) before and after the increase in upstream liability triggered by Vitek’s 1990 bankruptcy. Im-
portantly, we exclude patenting related to TMJ and breast implants and focus on the impact on other
implant technologies.
Our main …nding is that medical implant patenting decreased by 36 percent relative to patenting in
other medical device technologies after 1990. We show that this decline was not driven by di¤erential
patenting trends in implant and non-implant subclasses before 1990. Dynamically, the decline started
4immediately in 1990 and grew larger over time. The increasing magnitude is compatible with implant
innovators steadily reducing their patent applications, as an increasing number of polymer and silicone
suppliers withdrew from the market.
To control for confounding factors— such as demand and technology trends di¤erently a¤ecting im-
plant and non-implant innovation— and to isolate alternative mechanisms such as a greater concern
about lawsuits among implant producers themselves and a potential decline in the demand for implant
devices, given the failures of TMJ and breast implants, we subject the data to a variety of additional
tests. In particular, we present triple-di¤erences regressions that use patents by foreign …rms as the
benchmark. Industry reports suggest that foreign implant producers were less a¤ected by the supply
disruption than US …rms were because they had greater access to foreign polymer suppliers; at the same
time, both should be subject to similar shocks to demand, direct liability concerns, and other trends
unrelated to our natural experiment. The triple-di¤erences estimates show that, in line with our baseline
result, implant patenting by US …rms experienced a signi…cant decline, even relative to foreign …rms.
We examine the extent to which our …nding is driven by …rms that could reallocate R&D resources
from implant to non-implant technologies. Our estimates suggest that even if such within-…rm sub-
stitution took place, its in‡uence was likely to be small, implying an overall decline in medical device
innovation. We also show that the decline in implant patenting appears to be across the board: the
estimated e¤ect is negative and signi…cant across …rms of di¤erent sizes and patents of di¤erent val-
ues. Furthermore, we con…rm the signi…cant decline in implant technologies, relative to non-implant
technologies, after 1990, using FDA device approval data as an alternative measure of innovation. This
suggests that the relative decline in implant innovation takes place both at the early invention stage
and at the commercialization stage.
Having documented a large and signi…cant decline in implant innovation, we then explore what
happened to innovation by upstream suppliers of polymers used in medical implants. We …nd no
evidence of a negative impact on upstream innovation, even for DuPont. This is consistent with our
theoretical model and con…rms that the innovation incentives of these large …rms were driven by the
aggregate demand from multiple downstream markets.
Our results show that an unexpected increase in the liability risk faced by upstream suppliers could
5have a substantial negative impact on downstream innovation. A back-of-the-envelope calculation, based
on estimates by Grennan and Swanson (2017), suggests that the total welfare loss was at least $4.1 billion
per year. To restore the supply incentive of material producers, Congress passed the Biomaterials Access
Assurance Act (BAAA) in 1998. This Act exempted material suppliers from liability risk as long as they
were not engaged in the design and production of the implants. A precise estimate of the policy’s impact
on the industry is outside the scope of this paper, but we provide an illustrative analysis indicating that,
relative to non-implant technologies, implant patenting recovered gradually four to …ve years after the
BAAA. This …nding suggests that federal exemption regulation could be a useful policy instrument
when state product liability laws are insu¢ cient to insulate important players in the value chain from
high uncertainty about liability. Moreover, we do not observe an overshoot of implant patenting in the
longer run, suggesting that the decline observed in the early 1990s does not capture simply a delayed
investment.
Taken together, our …ndings show that liability risk can percolate throughout an industry’s vertical
chain and may have a signi…cant chilling e¤ect on downstream innovation. The channel we document is
rather general: large suppliers of general-purpose inputs interacting with many downstream industries
may restrict their supply to segments in which liability risk and uncertainty are the highest. In particular,
they may do so if (i) the extent of harms and their probabilities are di¢ cult to predict; and (ii) many
downstream innovators are small and are likely to resort to bankruptcy when liability claims exceed
the value of the …rm. Nascent domains such as arti…cial intelligence and robotics, for which start-up
innovation can be critical, are natural settings in which these concerns may emerge. More broadly, our
paper provides new evidence for how the tort system may a¤ect innovation incentives and suggests that
these policies should be designed with such dynamic e¤ects in mind (Finkelstein, 2004).
The paper is organized as follows. Section 2 reviews the literature. Section 3 provides background
information on the US medical implant industry and the 1990 shift in liability risk faced by upstream
material suppliers. Section 4 presents a motivating theoretical framework, and Section 5 describes
the data and our empirical approach. Section 6 presents the empirical results linking liability risk to
innovation in medical devices. Section 7 studies the upstream e¤ect of liability risk on innovation in
polymers. Section 8 discusses welfare and policy implications, and Section 9 concludes.
62 Related literature
We are aware of only two empirical studies in economics and management linking liability and innovation:
Viscusi and Moore (1993) and Galasso and Luo (2017).4 ;5 In their pioneering work, Viscusi and Moore
(1993) examine the relationship between product liability insurance costs for manufacturers and their
R&D investments. Theoretically, higher liability decreases R&D because of higher costs, but it also
encourages innovation that increases product safety. Using a cross-sectional dataset covering large US
…rms in the 1980s, Viscusi and Moore (1993) document a strong positive correlation between liability
insurance expenditures and …rms’R&D intensity, suggesting that, on average, product liability promotes
rather than discourages innovation. Galasso and Luo (2017) explore this relationship through a demand
channel: how changes in physicians’ liability exposure a¤ect their demand for new technologies and,
hence, …rms’ innovation incentives. Theoretically, they also derive o¤-setting e¤ects: higher liability
chills demand for new technologies associated with greater risk but increases demand for risk-mitigating
technologies that reduce injuries. Their empirical results support the idea that the positive e¤ect of
liability on innovation tends to dominate. Speci…cally, they show that, on average, states passing
tort reforms that decrease physicians’exposure to medical malpractice liability experience a signi…cant
decrease in medical-device patenting. Our paper contributes to this line of research by providing new,
causal estimates of a large chilling e¤ect of liability on innovation and by identifying a novel mechanism—
upstream liability percolating through the value chain.
Our paper also contributes to the broader economic literature on product liability, a key question
of which is how alternative liability rules a¤ect the incentives to take precautions and to conduct
potentially harmful activities (see Shavell (2007) for a survey). Many empirical studies related to this
4 In two collections of surveys and case studies, Huber and Litan (1991) and Hunziker and Jones (1994) bring together
experts from a variety of sectors of the economy. These essays suggest that the impacts of liability can be context-speci…c
and that systematic empirical evidence is scarce.
5 The number of theoretical papers on the relationship between liability and innovation is also small. The key question is
how di¤erent liability regimes (e.g., negligence versus strict liability) a¤ect the rate and direction of innovation. Daughety
and Reinganum (1995) study how …rms’R&D investment can in‡uence product safety and pricing decisions when product
safety is unobservable to consumers, and how di¤erent liability regimes a¤ect these choices. Baumann and Heine (2013)
argue that punitive damages may be used to o¤set the competitive pressure that forces innovators to introduce innovations
too early, thereby raising buyers’ risk of harm. Dari-Mattiacci and Franzoni (2014) study how the adoption incentives
of old versus new technologies depend on the due-care standard (for example, whether the standard is uniform across
technologies or favors the new technology).
7question focus on the link between legal liabilities and medical practice (e.g., Kessler and McClellan,
1996; Currie and MacLeod, 2008; Frakes, 2013; Avraham and Schanzenbach, 2015; and Frakes and
Jena, 2016). These studies tend to focus on the liability cost faced by a single party, though two
exceptions are Hay and Spier (2005) and Helland et al. (2018), which explicitly consider the allocation
of liability cost across a vertical chain.6 Hay and Spier (2005) study, theoretically, the optimal allocation
of tort liabilities between manufacturers and consumers, when consumers are insolvent and their use
of a product may cause harms to third parties. They show that even though manufacturer-residual
liability can be optimal under certain conditions, a consumer-only liability regime may be preferable
when consumers are heterogeneous or possess private information. Helland et al. (2018) argue that when
upstream producers’choices, such as pricing, need to be uniform across jurisdictions, imposing higher
liability on upstream producers in a small jurisdiction will actually increase the sales of a potentially
harmful product. They test this hypothesis by linking physicians’prescription behaviors to state tort
reforms shifting liability towards drug companies. Our paper di¤ers from Helland et al. (2018) in its
focus on vertical foreclosure and the e¤ect of liability shift on upstream and downstream innovation
investments.
Our paper also adds to the literature on the spillover e¤ects of shocks through industry linkages.
Barrot and Sauvagnat (2016) and Boehm et al. (2018) are two recent papers that examine the e¤ects of
exogenous negative shocks— natural disasters— to suppliers. Both papers …nd economically large neg-
ative spillover e¤ects on their downstream customers, as well as negative horizontal spillover to other
suppliers that are not directly a¤ected by the disasters due to strong complementarity of intermediary
inputs.7 At a more aggregate level, a growing number of papers (e.g., Long and Plosser, 1983; and Ace-
moglu et al. 2012) explain aggregate ‡uctuations and business cycles using micro-level shocks through
production networks and sectorial linkages.
Finally, our paper is related to studies examining how public policies focusing on achieving social
goals other than innovation a¤ect the rate and direction of innovation.8 In the health sector, Finkelstein
6 There are studies about liability costs involving multiple parties but without explicitly considering a vertical relation-
ship. See, e.g., Currie and MacLeod (2008) for an empirical analysis of joint and several liability.
7 Our results can also be interpreted as evidence for horizontal spillover: Vitek’s bankruptcy negatively a¤ects all other
implant producers because of the resulting surge in the liability risk faced by large common suppliers.
8 Recent studies that examine the e¤ect of policies directly targeted at innovation include Moser and Voena (2012) and
8(2004), exploiting three policy changes designed to increase the usage of pre-existing vaccines, …nds that
these policies are associated with a 2.5-fold increase in clinical trials for new vaccines. Acemoglu et al.
(2006) …nd that the introduction of Medicare is not associated with an increase in drug consumption
among the elderly; and, consistent with this, they …nd no evidence of an increase in the approval of new
drugs targeting diseases that a¤ect the elderly. Studying the energy and environment sector, Ja¤e and
Palmer (1997) conclude that environmental compliance standards increase R&D spending at the …rm
level, but does not necessarily induce inventive output in the form of successful patent applications.
3 Medical implants and their liability risk
The FDA de…nes medical implants as devices or tissues that are placed inside or on the surface of the
body. Typically, implants are prosthetics (i.e., replacements of body parts) but may also deliver med-
ication, monitor body functions, or provide support to organs and tissues. Silicone breast implants, hip
replacement joints and arti…cial heart valves are all examples of implantable medical devices. Implants
are produced using synthetic biomaterials that replace or restore function to body tissue (Davis, 2003).
Biomaterials are direct or modi…ed applications of common materials (such as metals, polymers, ceram-
ics, and their composites) that can sustain continuous or intermittent contact with body ‡uids. These
common materials are often produced by large companies that supply a wide range of industrial sectors.
TMJ implants are intended to replace (entirely or in part) the temporomandibular joint (jaw). In
the 1980s, Vitek was the leading producer of TMJ implants in the US. Its product obtained FDA
approval in 1983 after expert panels reviewed a series of scienti…c reports and clinical trial results. Oral
surgeons across the US liked Vitek’s product, which quickly became the state-of-the-art device in the
…eld (Schmucki, 1999). Several years later— unexpectedly and despite the initial positive response—
surgeons started to notice widespread problems with Vitek’s implants, including fragmentation, bone
resorption and delamination. In January 1990, the FDA issued a letter to Vitek advising them to warn
surgeons against implanting further devices. In June 1990, Vitek …led for bankruptcy under a deluge of
lawsuits.
After Vitek’s bankruptcy, implant recipients started to …le a large number of lawsuits against DuPont,
Sampat and Williams (2018).
9the polymer supplier for Vitek’s implants and a large …rm with a ‘deep pocket.’ A total of 651 lawsuits
were …led, involving 1,605 implant recipients and their spouses (Schmucki, 1999). Eventually, DuPont
won all suits that went on trial, but the process took ten years and cost the company over $40 million
(House of Representatives, 1997). This was a large sum compared to the revenue that DuPont obtained
from TMJ implants (a few thousand dollars in total, as each device Vitek produces contained only …ve
cents’ worth of DuPont’s raw material). Contemporaneously with the TMJ litigation, problems also
surfaced with silicone breast implants, with numerous recipients reporting joint soreness and body pain
allegedly related to leakages (Czuba, 2016). Again due to widespread litigation, one of the leading
implant manufacturers, Dow Corning, …led for bankruptcy in May 1995. Silicone suppliers, including
Dow Corning’s parent companies— Dow Chemicals and Corning— and other suppliers such as General
Electric and Union Carbide, became targets of litigation by implant recipients (Feder, 1994).9
The TMJ and breast implant litigations had a tremendous impact on the entire medical implant
industry because raw materials producers, including those directly involved in these cases, supplied
materials to medical device manufacturers for all sorts of implants, from sutures and fracture …xation
devices to pacemakers and heart valves. For 30 years, the common supply policy had been to not
withhold materials from the medical sector, even though, for many large …rms, the revenue from this
sector was negligible in comparison to their revenues from other applications (e.g., automotive, electrical
or textile markets). According to Arono¤ (1995), the implant market value for polymers accounted for
only 0.005% of the total revenues from other industries. A common practice, followed by DuPont since
the 1950s, was to state that the materials were not made for medical applications and that medical
implant manufacturers would have to rely upon their own independent medical judgment. The old
supply policy relied on common law protections for component and raw-material suppliers.10 DuPont
9 At the time of these events, both TMJ and breast implants were classi…ed as Class-II devices, without a stringent
requirement of demonstration of safety and e¤ectiveness. In response to emergent safety concerns, the FDA reclassi…ed
TMJ devices into Class III— the highest risk category— in 1993 and called for submission of Premarket Approval Applica-
tions (PMAs) from all manufacturers of these devices in 1998. For breast implants, the reclassi…cation took place in 1988
and the call for submission of PMAs occurred in 1991.
1 0 In particular, the ‘component parts’and ‘sophisticated purchaser’doctrines stipulate that the suppliers are not liable
unless the component or material per se is defective, or the process of integrating them has caused the adverse e¤ect
(Kerouac, 2001). The basic rationales are that if the supplier sells a product that has widespread use in many industries,
it would have no specialized knowledge of how the buyer will use the product and could not foresee and remedy the
potential hazards. Similarly, if the buyer substantially alters the material, the material supplier will not be held liable to
the ultimate consumer.
10often went a step further and included citations to the relevant scienti…c literature on types of adverse
reactions from …nished implants (Schmucki, 1999).
The TMJ and breast implant litigations implied that these industry practices were not su¢ cient to
protect suppliers from disproportionately high liability risk relative to their expected revenue. Follow-
ing these events, many material producers dramatically changed their policy for supplying permanent
implant producers (Service, 1994).11 DuPont issued a new supply policy (see Appendix 1) by which it
refused to sell materials to manufacturers of permanently implantable medical devices and restricted the
supply to temporary implants, whereas its old policy remained unchanged for non-implant devices. A
number of other major suppliers also exited the market, and, notably, Dow Chemicals and Dow Corning
ceased supplying materials to permanent implant producers in 1992.
A comprehensive report commissioned by the Health Industry Manufacturers Association (HIMA)
examined the status of the biomaterial market in the early 1990s (Arono¤, 1995). A survey conducted in
the study showed that about 60 percent of surveyed suppliers were unwilling to supply medical implants
producers and identi…ed the fear of product liability suits as their primary reason. Respondents were
explicit about not wanting to …nd themselves in the same situation as DuPont. Many of the remaining
suppliers required purchasers to execute strong indemni…cation agreements. They also required proof, in
advance of sales, that buyers had enough insurance coverage and other assets to honor those agreements
(Baker, 1995).
This supply shift had a signi…cant impact on the availability of biomaterials to medical implant
manufacturers. The May 20, 1994 hearing of the US Senate Subcommittee on Regulation and Govern-
ment Information provides a number of testimonies making this point. For example, James Benson,
Senior VP of the Health Industry Manufacturers Association, explained how “in many cases, there are
no alternative suppliers for these materials." Other testimonies emphasized that even when alternative
existed, the costs required to identify suitable replacements were extremely large. Other statements
made in the hearings explained how device companies were responding to these shortages by stockpiling
resources that were still available or by signing more onerous contracts with the few suppliers willing to
1 1 Permanent implants are commonly de…ned in the industry as devices that stay inside a human body for longer than
30 days.
11serve the market. Testi…ers claimed that these reactions have a¤ected …rms’innovation investments by
diverting resources away from the development of new products toward …nding and securing materials
required for current product lines (Arono¤, 1995).
4 Theoretical framework
In this section, we describe a simple model to capture some of the basic features of our empirical setting.
The framework illustrates the key channel through which a surge in liability risk faced by an upstream
supplier may a¤ect innovation investments in our empirical context. We discuss many of the details
that we abstract away in Section 4.2.
An upstream (polymer) producer may develop a new product that can be used by manufacturers
in downstream market A (medical implants), as well by many other industries (collectively denoted
as a residual large market B). Both the upstream …rm and the downstream …rms in market A can
invest in innovation. For simplicity, we assume that no innovation occurs in market B. In the absence
of innovation, the upstream …rm sells a ‘standard’ product in a competitive market and obtains zero
pro…ts. Innovation requires a …xed development cost, I U . If successful, the upstream …rm can now sell
a new (high-quality) product as a monopolist in both market A and market B: The marginal cost of
production for the new product is equal to zero.
Market A is comprised of a continuum of downstream users of mass one. Buying one unit of the
upstream input, each user can obtain gross surplus v after sustaining a …xed development cost, I D . We
assume that v is uniformly distributed over the interval I D ; 1 + I D . This implies that when the input
is sold at price p, only users for which v p ID 0 buy the good, and that the downstream demand
for market A is equal to
DA (p) = 1 F (p + I D ) = 1 p:
Similarly, we denote the demand curve for market B by DB (p) = (1 p), where > 1. We can think
of market B as the collection of downstream markets, each with demand 1 p. The assumption that
> 1 implies that market B captures a larger share of the upstream …rm’s business. The upstream …rm
can charge di¤erent prices for di¤erent markets. In Section 4.2, we discuss this assumption and examine
12alternative speci…cations in which the upstream …rm is restricted to serving both markets at the same
price.
Pro…t maximization by the upstream …rm yields pA = pB = 1=2, which is intuitive because both
markets have the same price elasticity (Section 4.2 discusses this assumption). Thus, the total pro…t of
the upstream …rm is
0 1+
= :
4
We now introduce a product liability risk that the upstream …rm faces when serving market A.
Speci…cally, we assume that each unit sold in market A generates an expected loss of l for the upstream
…rm. The simplest way to interpret l is that it captures the expected value of damages that the …rm has
to pay; i.e., l = E(d), where d is a random variable accounting for both the likelihood of being found
liable and the adjudicated amount. At the same time, l may also include additional costs sustained by
the upstream supplier, such as litigation costs and the opportunity cost of time and resources, as well
as losses due to risk aversion (the variance of d) and uncertainty aversion (inability to specify a unique
probability distribution for d), as modeled in Maccheroni et al. (2013). We are agnostic about the exact
nature of l, as Vitek’s bankruptcy and the subsequent events increased both risk and uncertainty.
Incorporating the liability risk, the upstream …rm’s objective function in market A becomes maxpA (pA
l)(1 pA ), and that for market B does not change.12 First consider the case in which the liability risk
is moderate (l < 1) such that it is still pro…table to serve market A. The pro…t-maximizing price in
market A is pA = (1 + l)=2, and the upstream …rm’s pro…ts become
0
(l) = (l);
where (l) = l(2 l)=4, the pro…t di¤erence between the scenarios with and without liability, is increasing
in l.
However, if the liability risk is high (i.e., when l > 1), no increase in the input price would be large
1 2 Theoretically, it is possible that the downstream demand in market A changes when liability changes. For example,
because victims of failed implants receive liability payments when they win or settle their lawsuits, consumers’ (and,
hence, downstream …rms’) willingness to pay could increase when the upstream …rm is held liable for more damages. For
simplicity, we assume that demand is invariant. This assumption is not unreasonable in settings like ours because (i) the
buyers do not foresee the shock; and (ii) the increased costs for the upstream …rm are captured mostly by class-action
attorneys or are lost in the form of opportunity costs of time and resources.
13enough to make market A pro…table for the upstream …rm.13 The upstream …rm is then better o¤
foreclosing market A and focusing only on market B. In this case, the upstream …rm’s pro…t will be
B
= :
4
4.1 Liability risk and innovation incentives
To examine the impact of liability risk on innovation investments, we begin with an analysis of down-
stream innovation incentives. Because we abstract away from the liability risk directly faced by …rms
in market A, these …rms are a¤ected only through the input price. When the input is sold at price pA ;
the total development cost sustained by downstream …rms is
Z 1+I D
RD = I D dx = I D (1 pA );
pA +I D
which decreases in pA . As the liability risk increases, downstream innovation decreases because the
input price, pA = (1 + l)=2, increases in l. Thus, fewer …rms are actively innovating in the downstream
market. Moreover, when l > 1, RD = 0 because the upstream …rm forecloses market A.
Consider, now, the innovation incentives for the upstream …rm. In the absence of product liability
risk, innovation investment takes place if
(0) IU 0;
that is, if > 4I U 1. In the presence of product liability risk, l, innovation occurs if
B
max (0) (l); IU 0:
B
This implies that as long as the pro…ts from market B are large enough (i.e., I U or, equivalently,
> 4I U ), there will be no change in the upstream innovation activity.
1 3 The case of a large shift in liability risk (l > 1) maps well to our empirical setting because the expected costs faced
by the upstream suppliers— including losses due to risk and uncertainty aversion, their opportunity costs of time and
resources, plus the possibility of damage awards to compensate for the pain and su¤ering of implant patients— may well
exceed the market value of the focal input (that is, the gross margin of the implant producers after excluding all other
costs).
144.2 Implications and discussion
In spite of its simplicity, our model delivers a number of insights into the impact of liability risk on
innovation incentives.
First, the theoretical framework shows that, while liability risk related to supplying a speci…c down-
stream market may a¤ect upstream innovation incentives, its e¤ect is likely to be limited when the
downstream market is substantially smaller than the other markets served by the upstream …rm. Em-
pirically, this implies that, in our setting, we should expect a very small change in polymer (upstream)
innovation activity, despite the large shifts in liability risk perceived by upstream suppliers in the medical
implant (downstream) market.
Second, our model illustrates the rationale behind DuPont’s decision to foreclose the medical implant
market, which we documented in Section 3. The upstream …rm may be able to compensate for the
increase in liability risk by charging a higher input price, but if the increase is too large, the supplier
is better o¤ focusing on market B and foreclosing the riskier market A completely. Our model, thus,
identi…es a novel factor— liability risk— that may induce market foreclosure (see Rey and Tirole (2007)
for a review of the other mechanisms considered in the literature).
Third, we show that the impact of liability risk may percolate throughout an industry’s vertical
chain. Even if the direct costs of litigation are incurred only by the upstream …rm, the drop in innovation
investment could take place in the downstream market.
We intentionally make the above model as simple as possible to illustrate the potential mechanism
and e¤ects. The setup abstracts away from a number of details that require discussion. First, we assume
that the shift in liability a¤ects only the upstream …rm, not the downstream …rms operating in market
A. This simplifying assumption makes the point that liability risk can percolate throughout the vertical
chain starker. A direct increase in downstream liability is likely to reduce the downstream innovation
incentives even more.14
In our model, when liability risk is su¢ ciently high, the mechanism through which the upstream
supplier protects itself is to foreclose the risky downstream market. In principle, there exist other con-
1 4 Vitek’s bankruptcy may, indeed, increase the (perceived) liability risk faced by downstream …rms directly. We aim to
isolate this channel in our empirical analysis.
15tractual remedies that could be used to mitigate liability risks. For example, the upstream supplier
may demand a stronger indemni…cation contract from the downstream …rms or require larger product-
liability insurance coverage. As mentioned in Section 3, suppliers who chose to remain in the market
made these arrangements. Introducing these contractual solutions does not change the comparative
statics of our model because they reduce downstream …rms’margins, which, in turn, discourage innova-
tion. There are a number of potential explanations of why many suppliers in our empirical context did
not choose these contractual solutions. The transaction costs of writing complex contracts with many
downstream buyers were probably very high relative to the pro…t margins obtained before the surge in
liability risk. Furthermore, parties had to agree on the riskiness of the transaction in order to specify
the new contractual terms. This was probably challenging, as uncertainty increased substantially after
Vitek’s bankruptcy.
In the model, we do not consider the possibility that ‘deep-pocket’…rms may attract more lawsuits,
which may be another important reason that large …rms such as DuPont chose to withdraw from the
market. The law and economics literature has discussed a number of reasons that large …rms are more
likely to be targets of litigation (Spier and Sykes, 1995; Spier, 2007). Intuitively, when the plainti¤s
have a small probability of winning, they …nd it pro…table only to …le claims against defendants able
to pay large damage awards. Cohen et al. (2016) provide empirical support for this idea in the context
of patent litigation. We can model this e¤ect explicitly by assuming that the risk of litigation increases
with the size of the upstream …rm’s other market B, and this would lead to a higher likelihood of vertical
foreclosure with a larger B.
We also assume that the upstream …rm can charge di¤erent prices in di¤erent markets. Interviews
with industry practitioners suggest that price discrimination was not common in our context. This
is because downstream …rms can potentially access the homogeneous inputs in secondary markets,
because distribution is often through large wholesalers, and because transaction costs of writing di¤erent
contracts with a large number of customers are generally high. If we, instead, restrict the input price
to be the same across di¤erent markets in the model, the incentive to foreclose market A will be even
stronger. This is because a higher uniform price, as a result of the liability risk in market A, will also
negatively a¤ect the upstream …rm’s pro…tability in its larger market B.
16Finally, the basic implications are robust to a number of ways to relax the demand speci…cations.
An interesting extension is to assume that : (i) consumers in the larger market B are less price-elastic
than consumers in market A (e.g., DB (p) = p and > 1); and (ii) the upstream cannot price
discriminate. In this extension, even without liability concerns, vertical foreclosure may happen if
p
market B is su¢ ciently large ( > = 1 + 2). This is a standard result in the theory of multi-market
price discrimination: di¤erences in demand elasticities may induce a monopolist to serve only selected
markets if it is forced to charge the same uniform price (Robinson, 1933; Tirole, 1988). Adding liability
to this setting induces foreclosure even before market B hits threshold .15
5 Data and methods
Our main source of data is the patent record database from the United States Patents and Trademark
O¢ ce (USPTO). Each patent is classi…ed by the USPTO using the US patent classi…cation (USPC)
system, a detailed scheme of classes and subclasses. Classes typically demarcate broad technological
boundaries, whereas subclasses delineate technical features within the scope of a class. A class/subclass
pair uniquely identi…es a subclass within a class (for example, within class 623 “Prosthesis," one can
…nd subclass 623/5.12 “Corneal ring" and subclass 623/10 “Ear or nose prosthesis"). Henceforth, for
simplicity, we refer to these class/subclass pairs as subclasses.
The USPTO provides a comprehensive list of the subclasses related to medical devices.16 Moreover,
each patent record indicates the primary subclass to which the patent is assigned. Exploiting this
information, we retrieved a total of 227,866 medical device patents that were eventually granted and for
which the application date was between 1975 and 2015. These patents span 2,699 unique subclasses.
To categorize subclasses into treatment and control groups, we …rst identify technologies that are
related to medical implants at the patent level. We use a two-step textual analysis procedure to deter-
mine whether a patent is an implant patent. First, from the FDA’s product classi…cation database, we
1 5 It is straightforward to show that our results are robust to simply relaxing the assumption that markets A and B
have the same price elasticity without introducing uniform pricing because the two markets are independent of each other.
Similarly, assuming that pricing is uniform but that market A is more price-elastic than market B, we will also have a
case in which liability concerns would be the only reason for vertical foreclosure because the upstream supplier will always
supply market A in the absence of liability concerns.
1 6 Details are described in www.uspto.gov/web/o¢ ces/ac/ido/oeip/taf/meddev.htm.
17retrieve a comprehensive list of device names, each corresponding to a unique product code that identi-
…es a generic category of a device. For each device name, the data provide an “implant ‡ag," indicating
whether the FDA considers it a medical implant. In total, the data comprise 6,044 unique device names
in 19 medical specialties. Of these, 568 device names in 14 specialties are ‡agged as implanted devices.
From these 568 implanted device names, we construct a dictionary of keywords capturing the underlying
device types. Examples of such keywords are: “stent," “knee," “hip," and “catheter."
Second, we develop an algorithm to scan the text of the titles, abstracts, and the …rst claims for
each of the 227,866 medical device patents between 1975 and 2015. We classify a patent as an implant
patent if it contains at least one of the keywords in the abovementioned dictionary, together with one of
the following terms: “implant," “implanted," “implantable," “implantation," “prosthetic," “prosthesis,"
and “graft."
On average, about 20 percent of the patents in each subclass are identi…ed as implant patents, but
the variance is substantial. In roughly 65 percent of the subclasses, the fraction of implant patents
is below 0.1, and in 19 percent, it is above 0.5. We de…ne a subclass as an implant subclass if at
least 80 percent of the patents belonging to this class are implant patents.17 This corresponds to the
top decile of the distribution of the shares of implant patents across subclasses. Examples of implant
subclasses include: 623-2.21 “Cylindrical pins for heart valves" (83 percent implant patents); 623/19.14
“Implantable humeral bone" (97 percent implant patents); and 623/14.11 “Arti…cial vocal cords" (100
percent implant patents). Examples of subclasses with a minimal fraction of implant patents include:
128/201.21 “Respiratory devices using lique…ed oxygen" (0 percent); 602/22 “Orthopedic bandages for
…ngers" (0 percent); and 606/36 “Surgical instruments for depilation" (3 percent).18
The main sample for our empirical analysis is a panel tracking patenting activities in each of the
1 7 We use this threshold approach to take advantage of the extensive expertise at the USPTO. As mentioned above,
patents are classi…ed together, based on their technological similarity. Therefore, a patent that is not identi…ed as an
implant by our algorithm, but is in a subclass consisting mostly of implant patents, are likely to be either implant patents
whose patent texts are not explicitly written as such or inventions that are related to implant technologies and, hence, are
potentially a¤ected by our shock.
1 8 As additional supporting evidence for our textual analysis, consider the primary patent class 623, titled “Prosthesis
(i.e., arti…cial body members), parts thereof, or aids and accessories therefor," which includes about 18,500 patents
classi…ed in 376 subclasses. About six percent of the patents in this class belong to subclasses that include only implant
patents. Roughly 60 percent of the patents belong to subclasses in which the fraction of implant patents is greater than
0.8, and about 95 percent of the patents belong to subclasses in which the fraction of implant patents is above 0.5.
18medical device subclasses for the period 1985-1995. Because of granting delays, we date the patents
using their application year rather than their grant year. The 11-year window 1985-1995 has been
chosen to capture a symmetric window around 1990, the year in which Vitek went bankrupt. We end
our sample in 1995 because of major industry lobbying e¤orts around that time, which eventually led
to the passage of the BAAA in 1998. In Section 8.2, we extend the sample to 2010 for an analysis of
the likely e¤ects of the policy response and the longer-run outcomes. To address one of the endogeneity
concerns discussed in the next section, we drop three patent subclasses related to TMJ and breast
implants from our analysis. The 11-year window includes 46,645 patents, with which we construct the
panel dataset of our main sample. The total number of subclasses in our main dataset is 2,696, and the
number of observations is 29,656.
Table 1 provides summary statistics of the main sample. On average, there are 1.57 patent appli-
cations per year in each of the medical device subclasses in our sample. Figure 1 plots the average
number of patent applications in implant and non-implant subclasses during our sample period. The
…gure shows that patenting in non-implant subclasses grew faster than patenting in implant subclasses.
Moreover, the two groups of subclasses started to diverge around 1990. While this …gure provides a …rst
look at our main result, we now turn to regression analysis to control for other factors that might also
contribute to the di¤erential growth rates between the two groups.
Our analysis also exploits additional information about these patents, including assignee identi…ers,
country of origin, and the number of citations received. Moreover, we use the FDA device application
data as an alternative measure of innovation. We describe these data in Section 6. Finally, we examine
whether the increase in liability risk faced directly by upstream suppliers a¤ects upstream innovation in
materials. The data used to conduct this analysis are described in Section 7.
5.1 Econometric model
Our analysis exploits the unexpected surge in litigation against material suppliers involved in TMJ and
breast implants to identify how changes in the liability risk upstream suppliers face a¤ect the innovation
incentives of downstream …rms. Following Moser and Voena (2012), our empirical strategy compares
changes in innovative activity between 1985 and 1995 across medical device patent subclasses that were
19a¤ected di¤erentially by the increased liability risk. The dependent variable is the number of patents
per USPTO subclass and year:
P atentsc;t = + Implantc Af ter1990t + t + fc + "c;t ; (1)
where Implantc equals 1 if subclass c is an implant subclass; Af ter1990t equals 1 for every year after
(and including) 1990; and t and fc are year and subclass …xed e¤ects. The coe¢ cient of the interaction
term between Implantc and Af ter1990t is the standard di¤erence-in-di¤erences estimator. We cluster
the standard errors at the subclass level for all regressions.
The variable Af ter1990t captures the post-period in which material suppliers faced high uncertainty
about liability following Vitek’s bankruptcy in 1990. Numerous industry and academic studies that
describe the state of the medical implant industry during our study period stress that the industry
did not foresee the massive litigation against DuPont and other material suppliers. We con…rmed this
in an interview with Ross Schmucki, senior counsel of DuPont at the time, who stated: “This sort of
mass tort product liability litigation against a raw material supplier was unprecedented and unexpected
by the medical device industry and by material suppliers such as DuPont." To further examine the
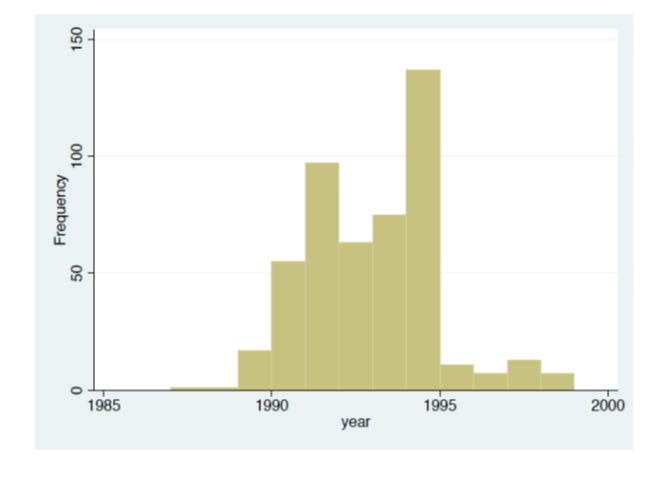
timing of the liability shift, we also manually collected litigation and media-mention data. Panel (a)
of Appendix Figure A1 plots the timing of TMJ lawsuits involving DuPont as one of the defendants,
collected from Bloomberg Law.19 Only one case per year was recorded in 1987 and 1988, and 17 cases
were …led in 1989. Starting in 1990, litigation increased dramatically, from 55 to 135 cases per year by
1994. Panel (b) of Figure A1 plots the timing of news articles referring to DuPont’s implant litigation,
retrieved through keyword searches in the Factiva (Dow Jones) database. This …gure shows that the
media coverage of implant-related litigation events involving DuPont increased substantially in 1991
and persisted throughout the following years. The litigation and media-mention data provide additional
support for our choice of the treatment timing. Furthermore, the wide media coverage supports the
1 9 We searched the database using two keywords in the full text: DuPont (and other variations of the company’s
name) and Vitek. We included lawsuits in the following categories: personal Injury/health care/pharmaceutical personal
injury/product Liability; personal injury/product liability; personal property/product liability; and contract/product
liability. The initial search returned about 650 cases, which is consistent with the number in Schmucki (1999). Removing
“spin-o¤" cases that originated from a di¤erent case, there are 485 unique lawsuits. In 44% of these lawsuits, DuPont was
named as one of the defendants, while Vitek was not (because Vitek had …led for bankruptcy). In the remaining 56%,
both DuPont and Vitek were named among the defendants.
20idea that information on DuPont’s legal battle spread across all industry participants, a¤ecting all
participants’perception about liability risk.
It is important to note that, together with the increase in liability exposure for upstream suppliers,
Vitek’s bankruptcy may have also generated (i) a decline in implants’ demand driven by consumers’
concerns about potential failures; and (ii) an increase in liability litigation risk for downstream implant
producers themselves. Both of these additional e¤ects could also generate a decline in downstream
innovation, but through mechanisms di¤erent from those in our theoretical framework. Moreover, ad-
ditional confounding factors such as demand trends or technology shocks di¤erently a¤ecting implant
and non-implant innovation may also lead to correlation between Af ter1990t and the error term, "c;t .
To address both types of concerns, we …rst exclude the three patent subclasses related to TMJ and
silicone breast implants from all of our regressions. Industry accounts and congressional documents
suggest that implant failures and the corresponding litigation triggering the surge in liability concerns
were concentrated in these two …elds. The exclusion of these …elds makes our approach similar to a
reduced-form regression, in which the variation in TMJ and breast implant litigation is used as an
instrument for the increase in liability risk for other types of implants.
Furthermore, we perform triple-di¤erences regressions using foreign patents of each patent subclass
as the benchmark. The rationale behind this exercise is that industry reports suggest that foreign
implant producers were less a¤ected by liabilities than US …rms because they had greater access to
foreign polymer suppliers; at the same time, it is reasonable to assume that both foreign and U.S.
…rms experienced similar shocks to demand, direct liability concerns, and other trends unrelated to our
natural experiment. In Section 8.3, we discuss in greater detail a collective set of evidence that helps us
isolate the upstream-foreclosure mechanism explored in our theoretical framework.
Another complication in our setting is that the control group might be ‘contaminated’ in certain
ways, which could a¤ect the interpretation of our estimated e¤ect. This may happen for a number of
reasons. First, medical device …rms patenting in both implant and non-implant subclasses may respond
to the liability shift in implant technologies by reallocating their resources from implant to non-implant
technologies. Such a substitution e¤ect would generate an increase in patenting in the control group,
indicating a change in the direction of R&D rather than a reduction in innovation overall. In the
21You can also read