BICYCLE ROAD SAFETY AUDIT GUIDELINES AND PROMPT LISTS - MAY 2012
←
→
Page content transcription
If your browser does not render page correctly, please read the page content below
MAY 2012

BICYCLE ROAD SAFETY
AUDIT GUIDELINES AND
   PROMPT LISTS

                          FHWA-SA-12-018
Notice

    This document is disseminated under the sponsorship of the U.S. Department of Transportation
    in the interest of information exchange. The U.S. Government assumes no liability for the use
    of the information contained in this document. This report does not constitute a standard,
    specification, or regulation.

    The U.S. Government does not endorse products or manufacturers. Trademarks or
    manufacturers’ names appear in this report only because they are considered essential to the
    objective of this document.

i
1. Report No.                                 2. Government Accession No.                                         3. Recipient’s Catalog No .

FHWA‐SA‐12‐018
4. Title and Subtitle                                                                                             5. Report Date

Bicycle Road Safety Audit Guidelines and Prompt Lists                                                                          May 2012
                                                                                                                  6. Performing Organization Code

7. Author(s)                                                                                                      8. Performing Organization Report No.

Dan Nabors, Elissa Goughnour, Libby Thomas, William DeSantis, Michael Sawyer
9. Performing Organization Name and Address                                                                       10. Work Unit No. (TRAIS)

Vanasse Hangen Brustlin, Inc.
8300 Boone Boulevard, Suite 700                                                                                   11. Contract or Grant No.
Vienna, VA 22182‐2626
                                                                                                                  DTFH61‐ 10‐D‐00022

12. Sponsoring Agency Name and Address                                                                            13. Type of Report and Period Covered

Federal Highway Administration                                                                                    Final Report
Office of Safety                                                                                                  July 2010 – May 2012
1200 New Jersey Ave., S.E.
                                                                                                                  14. Sponsoring Agency Code
Washington, DC 20590‐9898

15. Supplementary Notes

The Task Manager for this report was Richard Schaffer (FHWA Office of Safety). The University of North Carolina Highway
Safety Research Center was a subcontractor for this report. The project team gratefully acknowledges the input provided by
the technical working group over the course of this project. These individuals include: Craig Allred, Rebecca Crowe, Yon
Lambert, Lauren Marchetti, Richard Moeur, Gabe Rousseau, Michael Sanders, Cara Seiderman, Tom Trowbridge, and Mighk
Wilson. Contributions were also made by the following: Daniel Lovas, Kevin Moriarty, Jakob Helmboldt, Billy Hattaway,
Matthew Carmody, Janet Jenkins, and Noah Bernstein. Images were provided by Dan Nabors, William DeSantis, Libby
Thomas, Michael Sawyer, Matthew Carmody, and Jonathan Maus. Graphic design was provided by Jorge Quinones.
16. Abstract

Road Safety Audits (RSAs) are a formal safety examination of an existing or future roadway or off‐road facility and are
conducted by an independent, experienced, multidisciplinary team. The purpose of the Bicycle Road Safety Audit Guidelines
and Prompt Lists is to provide transportation agencies and RSA teams with a better understanding of the safety of cyclists in
the transportation system when conducting an RSA. These Guidelines present the RSA team with an overview of basic
principles of the safety of cyclists and potential issues affecting cyclists. They also provide information on how to conduct an
RSA and effectively assess the safety of cyclists. Prompt lists describe safety considerations when conducting a cyclist‐specific
RSA. These Guidelines will help RSA teams evaluate and suggest a multimodal approach to safety by improving the safety of
cyclists and all roadway users.
17. Key Words                                                                        18. Distribution Statement

Cyclist safety, bicycle safety, multimodal, road safety audit,                       No restrictions. This document is available to the public
prompt lists                                                                         through the National Technical Information Service,
                                                                                     Springfield, Virginia 22161.
19. Security Classif. (of this report)        20. Security Classif. (of this page)                                21. No. of Pages                  22. Price

      Unclassified                                 Unclassified                                                      87
       Form DOT F 1700.7 (8‐72)                                                                  Reproduction of form and completed page is authorized

                                                                                                                                                                ii
iii
Bicycle Road Safety Audit Guidelines and Prompt Lists

                                Table of Contents
Chapter 1 Introduction����������������������������������������������������������������������������������������������������������������������������������������1
   1.1 Cycling in the United States��������������������������������������������������������������������������������������������������������������������������������������� 1
   1.2 Purpose of These Guidelines������������������������������������������������������������������������������������������������������������������������������������� 3
   1.3 Scope of These Guidelines������������������������������������������������������������������������������������������������������������������������������������������ 4
   1.4 Organization of These Guidelines�������������������������������������������������������������������������������������������������������������������������� 4
   1.5 Knowledge Base for Conducting RSAs��������������������������������������������������������������������������������������������������������������� 4
   1.6 Glossary of Terms�������������������������������������������������������������������������������������������������������������������������������������������������������������� 6

Chapter 2 Basic Principles of Bicycle Safety���������������������������������������������������������������������������������������������� 11
   2.1 Cycling as a Mode of Travel��������������������������������������������������������������������������������������������������������������������������������������11
   2.2 Characteristics of Cyclists�������������������������������������������������������������������������������������������������������������������������������������������12
   2.3 The Cycling Network����������������������������������������������������������������������������������������������������������������������������������������������������14
   2.4 Crash Data Analysis Considerations��������������������������������������������������������������������������������������������������������������������15
   2.5 Factors That Contribute to Bicycle Crashes����������������������������������������������������������������������������������������������������16
       2.5.1 Location Factors������������������������������������������������������������������������������������������������������������������������������������������������16
       2.5.2 Speed Factors������������������������������������������������������������������������������������������������������������������������������������������������������17
       2.5.3 Seasonal Factors, Weather, and Surface Conditions�������������������������������������������������������������������������18
       2.5.4 Behavioral Factors��������������������������������������������������������������������������������������������������������������������������������������������18

Chapter 3 Cyclists in the Road Safety Audit Process������������������������������������������������������������������������������ 23
   3.1 What is an RSA?����������������������������������������������������������������������������������������������������������������������������������������������������������������23
   3.2 What Should be Considered for an RSA?���������������������������������������������������������������������������������������������������������24
   3.3 Who Should Conduct RSAs?������������������������������������������������������������������������������������������������������������������������������������24
   3.4 When Should RSAs be Conducted?��������������������������������������������������������������������������������������������������������������������24
   3.5 How is an RSA Conducted?��������������������������������������������������������������������������������������������������������������������������������������25
   3.6 Anticipated Challenges in Conducting Bicycle-Oriented RSAs���������������������������������������������������������33

Chapter 4 Using the Bicycle RSA Prompt Lists����������������������������������������������������������������������������������������� 35
   4.1 Purpose of the Prompt Lists�������������������������������������������������������������������������������������������������������������������������������������35
   4.2 Organization of the Prompt Lists��������������������������������������������������������������������������������������������������������������������������35
   4.3 When to Use the Prompt Lists��������������������������������������������������������������������������������������������������������������������������������37
   4.4 How to Use the Prompt Lists�����������������������������������������������������������������������������������������������������������������������������������37
       4.4.1 Presence and Availability�������������������������������������������������������������������������������������������������������������������������������38
       4.4.2 Human Factors and Behavior���������������������������������������������������������������������������������������������������������������������39

Master Prompt List.............................................................................................................................................. 43

Prompt List............................................................................................................................................................ 47

References.............................................................................................................................................................. 79

                                                                                                                                                                                            iv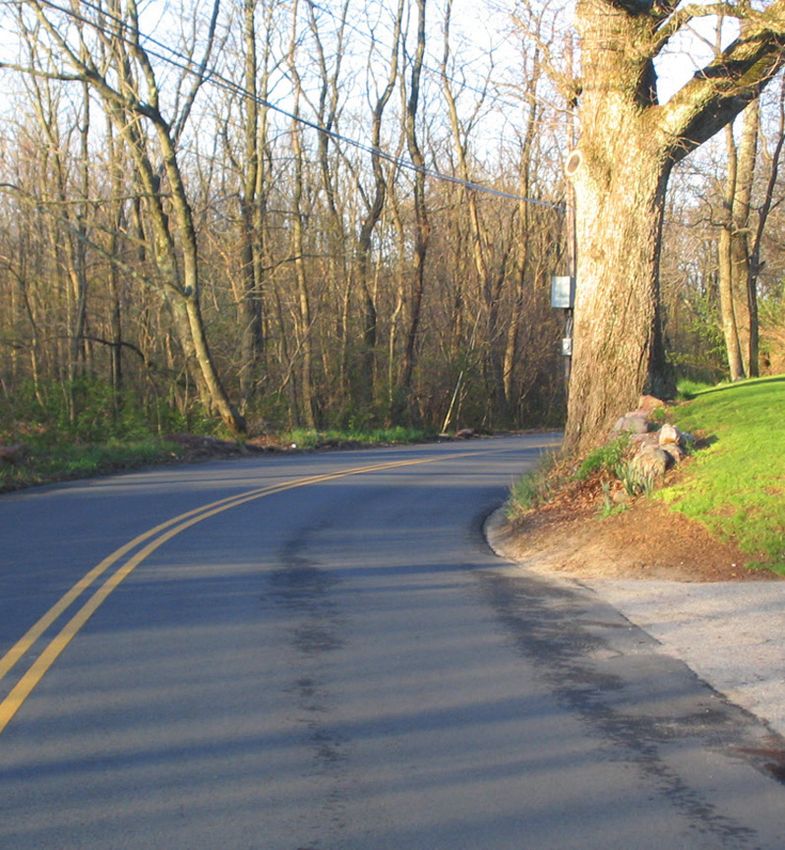
v
Bicycle Road Safety Audit Guidelines and Prompt Lists
1
Chapter 1. Introduction
1.1 Cycling in the United States
Cycling has long been an effective method for travel and the primary means of transportation
for many. Over the past several decades, the U.S. has experienced somewhat of a renaissance
in cycling for recreation, health, and transportation. Adults as well as children are reconnecting
with the enjoyment and mobility offered through cycling. Cycling provides an opportunity for
regular aerobic exercise, which public health officials stress is necessary for good health. Many
commuters have also found cycling to be a permanent and economical option to avoid traffic
congestion and parking difficulties.
Cycling has been an integral part of transportation plans since the passage of the Intermodal
Surface Transportation Efficiency Act (ISTEA) of 1991. In that same year, the U.S. Department of
Transportation (USDOT) adopted a new national policy that, for the first time, sought to
“increase use of bicycling, and encourage planners and engineers to accommodate bicycle and
pedestrian needs in designing transportation facilities for urban and suburban areas.” In 1991,
Congress also commissioned the National Bicycling and Walking Study, which was published by
the USDOT in 1994. The study provided key information to understand cycling and walking in
the U.S. and to translate ISTEA into action by creating two specific goals:
■■ Double the percentage of trips made by foot and bicycle.
■■ Simultaneously reduce the number of traffic crashes involving cyclists and pedestrians
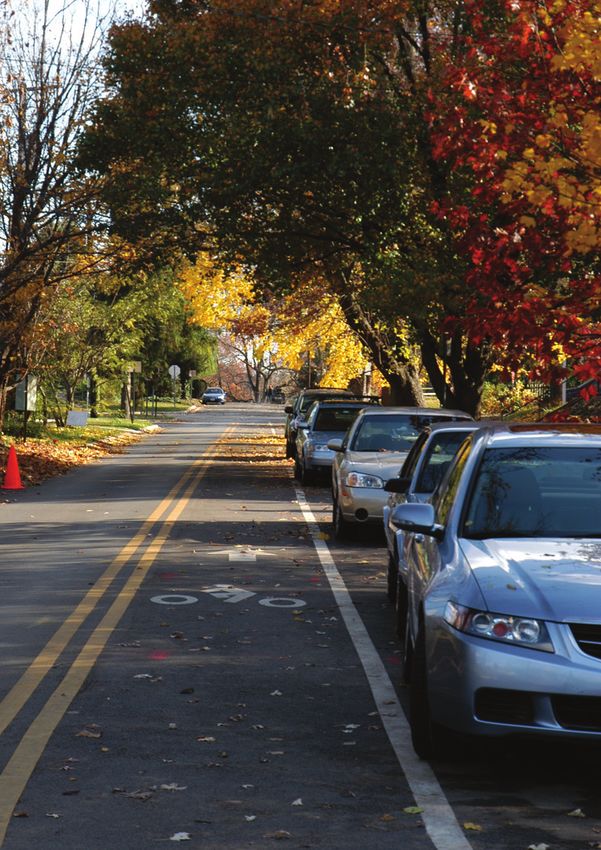
Cycling is a popular mode by 10 percent.1
of transportation that serves
many needs —from com-
muting to recreation. Subsequent legislation has supported cycling and the need to accommodate cyclists. The
National Bicycling and Walking Study: 15–Year Status Report released in May 2010, provided an
update of the status of biking and walking in the U.S.1 The report showed the percentage of
bicycle trips to increase from 0.7 percent to one percent, whereas the percentage of walking
trips increased from 7.2 percent to 10.9 percent. Collectively, cycling and walking accounted
for 11.9 percent of all reported trips, falling short of the doubling goal (i.e., 7.9 percent to 15.8
percent). However, between 1990 and 2009, the number of reported bicycle trips more than
1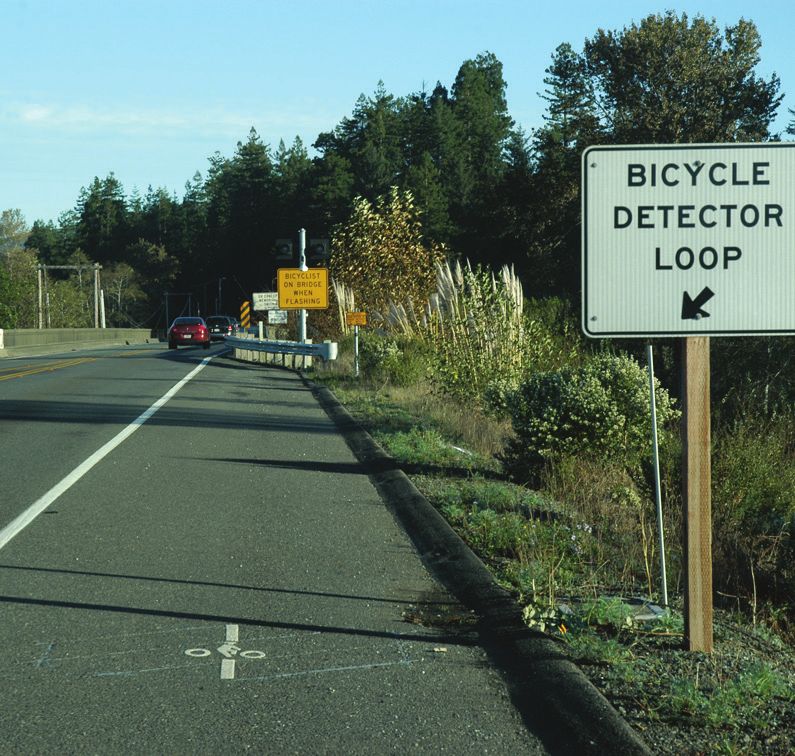
Bicycle Road Safety Audit Guidelines and Prompt Lists

                                     doubled from 1.7 billion to 4 billion. This increase shows that, despite the slower than desired
                                     nationwide growth in the proportion of bicycle trips, some areas around the country have
                                     experienced a much larger increase in the percentage of people walking and bicycling. For
                                     example, between 2001 and 2007, Marin County, California experienced an average 66 percent
                                     increase in the weekday bicycling rate, a 33 percent increase on weekend days, and an average
                                     8 percent increase in the weekday walking rate.2 During this period Marin County implemented
                                     the Safe Routes to School Program and also participated in the Federal Non-Motorized Trans-
                                     portation Pilot Program. Other areas, such as Washington, D.C. (referred to subsequently as
                                     the District), have also seen a large increase in the number of people bicycling. In 2010, 2.2
                                     percent of people biked to work, a rate that had almost doubled over the previous 10 years,3
                                     and from 2008 to 2011 the number of cyclists in the District increased by over two-thirds.4 This
                                     increase can be attributed in part to an expansion of the facilities available to bicyclists, as well
                                     as greater access to bicycles. The District has installed bicycle lanes and bicycle storage facilities
                                     and in 2008 initiated the Capital Bikeshare Program, providing public access to rental bicycles
                                     throughout the city.

                                     In New York City, commuter cycling doubled between 2007 and 2011.5 During this period, the
                                     New York City Department of Transportation (NYCDOT) launched numerous programs and
                                     initiatives to make cycling and walking safer, such as implementing 90 miles of new bicycle
                                     lanes in 2008 that contributed to a record 35 percent single-year increase in commuter cycling.
                                     In 2012, the city’s first bike share program will begin implementing a plan to build 600 stations
                                     housing 10,000 bikes. This program should increase commuter cycling even further and
                                     increase utilization of the city’s nearly 400 bike-lane miles.

    The addition of bicycle lanes, bike boxes, and other facilities in New York City has lead to a dramatic increase in cycling (Photographs from NYCDOT).

                                     Overall, the areas with the greatest increases in bicycle trips have been those making a
                                     concerted effort to improve infrastructure conditions that are conducive to making cycling
                                     a viable and appealing transportation option. This includes not only making improvements
                                     in infrastructure, but also better combining land use and transportation initiatives allowing
                                     residents to live closer to a variety of destinations, making cycling an effective choice for
                                     commuting, recreational, and personal trips. Data from the Nationwide Personal Transportation
                                     Survey indicates that almost one-half of all trips are 3 miles or less, which is considered to be
                                     within cycling range for most adults in this country.6

2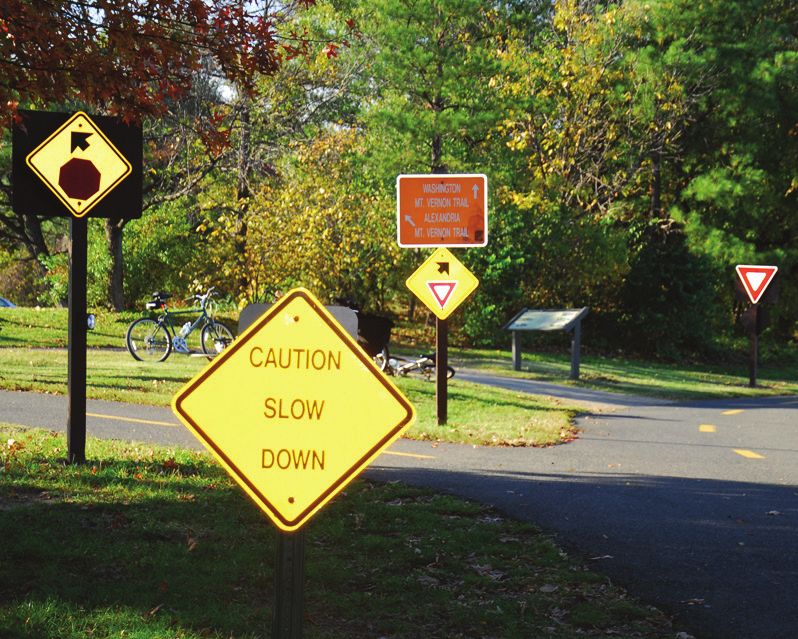
Introduction

    In terms of safety, the National Bicycling and Walking Study report indicated that the original
    goal of reducing the number of crashes involving cyclists and pedestrians by 10 percent has
    been surpassed.1 Since 1995, the number of cyclist and pedestrian fatalities has decreased by
    more than 20 percent (from 6,452 to 5,094 fatalities), while the number of cyclist and pedestrian
    injuries has decreased by over by 16 percent (from 145,000 to 121,000 injuries). Overall, injury
    trends from national estimates demonstrate a generally more consistent downward trend since
    1995, although 2008 appears to be a significant exception, with an increase of more than 20
    percent in injury crashes from the previous year.

    The increase in bicycle injuries in 2008 demonstrates the uncertainty and variability of these
    data, which is underscored by the fact that little is known about bicycle volumes and potential
    crash exposure. Typically, severe crashes causing a fatality are reported; however, less serious
    cyclist crashes are more frequent and underreported. Adding to the complexity, there are
    neither consistent roadway inventory nor inventory for off-road areas (e.g. sidewalks, parking
    lots, paths, parks, and playgrounds), where approximately one-third of bicycle injuries may
    occur.7 Nearly three-fourths of the cyclists treated and released by hospital emergency depart-
    ments were injured in non-roadway or non-motor vehicle incidents and were unlikely to be
    reported in State traffic records.8 It is evident that trends—and the current safety status of
    cyclists—are largely unknown.

    What is known is that, over the past decade, between 629 and 786 cyclists were killed annually
    and an estimated 52,000 have been reported injured annually in the U.S..9 Bicycle trips are more
    likely to result in a fatality or injury than motor vehicle trips. The estimated one percent of trips
    by bicycle accounted for two percent of all fatalities and injuries in 2009. Based on these data,
    expanded review of safety issues and implementation of countermeasures are necessary to
    effectively address the safety of cyclists.

    Increases in bicycle accommodations by State and local transportation agencies are certainly
    helping to address safety concerns and reduce cyclists’ risks. However, even these agencies are
    experiencing new and unique challenges never faced before. Road safety audits (RSAs) can be
    used to help address the safety of cyclists by improving the understanding of both the charac-
    teristics of cyclists and the factors that affect cyclist safety. An RSA is a formal safety examination
    of an existing facility or future roadway plan or project, that is conducted by an independent,
    experienced, multidisciplinary team. RSAs are a cost-effective method to proactively identify
    factors affecting safety and make suggestions on strategies and facilities to improve cyclist
    safety and support a truly multimodal street network for all types of facilities.

1.2 Purpose of These Guidelines
    The purpose of the Bicycle Road Safety Audit Guidelines and Prompt Lists is to provide trans-
    portation agencies and RSA teams with a better understanding of the safety of cyclists in the
    transportation system when conducting an RSA. These Guidelines emphasize considering the
    context of the cycling environment from a “behind the handlebars” perspective. This document
    is an expansion of the cyclist-related material in the FHWA Road Safety Audit Guidelines10 previ-
    ously published by the Federal Highway Administration (FHWA).

                                                                                                              3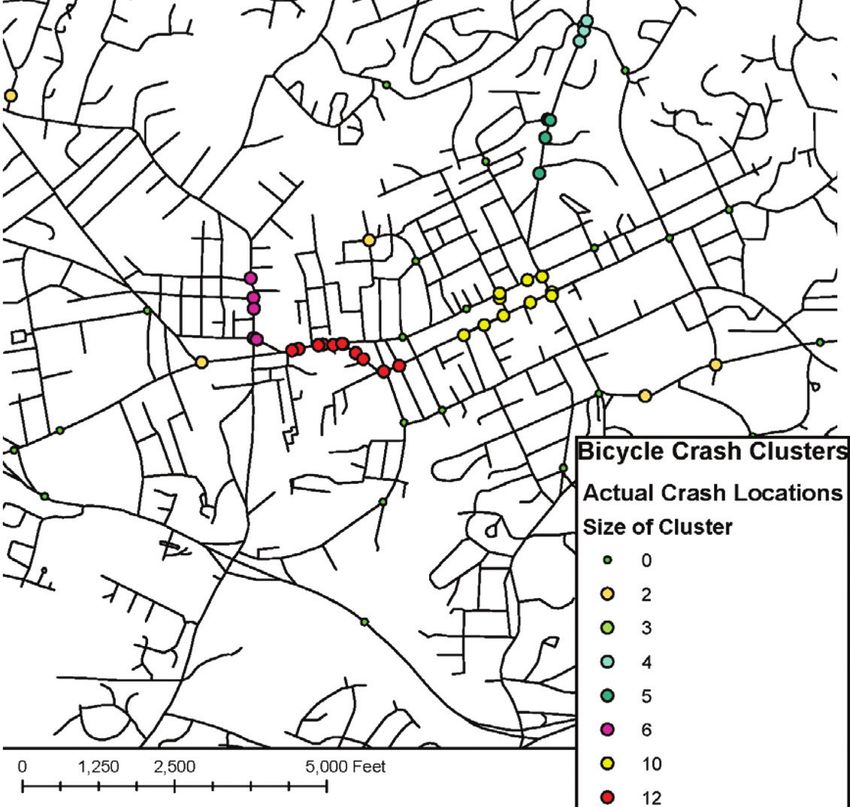
Bicycle Road Safety Audit Guidelines and Prompt Lists

                           1.3 Scope of These Guidelines
                                   The Bicycle Road Safety Audit Guidelines and Prompt Lists, a cyclist-specific RSA guide, presents
                                   RSA team members with safety elements they should consider when conducting a cyclist-
                                   specific RSA. While the authors have made every attempt to be as thorough as possible, persons
                                   performing RSAs are reminded that conditions vary from site to site and additional concerns
                                   not documented herein may arise. That said, agencies should tailor prompt lists to their indi-
                                   vidual needs. Not all prompts included in these Guidelines will be applicable for all areas.

                                   RSA team members with an understanding of the RSA principles and process can use this publi-
                                   cation to conduct an effective cyclist-oriented review of a facility or help ensure that the cycling
                                   component of the RSA is adequately considered. It is important to note, however, that an RSA
                                   involves a review of all modal behaviors, needs, and facilities. Other RSA resources, such as the
                                   FHWA Road Safety Audit Guidelines10 and the FHWA Pedestrian Road Safety Audits Guidelines and
                                   Prompt Lists11, may be helpful in conducting a thorough RSA.

                                   All elements of the roadway and pathway network where cyclists are permitted are covered in
    All elements of the roadway    these Guidelines. This includes on-road accommodations (e.g., shared roadways and roads with
    and pathway network where
    cyclists are permitted are
                                   designated bicycle facilities, like marked bicycle lanes) and off-road cycling facilities (e.g., shared
    covered in these Guidelines.   used paths and separated bike facilities).

                           1.4 Organization of These Guidelines
                                   The Bicycle Road Safety Audit Guidelines and Prompt Lists is organized into the following chapters:
                                   ■■   Chapter 2: Basic Principles of Bicycle Safety—provides an overview of the basic principles of
                                        cyclist safety considerations and where potential cycling issues are likely to occur.
                                   ■■   Chapter 3: Cyclists in the Road Safety Audit Process—answers basic questions about
                                        conducting RSAs and how that process is applied to effectively assess and enhance
                                        cyclist safety.
                                   ■■   Chapter 4: Using the Bicycle RSA Prompt Lists—explains the structure of the prompt lists
                                        and describes how to effectively use them when conducting a cyclist-specific safety audit.
                                        Also presents the prompt lists and descriptions of the prompts, including examples of safety
                                        concerns that may be encountered.
                                   ■■   Prompt Lists—identifies potential safety issues affecting cyclists and the conditions
                                        contributing to those issues.

                           1.5 Knowledge Base for Conducting RSAs
                                   Before conducting an RSA, it is critical that some RSA team members have an understanding of
                                   the design requirements for a cycling facility as well as the relative safety provided by various
                                   design features. Some RSA team members should also have an understanding of the necessary
                                   skills to bike, particularly in traffic. The following are resources that are important for the RSA
                                   team to understand. This list is not comprehensive, but having an understanding of these will
                                   help the RSA team members check for conditions that may create safety issues for cyclists.

4
Introduction
Standards/Guidelines
■■ AASHTO A Policy on Geometric Design of Highways and Streets “Green Book”
https://bookstore.transportation.org/Item_details.aspx?id=110
■■ Manual on Uniform Traffic Control Devices (MUTCD)
http://mutcd.fhwa.dot.gov/kno_2009.htm
Successful Practices/Guides
■■ AASHTO Guide for the Development of Bicycle Facilities
http://safety.fhwa.dot.gov/ped_bike/docs/b_aashtobik.pdf
■■ AASHTO Guide for Achieving Flexibility in Highway Design
https://bookstore.transportation.org/item_details.aspx?ID=103
■■ NACTO Urban Bikeways Design Guide
http://nacto.org/cities-for-cycling/design-guide/
■■ Complete Streets: Best Policy and Implementation Practices
http://www.planning.org/apastore/search/Default.aspx?p=4060
■■ ITE Context Sensitive Solutions in Designing Major Urban Thoroughfares for Walkable
Communities
http://www.ite.org/bookstore/RP036.pdf
■■ Road Diet Handbook: Setting Trends for Livable Streets
http://www.ite.org/emodules/scriptcontent/Orders/ProductDetail.cfm?pc=LP-670
Safety Resources
■■ BIKESAFE: Bicycle Countermeasure Selection System
http://www.bicyclinginfo.org/bikesafe/
■■ Commuter Bicyclist Behavior and Facility Disruption. Final Report (2007)
http://www.lrrb.org/pdf/200715.pdf
■■ NCHRP Report 500 Volume 18: A Guide for Reducing Collisions Involving Bicycles
http://onlinepubs.trb.org/onlinepubs/nchrp/nchrp_rpt_500v18.pdf
■■ Orlando Area Bicyclist Crash Study: A Role-Based Approach to Crash Countermeasures (2004)
http://www.docstoc.com/docs/3785626/Orlando-Area-Bicyclist-Crash-Study-A-Role-Based-
Approach-to
■■ Smart Cycling: Traffic Skills 101 (League of American Bicyclists)
http://www.bikeleague.org/programs/education/courses.php#101
■■ The Dilemmas of Bicycle Planning (Bicycle Driving)
http://bicycledriving.org/about/the-dilemmas-of-bicycle-planning
■■ Street Smarts (John Allen)
http://www.bikexprt.com/streetsmarts/usa/index.htm
State Resources
■■ Arizona Department of Transportation State Highway Bicycle Safety Action Plan
http://www.azdot.gov/mpd/systems_planning/bicycle_safety_study.asp
■■ Massachusetts Highway Department Project Development and Design Guide
http://www.mhd.state.ma.us/default.asp?pgid=content/designGuide&sid=about
■■ North Carolina Bicycle Facilities Planning and Design Guidelines (manual and video)
http://www.ncdot.gov/bikeped/projectdevelopment/design_guidelines/default.html
5Bicycle Road Safety Audit Guidelines and Prompt Lists
■■ Oregon Bicycle and Pedestrian Plan
http://www.oregon.gov/ODOT/HWY/BIKEPED/planproc.shtml
■■ Virginia Bicycle Facility Resource Guide
http://www.virginiadot.org/programs/resources/bk-facresguide.pdf
RSA Guidance
■■ FHWA Road Safety Audit Web Site
http://safety.fhwa.dot.gov/rsa/
■■ FHWA Road Safety Audit Video
http://safety.fhwa.dot.gov/rsa/video2009/
■■ FHWA Road Safety Audit Guidelines (Publication FHWA-SA-06-06)
http://safety.fhwa.dot.gov/rsa/guidelines/documents/FHWA_SA_06_06.pdf
■■ FHWA Pedestrian RSA Guidelines and Prompt Lists (Publication FHWA-SA-07-007)
http://katana.hsrc.unc.edu/cms/downloads/PedRSA.reduced.pdf
Level of Service (LOS) Tools and Quantitative Assessments
■■ Bicycle Level of Service (BLOS) tool and guidelines
http://www.bikelib.org/roads/blos/blosform.htm
■■ Pedestrian and Bicycle Intersection Safety Indices (Ped and Bike ISI)
http://www.fhwa.dot.gov/publications/research/safety/pedbike/06130/06130.pdf
■■ Pedestrian and Bicycle Crash Analysis Tool (PBCAT)
http://www.walkinginfo.org/facts/pbcat/index.cfm?/pc/pbcat.htm
■■ NCHRP Report 616: Multimodal Level of Service Analysis for Urban Streets (2008)
http://onlinepubs.trb.org/onlinepubs/nchrp/nchrp_rpt_616.pdf
1.6 Glossary of Terms
The glossary is intended to identify terms used in these Guidelines referring to bicycle facility
planning, design, and engineering. This glossary will help to establish the appropriate and
consistent terminology for everyone involved in the RSA process.
■■ Bicycle (Bike)—A pedal-propelled device that is solely human powered and has two or more
wheels, including children’s bicycles, except a toy vehicle intended for use by young children
such as a tricycle.12
■■ Bicycle Boulevard—A street segment (or series of contiguous street segments) that has been
modified to accommodate through bicycle traffic but discourage through motor traffic.
■■ Bicycle (Bike) Box—A defined and/or colored area at a signalized intersection provided for
bicyclists to pull in front of waiting traffic. The box is intended to reduce car-bike conflicts,
particularly involving right-turning movements across the path of a bicyclist, and to increase
bicyclist visibility.
■■ Bicycle Facility—A general term denoting infrastructure and provisions to accommodate
or encourage bicycling, including parking and storage facilities, and shared roadways not
specifically designated for bicycle use.12
■■ Bicycle (Bike) Lane—A portion of a roadway that has been designated by striping, pavement
markings, and signs for the preferential or exclusive use of bicyclists (see Figure 1).12
6Introduction
Figure 1. A Depiction of Key Terms Used to Describe Roadway Elements that Relate to Cyclists.
■■ Bicycle (Bike) Path—A pathway that is intended for the exclusive use by bicyclists, where a
separate, parallel path is provided for pedestrians and other wheeled users. Most pathways are
shared between bicyclists and other uses (See Shared Use Path).12
■■ Bikeway—A generic term for any road, street, path, or traveled way that is in some
manner specifically or legally designated for bicycle travel, regardless of whether such
facilities are designated for the exclusive use of bicycles or are to be shared with other
transportation modes.12
■■ Bus/Bikeway—A marked lane for exclusive use by buses and cyclists. May also be referred to
as a bus/bicycle lane.
■■ Complete Streets—Roadways that are designed with the safety of all users in mind, including
but not limited to motorists, pedestrians, bicyclists, and transit users.
■■ Contraflow Bicycle Lane—A bicycle lane that allows bicyclists to travel the opposite direction
of motor vehicle traffic on a one-way street.
■■ Cycle Track—A bicycle facility, typically unidirectional, that is separated from motor vehicle
travel lanes, as well as sidewalks and pedestrians, by a physical barrier such as on-street
Cycle Track parking or a curb, or is grade-separated (see Figure 2).
Figure 2. An Example of a Cycle Track on a City Street.
7Bicycle Road Safety Audit Guidelines and Prompt Lists
■■ Cyclist (Bicyclist, Rider or Bike Rider)—A person who is riding a bicycle as defined above.
■■ Highway—The entire width between the right-of-way open to the use of the public for
purposes of vehicular travel, including paved shoulders.12
■■ Loop Detector—An inductive (wire) loop embedded in the pavement that detects the
presence of a vehicle at a signalized intersection to activate a signal change. Diagonal
quadruple loops typically provide the best bicycle detection.
■■ Multi Use Path—See Shared Use Path.
■■ National Bike Routes—A national network of bike routes that may span multiple States or
have national or regional significance.
■■ On-road Accommodation—A facility that is part of the roadway or traveled way that is
typically used by bicyclists and/or motor vehicles such as a shared lane, wide curb lane,
bicycle lane, or bikeable shoulder.
■■ Off-road Accommodation—A path that is separate from the roadway used by motor
vehicles. This may parallel a roadway or may be separate from a road, as it may pass through
parks within the public right-of-way or on private right-of-way. This can be separated from
pedestrian traffic (bicycle path) or shared with pedestrian traffic (shared use path).
■■ Path—See Shared Use Path. Non-descriptive, general term.
■■ Paved Shoulder—The portion of the roadway contiguous with the traveled way for
accommodation of stopped vehicles, for emergency use, and for lateral support of sub-base,
base, and surface courses (see Figure 1).12 Use by cyclists may be allowed or prohibited based
upon specific State laws.
■■ Roadway—The portion of a highway, including the shoulder, that is improved, designed, or
ordinarily used for vehicular travel (see Figure 1).12
■■ Separated Bicycle Facility—A bikeway within or adjacent to the roadway and separated from
moving traffic by barriers or curbs, parking lanes, striped buffers, and other means.13 Separated
bicycle facilities may be unidirectional or bidirectional.
■■ Shared Lane—A lane of a traveled way that is open to bicycle travel and motor vehicle use.
●● Narrow Lane—A travel lane less than 14 feet in width, which therefore does not allow
bicyclists and motorists to travel side-by-side within the same traffic lane and maintain a
safe separation distance.
●● Wide Curb Lane—A travel lane at least 14 feet wide, adjacent to a curb, which allows
bicyclists and motorists to travel side-by-side within the same traffic lane.
■■ Shared Lane Marking (SLM or “Sharrow”)—A pavement marking symbol that assists
bicyclists with lateral positioning in lanes that are too narrow for a motor vehicle and a bicycle
to travel side-by-side within the same traffic lane.14
■■ Shared Roadway—A roadway that is open to and legally permits both bicycle and motor
vehicle travel12; any existing street where bicycles are not prohibited.
■■ Shared Use Path—A bikeway physically separated from motorized vehicular traffic by an
open space or barrier and either within the highway right-of-way or within an independent
right-of-way (see Figure 1). Shared use paths may also be used by pedestrians, skaters,
wheelchair users, joggers, and other non-motorized users.12 Such facilities are often referred
to as “trails.”
8Introduction
■■ Sidewalk—The portion of a street or highway right-of-way designed for preferential or
exclusive use by pedestrians (see Figure 1).12
■■ Signed Shared Roadway (Signed Bike Route)—A shared roadway that has been designated
by signing as a preferred route for bicycle use.12
■■ Traffic Calming—A way to design or retrofit streets to encourage slower and more uniform
vehicle speeds.
■■ Trail—Non-descriptive general term typically referring to off-roadway facilities but with no
standardized definition. Use should generally be avoided as it may refer to a range of facilities,
including a coarse, unpaved hiking/biking route or a paved urbanized facility.
■■ Traveled Way—The portion of the roadway, excluding shoulders, to be used for the
movement of vehicles (see Figure 1).12
9Bicycle Road Safety Audit Guidelines and Prompt Lists
2
Chapter 2. Basic Principles of Bicycle Safety
This chapter provides a brief overview of elements that affect cyclists’ safety. RSA teams should
have an understanding of these elements to better evaluate the cycling environment and
improve the quality and safety of facilities that support cycling as a mode of travel.
2.1 Cycling as a Mode of Travel
Cyclists are legitimate users of the roadway and an integral part of our transportation system.
The USDOT statement on bicycle and pedestrian accommodation regulations and recommen-
dations released in March 2010 articulates this policy foundation.15 The policy recommends that
well-connected bicycle networks should be planned, funded, and implemented, particularly
connecting to transit services. The policy encourages “transportation agencies to go beyond
the minimum requirements, and proactively provide convenient, safe, and context-sensitive
facilities.” In conclusion, the policy states that the “USDOT recognizes that safe and convenient
walking and bicycling facilities may be different depending on the context—appropriate facili-
ties in a rural community may be different from a dense, urban area. However, regardless of
regional, climate, and population density differences, it is important that pedestrian and bicycle
facilities be integrated into transportation systems.”
Cycling refers to a range of uses for bicycles, including commuter bicycling, as well as recre-
ational uses, exercise, and children riding bikes to and from school. Cycling has experienced a
resurgence by commuters looking for an alternative means to access the workplace, a healthier
mode of transportation, and a new way to utilize connections to transit, particularly in cities and
suburbs where traffic congestion and rising fuel prices are influencing commuters to consider
alternative modes. In some areas, cycling as a commuter choice has doubled in recent years,
and investment in infrastructure improvements to accommodate cyclists has increased.16
Initiatives, such as Complete Streets policies, recognize the importance of cycling in the proper
context, and bike share programs have made bicycles more accessible to people, particularly in
urban areas, college campuses, and communities pursuing sustainable transportation systems.
However, bicycling safety issues persist and will become increasingly relevant as bicycling
11Bicycle Road Safety Audit Guidelines and Prompt Lists
activity continues to expand, highlighting the importance of providing appropriate levels of
bicycle accommodation on a range of transportation facilities.
2.2 Characteristics of Cyclists
There are many factors that affect the safety of bicycling. It is crucial for the RSA team to under-
stand the range of characteristics exhibited by cyclists using various facility types and how
designs may or may not accommodate the range of bicycle types and cyclist abilities.
A wide range of bicycle, cyclist, and facility characteristics should be considered as part of an RSA.
In the past, cyclists were categorized corresponding to riding ability and comfort with speed
and proximity to other vehicles to simplify considerations in the planning and design process.
Now it is better understood that different abilities of cyclists should be considered on all types
of facilities. To accommodate a range of cycling characteristics on any bicycle facility, it is impor-
tant to understand the physical and operational attributes of bicycles and cyclists.
Space—The required width to accommodate a cyclist is the width of the cyclist plus the width
to operate or maneuver a bicycle. Similarly, the required height to accommodate a cyclist
considers bicycle and rider dimensions. Figure 3 illustrates the unobstructed space needed by
a typical cyclist to safely maneuver. The width of a cyclist should be considered as it relates to
facility design, as well as surrounding influencing factors. For example, on shared use paths,
cyclists may prefer to ride side-by-side, or there may be a large number of bike trailers on the
path. These conditions would require operating space beyond the minimums illustrated in
Figure 3. Additionally, cyclists will lean into a curve at moderate or higher speeds, resulting in
an angled riding axis, lower pedal clearance from the riding surface, and a possible need for
greater horizontal clearance. The amount of space afforded to cyclists may directly impact their
ability to safely navigate a route, as cyclists expend a high amount of mental effort to main-
tain course in narrow or constrained conditions rather than paying due attention to potential
obstacles or harmful conflicts with other facility users.17
12Basic Principles of Bicycle Safety
Figure 3. Operating Space for Cyclists.18
Length—Relates to space needed for longitudinal clearance, which may be especially critical
at intersections where motor vehicles, bicycles, and pedestrians share space. Longitudinal
space should consider the varying lengths of bicycles that are expected to use a facility and the
impact on safety (see Figure 4). For example, at a midblock crossing of a shared use path, the
space dedicated to a cyclist in the refuge area may need to adequately accommodate a bicycle
and trailer without encroaching on the roadway.
A. Adult Typical Bike
B. Adult Single Recumbent Bicycle
C. Additional Length for Trailer Bike
D. Additional Length for Child Trailer
E. Width for Child trailer
F. Adult Tandem Bicycle
Figure 4. Variation in Bicycle Dimensions.12
Stability— Bicycles are generally unstable vehicles and rely on the user to maintain an upright
orientation. The stability of a cyclist is affected by:
■■ Travel speed.
■■ Surface conditions.
■■ Environmental factors.
13Bicycle Road Safety Audit Guidelines and Prompt Lists
Cyclists typically need to maintain a reasonable level of speed to remain stable. At slower
speeds, cyclists begin to lose stability and will often “zigzag” to maintain stability. In the context
of bicycle control, ”zigzagging” is moving from side-to-side (i.e., laterally) in an effort to maintain
balance.17 This behavior is also performed at higher speeds with less lateral deflection. The
speed and stability of a bicycle are related to its space requirements (i.e., the wider the zigzag
movement, the more unobstructed lateral space required).
Surface conditions can also affect the stability of a cyclist. Rough and slippery surfaces can
Facilities used by cyclists contribute to a cyclist losing control. The environment can also play a role, with wet and windy
should be smoother than
those deemed acceptable conditions affecting traction and stability. Destabilizing wind conditions can be due to environ-
for motorized traffic. It is also mental conditions or air flow caused by large vehicles passing.
important that debris be
cleared from facilities used
by cyclists. Speed, Deceleration, and Stopping—Travel speed may vary greatly depending on the terrain,
type and quality of the bicycle equipment, and the skill and competency level of the cyclist.
Often, differences in speed are most pronounced on long uphill gradients, where the rela-
tive physical abilities of cyclists are a significant factor. Conversely, on downhill gradients, even
novice cyclists can achieve similar speeds to the more experienced cyclists and adjacent motor
vehicles. Cyclist speed has a particularly important bearing on line-of-sight considerations at
intersections and the ability for cyclists to safely navigate the intersection (including elements
such as the distance required to stop, the time needed to decelerate, and surface condi-
tions affecting friction).
Vulnerability—Cyclists are vulnerable road users. Unlike motorists, who are afforded protec-
tion within the structure of a vehicle, bicycles offer little or no protection to a cyclist. Cyclists
may or may not understand their vulnerability and, as a result, may allow real or perceived
environmental factors, such as availability of dedicated bicycle facilities, frequency of conflict
points with other users, time of day, surface quality, types of vehicles, and terrain to influ-
ence route selection and other riding behaviors. For example, cyclists may choose routes
with more conflict points, such as at driveways or intersections, to reduce perceived conflicts
with same-direction traffic.
2.3 The Cycling Network
Facilities for cyclists, whether on-road or off-road, should be part of a network that connects
cyclists to urban, suburban, and rural land uses. The context of the road for a bicycle facility is
a key element that should be considered in the design. The type and level of accommodation
must be appropriate for the characteristics of the surrounding conditions. A “one-size-fits-all”
approach may result in an underutilized facility or a facility that does not improve cycling safety,
and, in some instances, may degrade cyclist safety. There are several factors that should be
considered in all contexts to provide safe accommodations for cyclists.
Directness—The cycling network should be direct between key destinations, considering both
distance and time.17 On a corridor level, it is important to understand the “desire lines” of cyclists
accessing key destinations. While directness typically refers to the shortest path to access desti-
nations, it is influenced by travel time factors (e.g., the speed of a route) that may be influenced
by the number of stops, grade, and other factors. Frequent stops and steep, uphill sections
along a corridor can be a significant burden to cyclists operating under their own power.
14Basic Principles of Bicycle Safety
Continuity and Connectivity—The cycling network should be continuous (i.e., without gaps
or abrupt changes) and provide convenient linkages to destinations. Often, it is the transition
between different land uses and environments where the nature of cycling accommodations
changes. For example, a separated facility along public property may become a bicycle lane or
an undesignated area where cyclists ride with traffic. Continuity may also relate to any aspect of
a facility, such as available riding space or quality.
Comfort—Cyclist comfort level and perceived risk should be considered, as they may influ-
ence route choice and riding behaviors. When presented with facilities on high-speed, high-
volume roadways, some cyclists may be more comfortable when dedicated space is provided
to create separation from motorized traffic. A lack of adequate riding space or a concern for
personal safety will often influence route selection and other riding behaviors, including cyclist
use of sidewalks. Within an area studied as part of an RSA, it is critical to understand that cyclist
behavior is greatly influenced by route preference and the cyclist’s perceived risk of the route or
path intended for their use.
2.4 Crash Data Analysis Considerations
Crash data analysis is one method to identify factors contributing to collisions and to identify
The RSA team area-wide or location-specific crash trends that warrant further safety audit. However, an RSA
should consider team should consider that reported crashes may not capture the entire crash and injury picture.
that the
Typically, reported crashes only represent a fraction of the total number of cycling crashes
reported crashes
only represent occurring on public roadways. For many jurisdictions, official crash reporting does not include
a portion of the bicycle-only crashes that occur on the roadway, bicycles striking fixed objects, or crashes
bicycle-related between cyclists and pedestrians. A multi-State study for FHWA based on hospital emergency
crashes that department8 data suggests that typical State crash databases, even with a high rate of
occur. reporting, may only capture about one-fourth of the crashes serious enough to require treat-
ment at a hospital emergency department and less than half of the crashes on the roadway
that resulted in serious cyclist injuries.
Cycling crashes on sidewalks, parking areas, or off-roadway paths are also unlikely to be
included in most State and local reported crash databases. At least one-fourth of the significant
injuries in the hospital study resulted from crashes in non-roadway areas; about half of these
were on sidewalks. Since the FHWA study was performed, there has been significant expan-
sion in off-roadway infrastructure, including shared use paths. Data on crashes with motor
vehicles on roadways or at roadway-path intersections should be available from State or local
crash databases. However, data are typically lacking on how many cyclists are being injured in
bicycle-only falls, crashes with other non-motorized users or objects, or in crashes in off-road
areas, including shared used paths and path junctions. The RSA team should consider that the
reported crashes only represent a portion of the crashes that have occurred. The RSA team
should consider seeking other sources of data, such as hospital or emergency department
records or indications of bicycle crashes from self-reports to area agencies. Local cyclists may be
able to provide information on cycling conditions. The team should also focus on conflicts and
conditions that are likely to have contributed to unreported crashes.
15Bicycle Road Safety Audit Guidelines and Prompt Lists
2.5 Factors That Contribute to Bicycle Crashes
National, State, and local studies have highlighted some of the factors frequently associated
with reported bicycle crashes with motor vehicles, including pre-crash maneuvers and events
leading up to crashes. These descriptive statistics may help to identify crash trends and identify
areas where RSAs may be conducted; however, RSAs should include an analysis of site-specific
crash data to similarly identify trends in crash locations (e.g., intersections or segments), types
(e.g., a vehicle turning into the path of cyclist or wrong-way cycling), injury level, time of day,
and roadway and environmental factors that indicate operational or design issues potentially
contributing to crashes. Since bicycle crash data may be scarce, detailed crash reports should
also be examined to determine specific circumstances that may have contributed to crashes at
individual locations.
Finally, observing conditions and behaviors in the field is critical to a comprehensive under-
standing of the conditions underlying bicycle safety issues, because even detailed crash
descriptions may not capture the nature of existing safety issues. RSAs are a useful proactive
tool to identify issues on a system-wide or corridor-wide basis, including at locations where
crashes may not have yet occurred (or been reported).
2.5.1 Location Factors
FHWA initiated a study of cycling crashes from six States in the early 1990s to gain an under-
standing of types of crashes, locations, and other factors associated with bicycle and pedestrian
collisions with motor vehicles (see Figure 5).7 Key findings from the study include:
■■ A majority of bicycle-motor vehicle collisions (approximately 70 percent) occurred in urban
areas where more cycling occurs.
■■ Approximately one-half (51 percent) of the bicycle crashes occurred at intersections or
were related to intersections, 22 percent occurred at junctions with commercial and private
driveways or alleys, and the remaining 27 percent occurred on roadway segments.
In compact urban areas with a dense street grid (and relatively short intersection spacing), an
even higher proportion of collisions may occur at intersections. For example, an analysis of
bicycle crashes in Cambridge, Massachusetts found that 68 percent occurred at intersection
locations (39 percent unsignalized and 29 percent signalized).19 Other studies have analyzed
trends in location by comparing urban and rural environments. Figure 5 compares intersection-
related versus non-intersection-related crashes in North Carolina. In urban areas intersection-
related crashes involving a cyclist were more prevalent than non-intersection crashes while in
rural areas non-intersection related crashes were higher.
Figure 5. Percentage of Bicycle-Motor Vehicle Crashes by Urban or Rural Locations in
North Carolina.20
16Basic Principles of Bicycle Safety
Geographic information systems (GIS) or other spatial analyses can help to identify area-wide
crash concentrations, and corridors or intersections that may benefit from an RSA. For example,
in the Orlando metropolitan area, one-fourth of bicycle crashes with motor vehicles were
concentrated on 19 corridors that made up less than one percent of the street centerline miles.
These corridors may represent high motor vehicle and high bicycle volume corridors and may
present an opportunity to make corridor-wide safety improvements.
Spatial analyses of specific crash locations may range from simple, such as creating a push-pin
map, to more detailed analyses using GIS or other software. Examples of spatial crash analyses
using GIS are shown in Figure 6.
Figure 6. Examples of Spatial Analyses of Mapped Crash Locations. Different types of spatial analyses are available to
help identify high-crash zones, corridors, or intersections for RSAs. Areas with similar characteristics, but which have
not yet experienced crashes, may be considered for similar treatments proactively.21
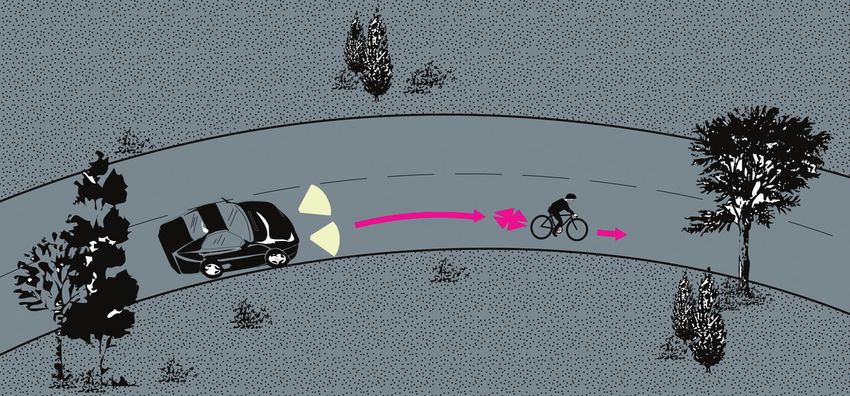
2.5.2 Speed Factors
The speed differential between vehicles and bicycles on higher speed roadways is greater than
on lower speed roadways, which may present additional challenges for cyclists and motor-
ists, such as judging gaps between vehicles when crossing the road or the time and distance
required for vehicles to stop or overtake a cyclist. Figure 7 illustrates the relationship between
the posted speed limit of a road and the severity of a crash involving cyclists. The severity of a
crash involving a cyclist and motorist increases exponentially with speed. In rural areas, many
two-lane highways are designed for relatively high speeds and provide few separate accommo-
dations or alternative lower-speed routes between destinations for cyclists. Although the overall
frequency of bicycle crashes tends to be higher in urban areas, where more cycling takes place,
crashes in rural areas more often result in fatal or serious injuries. For example, in North Carolina,
fatalities resulted 3.5 times more often from a crash in rural areas compared with those in urban
areas of the State.22
17Bicycle Road Safety Audit Guidelines and Prompt Lists
Figure 7. Percentage of Bicyclists Killed or Seriously Injured in Bicycle-Motor Vehicle Crashes
by Posted Speed Limit in North Carolina.22
2.5.3 Seasonal Factors, Weather, and Surface Conditions
The occurrence of bicycle crashes varies substantially by season, as the prevailing weather has a
significant impact on the number of bicycle trips, surface conditions, and visibility. The multi-
State FHWA study noted a strong seasonal trend in crashes, with 69 percent of collisions occur-
ring over the months of April to September (spring and summer).7 These trends are likely associ-
ated with variation in level of riding activity across the seasons but could also incorporate other
risk factors that vary by season. For example, some regions would likely see different trends
depending on year-round temperatures, rainfall, snow and ice, and other seasonal factors, such
as presence of college campuses and trends in tourism. In high-tourist areas, both drivers and
cyclists may be unfamiliar with roadways, traffic patterns, or local traffic laws, and may need
more wayfinding assistance, among other possible remedies.
Agencies with access to crash data may find it useful to use the Pedestrian and Bicycle Crash Analysis Tool
(PBCAT). PBCAT is a crash typing software intended to assist practitioners with improving walking and
bicycling safety through the development and analysis of a database containing details associated with
crashes between motor vehicles and pedestrians or bicyclists. http://www.walkinginfo.org/facts/
2.5.4 Behavioral Factors
Behavioral factors of cyclists and motorists are often identified through a process called crash
typing. Most crash report forms and the resultant crash databases do not capture details of
cyclist and motorist maneuvers, pre-crash position, or other factors leading up to the crash.
Crash typing was developed to enhance the understanding of events leading up to bicycle
and motor vehicle collisions and the factors associated with such events. This knowledge may
be used to better target countermeasures or aid in development of new countermeasures for
common crash scenarios.23
The most common types of crashes found in both rural and urban areas from the six States in
the early 1990s study by FHWA7 are shown in Table 1, with more recent data from North Caro-
lina22 and the Orlando metropolitan area included, as well.24 The data from Orlando represent
crash distributions in a large metropolitan area, while the data from North Carolina represent
trends from all urban areas (municipalities) and from all rural areas of North Carolina. The crash
18Basic Principles of Bicycle Safety
types shown in Table 1 accounted for nearly 89 percent of all crashes in the six-State FHWA
study, approximately 84 and 90 percent of crashes in urban and rural areas of North Carolina,
and 76 percent of crashes in the Orlando metropolitan area.
As the data in the table illustrate, the distribution of crash types may be different for each area
and will depend on site-specific conditions. The RSA team should consider ways that the envi-
ronment and roadway conditions may have contributed to such crashes as well as behaviors
that should be addressed through enforcement and education.
Table 1. Bicycle-Motor Vehicle Crash Types from FHWA’s Six-State Study7, North Carolina, and
Orlando, Florida Metropolitan Planning Organization (MPO).
Bicycle Crash Type Groups Percentage of Crashes
North North Orlando
FHWA Carolina Carolina Metropolitan
(early Urban Rural Area
‘90s) (‘04-’08) (‘04-’08) (‘03-’04)
CROSSING PATHS
Motorist failure to yield – 14.4 13.9 5.5 14.0
intersection
Bicyclist failure to yield – intersection 16.8 15.3 7.9 14.0
Bicyclist failure to yield – midblock 11.7 8.6 10.8 9.3
Motorist failure to yield – midblock 6.9 8.5 3.0 10.1
(driveway/alley)
Turning errors – bicyclist and 1.4 1.5 1.7 2.7
motorist
Bicyclist failure to clear intersection 1.4 1.3 0.2 0.0
Crossing Path Total 52.6 49.1 29.1 50.1
PARALLEL PATHS
Motorist turned/merged into path of 12.1 13.2 6.9 8.1
bicyclist
Motorist overtaking bicyclist 8.6 8.9 29.3 8.1
Bicyclist turned/merged into path of 7.3 6.8 16.9 5.4
motorist
Bicyclist overtaking motorist 2.7 1.6 0.7 0.6
Operator wrong side/head-on 2.8 2.1 5.6 2.5
(motorist or bicyclist)
Motorist loss of control 0.6 0.3 0.5 0.3
Bicyclist loss of control 1.8 2.2 1.3 1.0
Parallel Path Total 35.9 35.1 61.2 26
Total for Common Crash Types Listed 88.5 84.2 90.3 76.1
19Bicycle Road Safety Audit Guidelines and Prompt Lists
Despite the differences in the types of crashes, there are some general trends that merit
consideration by the RSA team. One of the most frequent group of crashes in the national,
North Carolina urban, and Orlando metropolitan area studies involved motorist failure to yield
at intersections (signalized, sign-controlled, or uncontrolled). These crashes include motorists
pulling out or driving into intersections and into the path of bicyclists on initial crossing paths.
Motorists and bicyclists may fail to stop for a red signal indication or a stop sign, or pull into the
path of each other at a stop-controlled location after initially stopping, including to make right
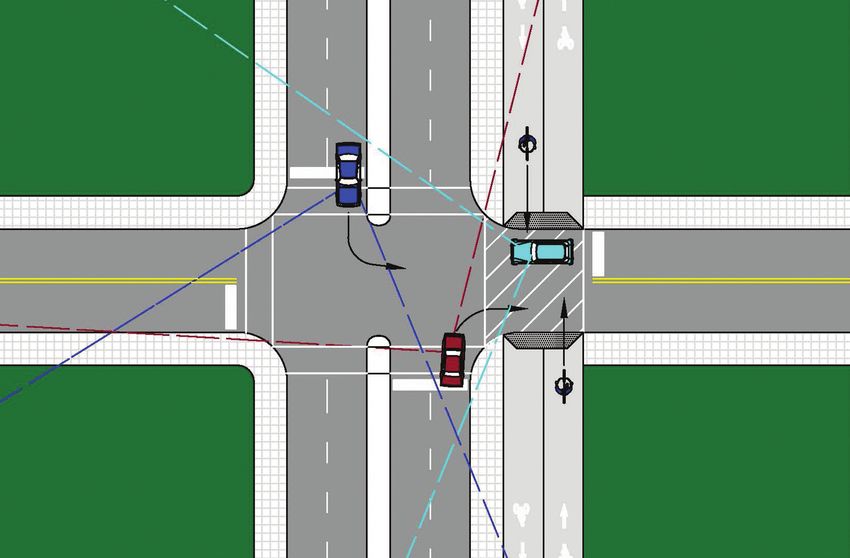
turns on red or to make right or left turns at stop signs (see Figure 8).
Figure 8. Crossing Path Crash - Motorist Failure to Yield at Stop-Controlled Intersection.24
Cyclists may contribute to these types of crashes by riding the wrong way (against traffic),
on the sidewalk, or both. Nearly one-third (32 percent) of all cyclist collisions in the FHWA
study involved cyclists riding against traffic; for intersection collisions, the proportion was 42
percent.7 The Orlando metropolitan area study found that 43 percent of cyclists were riding
against traffic. Both wrong-way and sidewalk riding place cyclists in positions where they are
not expected by motorists at intersections and at driveways. Crashes at driveways are catego-
rized as motorist failure to yield – midblock. The RSA team should examine conditions that may
contribute to wrong-way or sidewalk riding, as well as conditions at intersections that might
contribute to these types of crashes. Cyclists may be using sidewalks because they are uncom-
fortable with traffic or roadway conditions. Sidewalk and wrong-way riding may also be preva-
lent if shared use paths do not have adequate connections in both directions of a multilane
or divided roadway.
The category of bicyclists failing to yield at intersections was also a frequent group of crashes in
the national, North Carolina urban, and Orlando metropolitan area studies. Cyclist ride-throughs
at stop signs or traffic signals are a frequent crash type in urban areas. Frequent stops along a
corridor can be a significant burden to cyclists trying to conserve energy or avoid unclipping
from foot pedals. A route that provides few stops for cyclists could improve safety and mobility
for cyclists. These crashes also can occur when a cyclist is attempting to cross a multilane or
high-volume roadway and has difficulty identifying a suitable gap in traffic. Side streets on
high-volume, high-speed roads are often stop-controlled with no controls on the main road
and may be a challenge for cyclists. Factors or conditions similar to those described at junctions
may also affect access from commercial or private driveways (categorized as bicyclist failure to
yield – midblock). Parking or other sight distance issues are among other factors that could also
contribute to such crashes.
Traffic signals without automated detection for bicycles may contribute to cyclists riding
through after slowing or stopping. Cyclists may also fail to clear an intersection before being
20You can also read