Not sure POST RTC approval - for RTC chair and Deputy Chair to approve any subsequent edits as marked 06May2021 A2570814 - Tasman District Council
←
→
Page content transcription
If your browser does not render page correctly, please read the page content below
A2570814

  Not sure

                           POST RTC approval – for RTC
                           chair and Deputy Chair to
                           approve any subsequent edits
                           as marked
                           06 May 2021    A2570814

FINAL DRAFT FOR SUBMISSION TO                                 Formatted: Font color: Red
WAKA KOTAHI June 2021

A2570814                                                      Formatted: Font color: Red

                                                          1
A2570814

FOREWORD – CHAIRS OF TE TAUIHU

    Land transport plays a critical role in connecting our community by providing access to employment,
    education, recreation and services, as well as enabling the movement of freight in support of business and
    industry.

    The Regional Land Transport Plan (RLTP) is a critical document for Te Tauihu o Te Waka-a-Māui (Te Tauihu)
    or the “Top of the South Island’ as it underpins all of the region’s road network and transportation planning, as
    well as the investment priorities over the next six years on both the state highway and local road networks.
    From a statutory perspective, the RLTP meets the requirements of the Land Transport Management Act 2003
    and contributes to the overall aim of the Act.

    A core requirement of the RLTP is that it must be consistent with the strategic priorities and objectives of the
    Government’s Policy Statement on Land Transport and take into account the National Energy Efficiency and
    Conservation Strategy.

    The vision of this RLTP is to have a safe and connected region that is liveable, accessible and sustainable.

    Te Tauihu is growing and changing, resulting in increasing transport challenges across the region. A strong,
    coordinated and integrated approach to developing the 10 year transport vision for the region is required to
    accommodate the impacts of the anticipated levels of growth, whilst maintaining economic activity levels,
    safety and mode choice.

    Alongside this RLTP has been development of a Te Tauihu Intergenerational strategy which outlines a vision,
    tūpuna pono, to be good ancestors. It has te oranga tauihu, the wellbeing of our people and our places over
    the generations, at its heart. The strategy has eight “intergenerational outcomes” at its core, from te taio (the
    natural world) and pūtea (economy), to te tauihutanga (top of the south identity) and mātauranga (knowledge).
    The two bodies of work have many common elements.

    This RLTP is a joint plan between Waka Kotahi, Marlborough, Nelson and Tasman to look at issues,
    objectives and significant projects that will benefit Te Tauihu. It also introduces the great work that the South
    Island Regional Transport Committee Chairs Group is doing to facilitate integrated multi-modal freight and
    visitor journeys, advocate for funding approaches that work for the South Island context and improve South
    Island transport resilience.

    Te Tauihu has significant challenges around population growth, demands of freight, transitioning to more
    sustainable modes of transport and financial constraints. As such, we have the systems and people in place
    to deliver on the core transportation requirements to provide a safe and efficient transport system.

    This is the first year that KiwiRail is able to draw on the National Land Transport Fund (NLTF) and it is
    included in the RLTP. This is critical for seeing the transport system as a connected network rather than
    discrete modes that operate in isolation. This is particularly important for Te Tauihu with the Interislander
    ferries operating out of Picton and the Main North Line being a key freight connection between the North
    Island and South Island.

    This RLTP acknowledges the collaboration that is already happening on planning for the future such as the
    new Picton Ferry Terminal, the Nelson Future Access Study and the Richmond Transport Programme
    Business Case.

    The change of Government in 2017 resulted in a change in national land transport priorities including a greater
    focus on public transport, walking and cycling and rail. This change in direction was substantial, with the
    effects of it being reflected in the transport planning currently underway. In addition to the changes to
    transport priorities, the Government has introduced other changes with impacts on transport through its urban
    growth agenda and climate change policies.

                                                                                                                        2
A2570814

    And finally, thanks go to all those who have provided input into the development of the RLTP, specifically
    the community input that has helped refine this plan, our key stakeholders and the South Island Regional
    Chairs Group.

    The Chairs of Te Tauihu invite public feedback to this Regional Land Transport Plan. Consultation opens mid
    February 2021 and closes mid March 2021.

     Cr Francis Maher                     Cr Brian McGurk                   Deputy Mayor Stuart Bryant

     Chairman                             Chairman                          Chairman

     Marlborough Regional                 Nelson Regional Transport         Tasman Regional Transport
     Transport Committee                  Committee                         Committee

                                                                                                                  3
A2570814

FOREWORD – SOUTH ISLAND REGIONAL TRANSPORT COMMITTEE CHAIRS GROUP

    The South Island Regional Transport Committee Chairs Group recognises that freight and visitor journeys,
    and concerns about resilience, do not stop at district or regional boundaries. In light of this, the Group has
    committed to working collaboratively to advance planning work across Te Tauihu.

    The transport system provides the arteries and veins that bring life to our communities, supports regional
    prosperity and improves the overall wellbeing of the South Island. The transport system connects our
    communities, allowing people to travel safely and efficiently across our diverse landscapes, and enables the
    safe and efficient movement of the freight. It is imperative to ensure the transport network is working as
    effectively as possible.

    The South Island Regional Transport Committee Chairs and Deputy Chairs Group was formed in 2016 for this
    purpose. The Group seeks to significantly improve transport outcomes for all modes in the South Island
    through better inter-regional collaboration and integration.

    The Group is focused on ensuring the South Island stays at the forefront of central government thinking. The
    formation of the Group recognises that the South Island advocating with one voice is more effective than
    seven regions advocating independently on the same matters.

    This approach seeks to ensure that the needs and aspirations of our South Island communities are recognised
    and understood by Central Government. We want to be seen by Central Government as a group of one
    million people with a common aspiration for our transport system. Notwithstanding, each region in the South
    Island has unique characteristics, but at the same time will share similar transport priorities and challenges.

    These shared priorities form the priorities of this Group and are listed below.

           1. Advocacy for transportation in the South Island, including tracking how Central Government
              investment such as the National Land Transport Fund (NLTF) and the Provincial Growth Fund (PGF)
              is being allocated across the country.
           2. Resilience of the transport network.
           3. Freight journeys across the South Island.
           4. Tourism journey improvements across the South Island.
           5. Enabling funding approach for innovative multi-modal (road, public transport, walking, cycling, rail, air
              and sea) solutions.
           6. Exploration of opportunities for inter-regional public transport.

                                                                                                                          4
A2570814

CONTENTS
   Foreword – Chairs of Te Tauihu............................................................................................................................... 2
   Foreword – South Island Regional Transport Committee Chairs Group ................................................................. 4
Contents ...................................................................................................................................................................... 5
Executive Summary ................................................................................................................................................... 7
Introduction................................................................................................................................................................. 9
Strategic Context ...................................................................................................................................................... 11
   Our Region ............................................................................................................................................................. 11
   Our People ............................................................................................................................................................. 12
   Our Transport System .................................................................................................................................... 181816
   Future Scenarios and Opportunities............................................................................................................... 272725
   Strategic Planning .......................................................................................................................................... 323230
Strategic Framework ........................................................................................................................................ 353533
   Te Tauihu Strategic Objectives: ..................................................................................................................... 363634
   Headline Targets ............................................................................................................................................ 363634
Objectives and Policies ................................................................................................................................... 393937
   Objective 1: Mode Choice .............................................................................................................................. 393937
   Objective 2: Safety ......................................................................................................................................... 393937
   Objective 3: Network Management ................................................................................................................ 393937
   Objective 4: Economic Prosperity .................................................................................................................. 393937
   Objective 5: Resilience ................................................................................................................................... 404038
   OBJECTIVE 6: Environmental Outcomes ...................................................................................................... 404038
Ten Year Transport Priorities .......................................................................................................................... 404038
   Investment Logic Mapping (ILM) .................................................................................................................... 404038
   Transport Priority 1: Growth ........................................................................................................................... 424240
   Transport Priority 2: Safety ............................................................................................................................. 454543
   Transport Priority 3: Mode Choice.................................................................................................................. 474745
   Transport Priority 4: Resilience ...................................................................................................................... 505048
   Transport priority 5: Environmental Impact .................................................................................................... 525250
Programming and funding .............................................................................................................................. 545452
   Committed Activities ....................................................................................................................................... 545452
   Significant Activities ........................................................................................................................................ 555553
   Other Proposed Activities ............................................................................................................................... 585856
   Regionally significant expenditure from other funding sources ...................................................................... 595957
Ten year forecast .............................................................................................................................................. 606058
   Tasman District Council (Unitary Council) ..................................................................................................... 606058
   Department of COnservation (Tasman District) ............................................................................................. 616159
   Nelson City Council (Unitary Council) ............................................................................................................ 626260
   Marlborough District Council (Unitary Council) .............................................................................................. 646361

                                                                                                                                                                                    5
A2570814

   Department of Conservation (Marlborough District)................................................................................656462
   Waka Kotahi (State Highways)....................................................................................................................... 666563
Monitoring Indicator Framework .................................................................................................................... 676664
   Objective: Inclusive Access ............................................................................................................................ 676664
   Outcome: Healthy and Safe People ............................................................................................................... 676664
   Outcome: Environmental Sustainability ......................................................................................................... 676664
   Outcome: Resilience and Security ................................................................................................................. 676664
   Outcome: Economic Prosperity ...................................................................................................................... 686765
Appendix A – Approved Organisations ......................................................................................................... 696866
Appendix B – Significant Projects .................................................................................................................. 706967
Appendix C – Strategic Documents ............................................................................................................... 868482
Appendix D – Significance Policy................................................................................................................... 908886
Appendix E – Legislative Context................................................................................................................... 918987
Appendix F – Compliance with Section 14 of the Act .................................................................................. 939189
Appendix G – Relationship with Police Activities ......................................................................................... 949290
Appendix H – Consultation ............................................................................................................................. 959391
Appendix I – Glossary ...................................................................................................................................... 969492

                                                                                                                                                                      6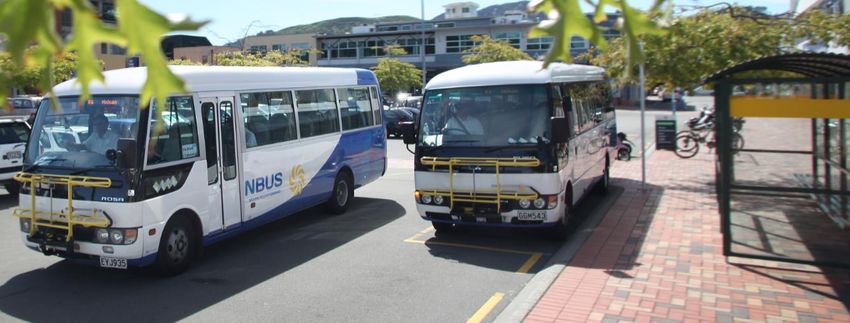
A2570814

EXECUTIVE SUMMARY

      Te Tauihu o Te Waka-a-Māui (Te Tauihu) or the “Top of the South Island’, has seen significant change over
      the last five years. The population has increased and development of the primary sector is resulting in a
      greater number of vehicles on our roads than ever before. Community values are starting to shift, which
      means that the environmental and social effects from more vehicles on the roads is becoming unacceptable.
      This conflict is realised most acutely in Picton, Blenheim, Nelson, Richmond and Motueka where the values
      of place and movement on our road networks coincide.

      The local climate allows us to produce high quality agricultural products which are sought after nationally and
      around the world. In addition, secondary processing of many of these products has enabled value to be
      added. Most of our freight is consumed locally or sent directly overseas, which means Port Nelson and Port
      Marlborough, and the transport networks connecting them with our communities, are vitally important to our
      region. The significant growth in products produced in the region means we have more heavy vehicles using
      the road network, all the way from rural roads in the hinterland to the national roads within the metro areas.

      This RLTP recognises that the transport network we have traditionally relied on may not be appropriate for
      the future. The key transport issues in Te Tauihu in the next 10 years are:

      •    vehicle usage growth and its effects on access
      •    safety on our roads
      •    the design of our transport system is constraining access for those wanting to use more sustainable
           modes
      •    our communities are susceptible to losing access in more frequent weather events
      •    vehicle usage is affecting our natural environment.
      In recent years, this growth in vehicles on our roads has been recognised by central government agencies,
      with a number of key planning projects being initiated to help determine how the transport network will cater
      for this in future. Most of the significant projects are still underway, but core outcomes and key projects have
      been reflected in this RLTP programme.

      The programme over the next 10 years envisages we will start by completing the planning projects already
      underway with Waka Kotahi and KiwiRail, while also carrying out local work to make sure these large
      projects are integrated into the local networks and that key access outcomes are met. These planning
      projects include the Inter-Island Resilient Connection Project in Picton, the Nelson Future Access Study and
      the Richmond Programme Business Case. Both central and local government are under financial strain due
      in part to Covid-19. This may have an impact on the delivery timing of some of the projects may be delayed.

      The focus of this RLTP will be on supporting economic and population growth; improving safety; improving
      travel choice and resilience. The Partners to the RLTP recognize they need to continue to work together to
      achieve these outcomes. Examples of this work include:

      •    Marlborough will continue to construct the cycling network it started in 2017 and Nelson will improve the
           cycling network it established more than 10 years ago. Tasman will start work constructing a network of
           active transport routes following the completion of its Walking and Cycling strategy in 2021.
      •    Nelson and Tasman will work cooperatively to improve and extend public transport services both within
           the Nelson/Richmond urban area, but also look further afield out to Wakefield, Motueka and rural areas
           that make up the wider economic area. Marlborough will build on the bus trials undertaken in 2020 and
           continue services linking Renwick and Picton with Blenheim.
      •    Waka Kotahi will work on making improvements to the state highway network on specific projects such
           as SH6 north of Brightwater, and also work on generic activities including regional speed management
           planning and installation of median barriers on roads. Marlborough, Nelson and Tasman will develop
           speed management plans, and make improvements in urban areas for our most vulnerable users.
      •    Waka Kotahi will continue to work on improving network resilience for communities at risk of losing
           access in storm events. They will continue to reduce the risk of landslips on Takaka Hill which cuts off

                                                                                                                         7
A2570814

           the Golden Bay community. In addition, Waka Kotahi and the Councils are making improvements to
           roads to reduce the risk of unexpected road closures, as they create significant inconvenience and cost
           to all users, and may increase public safety risk.

                                                                                                                     8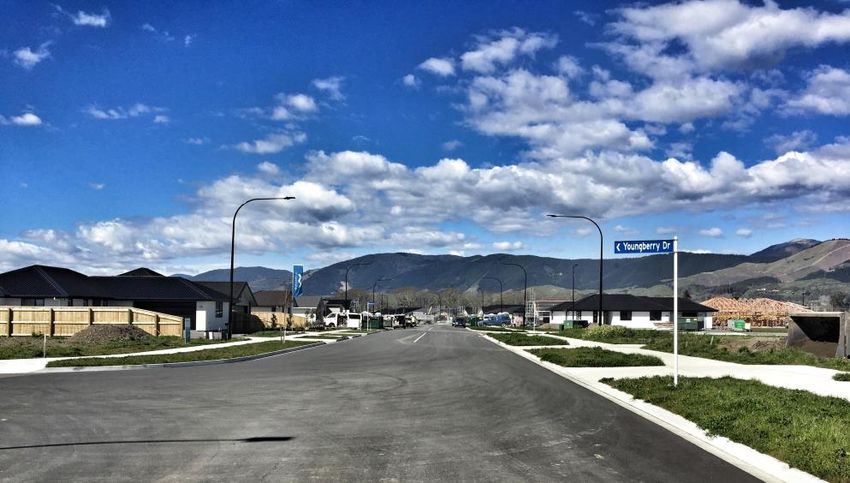
A2570814
INTRODUCTION
This Regional Land Transport Plan (RLTP) is the primary document guiding integrated land transport
planning and investment within the three unitary councils of Marlborough District Council (MDC), Nelson City
Council (NCC) and Tasman District Council (TDC). Each of the councils are required to each create a RLTP
as part of their requirements of regional council under the Land Transport Management Act 2008 (LTMA).
However, the three councils have created a joint RLTP that recognises the high interdependency and
separation from other parts of the South Island collectively known as Te Tauihu o Te Waka-a-Māui (Te
Tauihu) or the “Top of the South Island’.
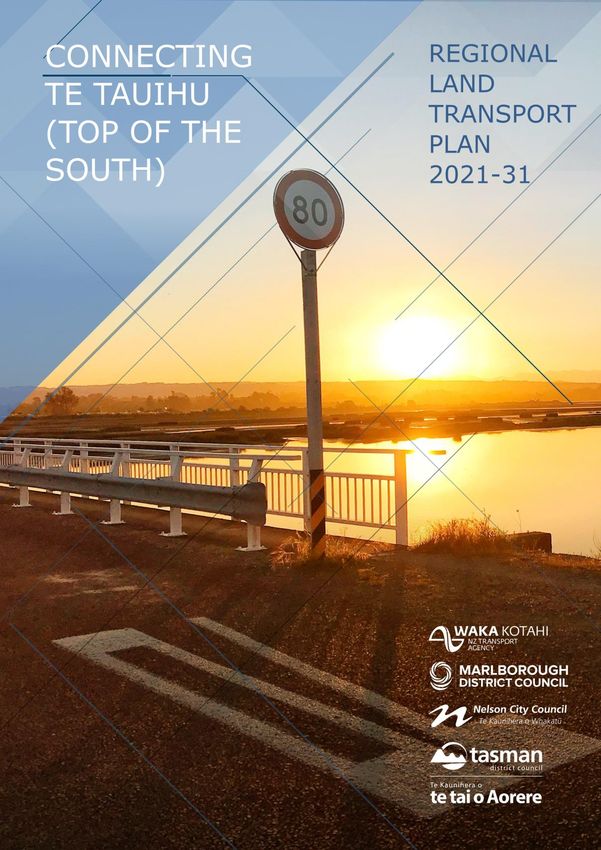
Figure 1 shows the location and extent of the Councils.
Figure 1: Location and Boundaries of Te Tauihu Councils
9
A2570814

      The relationship of the RLTP with wider transport and land use planning and the funding context is set
      out in Figure 2.

                                            Waka Kotahi
                                        Investment Proposal

Figure 2: RLTP Planning and Funding Context

      This RLTP:

      •     is owned collectively by the Regional Transport Committee (RTC) comprising Waka Kotahi NZ
            Transport Agency (Waka Kotahi) and the three Territorial Authorities in Te Tauihu (MDC, NCC, TDC),
            each of which is a unitary authority
      •     sets the strategic transport direction to guide transport activities in Long Term Plans (LTPs) and
            identifies the agreed view of regional transport priorities to inform the National Land Transport
            Programme (NLTP)
      •     sets the long term vision and strategic direction for the region’s land transport system
      •     identifies the agreed regional transport priorities for investment in the short to medium term
      •     presents the activities of approved organisations listed in Appendix A in a single coordinated 3–6 year
            programme, which is consistent with the Government Policy Statement on Land Transport (GPS), as a
            bid for funding from the National Land Transport Fund (NLTF)
      •     addresses issues that cross regional boundaries
      •     provides the basis for communication of the region’s transport direction and priorities with stakeholders
            and the general public.

                                                                                                                        10
A2570814
STRATEGIC CONTEXT
Te Tauihu is experiencing strong population and economic growth, and continues to face problems relating
to traditional reliance on motor vehicles, such as travel reliability, severance and car-oriented development.
The projected population growth of 15 percent over the next 15 years has driven a recent growth strategy
that is underpinned by intensification along with some targeted urban expansion. This, coupled with
projected economic growth, will place increasing pressure on Te Tauihu’s transport network to move
increasing numbers of people and goods. For transport to play its role in supporting growth, it will require
coordinated investment in public transport, safety and active modes to deliver a sustainable transport future.
This approach not only provides an integrated response to growth, but also supports mode shift and safety
on our transport network, recognising the economic reliance on efficient freight routes and improved network
resilience to deliver MDC’s NCC’s and TDC’s response to climate change.
The Councils have developed investment programmes with the goal of creating a sustainable, integrated
regional transport network that accommodates growth and freight and:
• provides attractive, economic and viable transport choices for all sectors of the community
• reduces reliance on motor vehicles
• is safe and affordable
• improves resilience on the overall network
• is sustainable and based on reduced carbon emissions.
Without this targeted investment the region will suffer from increasing reliance on single occupancy car trips
with increased journey times, increased severance caused by traffic volumes, increasing safety problems,
reduced freight efficiency and increased carbon emissions, with all the associated health and wellbeing
challenges this brings.
OUR REGION
MARLBOROUGH DISTRICT
Marlborough is situated in the north-east corner of the South Island, accessible by ferry, rail, air and road.
According to the 2018 census, the resident population of Marlborough District is 47,300. The main
population of Marlborough is centred in the town of Blenheim (28,260), followed by Picton (4,500). Picton is
the main portal for freight, including forestry, and tourists travelling between the North Island and the South
Island. A fifth of Marlborough District’s workforce is employed in the primary sector. Over the last decade
most of the land formerly dedicated to cropping and stone fruit has been converted into viticulture so that
Marlborough is now New Zealand’s largest grape growing region, with 70 percent of New Zealand’s total
wine production. Marlborough’s long coastline results in significant aquaculture, with Marlborough having
most of New Zealand’s mussel farms. Rail runs north/south through Marlborough, generally parallel with
SH1. Key freight hubs are located in Picton and Spring Creek, with passenger stations in Picton and
Blenheim.
NELSON CITY
Nelson is bounded by Champion Road to the south, the Bryant hill range to the east and Cape Soucis and
Tasman Bay to the northwest. According to the 2018 census, Nelson’s resident population is 50,880.
Nelson City has Te Tauihu’s main airport, port, hospital and the main campus of the Nelson Marlborough
Institute of Technology. Nelson provides services for the Tasman and Marlborough communities and has
particular strengths in marine construction, forestry, aviation and manufacturing. Like Tasman and
Marlborough, Nelson has opportunities to add value to primary products and for smaller-scale enterprises to
work together to grow and to export. The information communications technology cluster in Nelson has
continued to grow and drive change across all industries. Tourism is supported by premier food and
beverage establishments, shopping opportunities and a thriving local arts and crafts scene which sees the
city and the tourist areas swelling to capacity during the summer months.
11A2570814
TASMAN DISTRICT
The Tasman District is located in the north west of the South Island. It covers the area from the boundary of
Nelson City in the east, the West Coast in the south, the coastline in the north-west and Marlborough to the
east. According to the 2018 census, Tasman District has a resident population of 52,400. The main
population of the Tasman District is centred in Richmond which is the largest and fastest growing town in the
District with 15,300 residents. Motueka is the next largest town with 8,000 residents. Tasman District is
known for the natural beauty of its landscape. Fifty-eight percent of the Tasman District is national park –
with the Nelson Lakes. Kahurangi and Abel Tasman National Parks. There are a range of other forests and
reserves in the area, including the Mount Richmond State Forest Park and Moturoa (Rabbit Island). Tasman
District covers 14,812 square kilometres of mountains, parks, waterways, territorial sea and includes 812km
of coastline. Like Marlborough, the primary sector is the main economic driver for Tasman.
OUR PEOPLE
DEMOGRAPHICS
The two main urban areas in Te Tauihu are Nelson and Blenheim.
Census data provided by Statistics New Zealand shows that the Te Tauihu region has grown by 23 percent
since 2001, or 1.4 percent per annum. Since 2013 the population has grown by 2.0 percent per annum. The
population is growing faster than the Statistics New Zealand population forecasts undertaken in 2013, as can
be seen in Figure 3.
Figure 3: Te Tauihu Population – Actual and Forecast
The residential growth is higher around established urban settlements such as Richmond (2.8 percent),
Motueka (2.5 percent) and Picton/Waikawa (2.4 percent). Due to high house prices in key urban areas and
a desire to live in rural areas, there is also significant residential growth in townships surrounding urban
centres, such as Brightwater (3.8 percent), Mapua/Ruby Bay (4.2 percent) and adjoining rural areas such as
Moutere Hills (4.3 percent), west Witherlea (3.9 percent) Riverlands (3.0 percent) and Woodbourne (5.3
percent).
Nelson has grown to the south and merged with Richmond within the Tasman District. Residents living in
the enlarged Nelson/Richmond urban area are generally unaware of the boundary and view the whole area
as one. This is reinforced by the high levels of co-operation between NCC and TDC which includes a single
public transport service and a combined Future Development Strategy. Both Tasman and Nelson have
developed intensification strategies to encourage brownfields development close to existing centres over
new low density greenfield development away from urban centres.
12A2570814
Blenheim is growing to the south and north where there is available greenfield sites for residential
growth.
Te Tauihu is an increasingly popular place to retire, with a steady increase in the 65+ age group, which, at
21 percent, is much higher than the New Zealand average of 15 percent. This trend comes with a
corresponding decrease in the percentages of children and working age population. This emerging
demographic trend will influence the communities’ transport requirements and consequently the investment
programme over coming years. A breakdown of the age distributions is shown in Table 1.
Table 1: Te Tauihu Age Distribution
Actual Forecast
Age Range 2001 2006 2013 2018 2023 2028 2033
0 - 14 (%) 21.5% 19.5% 19.0% 17.7% 17.3% 16.4% 16.0%
15 – 64 (%) 64.3% 65.6% 62.6% 61.2% 58.2% 55.8% 53.7%
65+(%) 14.1% 14.8% 18.4% 21.0% 24.4% 27.8% 30.4%
The demographics of the region have been slowly changing over time to become more diverse, as can be
seen in the ethnic group responses within the Census data in Table 2.
Table 2: Te Tauihu Ethnic Groups
2013 2018
European 90.6% 89.1%
Māori 9.4% 10.8%
Pacific peoples 1.7% 2.3%
Asian 3.1% 4.6%
Middle Eastern/Latin American/African 0.5% 0.7%
Other ethnicity 2.3% 1.5%
Not elsewhere included 4.4% 0.0%
ECONOMIC DRIVERS Commented [MP1]: Section reviewed and changed to
better reflect Professional services, science and Tech
Economic Drivers contributuio9n locally
The Nelson, Tasman and Marlborough regional economies are interlinked and dependent on each other through
horticulture, forestry, seafood, farming, tourism and aviation. Te Tauihu includes 3.2 percent of New Zealand’s
population, and contributes to 2.7 percent of New Zealand’s GDP. Several industries in Te Tauihu are significant
contributors to the New Zealand economy, as shown in Table 3.
Table 3: Te Tauihu Proportion of New Zealand’s GDP (2020)
Te Tauihu NZ Proportion Change from
Industry 2020 GDP 2020 GDP of NZ Proportion of
($ m) ($ m) 2020 GDP 2010 GDP
Seafood Processing 175.0 496.6 35.2% + 0.2%
Fishing & Aquaculture 131.9 483.3 27.3% + 4.9%
Beverage & Tobacco Product Manufacture 584.8 2,633.4 22.2% + 1.5%
13A2570814
Horticulture & Fruit Growing 210.4 1,484.5 14.2% + 0.2%
Wood Product Manufacturing 121.4 1,744.8 7.0% + 0.8%
Agriculture Support Services & Hunting 157.5 2,301.7 6.8% – 1.3%
Forestry & Logging 93.7 2,016.2 4.6% – 0.3%
Fruit, Cereal & Other Food Product Manufacture 111.6 2,497.6 4.5% + 0.6%
Transport Equipment Manufacturing 71.8 1,679.1 4.3% – 0.2%
Supermarket & Specialised Food Retailing 172.4 4,689.7 3.7% + 0.1%
Owner-Occupied Property Operation 830.3 22,973.1 3.6% + 0.0%
Poultry, Deer & Other Livestock Farming 15.4 461.7 3.3% + 0.6%
Heavy & Civil Engineering Construction 189.7 5,807.7 3.3% – 0.3%
Accommodation & Food Services 214.6 6,770.6 3.2% – 0.5%
All other Sectors 5,568.4 267,978.6 2.1% –
Total 8,648.9 324,018.7 2.7%
Source: Compiled and computed from Infometrics Regional Data for Marlborough and Nelson-Tasman
Table 3 highlights the importance of Te Tauihi marine industries are to New Zealand, with seafood processing in
the region representing over 35% of the national GDP in that sector, and fishing & aquaculture representing over
27% of the national GDP in that sector. Most of the sectors listed show an increase from the share of New Zealand
GDP in 2010, with fishing & aquaculture leading the growth with an increase of nearly 5% of the national GDP in
that sector.
However, Table 3 is not a good representation of the economic contribution to Te Tauihi directly, with only four of
these sectors within the top 15 contributors to Te Tauihi GDP, as shown in Table 4.
Table 4: Contribution to Te Tauihu GDP (2020) – Top 15 Sectors
Te Tauihu NZ Proportion Proportion
Industry 2020 GDP 2020 GDP of Te Tauihi of NZ
($ m) ($ m) 2020 GDP 2020 GDP
Owner-Occupied Property Operation 830.3 22,973.1 9.6% 3.6%
Unallocated 676 25,317.5 7.8% 2.7%
Beverage & Tobacco Product Manufacture 584.8 2,633.4 6.8% 22.2%
14A2570814
Health Care & Social Assistance 528.3 19,180.7 6.1% 2.8%
Property Operators & Real Estate Services 500 17,392.5 5.8% 2.9%
Professional, Scientific & Tech Services 487.3 27,785.7 5.6% 1.8%
Other Store & Non Store Retailing 282.6 8,948.0 3.3% 3.2%
Construction Services 278.8 10,751.2 3.2% 2.6%
Wholesale Trade 255.9 16,293.4 3.0% 1.6%
Education & Training 227.9 12,042.7 2.6% 1.9%
Electricity & Gas Supply 224.5 7,223.7 2.6% 3.1%
Central Gov Admin, Defence & Safety 215.3 12,795.1 2.5% 1.7%
Accommodation & Food Services 214.6 6,770.6 2.5% 3.2%
Horticulture & Fruit Growing 210.4 1,484.5 2.4% 14.2%
Administrative & Support Services 193.6 6,846.4 2.2% 2.8%
Source: Compiled and computed from Infometrics Regional Data for Marlborough and Nelson-Tasman
Table 4 highlights the importance of owner-occupied property operations with nearly 10% of Te Tauihi GDP, and
also small businesses which are likely included within the ‘Unallocated’ category. Large industries with over 5%
contribution to the Te Tauihi GDP include Beverage & Tobacco Product Manufacture, Health Care & Social
Assistance, Property Operators & Real Estate Services, and Professional, Scientific & Tech Services. These top six
categories generate 41.7% of Te Tauihi GDP.
Commodities produced and manufactured within the region tends to either stay in the region or be exported via one
of the regions ports, with 83 percent of freight travelling within Te Tauihu staying in Te Tauihu. As such, having
good transport within the region and to the ports is vital to maintaining an efficient economy.
Other domestic freight within New Zealand is reliant on our regions transport network, particularly road, rail and
sea. All commodities transported between the North Island and the rest of the South Island traverses through the
region, mainly on SH1 and rail, including Weld Pass, where heavy commercial vehicles make up 17 percent of the
traffic flow, and requires realignment. The South Island Freight Study identified that 5.5 million tonnes of freight
travelled between the two islands in 2017.
TANGATA WHENUA
Te Tauihu o Te Waka-a-Māui is the prow of the demigod Māui’s canoe – the top of the South Island. Many
different iwi (tribes) are tangata whenua of these fertile, mineral-rich lands. It is anticipated and expected that Formatted: Not Highlight
engagement between iwi, Waka Kotahi , and RTC’s will be pursued as a collaborative partnership as
significant projects in this RLTP are further developed. Commented [MP2]: Inserted post NCC RTC Delibs
meeting after suggestion at meeting
Details of the nine iwi of Te Tauihu are provided below:
15A2570814
NGĀTI APA KI TE RĀ TŌ
Ngāti Apa first settled in the Marlborough Sounds region around Golden Bay and western Tasman Bay.
Whanganui Inlet on the west coast, a tidal inlet ringed with flowering rātā, is at the centre of their area. Their
rohe (tribal lands) include the areas around Golden Bay, Takaka, Tasman Bay, Motueka, Nelson and Saint
Arnaud, including Taitapu and Kawatiri river catchments and Lakes Rotoiti, Rotoroa and the Tophouse
NGĀTI KOATA
Ngāti Koata originates from the waka of Tainui that left Hawaīki and arrived in Aotearoa c.1400. Tainui was
captained by Hoturoa and was finally hauled ashore to rest between the two pillar stones of Puna and Hani
in Kāwhia. (located behind the Maketu Marae).
NGĀTI KUIA
Ngāti Kuia first settled in the Pelorus area and then spread out across the Marlborough Sounds, Nelson and
Tasman districts to Taitapu on the West Coast, and as far south as the Nelson lakes.
NGĀTI RĀRUA
Ngāti Rārua are descendants of the Polynesian explorers who arrived in Aotearoa aboard the waka (canoe)
Tainui. Ngāti Koata whakapapa back to Koata who lived near Kāwhia in the 17th century. She had two sons,
Kāwharu and Te Wehi (founder of Ngāti Te Wehi). Te Totara pa on the south shore of Kāwhia was shared
with Ngāti Toa in the early 19th century. Following the musket wars, many of the iwi moved south to Kapiti
Island and then Te Tau Ihu in the mid 1820s.
Since the arrival in Te Tau Ihu, Ngāti Rārua have maintained continuous ahi kā in Golden Bay, various
locations in the Abel Tasman National Park, Marahau, Kaiteriteri, Riwaka, Motueka, Nelson, and Wairau
NGĀTI TAMA KI TE TAU IHU
Ngāti Tama came to Te Tau Ihu o te Waka a Maui (the northern South Island) in the late 1820s and
established pā and kainga at several localities in Te Tau Ihu including Te Tai Tapu, Golden Bay, and
Wakapuaka.
NGĀTI TOA RANGATIRA
The Ngāti Toarangatira people, originally from Kāwhia, have survived changing fortunes. Led by the famous
warrior chief Te Rauparaha, they walked south in search of a safer and more prosperous life. After facing
hardships along the way, they became a rich and powerful tribe on both sides of Cook Strait (Te Moana-a-
Raukawa)
RANGITĀNE O WAIRAU
The name Wairau describes the rohe (tribal area) of Rangitāne, and is derived from the phrase ‘ngā wai-rau
o Ruatere’ (the hundred waters of Ruatere), meaning the confluence of streams, rivers, wetlands, lakes and
estuaries across the present-day Marlborough region.
TE ĀTIAWA O TE WAKA-A-MĀUI
Te Ātiawa o Te Waka-a-Māui are the people of Te tiawa descent who whakapapa to Te Tau Ihu o Te Waka-
a-Māui (the top of the South Island).
They originated from the Taranaki region, but by the 1830s were firmly based throughout the top of the
South Island. By 1840 – when Te Ātiawa o Te Waka-a-Māui signed Te Tiriti o Waitangi at Tōtaranui (Queen
Charlotte Sound) - they were a dynamic and robust society with their own lands and cultural customs that
regulated their life both on land and at sea.
NGĀI TAHU
16A2570814
Ngāti Kurī and Ngāi Tūhaitara migrated to Te Waipounamu. Maru Kaitātea established Ngāti Kurī at
Kaikōura. Tūāhuriri’s son, Tūrākautahi, placed Ngāi Tūhaitara at Kaiapoi Pā. With Kaikōura and Kaiapoi Pā
established, and through intermarriage, warfare and political alliances, Ngāi Tahu interests amalgamated
with Ngāti Māmoe and Waitaha iwi and Ngāi Tahu iwi established manawhenua or pre-eminence in the
South Island. Sub-tribes or hapū became established around distinct areas, and have become the Papatipu
Rūnanga that modern day Ngāi Tahu use to exercise tribal democracy.
TE RŪNANGA O KAIKŌURA
Te Rūnanga o Kaikōura is one of 18 Papatipu Rūnanga as identified under Te Rūnanga o Ngāi Tahu Act. Te
Rūnanga o Kaikōura is the tribal council for the hapu of Ngāti Kuri. All those that can whakapapa to Kuri can
affiliate to the Rūnanga Te Rūnanga o Kaikōura boundary is from Te Parinuiowhiti (White Cliffs South of
Blenheim) to the Hurunui River and South West of the Main Divide
17A2570814
OUR TRANSPORT SYSTEM
ROAD NETWORK
Te Tauihu includes the Marlborough, Nelson and Tasman Councils along with their transport investment
partner, Waka Kotahi. They work together to collectively maintain and deliver a land transport system that
enables economic growth, accessibility and resilience to all road users. A tabular summary of the road
classifications making up our road network is shown below.
Table 3: Regional Transportation Summary
Marlborough (km) Nelson (km) Tasman (km) Total
Road Type
SH Local SH Local SH Local (km)
National 89 - - - - - 89
Regional 86 - 61 7 34 - 188
Arterial - 15 - 11 134 13 173
Primary Collector - 85 - 51 130 107 373
Secondary Collector 84 310 - 51 33 497 975
Access - 549 - 111 - 570 1,230
Low Volume - 581 - 41 - 512 1,134
Total 259 1,540 61 272 331 1,699 4,162
A third of the roads in the region are unsealed.
Nearly two thirds of the roads within the region are classified as Access or Low Volume, yet the majority of
vehicle kilometres travelled is on our Regional and Collector roads. This can be seen n Figure 3.
Journeys Travelled (veh km) & Network % Length (km)
40% 30% 20% 10% 0% 10% 20% 30% 40%
National
Regional
Arterial
Primary Collector
Secondary Collector
Access
Low Volume
Unclassified
Urban Journeys (vkt) Rural Journeys (vkt) Urban (km) Rural (km)
Figure 3: Network Length and Journeys Travelled in Te Tauihu
Figure 4 shows that the vehicle kilometres travelled within Te Tauihu has increased from 1.19 million
kilometres travelled in 2001 to 1.70 million kilometres travelled in 2018, an increase of 43 percent. During
the same time population has increased by 23 percent, showing that the average person is travelling more.
18A2570814
1.8 7%
1.6 6%
Vehicle kilometres traveled (millions)
1.4 5%
1.2 4%
Annual change (%)
1 3%
0.8 2%
0.6 1%
0.4 0%
0.2 -1%
0 -2%
2011
2001
2002
2003
2004
2005
2006
2007
2008
2009
2010
2012
2013
2014
2015
2016
2017
2018
VKT Annual Change
Figure 4: Vehicle Kilometers Travelled in Te Tauihu
CRASH HISTORY
Figure 5 shows the number of fatal and serious injury crashes on local roads for the Territorial Authority (TA)
compared to Peer Group .
Marlborough:
19A2570814
Nelson:
Tasman:
20A2570814
Figure 5: Local Road Fatal and Serious Injury Crashes
Figure 6 is a heat map which provides a spatial indication of where fatal and serious injury crashes have
occurred between 2010 and 2020. It can be seen that many of the crashes are on state highways.
Figure 6: Te Tauihu Fatal and Serious Injury Crash Heatmap
FREIGHT ROUTES
The majority of freight moved around Te Tauihu is by road. There have been significant improvements in the
moving of freight by rail in recent years, but this tends to favour bulk commodities and those running long
distances and improvement has not impacted on Nelson or Tasman regions due to a lack of rail network.
Much of the commodities generated locally tends to have a destination or origin at Port Nelson, Port
Marlborough or Nelson Airport, predominantly using the state highway network.
21A2570814
SH1 from Picton south is a nationally significant freight route. SH6, SH60, SH63 and SH65 have
regional significance as the connection for the majority of major townships in Te Tauihu. Local roads support
the state highways as feeders. Some routes such as Main Road Stoke, the Moutere Highway and Motueka
Valley Highway also serve as significant freight routes due to their proximity to major freight destinations, or
by creating a direct route.
Forestry makes up the greatest portion of commodity carried on our road networks (by weight). Logging
trucks utilise low order unsealed roads during harvest, meaning that all three Councils work proactively with
the forestry industry to target maintenance on specific roads to coincide with harvest.
Freight volumes are expected to grow from 11.8 million tonnes in 2022 to 14.0 million tonnes in 2042, a 19
percent increase. The growth in freight movements is predicted to retain similar proportions.
RAIL NETWORK
The Main North Line runs between Picton and Christchurch. This carries freight services between the
Interislander terminal and Christchurch and the Coastal Pacific passenger train. KiwiRail operate a freight
hub at Springcreek where rail freight for the Te Tauihu is transferred from trains to trucks.
In 2019, 560,000 lane metres of freight equating to around $14b was transported on the Main North Line.
The passenger train operates daily between the last Friday of September and the last Sunday of April. The
train is timetabled to connect with Interislander ferry sailings. The Marlborough Flyer, a heritage steam train,
operates tourist trips when cruise ships are in port between Picton and Blenheim.
SEA
Te Tauihu has a long standing relationship with the sea. Te Tauihu has historically relied on the sea to
provide easy transport for goods and people in and out of the region. Consequently there is a number of
historic ports and wharves around the region that used to support his activity. As road transport created
better and more direct routes, many of the smaller wharves have fallen into disuse. Key ports that continue
to support the export in Te Tauihu are at Nelson central and Picton. Secondary ports which provide local
ndustry or recreational facilities include Tarakohe, Motueka, Mapua, Havelock and Waikawa. All port have
good road connections, with Piction also having the Main North Line rail connection.
Most port facilities are predicting continued growth with a number of projects to support this capacity. These
projects include:
• An extension at Waikawa North West marina to add 251 new berths
• Improvements at Tarakohe to provide additional commercial and recreational facilities to meet current
demand
• Upgrade of the main Wharf at Nelson as well the purchase of a new tug and crane
• New ferry berths at Picton to enable higher capacity ferries
PORT NELSON
Port Nelson occupies a sheltered corner of New Zealand, secured by a productive hinterland, topographical
isolation and the absence of a rail link. It owns a portfolio of properties within the Port area, with ongoing
demand for industrial development. The Port is heavily focussed on export of the regions primary
production, with key trades being wine, fish, fruit and forestry. Reflecting limited import demand, most import
containers are empty. While its key trades are international export. Nelson records a high level of
transhipments.
Port Nelson is the biggest fishing port in Australasia and supplies all the fuel for Te Tauihu. Forestry is also
important to the port whether it be raw logs or value-added timber products. Wine exports have grown
significantly in the last five years particularly via the road linkage to Marlborough which supports the new
Quay Connect logistics facility at Port Nelson.
22A2570814
Port Nelson hours of land transport freight receipt/dispatch of are outlined below;
• Container receival operations (truck movements) are mostly limited to 7am to 5:30pm hours weekdays;
these opening hours are extended during fruit export season;
• Logs are received 4am- midnight during week days – these come from both north and south on SH6.
• MDF from Nelson Pine is received from 5am Monday – 4:30pm Friday and every hour in between.
• Other cargoes, such as fertiliser will occasionally require truck movements around the clock (from the port
to Lower Queen St).
The hours of land transport freight receipt/dispatch operation coincide with the greatest traffic volumes and
there is a limited ability to shift truck movements to low periods of traffic at night time. Access to the port for Commented [MP3]: Updated following discussion with
freight carriers is important and congestion and unplanned closures has decreased the reliability of travel Port Nelson
time.
The growth of throughput at Port Nelson is evidenced by a growth in the proportion of heavy vehicles on SH6
Rocks Rd, from 5.8 percent in 2010 to 10.5 percent in 2019.
PORT MARLBOROUGH
Port Marlborough, located in Picton, is an important part of the town’s identity and generates significant
employment and economic activity. The port services Interislander and Bluebridge ferries, processes high
volumes of bulk commodity (mainly logs) and hosts visiting cruise ships. Port Marlborough is the second
largest marina operator in the country with a capacity for some 1,400 vessels.
Port Marlborough remains New Zealand’s most diverse Port company, spanning property, interisland ferries,
general wharves, a deep water bulk terminal, marinas and aquaculture. Notably, Port Marlborough does not
have a container terminal. The Port’s primary trade is log exports.
Five million tonnes of freight with an estimated value of $20 billion crosses Cook Straight annually. More
freight goes from north to south than south to north, reflecting the importance of the Cook Straight ferries to
the South Island economy. The Cook Straight freight task is forecast to grow by 35% over the next 20 years.
The growth of throughput at Port Marlborough is evidenced by a growth in the proportion of heavy vehicles
on SH1 from 4.6 percent in 2010 to 6.5 percent in 2019.
MARLBOROUGH SOUNDS
A number of properties within the Marlborough Sounds do not have road access and land owners use boats
and barging to access the area and to transport goods. MDC is encouraging the use of barging to get logs to
market instead of using low volume and very fragile roads.
PUBLIC TRANSPORT
Public transport (PT) within the region consists of the NBus operation in Nelson and Richmond and the
Blenheim Bus Service in Blenheim. School buses services, Total Mobility and health mobility services are
also provided. The Regional Public Transport Plans (RPTP’s) provide greater detail on the services and
funding.
The NBus service was established in 2012 and has been developed regularly since then. NBus is made up
of eight routes. Routes 1 and 2 (between Richmond and Nelson CBD) cater for 86 percent of all NBus
patronage. The shorter distance routes centred around Nelson CBD (3–7) cater for 13 percent of the
patronage, with the Nelson Stoke Loop and Nelson-Richmond Late-Late Bus making up the remainder.
The Blenheim Bus Service operates twin loops to the north and south of the main town centre, on hourly
intervals during week days. Bus trials were currently being undertaken for commuter routes in Blenheim as
well as services between Picton and Blenheim and, Renwick and Blenheim. In November 2020, the
Blenheim East Commuter trial service was cancelled due to low patronage. The other trials will continue
until at least June 2021.
23A2570814
Intercity runs long distance commercial public transport services around New Zealand, including Te
Tauihu. Prior to COVID-19, Atomic Shuttles also had a South Island network which connected Blenheim to
Picton, Nelson, Kaikoura and Christchurch. It is unknown if, or when, these services will resume. However, it
is expected that service may return when demand increases, possibly in conjunction with the resumption of
international tourism to New Zealand.
Patronage numbers on public transport services provided in Te Tauihu have generally plateaued or declined.
This could be due to a decline in the real price of petrol over recent years and relatively high fare levels and
farebox cost recovery compared to other regions.
In August 2020. NCC and TDC made improvements to the NBus service. It is still too early to know what
long term impact these changes will have, but they represent the start of a range of service and network
improvements aimed at providing customers with a better level of service.
Achieving a significant increase in the mode share of public transport is likely to be a fundamental
requirement in order to reduce the reliance on single occupany vehicles in our main urban areas, provide
sustainable modes to meet emissions targets and to accommodate the travel demands of sustained
economic and population growth. This RLTP and the associated RPTP are focused on achieving a
continual increase in public transport patronage to provide an integrated approach to accommodating travel
demand.
ACTIVE TRANSPORT
The main urban areas of Te Tauihu are all ideal locations to cycle or jog/walk as a primary form of
transportation, with significant proportions of residents living within feasible walking and cycling distances of
key destinations including shopping centres, employment nodes, schools and recreation areas.
CYCLING
Te Tauihu already has a significantly higher proportion of cyclists than the New Zealand average, with
Nelson having the highest proportion of employees travelling to work by cycle in the country, reflecting
substantial investment in cycling networks over the last 15 years.
Table 4: Proportion of Commuters Cycling
Nelson Tasman Marlborough New Zealand
Percentage Cycle to Work 6.6% 4.4% 3.6% 2.2%
Percentage Cycle to Education 11.1% 9.2% 10.7% 3.8%
Past investment programmes have built key routes in parts of Te Tauihu which forms the base structure of
an integrated network to provide for and encourage an even greater proportion of the population to cycle as
their main mode of transportation. Urban cycle facilities, including on-road and share path facilities, often do
not join up to create a cohesive network and require cyclists to use roads with no facilities to complete
journeys. Rural cycling facilities tend to be aimed at recreational cycle users, but can also double as
commuter routes.
Figure 6 shows the current cycleway network across Te Tauihu which includes Waka Kotahi planned routes.
24A2570814
Figure 6: The planned cycleway network across Te Tauihu
Figure 7 shows a closer view of the existing current cycleway in Nelson and Blenheim.
Figure 7: Cycle Network in Nelson and Blenheim
25A2570814
WALKING
Most urban areas have pedestrian footpaths along both sides of a road. Footpaths in central business
districts tend to be of a higher standard than in residential areas. Rural areas generally do not have any
walking facilities and pedestrians have to share the road, often in high speed environments. Intersections
and driveways can make walking challenging for vulnerable users.
Table 5: Proportion of Commuters Walking or Jogging
Nelson Tasman Marlborough New Zealand
Percentage Walk/Jog to Work 7.7% 6.3% 7.3% 5.9%
Percentage Walk/Jog to Education 26.5% 20.2% 17.1% 21.7%
AVIATION
Aviation makes a considerable contribution to the Te Tauihu’s economy, with Nelson Airport being the fourth
busiest airport in New Zealand and the busiest regional airport in the country. A review of demand at Nelson Formatted: Not Highlight
airport reveals passenger cumulative annual growth rate running at a rate of 4.6% (2000-2029) and for the
last 10 years 6.14% (2009-2019) The 2040 Nelson Airport Masterplan forecasts passenger volumes to grow
to 1.5 million by 2040 as a central scenario, with potential for up to 1.8 million passenger movements by
2040 in a high case scenario. Commented [MP4]: Updated projections based on
submission from Nelson Airport
Marlborough Airport Limited has a license to operate an airfield owned by the New Zealand Defence Force. Formatted: Not Highlight
Nelson airport and Marlborough Airport are both served by SH6 and the adjoining local road network, which
are identified as key journey routes. Marlborough has also established itself as a centre for vintage aircraft
restoration, with activity centred around the Omaka Aerodrome.
Motueka also has an airport with a flight school and popular tourist activities.
The aviation industry supports the economic wellbeing of the region, and the transport routes to/from these
airports are important connections.
26A2570814
FUTURE SCENARIOS AND OPPORTUNITIES
RESIDENTIAL GROWTH
Te Tauihu’s satellite towns are growing faster than the developed urban settlements. Residents of these
areas however are reliant on the urban towns for employment, shopping and education. This results in
increased travel on our roads to transport people to their destinations, with traffic volumes increasing faster
than population growth.
FUTURE SCENARIO - NELSON/TASMAN
The Nelson-Tasman Future Development Strategy (FDS) supports intensification of current urban
settlements, especially Nelson, Stoke, Richmond and Motueka. However, this is unlikely to provide sufficient
housing capacity or housing choices. Therefore, some greenfield development will also be needed, while
minimising the use of high quality rural land wherever possible.
FDS shows that there will be a shortfall of up to 12,000 houses in the combined Nelson Tasman area by
2048. Of the extra houses at least 8,000 will be within the combined urban, predominately through
intensification and up to 6,000 will be within the Tasman District outside of the Nelson urban area,
predominately through greenfield development.
At least 60 percent of future housing growth in the Nelson urban area will be accommodated by
intensification. This may involve two- or three-storey townhouses and terraced housing. Apartments are
also provided for in and around Nelson City Centre. This level of intensification is a change from past
patterns of growth. Intensification will be concentrated around Nelson City Centre, Nelson South,
Tahunanui, Stoke and Richmond. Depending on further investigations into how to adapt to sea level rise,
capacity for around 1,300 additional houses is possible in the Nelson City area. Mixed use development is
also possible in the intensification areas in the Nelson Urban Area. Some expansion of the Nelson urban
area could be provided for in Kaka Valley, Saxton and Richmond South areas. Irrespective of the areas
indicated above, Nelson has limited land supply, which mean the majority of greenfields development will be
taken up in Richmond or beyond.
A mix of intensification and expansion is also provided for in and around Wakefield. Brightwater, and
Motueka. New housing areas in Mapua. Tapawera. Murchison. Takaka and Collingwood are also
identified. A range of new rural residential areas are identified in Tasman.
How and where the Nelson urban areas grow will have an impact on the transport network.
FUTURE SCENARIO - MARLBOROUGH
The Growing Marlborough Strategy plans for growth in the population to 54,000 residents by 2031. Of this
growth. 74 percent will be centred in Blenheim which will be catered for mostly by expansion to the north-
west but also some infill and intensification.
Picton and Waikawa growth (390 new residents) will be catered for through intensification and infill only.
All other townships are expecting less than 150 new residents. This growth will predominantly be catered for
through already zoned land.
27You can also read