Blue Plan Papers 7 MARITIME TRANSPORT OF GOODS IN THE MEDITERRANEAN: OUTLOOK 2025 - Plan-bleu
←
→
Page content transcription
If your browser does not render page correctly, please read the page content below
Blue Plan Papers 7

     MARITIME TRANSPORT OF GOODS IN THE MEDITERRANEAN:
                                          OUTLOOK 2025

                                           Philippe Vallouis

PLAN BLEU
UNEP/MAP Regional Activity Centre          Mai 2010
Blue Plan Papers 7

     MARITIME TRANSPORT OF GOODS IN THE MEDITERRANEAN:
                                          OUTLOOK 2025

PLAN BLEU
UNEP/MAP Regional Activity Center          May 2010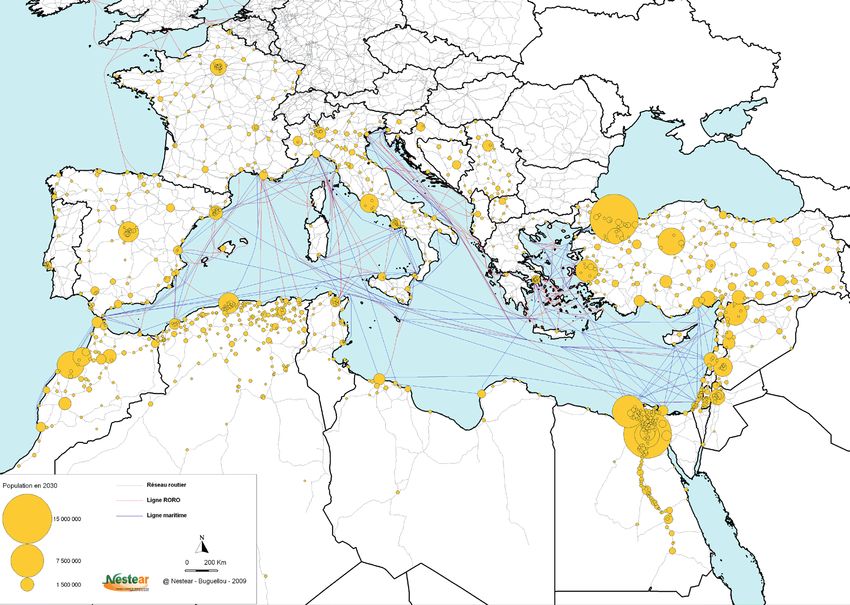
Cover design: Plan Bleu
Layout: Plan Bleu

Legal Notice
The designations employed and the presentation of the material in this document do not imply the expression of any opinion
whatsoever on the part of Plan Bleu concerning the legal status of any State, Territory, city or area, or of its authorities, or
concerning the delimitations of their frontiers or boundaries.

Copyright
This publication may be reproduced in whole or in part in any form for educational or non-profit purposes without special
permission from the copyright holder, provided acknowledgement of the source is made. Plan Bleu would appreciate receiving
a copy of any publication that uses his publication as a source. This publication cannot be used for resale or for any other
commercial purpose whatsoever without permission in writing for Plan Bleu.

For bibliographic purposes this volume may be cited as:
Plan Bleu : Maritime Transport of Goods in the Mediterranean. Plan Bleu, Valbonne, 2010 (Blue Plan Papers 7).

ISBN : 978-2-912081-27-7
Also available in French under the title:
Les transports maritimes de marchandises en Méditerranée : perspectives 2025

Printed on NEXPRESS SE 3600 digital printing press by IPB Office Solutions
Paper CyclusPrint 130 andt 250

© 2010 Plan Bleu

Plan Bleu
UNEP/MAP Regional Activity Centre
15, rue Beethoven, Sophia Antipolis
06560 Valbonne
France
www.planbleu.org
Maritime Transport of Goods in the Mediterranean: Outlook 2025

Contents

Acknowledgements____________________________________________________ 5

Synopsis_ ____________________________________________________________ 7
     Situation of maritime transport in the Mediterranean basin___________________ 7
     Plan Bleu Outlook 2025_________________________________________________ 7
     Lessons learnt_________________________________________________________ 8

Preamble____________________________________________________________ 9

Diagnostic review_ ___________________________________________________ 11
     Exchanges___________________________________________________________                          11
     Predominance of maritime transport_____________________________________                       13
     Other transport modes_ _______________________________________________                        19
     Main conclusions______________________________________________________                        20

Outlook of maritime transport of goods__________________________________ 21
     Scenario S1__________________________________________________________                         24
     Scenario S2__________________________________________________________                         27
     Scenario S3__________________________________________________________                         30
     Synthesis of the results of the non-bulk transport scenarios and port
     supply prospects______________________________________________________                        33

Lessons learnt_ ______________________________________________________ 37
     Upstream of the transport sector________________________________________ 37
     At the level of the transport sector _____________________________________ 37

References __________________________________________________________ 39

Annexes_ ___________________________________________________________ 40
     Annexe1: Statistical annex _____________________________________________                      41
     Annex 2: Socio-economic hypotheses_ ___________________________________                       45
     Annex 3: Non-bulk transport simulation method + Estimate of exchanges
     matrices in tonnage___________________________________________________                        47
     Annex 4: The Regional Transport Action Plan for the Mediterranean
     (RTAP) and other regional undertakings __________________________________                     50
     Annex 5: The Exclusive Economic Zones : A frame for a transit fee
     in the Mediterranean?_________________________________________________                        56

Abbreviations and Definitions___________________________________________ 58

Table of illustrations__________________________________________________ 59

                                                                   BLUE PLAN PAPERS 7 - MAY 2010   3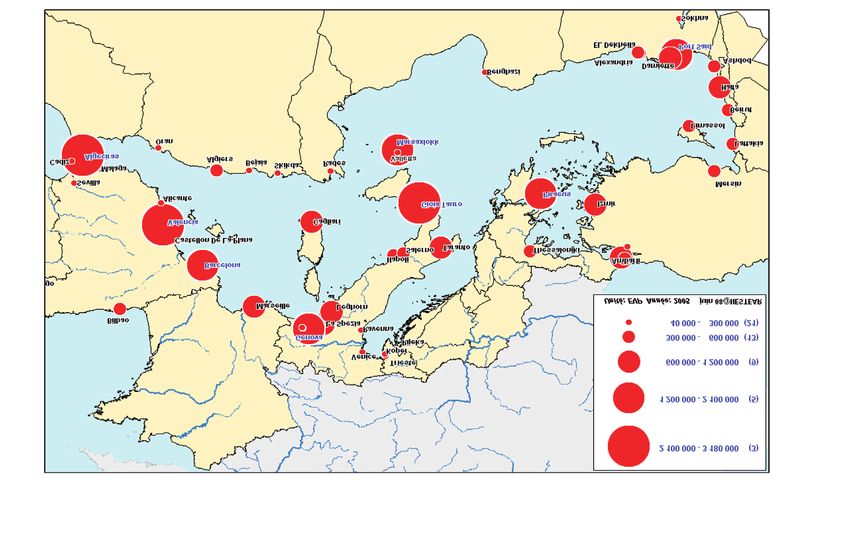
Maritime Transport of Goods in the Mediterranean: Outlook 2025

Acknowledgements
Report realised under the direction of Henri-Luc Thibault, director of Plan Bleu and coordinated by Pierre Icard,
head of the thematic unit of Plan Bleu.

Author
Philippe Vallouis, with the contribution of NESTEAR for the modelling part (Christian Reynaud, Martine Poincelet).

Supervisory committee
Arthur Germond (AFD), Pierre Icard (Plan Bleu), Mihoub Mezouaghi (AFD), Brigitte Ulmann (Plan Bleu).

Experts who contributed and provided valuable comments
El Habib El Andaloussi, Arthur Germond, Jean-Pierre Giraud, Pierre Icard, Mihoub Mezouaghi, Cécile Roddier
Quéfélec.

Experts who participated in the workshop on scenarios definition
Algeria : Yayia Nazef, ancien Secrétaire Général Ministère des Transports
Lebanon: Rami Semaan, consultant SITRAM
Tunisia : Abdefettah Ammous, Université de Sfax
Hassen Abid, Directeur Général du bureau d’études « ETIC », Riadh HAMZAH doctorant
Turkey : Yücel Candemir et Haluk Gercek, chercheurs et consultants, Université technique d’Istanbul
Morocco : Michel Titecat, expert transport, directeur de la stratégie de TMSA, (Agence Spéciale Tanger
Méditerranée)
Greece : Dimitrios Tsamboulas, Professeur, Technical University of Athens
AFD : Nicolas Serrie, Arthur Germond
Nestear : Christian Reynaud, Martine Poincelet, Zheng Chen
Plan Bleu : Pierre Icard, Gerard Olivero, Philippe Vallouis

Production team
Statistics annex: Jean-Pierre Giraud.
Cartography: Nestear, Jean-Pierre Giraud et Benoit Briquetti.
Bibliography and documentation: Hélène Rousseaux.
Editing and page layout: Isabelle Jöhr.
Proofreading: Sandra Dulbecco, Isabelle Jöhr

Translation ensured by: Mohamed Mansouri

               L’Agence Française de Développement supported the realisation of this report.

               The analysis and conclusions of this report do not necessarily reflect the opinion of the Agence
               Française de Developement.

                                                                                 BLUE PLAN PAPERS 7 - MAY 2010   5
Maritime Transport of Goods in the Mediterranean: Outlook 2025
Synopsis while the SEMCs account for a modest 8 % of the
EU foreign trade. Trade with the EU is conducted
mainly in maritime mode (75%), as well as via fixed
Situation of maritime transport connections (20 %) consisting of gas pipelines. The
in the Mediterranean basin remaining 5 % are conducted via land and air routes.
The Mediterranean thus emerges as being
The Mediterranean offers a route for exchanges of characterised by an intense transit transport and a low
manufactured products between Europe and Asia, as integration level, particularly with regard to South-
well as for the supply of Europe with energy products South exchanges.
from the Gulf countries. Around 24% of the goods
tonnage consists of energy products, with non-bulk Plan Bleu Outlook 2025
goods accounting for 36% of the total.
The outlook relates to non-bulk transport of goods
The maritime transport capacity deployed in the
which has reported the highest growth over the past
Mediterranean rose by over 50% between 1997 and
ten years. This prospective study takes into account
2006. Annual oil transport growth stood at 6%; the
economic growth, price of energy and CO2 and the
growth rate ranges between 7 and 8% for Liquefied
various transport policies integrating infrastructures,
Natural Gas (LNG) transport, 10% for container
use of equipments, commercialisation and regulation.
traffic, and 5% for Ro-Ro. The high growth rate of
container traffic is due to the development of trade The prospective exercise involves the analysis of
with Asia. three scenarios and their comparison with the baseline
situation of 2005:
In order to meet the growth of long-distance ●● Scenario (S1) corresponds to a low economic
exchanges, ship-size has increased significantly, growth situation (1.5% in the North and 3% in the
thus leading the countries to equip themselves with South) with an oil barrel at 50$ and a transport
commensurate port infrastructures. Container ship policy limited to a few public investments in roads
traffic increased by 71% and average ship-size and a private sector-driven port modernisation.
increased by 55% between 1997 and 2006. The road transport sector remains poorly
organised, little concentrated and marked by
“Non-bulk” traffic originating in Asia and bound for
intense competition.
European countries is preferentially unloaded in the
●● Scenario (S2) corresponds to a trend situation
ports of the northern range1. The same applies to the
of the pre-2008/2009 crisis, with a more steady
exchanges of the Southern and Eastern Mediterranean economic growth (1.8% in the North and 4 %
Countries (SEMCs) with Europe, for which Hamburg in the South) and a oil barrel at 100$ (value of
is the chief exchange and transhipment port. The 2005). Transport-related measures help achieve
performance of Mediterranean ports remains too economies of scale thanks to a massification
insufficient to compete with northern European of the handling of goods. Investments relate to
ports. Few Mediterranean ports are capable of improvement of road connections with ports and
accommodating the larger container ships, of which logistic platforms. The logistic chain takes on a
Port Saïd, Tanger Med, Algesiras, Marsarxlokk professional character with the coming on board
(Malta) and Gioia Tauro (Italy). They are dedicated of leading international players.
to transhipment activities. ●● Scenario (S3) rests on a more dynamic growth
(2.1% in the North and 5 % in the South) granting
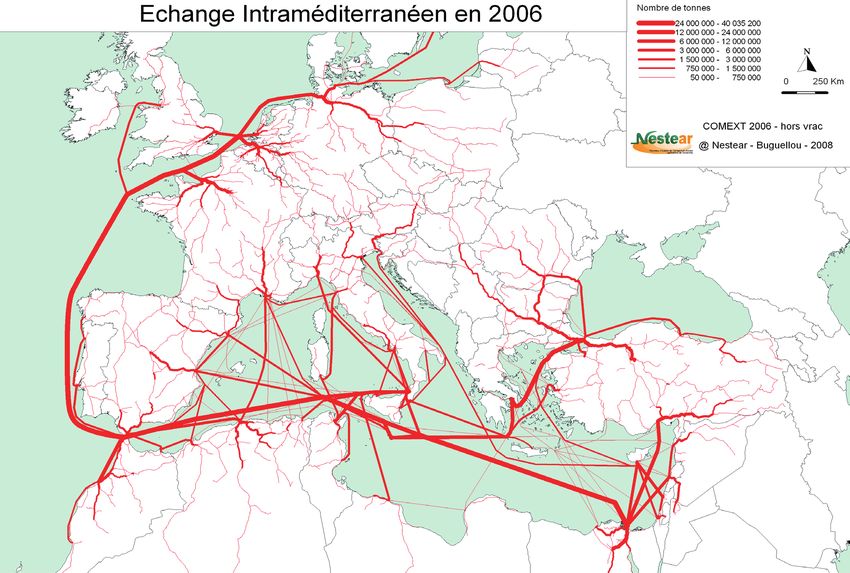
Inter-Mediterranean flows, all goods considered, the actors room for engaging significant port
hardly account for a quarter of the traffic volume. The investments. Public players may take proactive
level of exchanges is low, and the flows operate along actions, in terms of development of railway
a North-South route, with a dominant South-to-North transport (connection to ports, logistic platform,
direction, connected with oil and gas exports. institutional reform). Leading groups hold control
This asymmetry between North and South is also over logistic chains. Several “motorways of the
true for foreign trade: the EU accounts, according sea” begin to emerge. The oil barrel stands at 150$
and the price of a ton of CO2 is 100€.
to the countries, for 20 to 70% of the SEMCs trade,
1 Ports located in the North of Europe from Le Havre to In the three scenarios considered, Asia remains by far
Hambourg the major trade partner and, hence, the main source of
BLUE PLAN PAPERS 7 - MAY 2010 7
Maritime Transport of Goods in the Mediterranean: Outlook 2025

non-bulk transport. Even in the case of scenario three       ●● The marked predominance of maritime traffic with
(S3)—which rests on the hypothesis of significant               Asia will not experience any significant change,
port investments—intra-Mediterranean exchanges                  unless the policy of large-scale port infrastructures
remain quite low, as compared with exchanges with               comes to be revised;
Asia, and do not alter the status of the Mediterranean       ●● Transport-related measures promoting the railway
as “transit sea”.                                               mode will help ease the congestion of the road
                                                                network in the event of an economic recovery,
This scenario (S3) reveals, however, that a good                sustained in this by the high costs of energy and
connection of the ports with the railway network                CO2;
helps multiply railway traffic by 5.5 and road traffic       ●● The rise in energy and CO2 costs would check the
by 2.1. This capture of road traffic—made possible              increase in energy consumption without affecting,
by proactive policies, and prompted by high oil and             however, maritime traffic.
CO2 prices—mitigates the saturation of port cities
                                                             The conditions of a contribution by transport to
and facilitates the transit of goods.
                                                             Mediterranean integration are to be sought in
On the other hand, maritime transport is hardly              strengthening proximity exchanges in order to
impacted by fuel or carbon prices since it is possible       facilitate the complementarity of the Mediterranean
to keep control over operation costs thanks to ship          productive system, as well as in revising the trend
size, ship speed reduction and the professionalisation       towards gigantism. In matter of public policy in the
of the logistic chains that facilitate access to the Asian   transport sector, the course of action would be:
production system.                                           ●● to sustain the development of North-South relations
                                                                 in the form of regular and rapid connections. A
The increase in trade and, especially, the increase in           densification of the network of ports should allow
the size of ships, lead the governments to envision              for a better distribution of intra-Mediterranean
scale-ups and construction of deep water ports.                  flows, made more competitive and safer than
The identified projects before the 2008/2009 crisis              those with Asia;
amount to an increase by a factor of 2.2 over ten years      ●● to seek efficiency of Mediterranean ports, rather
in matter of container handling supply. The trend                than pursue gigantism. The development of
scenario (S2)—founded on comparable underlying                   logistic platforms connected to the railway would
hypotheses—predicts the same increase by a factor of             reduce space consumption and road congestion;
2.2, but over a twenty-year time period. The supply          ●● to choose one or two entry ports in southern Europe
dynamics seems, therefore, to be twice as rapid as               among the existing ports. The Mediterranean does
that of demand. Besides, the size of the infrastructures         not really offer a southern entry to the densily
envisioned impedes—by reinforcing gigantism—                     populated and economic hardland represented by
intra-Mediterranean connections and excludes local               the “blue banana”;
operators from port management.                              ●● to consolidate land transport environmental
                                                                 standards at national level, in order to reduce
Therefore, there is a great risk to witness a port over-         local pollution and energy consumption. An
capacity on regional level. What is more, this over-             improvement of ship consumption would be
capacity risk may give rise to a risk of transport               possible, providing that fuel subsidies may be
dumping. By causing an even stronger cut-down in                 removed and a carbon tax introduced.
infrastructures and equipments user fees, competition        ●● to devise financial tools likely to enhance services
will make their amortisation even more difficult and             (waste …) and controls. A “transit fee” could
the internalisation of transport external costs rather           be applied within the framework of Exclusive
uncertain.                                                       Economy Zones currently emerging in certain
                                                                 countries
Lessons learnt                                               All the measures outlined above may fit within
                                                             the framework of a Mediterranean transport plan.
The prospective study conducted by Plan Bleu                 Current discussion on the integrated maritime policy
reveals that pursuing the current transport policies, be     in the Mediterranean, by the European Commission,
it in matter of infrastructures or of interconnections,      could build on such recommendations. The Union
would establish the Mediterranean in its “transit sea”       for the Mediterranean (UpM) could serve as a
status. Three major conclusions may be derived from          driver of the support mechanisms necessary for their
this prospective exercise:                                   implementation.

  8      BLUE PLAN PAPERS 7 - MAY 2010
Maritime Transport of Goods in the Mediterranean: Outlook 2025
Preamble
The Mediterranean is a traditional exchange hub not only between riparian countries, but also between the geopolitical
spaces in which they belong: mainly Europe, Maghreb and Mashreq, and the rest of the world. These exchanges are
steadily on the increase and, under the combine effect of demographic pressure, economic growth and opening up
of markets, they have intensified over recent years, driven in particular by an increase in the flows of goods between
Europe and Asia. This growth is not free from risks for the environment, and it entails investment strategies—of a
port character, in particular—whose scope must be properly gauged.
In this context marked by the emergence of initiatives aimed at boosting Mediterranean integration, of which the
Union for the Mediterranean (UfM), there clearly arises the issue of the role of transport—notably, the maritime
mode—not only as a regional integration factor, but also as a sustainable development driver. The riparian countries
are already aware of it, since in the Mediterranean Strategy for Sustainable Development (MSSD), adopted in
2005, they state in the chapter dedicated to transport that “the intensification of exchanges over increasingly longer
distances is not sustainable in the long term.”
The purpose of this study is to contribute in the debate over this transport issue, by offering a diagnostic review of the
situation and proposing—based on several scenarios—a prospective vision for the time frame 2025 of international
transport flows in the Mediterranean.
The reflection is focused mainly on maritime flows of goods which constitute the overriding challenge in matter of
international transport and have a strong impact on the environment in the Mediterranean. A first part, dedicated to
a “diagnostic review”, seeks to highlight the nature and scope of goods flows in the Mediterranean and serves as
a foundation for a second part, specifically dedicated to non-bulk goods transport which is now at the heart of the
concerns of public authorities and professionals alike. Three scenarios are considered whose hypotheses have been
identified in consultation with Mediterranean experts during a regional workshop. A third part is dedicated to the
conclusions derived from the said scenarios.
BLUE PLAN PAPERS 7 - MAY 2010 9Maritime Transport of Goods in the Mediterranean: Outlook 2025 10 BLUE PLAN PAPERS 7 - MAY 2010
Maritime Transport of Goods in the Mediterranean: Outlook 2025

Diagnostic review
Being a transit route of world trade—passing through the Suez Canal, Gibraltar and the Bosporus—the Mediterranean
is one of the regions where maritime traffic is the most intense. It is especially characterised by its being not only a
load/ unload zone, but also by its being a trans-shipment and transit area. It receives all types of goods, though with
a predominance of energy and non-bulk products which account, respectively, for 24% and 36% of the volumes
transported.
The diverse nature of the goods implies a variety of types of packaging and maritime transport whose evolutions
must be characterised in order to appreciate and, above all, enlighten the investment strategies ensuing therefrom.
Thus, the transport of energy products accounts for a significant portion of the traffic. Its evolution is driven by
demand and governed by well established energy sources. Container traffic, however, depends on production sites
which may evolve more rapidly, as well as on the port capacity of recipient countries. These aspects are addressed
in more detail further down.

Exchanges                                                               EU exchanges with Mediterranean countries (SEMCs
                                                                        and Balkans), though on the increase, accounted in
In 2008, the E.U exchanged around €1000 billion                         2008 for a mere 11% of its imports and 13% of its
worth with Asia, of which 613 billion for imports                       exports, that is, €340 billion.
from, and 368 billion for exports to, Asia. Asia                        SEMCs imports originate, for the major part, in Europe,
accounted for 40% of extra-European imports and for                     though their relative share is losing to Asia which is
30% of exports, which earned it, henceforth, the rank                   steadily on the increase. Inter-SEMCs imports remain
of chief EU trade partner in terms of value.                            quite low and have hardly increased since 2003.
It was also in 2008 that Asia outranked the USA with                    SEMCs-related trends are derived from the
regard to the sale of EU production.                                    COMTRADE base and are complete only until 2006.

Figure 1           EU imports/exports, 1999-2008 (billions €)
                                EU27 imports                                                 EU27 exports
 700                                                                      700

                      Africa
 600                  America                                             600
                      Asia
                      CIS
 500                                                                      500
                      SEMC + Balkans

 400                                                                      400

 300                                                                      300

 200                                                                      200

 100                                                                      100

   0                                                                        0
    1999 2000 2001 2002 2003 2004 2005 2006 2007 2008                        1999 2000 2001 2002 2003 2004 2005 2006 2007 2008
Source: Eurostat

                                                                                             BLUE PLAN PAPERS 7 - MAY 2010   11
Maritime Transport of Goods in the Mediterranean: Outlook 2025
Figure 2 SEMCs imports / exports, 2003-2006 (billions $)
SEMCs imports SEMCs exports
140 140
Africa America
Asia CIS
120 Europe SEMC 120
100 100
80 80
60 60
40 40
20 20
0 0
2003 2004 2005 2006 2003 2004 2005 2006
Source: Comtrade
SEMCs exports to Europe are balanced, in value, to Exports to Asia rank in third position and are much
imports (Figure 2). lower than imports. As is the case in their exchanges
with Europe, a notable exchanges misbalance exists
The USA represents the second exportation zone for with Asia, which translates into asymmetric ship
the SEMCs, exceeding imports in value, this being loads, the ships being more loaded in an Asia-to-
partly due to energy products. Mediterranean direction.
Figure 3 Share of EU-SEMCs Imports / Exports, 2000-2008 (millions €)
SEMCs imports from EU-27 SEMCs exports to EU-27
100% 100%
Algeria Turkey
Morocco Egypt
90% 90%
Israel Tunisia
Palestinian Lebanon
80% 80%
territories Syria
70% 70%
60% 60%
50% 50%
40% 40%
30% 30%
20% 20%
10% 10%
0% 0%
2000 2001 2002 2003 2004 2005 2006 2007 2008 2000 2001 2002 2003 2004 2005 2006 2007 2008
Source : Eurostat
12 BLUE PLAN PAPERS 7 - MAY 2010Maritime Transport of Goods in the Mediterranean: Outlook 2025
Figure 4 SEMCs-SEMCs imports / exports, 2003-2007 ( millions $)
Imports from SEMCs Exports to SEMCs
7000 7000
6000 6000
5000 5000
Algérie
Maroc
4000 Israël 4000
Turquie
Egypte
3000 Tunisie 3000
Liban
2000 2000
1000 1000
0 0
2003 2004 2005 2006 2007 2003 2004 2005 2006 2007
Source: Comtrade
The analysis of the evolution of SEMCs-EU Figure 5 Modal split of goods transport in the Medi-
exchanges reveals that the share of SEMCs imports terranean between EU25 and Mediterranean
shrank by at least 5% between 2000 and 2007. This countries (2004)
decrease is even more marked for Syria and Turkey.
Other
(Figure 3) 5%
The share of exports to E.U remains hardly stable, Permanent
installations
reporting a notable decrease for Algeria, Syria and 20%
Turkey.
Maritime
Inter-SEMCs exchanges, according to available data, 75%
reveal that Turkey is in the lead and reports significant
growth, while the other countries report much lower
volumes and more slack growth rates. (Figure 4)
Turkey and Algeria are the main exporters in SEMCs Source: Euromed Transport
zone. Here again, Turkey is the country most
involved in Mediterranean exchanges. Algeria is the Maritime transport reported, between 1997 and 2006, a
supplier in energy products of several countries of the significant growth, with a deployed transport capacity
Mediterranean basin. that had increased by over 50%. This rise is due to an
increase in ship traffic frequency, by around 15 %, but
also, and above all, to an increase in ship size, reporting a
Predominance of maritime
30% growth (source: Lloyd’s MIU). The size of ships in
transport transit has increased to the same proportion and remains
three times larger than the size of the ships loading or
Exchanges with the EU are mainly conducted in unloading at a Mediterranean port (15 109 DWT2 /ship
maritime mode (75%) and via fixed connections for Mediterranean ports, as against 50 174 DWT/ship
which consist of three gas-pipelines connecting for transit).
Morocco to Spain, Tunisia to Italy for the exportation
of Algerian gas, and Libya to Italy. The remaining 5% 2 The Dead Weight Tonnage is the total weight that a ship
are conducted mainly by land and air routes. can carry while maintaining its water level: 1 DWT= 1000 kg
BLUE PLAN PAPERS 7 - MAY 2010 13Maritime Transport of Goods in the Mediterranean: Outlook 2025
The type of goods determines the transport equipment gives the volumes, the share of transported goods by
and port services. It differentiates between : type of packaging and their annual evolution over the
●● Liquid bulk, comprising oil, gas and chemical period 1997 - 2006.
products carried in tankers;
●● Dry bulk, comprising—inter alia—grain, cereal Liquid bulk
and coal products, transported in bulk carrier ship;
●● Non-bulk goods, carried either in containers Liquid bulk is composed of energy products, oil and
loaded on container ships, or on trucks embarked gas (24%), and—to a lesser extent—chemical products
(either as two-piece or trailer only) on Ro-Ro. (7%).
Oil transport, a significant component of maritime
Table 1 Breakdown of maritime transport supply in
the Mediterranean, 1997-2006 transport in the Mediterranean, deploys the larger ships
(125 000 DWT, on average). Their size has increased
Transport Growth
activity rate/year by 26% within 10 years. Port traffic rose by 6%/year
(million % 1997 to between 1996 and 2006. Oil originates in North Africa,
DWT) 2006 the Persian Gulf and the Black Sea, and is conveyed
Liquid non-bulk (oil + gas – 1328 31% 7% to Europe (northern and southern) and the USA. Oil
chemical products)
exports from the Persian Gulf transit via the Suez Canal
Dry non-bulk (bulk carrier/ cargo) 1148 27% 3% or via the port of Sidi Kerir in Egypt which receives the
Non-bulk 1568 36% 8% SUMED oil pipeline from the Red Sea. Flows from the
Container ship 1131 26% 10% Black Sea come, for the major part, from Novorossiysk
Ro-Ro+Passengers 437 10% 5% (Russia) via the Bosporus.
Other 264 6% -6%
In 2006, around 493 million tons of oil products
Total 4308 100% 5%
transited across the Mediterranean out of a global total
Source: Plan Bleu, based on data of REMPEC/Lloyd's MIU
of 2600 Mt, that is, around 20%.
Table 1 gives the breakdown of the transport activity North Africa remains the largest exporter to Europe.
in DWT. That is the ratio of the number of ships (on Since 2003 and the conflict in Iraq, the Eastern
call or in transit) over the average ship capacity. It Mediterranean reported a dwindling of its exports
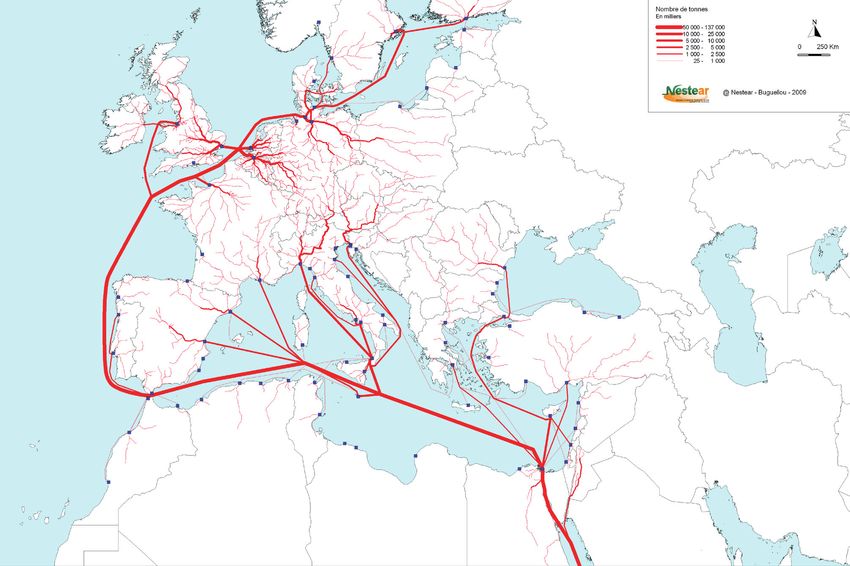
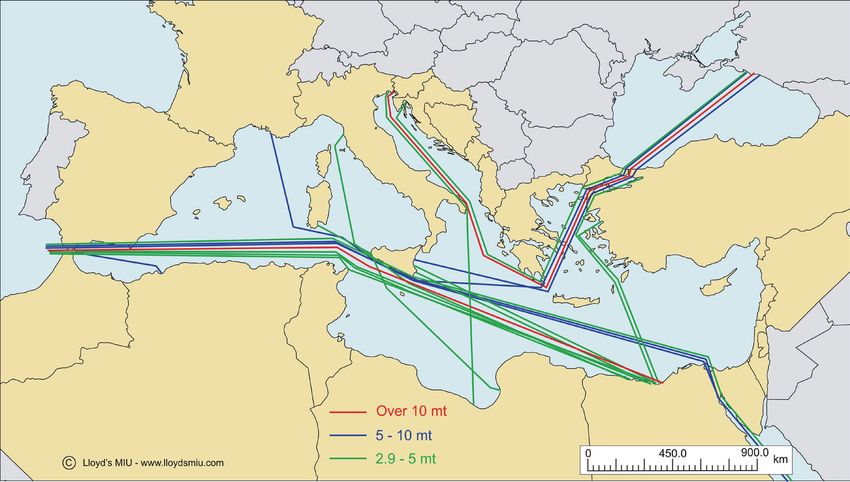
Map 1 Oil flows in the Mediterranean, 2006 (millions tons)
Source: IEA, BP, Mediterranean Energy Observatory (/MEOOME)
14 BLUE PLAN PAPERS 7 - MAY 2010Maritime Transport of Goods in the Mediterranean: Outlook 2025
Map 2 Crude oil traffic in major Mediterranean ports - 2006
Source : Lloyd’s MIU (data 2006)
from 57 Mt to 12 Mt in 2006. The latter are now Gas crosses the Mediterranean also via the Maghreb –
picking up, with the opening of the BTC3 oil pipeline Europe gas pipeline which extends from Algeria (via
which delivers oil from Azerbaijan at Ceyhan Morocco) to Spain, via the Transmed gas pipeline
(Turkey). The East Mediterranean is likely to report which extends from Algeria to Italy (via Tunisia) and
a considerable increase of its traffic over the coming via the Greenstream gas pipeline connecting Libya to
Italy.
years. Oil tanker routes are concentrated along well
established and regular lines originating in the Red
Dry bulk
Sea and crossing, over the larger portion of the routes,
the Mediterranean Sea. Map 2 presents the large Dry bulk has reported a moderate increase (3%/ year)
capacity port-to-port routes (over 2.9 Mt). over the 1997 – 2006 period. Indeed, this is dedicated
transport (minerals, cereals …) which increases at
Liquefied Natural Gas (LNG), carried by methane a slower pace than the other goods segments. The
tankers represents a lower volume than that of northern Adriatic ports (Venice, Ravenna, and Koper
oil, though with a high growth prospects due to an in Slovenia) are the natural entry ports to Eastern
increase in demand, a decrease in north European Europe and Central Europe, but the lack of land
gas production, the coming on stream of new fields infrastructures has hampered the extension of the
in the Gulf and the construction of super-size gas latter ports in favour of the ports of the Northern
liquefaction plants in Qatar. Europe. This situation is likely to change with the
Trans – European Transport Network (TEN-T)
Over the past ten years, LNG has reported an increase project since this zone lies at the crossroads between
by 7 to 8%/year. In 2007, the LNG volumes transiting the corridors connecting Lisbon and Kiev and the new
across the Mediterranean were around 100 million Baltic-Adriatic corridor. The development of these
liquid m3, that is, 60 billion gaseous m3, which corridors is likely to significantly increase traffic via
accounts for 27% of LNG global trade. Out of these the Otrando strait to the Adriatic.
60 billion gaseous m3, the larger portion (53%)
originated from North Africa (Algeria, Egypt and Non-bulk transport
Libya) and from Nigeria. Non-bulk transport, deploying two types of vessel—
3 BTC Oil pipeline: Bakli-Tbilisi-Ceyhan Ro-Ro ships and container ships—reported the
BLUE PLAN PAPERS 7 - MAY 2010 15Maritime Transport of Goods in the Mediterranean: Outlook 2025
highest growth, with 8% per year between 1997 and Container ship transport reported a quite high average
2006. annual growth by 10% over the past ten years, due
to a port traffic growing by 71 % and a ship size
Container ship transport deploys a range of ships that
increasing by 55 %.
is much larger than that of Ro-Ro ships. Thus, the
capacity generated in 2006 by container ships stood at On the whole, the growth of exchanged volumes
960 million DWT for 35 000 port calls, while Ro-Ro is due to ship size, but it is also due to the new
services generated a smaller capacity of 430 million accommodation capacities that the SEMCs have
DWT for 75 000 port calls. equipped themselves with in order to meet increasing
demand and to respond to the boom of container
Another specificity is that transport distances are transport: construction and franchise of new wharfs,
different. Ro-Ro routes are intra-Mediterranean and as well as development of maritime hubs initiated
follow a North-South direction (Algeria-France, back in the 1990s in the Northern Mediterranean
Morocco-Spain), but also a East-West direction Countries (NMCs) and pursued with the opening of
between Greece, Italy and Turkey. Large container the Tanger-Med. As of 2008, port handling capacity
ships present mainly a East-West direction: they had almost been completely used. Forecasts of a high
start off in Asia, head towards the ports of the north growth have driven the pursuit of port development.
European range and undertake transhipment with
Yet, container ships continue to preferentially use the
smaller units in the Mediterranean.
ports of the northern range (Hamburg, Rotterdam,
Ro-Ro transport reported an annual growth by around Antwerp…), as EU entry and exit ports, rather than
5% over 10 years, due to a 33% rise in frequency and those of the south. The ports of the northern range
a 31% increase in average ship size over 10 years. Its offer shorter dwell times than those of the southern
organisation could be enhanced via the “motorways range where equipment efficiency and, above all,
of the sea” services that the European authorities and port formalities slow down the logistical chain. Such
certain riparian countries intend to develop. a situation also entails consequences in terms of
Map 3 Maritime container port transport Map 4 Maritime container port transport (UE –
(EU – Asie-26), 2005 (thousand tons/year) Mediterranean), 2005 (thousand tons/year)
Sources: Eurostat data
16 BLUE PLAN PAPERS 7 - MAY 2010Maritime Transport of Goods in the Mediterranean: Outlook 2025
emissions of pollutants that could be avoided if the a markedly higher growth than those of the Northern
ports of Southern Europe were better utilised. Mediterranean. (Map 6)
Map 3 reveals the predominance of the container port Tanger Med, opened in July 2007, envisions a
traffic of the EU northern range, in relation to Asia. For gradual scale-up to reach a handling capacity of 3.5
the Northern ports, the arrivals of containers loaded in million TEU4 in 2012 and reach up to 8 million with
Asia (in red) are slightly higher than the departures (in TangerMed 2 in 2015
green). Mediterranean ports quite clearly receive more
Container ships follow a transhipment logic in
from Asia than they send to it.
hubs that are often without a hinterland. Thus, the
Map 4, reveals that the ports of the Northern range larger container ships are supplied and downloaded
play a significant role in the exchanges with the by smaller feeders which ensure links with
SEMCs. Europe sends into the Mediterranean more Mediterranean ports. These hubs are located along
manufactured goods than it receives (green part of the direct maritime route between the Suez Canal
the diagrams). The volume appearing in southern and Gibraltar, at exit of the Suez Canal, at the centre
Italy (Gioia Tauro) attests to the significant container of the Mediterranean (Malta, southern Italy) and in
transhipment between container ships and feeders, the western zone (Tangiers, Algesiras). Container
these involving neither exports nor imports. traffic of the southern ports has, until now, been fairly
limited.
Container ship traffic is highly concentrated in the
northern part of the Mediterranean and less so in the Logistic integration of transport chains in the SEMCs
eastern part, while it is quasi absent in the south. (Map 5) is still inefficient, by comparison with the Europe
– Asia chains, with scarcely any provision of port –
Growth has been particularly steady in the Black Sea
railway connections (except for Tanger-Med). Steps
and in Port Saïd, since its extension, and container-
need to be taken; otherwise, exchanges will continue
ship ports in the Western Mediterranean have reported
4 TEU Twenty foot Equivalent Unit
Map 5 Maritime container volume of Mediterranean ports, 2005 (TEU4)
Unit : TEU Year : 2005
Source: NESTEAR
BLUE PLAN PAPERS 7 - MAY 2010 17Maritime Transport of Goods in the Mediterranean: Outlook 2025
Map 6 Container capacity in Mediterranean ports of interest, 2007 (million TEU4)
Taux de croissance 2002-2007 Million EVP
Stable ou légère baisse 0,5
15 % - 50 % 1,0
50 % - 100 % Novorossijsk
100 % - 200 % 2,0
> 200 %
Lattakia
Type de ports
Gioia Tauro Hub
Barcelone Port régional
Source: author’s elaboration from CI on-line (2007 data)
to prioritise the ports of the northern range which, Other transport modes
though more remote, are faster and more reliable.
●● Land traffic
The modelling—conducted with the consultancy Land exchanges among the SEMCs remain low,
Nestear—has allowed a reconstruction of container due to administrative or political border crossing
ship flows (Map 7). It highlights the importance of difficulties. In 2004, the share of exchanges in
the hubs which “split” their goods according to the
volume of SEMCs was less than 1% for imports
Mediterranean countries: Port Said for the East, Gioia
and of 4% for exports. The only significant
Tauro for Italy, Central Europe and Malta – Sardinia
road exchanges involve Turkey and Europe, via
for Italy, France and Spain, and the bigger flows to
the Trans-European highway between Ankara
the ports of the North Sea and the English Channel,
and the Bulgarian border which constitutes an
such as Le Havre, Fellixtowe, Antwerp, Hamburg
extension of the Pan-European corridor 4. In
(Bremen), it being noted that Hamburg serves as
2004, these accounted for 13% of the exchanges
a “hub” for the whole Mediterranean. Within this
in volume between Turkey and the EU (Eurostat).
configuration, the northern ports maintain a dominant
International road transport of goods is, in fact,
position in European exchanges with Asia.
generated by ports for distribution in major
This significant growth of non-bulk traffic is national cities.
connected not only with non transport related decisive
factors, such as economic growth, opening up of ●● SEMCs rail transport of goods is mainly
markets and urban concentration to which ports give connected with ports. It allows the exportation of
access, but also with transport related factors, such national production: phosphate for Morocco; oil,
as its costs which comprise time value and operation iron ore, coal and metal for Algeria; and steel and
costs, being themselves sensitive to energy prices. coal for Egypt.
The infrastructures, their connection, and the loading/ In order to intensify inter-country rail transport,
unloading facilities are also components that will be a prerequisite would consist in developing the
taken into consideration in the prospective part of the national networks. However, freight traffic of the
study. SEMCs (in ton*km) reported a decrease by 3.3
18 BLUE PLAN PAPERS 7 - MAY 2010Maritime Transport of Goods in the Mediterranean: Outlook 2025
Map 7 Container capacity in Mediterranean ports of interest, 2007 (million tons)
Source: NESTEAR
%/year between 1997 and 2001. Only Egypt and ●● Air traffic, being mainly dedicated to passenger
Israel reported an increase by 2 % and 2.8 %/year. transport, accounts for 0.2 % of the tonnages
This decline in traffic is connected with the low exchanged. This mode is actually used for high
operationality of the networks of the Southern market value goods which claimed some 18 %
Mediterranean Countries (SMCs) whose linear of the value exchanged between SEMCs and E.U
network length remained unchanged between in 2004. The Euromed project had estimated that
2000 and 2006 (Source: Eurostat 2008). The the average unit value of the goods exchanged by
following map highlights the contrast between air with the European Union amounted to €6 200/
the south and the north. Thus, as the situation now ton, while that which is transported by sea stood at
stands, only Tunisia has a level of accessibility to €536, and that carried by rail stood at €401.
railway infrastructures comparable to those of the
Northern Mediterranean Countries (NMCs). Main conclusions
Besides the construction and up-grading of From the preceding paragraphs, one may draw the
infrastructures, the RTAP (Regional Transport following conclusions :
Action Plan for the Mediterranean Region 2007-
2013), issuing from the Euromed Transport project, ●● EU trade is the chief driving force of traffic in the
recommends an interoperability of the national Mediterranean.
networks and a separation between infrastructure ●● Asia is E.U’s chief trade partner (claiming 40% of
management and transport operations. This its imports and 30% of its exports).
entails that access to railway infrastructures (slot ●● Inter-Mediterranean flows, all goods considered,
allocation …) be decided independently of one or hardly account for a quarter of the traffic volume.
several railway transport companies. Inter-SEMCS exchanges are low, and the flows
BLUE PLAN PAPERS 7 - MAY 2010 19Maritime Transport of Goods in the Mediterranean: Outlook 2025
Map 8 Population access to railway infrastructure (in km of infrastructure/1000 inhabitants)
Accessibilité infrastructures ferroviaires
km d'infrastrcure / 1000 habitants
Autre
Source: NESTEAR
operate along a North-South route, with a lowest production costs prevailing in Asia have
dominant South-to-North direction, connected led transport to adapt, through a “massification”
with oil and gas exports. of goods aboard very large-sized ships which
●● The SEMCs, particularly those of the Eastern reduce the conveyance costs associated with long
Mediterranean, highly look to Asian countries, distances. This justifies the 10%/year growth of
especially with regard to imports which amount container transport over the past ten years. This
to over 20%. growth has led the countries to envision more
large-scale port infrastructures, as well as deeper
●● Goods exchanges are mainly conducted in
ports. Each of the SEMCs has currently one or
maritime mode (75 %) and are distributed into
several projects of this type.
energy transport by tanker (24%), dry bulk
transport (27%) and non-bulk transport (36%), ●● The Mediterranean is, thus, characterised by an
mainly by container ship. intense transit transport and a low integration
level, particularly as far as South-South exchanges
●● Energy transport is determined by well-
are concerned.
established location of production sources (North
Africa and Gulf countries). Transport thus serves ●● Non-bulk transport emerges, in view of its scope
as a connection between resources countries and and growth, as a key challenge in the framework
consumer countries. The increase observed over of Mediterranean integration.
the past 10 years, by around 7%/year, could be Accordingly, the second part of this study will seek to
more moderate if policies of energy conservation outline the possible evolutions of non-bulk transport
and development of renewable energies were put in terms of volume and distribution of the flows.
in place. This will be conducted via three scenarios based
●● Non-bulk transport offers the largest capacity on economic evolutions and more or less dynamic
and reports the highest growth (+8%/year). The transport development policies.
20 BLUE PLAN PAPERS 7 - MAY 2010Maritime Transport of Goods in the Mediterranean: Outlook 2025
Outlook of maritime transport of goods
The prospective study 2025 concerns non-bulk The economic growth hypotheses are derived from
transport. It is this transport segment which reports the trend scenario (S2), with a variation of +/- 0.3 %
the highest growth and which constitutes, by the of GDP for the NMCs and of +/- 1 % of GDP for
volumes concerned, the key stake for goods transport. the SEMCs, based on the discussions of the experts’
The purpose is to appreciate the foreseeable flows, in workshop (Annex 2).
terms of volume and according to their geographic
The scenarios integrate, respectively, an increase in
distribution (origin/destination). This prospective
oil price per barrel (50$, 100$ and 150$, value of
study rests on a method developed by the Nestear
2005), as well as the introduction of a carbon tax of
consultancy (detailed in Annex 3).
100€ per ton for the third scenario (S3).
The purpose is to see how this baseline situation in
2005, itself the outcome of the evolutions observed Table 2 Socio-economic
over the past ten years, can be projected into 2025, Average annual growth rates between 2005 and 2025
notably in terms of port traffic, according to three
scenarios based on sets of economic and sector S1 S2 S3
hypotheses. These scenarios have been identified Population - NMCs 0,2 % 0,2 % 0,2 %
in a collaborative framework grouping several
Mediterranean experts.. Population - SEMCs 1,2 % 1,2 % 1,2 %
The issue of transport of energy products is, advisedly, GDP - NMCs 1,5 % 1,8 % 2,1 %
not included in this prospective study. Reference may GDP - SEMCs 3% 4% 5%
be made, in relation to this particular aspect, to the
Barrel price (non bulk) 50 $ 100 $ 150 $
Plan Bleu study entitled “Infrastructures and Energy
Development in the Mediterranean: 2025 Outlook” CO2 price (non bulk) 100 €
whose analysis is summed up in Box 1. Source : Plan Bleu
The first scenario (S1) corresponds to a lasting crisis
situation where the room for manoeuvre available to Each of the scenarios assumes an organisation of the
the authorities and the professionals is limited by a transport sector, identified based on public policies
low economic growth. and private sector actions for the following four
parameters: infrastructure, operation of networks and
The second scenario (S2) corresponds to a situation
equipment, commercialisation and regulation
marked by a post-crisis recovery (2008/2009).
This scenario corresponds to the economic growth The methodology rests on simulations derived from
foreseen before the crisis and gives a possibility to a gravity model and a mode allocation model. The
the various players to pursue the evolution envisioned gravity model helps work out the exchange flows
before 2008. according to the major directions, in an analogous
The third scenario (S3) assumes a more dynamic way to the Euromed project.
growth offering the players room for manoeuvre to The allocation model distributes these flows
rapidly engage port development actions. Besides, among the various transport modes: both maritime
public players engage measures intended to foster the (distinguishing feeder, Ro-Ro in the Mediterranean,
development of railway transport. maritime transit routes) and land transport in which
The socio-economic hypotheses summed up in Table are considered the generalized transport costs.
2 comprise, on the one hand, a regular demographic They incorporate operational cost and time, broken
growth for the scenarios, of 0.2 %/year for the NMCs down into voyage time, and loading/ unloading and
and of 1.2 %/year for the SEMCs and, on the other procedures port time). This simulation work uses a
hand, a economic growth for the trend scenario (S2) model called NEST-MED (Annex 3) which is an
of 1.8 % for the NMCs and 4 % for the SEMCs, application to the Mediterranean of the Nestear
according to World Bank data. consultancy LOGIS model used in European projects.
BLUE PLAN PAPERS 7 - MAY 2010 21Maritime Transport of Goods in the Mediterranean: Outlook 2025
Box 1 Energy transport
Based on the elements of the Plan Bleu study entitled Infrastructures and Energy Development in the Mediterranean: Outlook 2025.
Oil transport
According to the trend scenario, the exchanges are set to rise from 500 million tons (Mt) in 2005/2006 to around 750 Mt by 2025. This growth would
result in an annual increase of the tonnage transported by 2.1%/ year.
Map 9 Oil flows via the Mediterranean region (Mt)
Sources IEA, BP, OME
The energy alternative scenario rests on the implementation of sustainable development policies and incorporates the initiatives engaged by the
Union for the Mediterranean - UpM (convergence of the energy policies of the SEMCs and Mediterranean Solar Plan). It would help save 154 Mt/
year into 2025. As this involves less tons to carry, the oil flows would decrease to less than 600 Mt, according to a volume growth of less than 0.9
%/ year between 2005 and 2025. This would help avoid around 1500 tankers/year5 out of the 6700 likely to navigate in 2025, according to the
trend scenario, and to scale-down, if not avoid, the extensions, or the creation of new oil ports.
Gas transport
As is the case for oil, the strategic character of gas leads the various players to predict a shipping and transport supply in line with the demand.
According to a preliminary estimate into 2025, the portion in transit via the Mediterranean would be around 380 billion m3. The LNG portion is set
to considerably increase in the trend scenario, with a growth rate of around 7.7 %/ year, that is +280 % between 2005 and 2025.
Table 3 Evolution of gas volume origin (billion m3)
LNG from: 2007 2025 % 2007-2025
North Africa 32 76 4,90
West Africa 17 25 2,20
Gulf countries 8 113 15,80
Latin America 3 11 7,50
Norway 0,2 2 13,60
TOTAL 60 227 7,70
Sources: MOE/OME study, Gas supply to Europe - Plan Bleu
This high growth estimate in the trend scenario seems to be supported by the number of methane tankers on global level which has increased
over the past few years by over 10 % per year, reaching 291 ships in 2007. One hundred twenty eight (128) additional vessels are being built. The
reception infrastructure consists of 16 LNG regasification terminals around the Mediterranean. The current capacity of 110 billion m3 per year of
these LNG terminals is set to grow fourfold within the coming ten years (424 billion m3 per year).
5 Llyod’s reckons 6045 tanker calls + 500 transit in 2006, with a average capacity of 125 000 DWT.
Unit capacity rose from 125 000 to 160 000 DWT in 2025, that is a factor of 1.28.
Baseline scenario: 6500 * 1.5/1.28 = 7600.
Alternative scenario: f 6500*1.2/1.28 = 6100
22 BLUE PLAN PAPERS 7 - MAY 2010Maritime Transport of Goods in the Mediterranean: Outlook 2025
Map 10 Status and projects of gas infractructures
Source: Cedigaz
The alternative scenario should allow the saving of 82 Mtoe equivalent to 100 billion m3 (bcm) of gas into 2025, that is a growth rate of 4.3 %/year,
from 60 bcm in 2007 to 127 bcm/year in 2025. This means a reduction of the traffic of loaded ships by 900 methane tankers/year, as against the
2300 methane tankers of the trend scenario. Proactive energy policies would allow a significant reduction of these traffic volumes, of pollution
risks and of equipment needs.
In sum, the transport of the two main energy products goes as follows:
Table 4 Evolution of energy products exchanges
Annual growth in quantities Trend scenario Alternative scenario
Oil
Annual growth 2,1 % 0.9%
Growth factor 2005-2025 1.5 1.2
Nbr of super tankers avoided/ year
1500
(corresponding to 150 Mt/ year)
LNG
Annual growth 7.7 % 4.3%
Growth factor 2005-2025 3.8 2.1
Nbr of super tankers avoided/ year
900
(corresponding to 100 billion m3)
Source : Plan Bleu
The alternative scenario would help avoid, in total, 2400 super tankers/year despite the hypothesis of an economic growth higher by 1% in the
SEMCs and by 0.3% in the NMCs, with respect to the trend scenario.
Table 5 Primary energy consumption by source in the two scenarios (in Mtoe)
Carbon Oil Gas Nucl. Hydro RE Total % Carbon % Gas % Oil % RE+Hydro
Baseline 2007 119 391 251 130 18 47 955 12 26 41 6.8
Trend 2025 190 558 474 140 30 55 1449 13 33 39 6
Alternative 2025 135 404 392 115 30 83 1162 12 34 35 10
Energy savings 54 154 82 25 0 -27 287
Sources: Plan Bleu, MOE/OME
BLUE PLAN PAPERS 7 - MAY 2010 23Maritime Transport of Goods in the Mediterranean: Outlook 2025
The results concern : Domestic transport
●● international maritime transport of extra- This type of transport is dominated by road
Mediterranean exchanges (Mediterranean transport, with a rail share scarcely exceeding 5 %
countries with non Mediterranean countries) and in Mediterranean countries, except in France and
intra-Mediterranean exchanges, in Italy. The estimate of this traffic stands, for the
●● land transport for distances of over 70 km baseline year, at 342 billion ton*kilometer (tkm)6
(exclusive of local traffic) by road and by rail for with regard to road transport and at 27 billion tkm
port related traffic. with regard to rail transport.
In order to facilitate the reading of the origin/ destination Scenario S1
matrices of international maritime traffic (Annex 1) the
following main flows have been extracted: EU-Asia, Set of hypotheses
SEMCS-Asia, EUmed-EUmed, EUmed-SEMCs,
Apart from the demographic growth rate, common to
SEMCs-SEMCs, EU non med-SEMCs.
the three scenarios, the following specific hypotheses
These traffic flows will be accompanied by energy have been selected:
consumption and CO2 emissions estimates. Growth and exchanges
Baseline year 2005 Under this scenario, the economies of Mediterranean
countries do not manage to recover from the 2008
●● Maritime transport financial crisis. After ten years of a fairly high GDP
The breakdown of exchanges in tonnages has been growth, ranging between 3 and 5%, growth stabilises at
estimated based on the value of the exchanged around 1.5% per year for the Northern Mediterranean
products, as derived from the Comtrade base, Countries (NMCs) and 3% per year for the Southern
according to the method presented in Annex 3. and Eastern Mediterranean Countries (SEMCs).
This matrix helps to calibrate the baseline situation Concerning the exchanges, globalisation and
international exchanges remain an undisputable fact:
(2005).
indeed, economies have become interdependent.
Table 6 Volume of goods exchanged – Baseline year Economic competition and market rules remain the
2005 driving force of exchanges in the countries and on
Baseline year 2005
international markets.
% 106 tons As regards international economic relations, the
Intra Med 25 NMCs have to maintain a precarious balance, with
EU Med-EU Med 17 international exchanges that continue to grow faster
EU Med-SEMCs 7 than national exchanges according to an elasticity
SEMCs-SEMCs 1 likely to range between 1.5 and 2 in the North, while
EU non Med-SEMCs 8 47 being likely to remain around 1 in the South.
Asia 28 The oil barrel would stabilise at 50$ (value of 2005)
EU-Asia 26 146 due to low growth.
SEMCs-Asia 2 11
Transport policiy
Other 39 218
Total 100 564 The transport sector is characterised by public
Source : Plan Bleu policies that are too minimalist and budget resources
that are too limited for the development of structuring
The Mediterranean is a zone of transit and exchange infrastructures.
with the rest of the world. Out of the 564 million A disparity obtains between an international
tons (Mt) of non-bulk goods in transit, only 25% are transport that remains fairly vibrant and a domestic
intra-Mediterranean, while 75% have an origin and/ transport whose structures are characterised by
or a destination outside of the Mediterranean. Among a slack development. Port areas, being in direct
these extra-Mediterranean flows, exchanges with
6 tkm : number of ton-kilometers is the weight in tons of
Asia predominate at 28 %, followed by those of the material transported (t) multiplied by the number of kilometers
EU non Med – SEMCs connection (8%). driven (km)
24 BLUE PLAN PAPERS 7 - MAY 2010Maritime Transport of Goods in the Mediterranean: Outlook 2025
connection with the organisation of international ●● Transport equipment and operation
transport, are the areas more likely to benefit
The grim climate is, in this scenario, hardly
from a slow modernisation of transport and the
conducive to technological innovation which oil
development of an outbound logistics. Outside of
prices are far from stimulating. A certain progress
these areas, the constraints of a domestic market
can, however, be made towards eliminating, in the
remain strong.
southern Mediterranean countries, the more polluting
Road transport is the sector favoured by the initiatives road vehicles and restricting the importation of hardly
of individual operators who manage to adapt to market efficient second-hand equipment.
change, in a context of fierce competition and, hence,
Truck performance and size are improving slowly
to adequately meet a low growth of production and
but steadily. The professionalisation of road transport
distribution. These individual operator initiatives, or reports a slight improvement with the coming on
small and medium size enterprises (SMEs), are also board of SMEs dedicated to transport on behalf of
sub-contractors of global operators. There is little third parties, though they remain too scattered to
incentive to modernise the equipment or rationalise achieve a rapid modernisation.
the domestic distribution channels.
In the Northern Mediterranean Countries (NMCs),
The domestic system is hardly under control and these constraints are stronger for road vehicles, and
inefficient. The level of exchanges between the rail transport manages to maintain its market share,
southern Mediterranean countries remains low, with as the railway reform has actually been implemented.
still cumbersome land border crossings. The development of inter-modal transport helps
Railway transport cannot sustain road competition, and sustain this market share.
remains confined to dedicated heavy goods industrial In maritime transport, the ISO container has become
markets, without any reform or modernisation. established within an ongoing process of globalisation
●● Infrastructures of exchanges. Ro-Ro transport, being more specific to
the Mediterranean, manages—not without difficulty,
The context being one of a lack of public, national and though—to cut itself a niche, except on very short
international funding, the infrastructures constructed distances where it is taken over by ferry-type
will be: transport. The concept of “motorways of the sea”
●● those likely to attract private funding, such as those is, indeed, abandoned, and only a few measures for
related to the development of ports and airports, modernising coastal navigation and facilitating port
according to the growth pace of Mediterranean
transit have been adopted. The capacity offered by
and global trade,
the container ships ordered before the crisis of 2008
●● those of a road type, connected with the increasing
launches on the market an offer that is short of being
use of the private car due to urban sprawl and to
fully utilised.
the demand on road transport of goods between
major cities. ●● Commercialisation
Highway infrastructures will also be constructed In the countries of the south, new comers (European
between major cities, knowing that toll fees will private operators) limit their activity to port servicing,
contribute significantly to construction costs. Thus, from major inland centres for goods, when the
only railway segments will be constructed, such as national regulations allow for it. The trade dynamism
the TGV (high speed train) between major cities is essentially due to road enterprises in the countries
in Morocco and in Turkey. Low growth level does of the south, offering limited logistic services. In the
not allow the envisioning of international funding players’ action, large distribution enterprises that
towards the implementation of other ambitious operate in metropolises or in their vicinity have a
projects. predominant role.
Oil producing countries have a more favourable Rationalisation of distribution generates productivity
position, despite a low price of the oil barrel at 50$: gains that attract private capital, but which also
they devote part of these resources to investments in influence the developments so that they grant priority
road infrastructures and in certain railway connections order to the car and heavy goods vehicles, and this, in
(Algeria, Gulf countries). the absence of alternative solutions.
BLUE PLAN PAPERS 7 - MAY 2010 25You can also read