The Implications of Internet Shopping Growth on the Van Fleet and Traffic Activity - Professor Alan Braithwaite LCP Consulting May 2017
←
→
Page content transcription
If your browser does not render page correctly, please read the page content below
Mobility • Safety • Economy • Environment

  The Implications of
  Internet Shopping
  Growth on the Van
  Fleet and Traffic Activity
  Professor Alan Braithwaite
  LCP Consulting
  May 2017
The Royal Automobile Club Foundation for Motoring Ltd is a transport policy and research
organisation which explores the economic, mobility, safety and environmental issues
relating to roads and their users. The Foundation publishes independent and authoritative
research with which it promotes informed debate and advocates policy in the interest of the
responsible motorist.

RAC Foundation
89–91 Pall Mall
London
SW1Y 5HS

Tel no: 020 7747 3445
www.racfoundation.org

Registered Charity No. 1002705
May 2017 © Copyright Royal Automobile Club Foundation for Motoring Ltd

Mobility • Safety • Economy • Environment

The Implications of
Internet Shopping
Growth on the Van
Fleet and Traffic Activity

Professor Alan Braithwaite
LCP Consulting
May 2017
About the Author
Professor Alan Braithwaite
Alan is the Founder of LCP Consulting and has spent his career working with more than 400
companies on their operations, supply chains and logistics. In 2015 he published a book
with Professor Martin Christopher under the title ‘Business Operations Models – becoming
a disruptive competitor’. In 2016 he was awarded the Sir Robert Lawrence Award by the
Chartered Institute of Logistics and Transport for his lifetime contribution to the profession.

He is also a Visiting Professor in Supply Chain Management at Cranfield University, School
of Management, where he contributes to research and teaching. In this role, he is a thought
leader and educator, a regular speaker at conferences, and the author of many papers and
articles.

In recent years he has taken an academic and consulting interest in freight transport policy.
In the course of this work he has published widely, including being the lead author of the
Chartered Institute of Logistics and Transport – Freight Vision 2035. He is a recognised thinker
on the future of urban logistics in the face of the challenges of congestion and pollution.

LCP Consulting
LCP is a specialist operations and supply chain consultancy, which is now part of
BearingPoint – a leading global business consulting firm with broad management and
technology capabilities. LCP’s focus is on advising companies how to simultaneously
improve customer experience and enhance their bottom lines through their operations. The
firm has a strong retail practice where it has become a leader in retail e-commerce and
advised many high street names on their operational development. This deep experience
has helped to inform this analysis and report.

i    The Implications of Internet Shopping Growth on the Van Fleet and Traffic Activity
Acknowledgements
My thanks are due to the RAC Foundation for asking me to prepare this analysis and report.
Also I must recognise their support and challenge during the course of the work; it is the
better for it. The team at LCP have provided industry experience and detailed background
analysis. Many connections, including with the CILT, MDS Transmodal, The Transport
Systems Catapult, Transport for London and UK Warehousing Association have also helped
with sources and validation. The opinions and conclusions are mine and should not be taken
to represent those of any other organisation.

Disclaimer
This report has been prepared for the RAC Foundation by Professor Alan Braithwaite (LCP
Consulting). Any errors or omissions are the author’s sole responsibility. The report content
reflects the views of the author and not necessarily those of the RAC Foundation.

                                                                    www.racfoundation.org       ii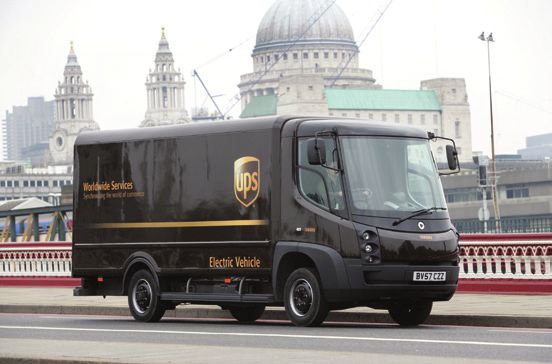
Contents
List of Abbreviations������������������������������������������������������������������������������������������������������������ vi
Executive Summary������������������������������������������������������������������������������������������������������������ vii
1 The Rise and Rise of Internet Retailing��������������������������������������������������������������������������������� 1
1.1 The growth in e-commerce and its importance in the UK����������������������������������������������� 1
1.2 Changing patterns of e-commerce access – the growth of mobile��������������������������������� 2
1.3 Retailers’ responses to e-commerce growth and customer preferences������������������������ 4
1.4 The customer delivery event: critical to retention and profit�������������������������������������������� 5
1.5 Fast-track service based on vans: a core competitive lever�������������������������������������������� 6
2 The Parcel Market Serving e-Commerce����������������������������������������������������������������������������� 8
2.1 Estimating the scale of the parcel market����������������������������������������������������������������������� 8
2.2 The van resources that service the parcel delivery market�������������������������������������������� 11
2.3 The impact of the growth in click-and-collect on delivery volumes������������������������������� 14
2.4 Developing a forecast of parcel volumes for 2020�������������������������������������������������������� 17
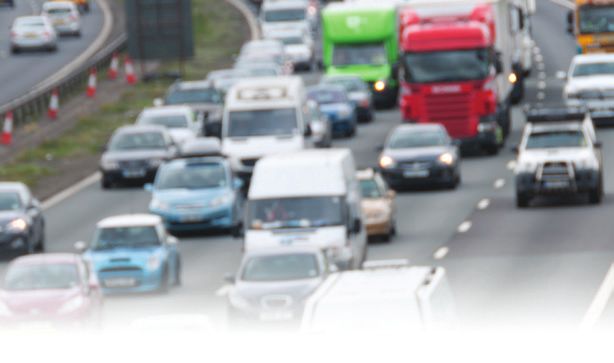
3 Vans and Traffic Generation����������������������������������������������������������������������������������������������� 18
3.1 Van traffic growth in the total traffic mix������������������������������������������������������������������������ 18
3.2 The composition of the van parc���������������������������������������������������������������������������������� 20
3.3 How the van parc is growing��������������������������������������������������������������������������������������� 21
3.4 The place of vans and e-commerce in traffic growth���������������������������������������������������� 24
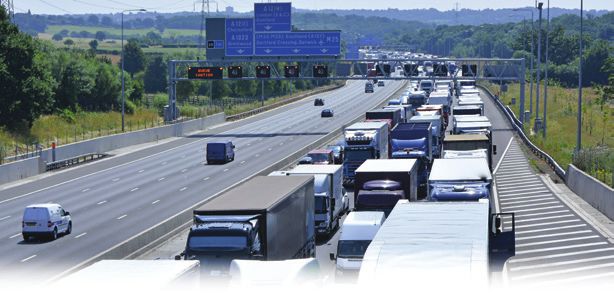
4 Traffic Congestion, Air Quality and e-Commerce���������������������������������������������������������������� 25
4.1 e-Commerce impacts on personal travel��������������������������������������������������������������������� 25
4.2 Travel for shopping and journey substitution���������������������������������������������������������������� 27
4.3 Travel timing and its impact on congestion������������������������������������������������������������������ 28
4.4 Implications of commercial vehicles (vans and lorries) on congestion and air quality����� 31
4.5 Strategies for mitigating the environmental and congestion impacts of freight�������������� 33
4.6 Vans and freight: as much a victim of congestion as a contributor������������������������������� 34
5 Emerging City Logistics Models – Examples and Case Studies������������������������������������������ 35
5.1 London case study – avoid the journey������������������������������������������������������������������������ 36
5.2 London case study – retime the journey���������������������������������������������������������������������� 37
5.3 Mitigate the emissions and pollution impacts��������������������������������������������������������������� 40
6 The Need for Further Research������������������������������������������������������������������������������������������ 42
7 Conclusions and Recommendations��������������������������������������������������������������������������������� 46
References������������������������������������������������������������������������������������������������������������������������ 49
iii The Implications of Internet Shopping Growth on the Van Fleet and Traffic Activity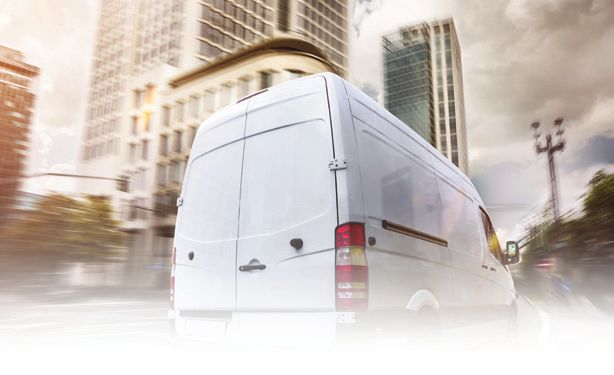
Figures list
Figure 1.1: T
he relative scale and recent growth of online retail revenues,
within the EU and worldwide������������������������������������������������������������������������������ 2
Figure 1.2: The three main factors underlying customer purchase decisions������������������������ 5
Figure 1.3: Does a good delivery experience influence repeat purchase?����������������������������� 6
Figure 2.1: UK e-commerce market: levels of ordering and delivery activity�������������������������� 9
Figure 2.2: Click-and-collect sales as a percentage of sales completed online������������������� 15
Figure 2.3: Customer preferences for fulfilment methods��������������������������������������������������� 15
Figure 2.4: Motivations to use click-and-collect����������������������������������������������������������������� 16
Figure 3.1: Illustration of the type of van by size����������������������������������������������������������������� 20
Figure 3.2: The distribution of the van parc by vehicle type, 2015�������������������������������������� 21
Figure 3.3: Trend in van parc growth by segment, 2003–15����������������������������������������������� 22
Figure 3.4: Trend in new van registrations by segment, 2003–15��������������������������������������� 23
Figure 4.1: Trends in travel distance by mode, England, 2002–15�������������������������������������� 27
Figure 4.2: Frequency of household delivery of goods, England, 2002–4 and 2008–15����� 28
Figure 4.3: Personal trips by start time and purpose, weekdays, England, 2011/15����������� 29
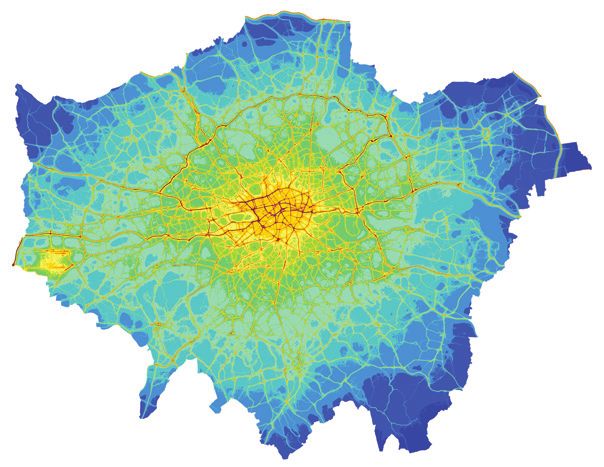
Figure 4.4: Air quality map of Greater London�������������������������������������������������������������������� 32
Figure 4.5: P
rofile of freight vehicle movements in London’s Congestion charging
zone by time of day������������������������������������������������������������������������������������������ 33
Figure 5.1: Van utilisation in London����������������������������������������������������������������������������������� 36
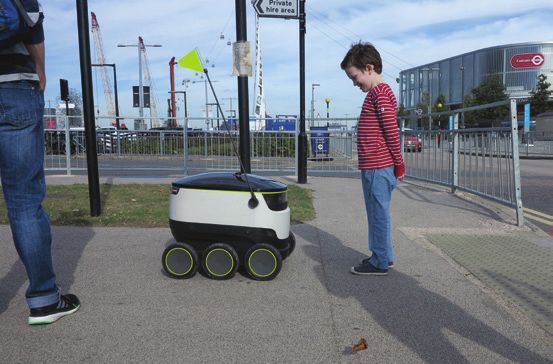
Figure 5.2: A ground drone delivering in Greenwich����������������������������������������������������������� 40
Figure 5.3: UPS electric van in London������������������������������������������������������������������������������ 41
Figure 6.1: The food outlet profile of central Greenwich������������������������������������������������������ 44
Tables list
Table 1.1: UK retail m-commerce sales actual and forecast, 2014–20��������������������������������� 3
Table 2.1: T
otal UK parcels market as at 2013 reported by Postal and
Logistics Consultants���������������������������������������������������������������������������������������� 10
Table 2.2: Compilation of a best view of the total UK parcels market, 2016����������������������� 11
Table 2.3: T
he major operators of van fleets in business-to-business (B2B)
and business-to-consumer (B2C) package delivery������������������������������������������� 13
Table 3.1: D
fT forecast of van traffic in the overall traffic mix for 2035 and
2040 by area type, England, 2015��������������������������������������������������������������������� 19
www.racfoundation.org iv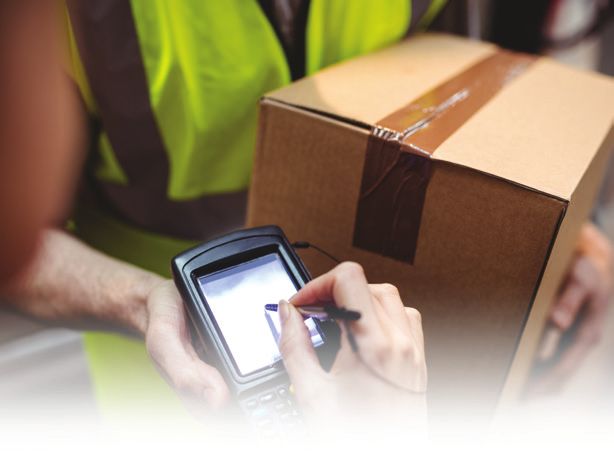
Foreword
Britain’s consumers have taken enthusiastically to the world of internet shopping, with
potentially significant implications for our traditional town centre and high street retail
outlets. Might there also be similarly significant implications for the volume of traffic on our
congested roads?

Meanwhile, official statistics reveal a dramatic increase in van traffic over recent years,
leading some commentators to suggest a causal link – more home deliveries, more vans,
and more traffic.

So we commissioned Professor Alan Braithwaite to investigate whether that causal link
might be real – is internet shopping behind the rise in van traffic, as more and more of us
shop online for goods to be delivered straight to our homes?

Alan’s research suggests that the answer is a pretty emphatic ‘no’.

True, in congested city centres the fact that many office staff choose to have their personal
purchases delivered to their place of work is making traffic managers’ lives more difficult,
because the available road capacity is already exhausted. But in the round it seems we have
to look elsewhere for the drivers of ever-increasing van use.

Having your shopping delivered to your home after the evening rush hour could be having a
positive impact on traffic levels. What’s less clear are the wider implications of a retail supply
chain that is striving to offer an ever swifter service for their click-happy customers.

Steve Gooding

Director, RAC Foundation

v    The Implications of Internet Shopping Growth on the Van Fleet and Traffic Activity
List of Abbreviations
B2B     business-to-business

B2C     business-to-consumer

C2X     consumer-to-business and/or consumer-to-consumer

Defra   Department for Environment, Food & Rural Affairs

DfT     Department for Transport

DVLA    Driver and Vehicle Licensing Agency

FTA     Freight Transport Association

GVW     gross vehicle weight

HGV     heavy goods vehicle

IMRG    Interactive Media in Retail Group

LBCC    London Boroughs Consolidation Centre

LCV     light commercial vehicle

NOx     nitrogen oxides

NTS     National Travel Survey

ONS     Office for National Statistics

PM2.5   particulate matter of median diameter 2.5 microns or less: fine particulate
        matter

PM10    particulate matter of median diameter 10 microns or less: coarse particulate
        matter

TfL     Transport for London

UKWA    United Kingdom Warehousing Association

                                                                www.racfoundation.org   vi
Executive Summary
This paper has been has commissioned by the RAC Foundation to investigate the
implications of e-commerce and Internet shopping on the van parc and its effects on traffic
activity and congestion. Ipsos MORI research commissioned by the RAC Foundation at the
same time as this report 1 shows that 85% of people doing Christmas shopping (and 73% of
all adults) reported doing so online for at least some of their Christmas gifts in 2015; 10% of
them reported they did all of their Christmas shopping online, and an additional 28% more
than half of it. At the time of the survey, 17% of adults thought that they would buy more
online for Christmas 2016 than they did in 2015, while 12% believed they would buy less
(Ipsos MORI, 2016a; 2016b: 2).

Of the adults who bought presents online for Christmas in 2015, 88% used home delivery
methods to receive these goods; around one in four (26%) used click-and-collect methods
to do so. The vans (light commercial vehicles – LCVs) that deliver these online orders are
sometimes demonised for causing congestion and hazard.

This paper assembles both primary and secondary research in an attempt to explore and
explain the role that vans used for Internet delivery play in the overall traffic problem. Is the
criticism of them fairly levelled or not?

The statistics and analysis have been drawn from multiple sources of data recorded
in different time periods. It has been necessary to draw conclusions by triangulation 2,
inference, application of industrial experience, and some inductive logic leaps.

Defining what a ‘van’ is at the outset may be useful for readers. They are goods vehicles
below 3.5 tonnes in weight including the payload. These are exempt from most of the
heavy goods vehicle (HGV) regulations relating to tachograph reporting, driving times, more
rigorous MOT testing and operator licensing. Vans are VAT-recoverable for businesses, and
are designed for carrying a variety of types of goods. The most common type is the panel
van (the ubiquitous ‘white van’), but the term also encompasses minibuses, Luton vans (the
design with a box body extending over the cab), tippers, flatbeds, dropsides and pickups.

Statistics show that vans are the fastest-growing traffic segment in the UK, with 70% growth
in road miles over the last 20 years, compared to 12% for cars and 5.5% for lorries; this
growth is forecast to continue under all economic scenarios (DfT, 2016a: 2).

The growth in vans is contributing to traffic congestion that is both acute and chronic,
costing the economy billions of pounds annually, as measured using traffic sensors and
analysed using ‘big data’ methods – London is the second worst city in Europe, and Greater
Manchester ranks 18th – and the UK is Europe’s third most congested country (INRIX, 2017).

The implications for pollution caused by this traffic growth and congestion are severe – slow

1 Conducted by online survey for adults aged 16–75 on 28 October and 1 November 2016.
2 In qualitative research, triangulation is a technique that facilitates validation of data through cross-verification from two or more
sources.

vii    The Implications of Internet Shopping Growth on the Van Fleet and Traffic Activity
speeds increase emission of NOx (nitrogen oxides) and particulates from diesel engines; vans
contribute 15% of London traffic – and a higher proportion of diesel vehicular traffic. The
current estimate of premature deaths in London alone due to poor air quality from all sources
is 9,400 annually (in 2010), with traffic as the biggest contributor (Walton et al., 2015).

References by the media to these and other sources frequently point the finger at Internet
shopping as the traffic congestion bogeyman. It is asserted that the vans that are servicing
the fast-growing e-commerce market are the primary cause of traffic congestion and air
quality problems. None of these sources substantiate the assertion. To test this hypothesis,
primary research was carried out on the van parc3 as a whole, and on the fleets that are
used in package and grocery home delivery. Secondary sources on e-commerce growth,
van use and traffic generation have also been compiled. The analysis of the van parc and
van traffic shows that:

      •      The van parc is indeed growing fast, with historic growth rates in vans on the road
             of around 5% annually, outstripping recent compound growth in van mileage of
             3.5%; both these growth rates are faster than the economy as a whole.
      •      The growth in the van parc does not show an obvious replacement of HGVs; the
             parc of smaller HGVs is only around 60,000 vehicles (as compared with 3.7 million
             vans) and continues to grow slowly.
      •      Vans appear to have their own economic momentum for reasons of convenience
             – vans provide compelling business value in terms of their convenience in time and
             place, and this is driving service-sector growth; vans are generally poorly used in
             terms of their payload.

For parcel delivery activity, the analysis reveals that:

      •      e-Commerce parcel volumes are growing at 9% annually, a rate that is expected
             to fall to 6% a year over the next four years; despite the reduction in growth, this is
             significantly above the average growth in vans.
      •      This rate of parcel growth is less than that of the online retail market, which is
             growing at between 10% and 12% a year; the difference is due to the innovation,
             customer acceptance – and hence growth – of click-and-collect.
      •      Retailers are trying to increase customer convenience and mitigate the unrecovered
             costs of home delivery by providing click-and-collect options.
      •      The vans in use by package and grocery e-commerce delivery operators comprise
             a small part (less than 4%) of the van parc. However, they run much greater
             mileage than the average van; hence road occupancy of parcel vans (on-the-road
             miles) is closer to 10% of van traffic.
      •      Therefore around one in ten of the vans that people encounter on the roads in their
             daily lives are engaged in parcel and packet delivery, whether to consumers or
             businesses.
      •      In overall traffic terms this translates into only around 1.5% of all movements (cars,
             lorries, vans, buses and coaches) in London where congestion is the worst in the
             country; London is used as a worst-case scenario in the analysis.

3 The parc is the total number of vehicles registered and taxed to run on the road by category – in this case vans.

                                                                                               www.racfoundation.org   viii
• Vans for home delivery do operate in peak traffic periods, but a large part of their
activity is at less congested times of the day and in locations away from the major
pinch points in the road traffic network.
This analysis points to the unfairness of singling out e-commerce delivery vans as a major
cause of traffic growth and congestion. It is an important part of the traffic mix, but not a
dominant one.
There are further important insights into what is actually happening:
• Cairns’ research, published in 2005 (Cairns, 2005), reported on modelling work
that suggested that Internet home delivery of groceries would reduce car traffic for
grocery shopping by as much as 70% – implying that home delivery could be a
benefit to traffic rather than a challenge, by substituting fewer vans for many cars.
This has proved to be an overestimate.
• Nonetheless, the 2015 National Travel Survey for England shows that the number
of personal shopping trips by car as a driver and passenger, and the distances
driven for that shopping, have reduced by 14% and 19% respectively since 2002
(DfT, 2016b; DfT, 2016c).
• Moreover, the Ipsos MORI poll for the RAC Foundation undertaken in October and
November 2016 found that a net 12% of respondents in urban areas (9% in rural
areas) reported making fewer shopping trips in a vehicle than they did 12 months
previously (Ipsos MORI, 2016a).
• Indeed, individuals’ travel by car as a driver or passenger for all purposes has
declined by 13% in terms of number of trips and by 10% in total miles travelled
over the last 20 years – it is population growth that is behind increased car use,
which accounts for more than 75% of all road traffic (DfT, 2016d: 20).
These sources are directionally consistent, pointing to a reduction in overall shopping traffic,
even though the scale of the reduction is not as great as Cairns forecast, and the timescales
do not align with Cairns’ work.
The overall conclusion is that, while vans are a growing contributor to traffic and congestion,
e-commerce is a smaller contributor to the overall picture than is often asserted. Indeed, it
appears that it has actually had a limited positive effect.
The topic of the ‘van growth problem’ needs further research to build the metadata that
can guide policy. Without that understanding, the risk is that policy measures made on the
basis of false assumptions can quickly gather momentum. Focusing on just one area of van
activity, or indeed on van usage as a whole, could result in missing the bigger picture of how
personal and work-related travel, and all van and lorry activity, are related.
The pattern of van and lorry activity across our cities and towns and on major and minor
roads is not uniform in its profile, purpose and impact. What happens in Norwich is quite
different from what goes on in Newham or Nottingham. The concept of freight ‘clusters’
is proposed in this report as the basis for analysing the need for and impact of freight
traffic in a way that can meaningfully support the development of local policy. This idea is
ix The Implications of Internet Shopping Growth on the Van Fleet and Traffic Activitybased on the analysis in Feeding London 2030: Facing the logistical challenge, published
by the United Kingdom Warehousing Association, which showed that the commercial
activities in the 300 towns that have their own high streets, which can be thought of as
making up London, vary greatly. The freight and logistics attributes of individual localities
are not homogeneous (UKWA, 2016). Using cluster analysis would provide the platform for
designing specific proposals for freight vehicle reduction through appropriate organisation of
deliveries in a locality.
Clusters could be supported by new models for urban logistics centres which are among
some rapidly emerging innovations in city logistics. Some of these solutions respond to the
demands of population growth and the macro problem of congestion; others answer to the
economics, convenience and sustainability of e-commerce growth. Micro-hubs, electric
vehicles, drones and delivery robots are all part of the future, and the digital revolution is
central to enabling such innovations.
Policymakers could usefully take time to understand the potential of these new innovations,
and to create favourable conditions for their full-scale market adoption.
www.racfoundation.org xVans are the fastest-growing traffic segment in the UK, with 70% growth
in road miles over the last 20 years, compared to 12% for cars and
5.5% for lorries
The van fleet (parc) is growing fast. Historic growth rates in vans on
the road of around 5% annually which his greater than annual
growth in van mileage of 3.5%
In 2016, the total UK market for e-commerce deliveries was 2.7bn
packages of which 1.8bn were for the “business-to-consumer” segment
e-Commerce parcel volumes are growing at 9% annually,
a rate that is expected to fall to 6% a year over the next four years
The vans in use by package and grocery e-commerce
delivery operators comprise less than 4% of the van parc
and make up close to 10% of van traffic
In overall traffic terms, vans used to service internet
shopping
orders account for only 1.5% of traffic in London where
congestion is the worst in the country
Vans for home delivery do operate in peak traffic periods, but a large
part of their activity is at less congested times of the day and in
locations away from the major pinch points
This analysis points to the unfairness of singling out e-commerce
delivery vans as a major cause of traffic growth and congestion.
It is an important part of the traffic mix, but not a dominant one
xi The Implications of Internet Shopping Growth on the Van Fleet and Traffic Activity1. The Rise and Rise
of Internet Retailing
This chapter provides an overview of the development of retail e-commerce,
the competitive nature of the industry, and how that is driving the demand for
ever-faster parcel delivery services.
1.1 The growth in e-commerce and its importance in
the UK
The growth in Internet retailing is arguably the most significant structural
change in the domestic marketplace seen in the last 20 years; the UK is the
Western world’s leader in terms of reported online market share. Figure 1.1
shows the online share of both global and EU retail markets derived from
various sources.
www.racfoundation.org 1Figure 1.1: The relative scale and recent growth of online retail revenues, within the
EU and worldwide
Italy
Poland
Spain
Netherlands
Sweden
France
Germany
UK
European Average
India
Australia
Japan
USA
China
0% 2% 4% 6% 8% 10% 12% 14% 16% 18%
2016 2015 2014
Source: Data combined and averaged from Forrester Research, The Centre for Retail Research and eMarketer
The reported share and scale of Internet retailing by country varies somewhat depending
on the statistical sources accessed, and there are also problems with data capture in such
a rapidly evolving industry; however, the figures all converge around the numbers shown.
Growth in the e-commerce channel is typically running at 12% to 15% compound, with
smaller markets growing faster and larger markets seeing slower compound growth as a
result of the percentage effects of scale. However, it is worth noting that, at the turn of the
century, Forrester Research forecast optimistically that 10% of retail would be online by
2005 (Forrester, 2000); that explosion in demand has taken longer to happen, but the trend
now seems inexorable.
1.2 Changing patterns of e-commerce access – the growth of
mobile
The speed of adoption of Internet retailing by UK consumers has made the UK a global
benchmark, although it is true that the US and Chinese markets are bigger in absolute scale,
and China is comparable to the UK in terms of proportions. Most recently the use of mobile
devices – tablets and phones – has fuelled growth by enabling ‘shopping-on-the-move’; this
is now termed ‘m-commerce’.
2 The Implications of Internet Shopping Growth on the Van Fleet and Traffic ActivityThe magazine and website InternetRetailing (Skeldon, 2015) reported for 2015 that:
“The UK’s shoppers are set to spend £14.95 billion via mobile devices in
2015, an increase of 77.8% on £8.41 billion in 2014, while PC spending will
grow by just 2%, finds international research conducted by RetailMeNot, the
operator of Vouchercodes.co.uk.”
That study forecast that in 2015 mobile devices would account for 28.6% of all online
purchases, with 16.5% made with smartphones and 12.1% on tablets. Personal computers
(PCs) will still dominate the online market with 71.4% of sales, but that is significantly
down on the 81.3% share seen in 2014. The forecast is that the hold of desktop PCs on
e-commerce will progressively decline. The report also found that the UK was forecast to
account for 39.4% of all m-commerce sales in Europe in 2015 (Skeldon, 2015).
Across Europe, the report forecasts that m-commerce sales would grow by 88.8% in 2015,
while UK growth was expected to be 77.8%. However, an equally big impact of mobile is its
role as a ‘shopping companion’ with almost 75% of mobile users regularly visiting retailers’
websites for pre-purchase search and investigation.
Table 1.1 shows data and forecasts on mobile commerce as reported by eMarketer; this is
consistent with, but exceeds, the conclusions from the InternetRetailing report. The forecast
is that by 2020, 10% of all retail sales, and nearly 45% of e-commerce sales, will be by
mobile device (eMarketer, 2016):
Table 1.1: UK retail m-commerce sales actual and forecast, 2014–20
UK retail m-commerce sales, 2014-2020
Year 2014 2015 2016 2017 2018 2019 2020
Retail m-commerce sales
(billions) £14.61 £20.09 £25.19 £30.19 £34.46 £38.56 £42.51
% change 70.8% 37.5% 25.4% 19.9% 14.1% 11.9% 10.3%
% retail e-commerce sales 27.7% 33.3% 37.1% 40.4% 42.3% 43.7% 44.7%
% total retail sales 3.6% 5.0% 6.3% 7.5% 8.4% 9.3% 10.1%
Source: eMarketer (2016)
Note: Includes products or services ordered using the Internet via mobile devices, regardless of the method of
payment or fulfilment; includes sales on tablets; excludes travel and event tickets.
There are two operating models of Internet retailing:
• ‘Pure play’ online retailers – companies that sell only online and do not sell
through shops; some of the most notable of these are Amazon, eBay, ao.com
(formerly Appliances Online), Ocado and the ShopDirect group (which grew out of
Littlewoods).
• Omnichannel retailers – companies that have both an online presence and physical
shops, sometimes known as ‘bricks and clicks’. Omnichannel retailers are trying
to provide an integrated offer with range, price and service consistency between
their websites and shops. Customers can browse, buy and return on whatever
www.racfoundation.org 3basis they find most convenient, without any difficulty. This is not always easy to
achieve operationally. Companies like Next, John Lewis, Argos, Tesco and Marks
& Spencer are notable exponents of omnichannel retailing. Not all retailers are as
developed in their operational integration, owing to factors such as limited shop
coverage, business size and the ranges offered – or simply business maturity.
1.3 Retailers’ responses to e-commerce growth and customer
preferences
Research by LCP Consulting on the relative merits and evolution of the omnichannel model
has been carried out over the last three years (LCP Consulting, 2013; 2014; 2015) by
means of interviews with executives, retail board directors and function managers in the
UK and USA. More than half of the respondents worked for retailers with more than 5,000
employees, and more than a quarter for retailers with over 20,000 employees; all had a
turnover in excess of £50 million.
Some headlines from this research were that:
• Omnichannel retailers (of those interviewed) are investing 3% of their turnover and
roughly £5 billion over five years in operational capabilities to capture the growth in
e-commerce. In many cases the return on this investment is unclear, as the future
behaviours of customers, and of the systems and service interfaces required, are
not known. It is a dash for growth and share (LCP Consulting, 2013: 5, 19).
• “It’s all about the customer” – today’s customers are more demanding than ever.
Shopper behaviour is fuelled by the desire to receive an increasingly personalised
retail experience. In an ever more digital world, competition is now multifaceted
therefore, for retailers to succeed, the highest of quality must be provided across
every single touchpoint along the customer journey. (LCP Consulting, 2014: 4).
• The three main advantages of moving to an omnichannel model are sales,
customer service and operating model.4 Omnichannel leaders reported achieving
improved sales growth as compared with the rest of the sample, securing
enduring differentiation and a competitive advantage by being able to respond to
ever-increasing customer expectations; they give more consistent delivery of the
customer promise and hence drive up loyalty (LCP Consulting, 2015: 10).
The research looked for the three main factors that underlie customers’ purchase decisions.
Figure 1.2 shows that among customers’ priorities, both price and service leapt ahead in
2015 compared with the previous year, increasing by seven and three percentage points
respectively.
4 The operating model is the configuration of the service offer, the pricing and charges, and the operational structure that achieves
the overall business economics.
4 The Implications of Internet Shopping Growth on the Van Fleet and Traffic ActivityFigure 1.2: The three main factors underlying customer purchase decisions
25%
20% 20%
20%
17%
15%
13% 13%
12%
10%
5%
0%
Price Customer service Assortment
2015 2014
Source: LCP Consulting (2015:12)
1.4 The customer delivery event: critical to retention and profit
Customers are indeed demanding – they want the best in both price and service. A key part
of service is speed. LCP Consulting’s respondents were asked in 2015 to rate the likelihood
of the following statement: “Within the next one to three years, the majority of my online
deliveries will be the same day or next day.” On a scale of 1 to 5 (with 5 being the most
likely), UK retailers scored 3.8 (LCP Consulting, 2015: 23). Speed is ‘of the essence’, and
that will only increase.
The Supply Chain Director of Argos is quoted in the report as saying (LCP Consulting,
2015: 14):
“Home delivery is one of the biggest brand impacts on retailers both
positively and negatively. When it goes right it is a big plus, and when it goes
wrong it’s a drag on customer perception of the brand.”
This conclusion is supported by research from IMRG (Interactive Media in Retail Group)
which found that future purchases of around 70% of customers may be strongly influenced
by the quality of delivery experience. While this number is in gradual decline, as illustrated in
Figure 1.3, the risk of a poor delivery experience is absolutely clear (IMRG, 2016a).
www.racfoundation.org 5Figure 1.3: Does a good delivery experience influence repeat purchase?
90%
78%
80%
75%
72%
70% 69%
70%
60%
50%
40%
30%
18%
20%
15% 16%15% 16%
14%
12%
10%11% 11%
10%
0%
2011/12 2012/13 2013/14 2014/15 2015/16
Yes No Maybe
Source: IMRG (2016a)
It might be expected that with growth comes profitability, but that is not actually the case.
There is widespread commentary to the effect that online and omnichannel retailing is
margin-erosive unless the operating structures and commercial control are well designed
and implemented. This was identified in the LCP Consulting research detailed earlier in its
discussion of creating sustainable business models. (LCP Consulting, 2015). Darrell Rigby,
writing in the Harvard Business Review, confirms that “Online shopping isn’t as profitable
as you think.” This article identifies that pure play online retailing does not guarantee to
generate good profitability, and that omnichannel players can easily experience degradation
of the economics of their shops as a result of growth in the online offer (Rigby, 2014). Recent
announcements by the John Lewis Partnership of staff reductions confirm this strategic issue.
1.5 Fast-track service based on vans: a core competitive lever
In summary, this section has highlighted the phenomenal rate of growth in the e-commerce
market in the UK, and its position as a world leader. Retailers are investing ahead of the
curve simply to stay in the game – some with clearly defined business models, others just
to catch up. Customers are firmly in control, enabled by ubiquitous Internet searching using
mobile technology; they are responding to competitive offers and are demanding the best in
terms of both price and service. It is clear that they are also expected to demand increased
speed of delivery, with next-day and same-day becoming the norm. The market expectation
is, increasingly, that retailers will be able to respond instantly.
6 The Implications of Internet Shopping Growth on the Van Fleet and Traffic ActivityAlmost every delivery is made by van at present; the only alternative is where the customer
collects their order – known as ‘click-and-collect’. Vans, the core subject of this report, are
taking the strain of the growth.
And the pressure on home delivery services from this trend is huge, since it is the final point
of contact with the customer, influencing their future purchase decisions – particularly if it
disappoints. It is also a major component of the cost-to-serve (the profitability or otherwise
of a customer account) in a market that is challenged for profitability.
In this context, it is important to understand how the burgeoning e-commerce marketplace
is causing an increase in van activity, as they rush from place to place under both time and
cost pressure. The next chapter looks at the volume of activity in the package and parcel
market, and how that market is currently served by vans.
www.racfoundation.org 72. The Parcel Market
Serving e-Commerce
The levels of activity in the Internet home delivery market are astonishing, and
this chapter describes its scale and provides forecasts for growth.
2.1 Estimating the scale of the parcel market
While the statistics assembled by different sources vary, figures generated
by IMRG using data provided by MetaPack, the leading package routeing,
labelling and tracking provider, are a key starting point. This dataset is
extrapolated from a large sample of 200 retailers, and is calibrated against
online retail sales as tracked by Capgemini. The correlation is reported to be
very strong – so the trending is considered as accurate as possible.
Their analysis points to more than 1 billion orders having been generated by
UK e-commerce fulfilment in 2015, with the forecast that this will increase to
1.7 billion by 2020. The data is shown in Figure 2.1, which splits the scale
of the market by domestic and international, and then further subdivides the
domestic market by economy and premium carriers, and click-and-collect. It
is important to remember this covers only business-to-consumer (B2C) data
stemming from e-commerce. Also the most common condition is that one
order equates to one delivery and one parcel; however orders can create more
than one parcel for delivery at the same time, or at different times. The mix
varies by retailer and national statistics are not available.
8 The Implications of Internet Shopping Growth on the Van Fleet and Traffic ActivityFigure 2.1: UK e-commerce market: levels of ordering and delivery activity
1800
1600
1400
1200
1000
Orders
800
600
400
200
0
2015 2016 2017 2018 2019 2020
Total UK-generated orders Total UK-to-UK volume Total UK delivery to home
UK economy home delivery volume Cross-border volume UK’carrier’ click-and-collect volume
UK express home delivery volume
Source: Extracted from IMRG Metapack Delivery Index Report October 2016
This IMRG MetaPack volume index and forecast shows the domestic order (UK-to-UK) total
of 840 million for 2015. Given that there were 27 million households in 2015 as reported by
the Office for National Statistics (ONS, 2016), this number implies that each UK household
places on average 31.1 orders per year, or 2.6 per month. Their forecast for UK-to-UK
orders for 2020 suggests there will be 1.3 billion orders – nearly one order per week on
average for every household.
Key additional points from the forecasts are:
• overall UK-to-UK growth will initially be 12% per year, declining to 10% per year in
2020;
• total UK home delivery growth will be 9.0% per year, declining to 5.6% per year;
• click-and-collect is forecast to grow by 32% in 2016 and over 30% per year till
2020, when its annual growth rate declines to 17.5%; and
• parcel carriers are therefore losing share to an emerging click-and-collect service,
which will be described later in this section.
This data and forecast is not the whole picture, however, as parcel carriers carry business-
to-business (B2B) parcels too, and also consumer-to-business (returns and repairs) and
consumer-to-consumer packages (for example family parcels); these latter two are termed
together as ‘C2X’. An attempt has been made below to triangulate this data with further
sources to ensure as much clarity as possible about all packages handled, whatever the
business purpose.
www.racfoundation.org 9Table 2.1 shows the total UK market for parcels, and the Royal Mail subset, including the
B2B segment, amounted to 1.7 billion parcels in 2013, as analysed and reported by Postal
and Logistics Consulting Worldwide for the Citizens Advice (Postal and Logistics Consulting
Worldwide, 2015).
Table 2.1: Total UK parcels market as at 2013 reported by Postal and Logistics
Consultants
Market
segment Split (%) Volume (m) Royal Mail market share (%) Royal Mail volume (m)
B2B 38% 655 40% 261
B2C 56% 965 50% 482
C2X 6% 103 80% 83
Total 1,723 826
Source: Postal and Logistics Consulting Worldwide (2015: 29)
More recently the total Royal Mail parcel volume was stated in its Report and Accounts
for 2015 as in excess of 1.1 billion per year, including nearly 170 million packages for
international shipment. By applying an overall annual growth rate of 4% from 2013 to 2015
and adding in the international volume, the 2013 and 2015 numbers for Royal Mail from
these two sources are aligned quite closely.
However, the total B2C market shown in Table 2.1 amounted to 965 million parcels in 2013,
which suggests that the 2015 figure from IMRG of 840 million (Figure 2.1) is understated by
some 370 million packages, based on an estimated 2015 total of 1.2 billion, derived using
the market growth rate of 12% a year from IMRG MetaPack. Explanations for the difference
are hard to pin down, but will include the following factors:
• eBay, and marketplaces5 in general, are excluded from the IMRG numbers;
• export and import volumes are not clearly defined, and might not have been
included in the IMRG numbers;
• B2B and B2C volumes may have intermingled;
• amazon.co.uk, including the volumes of its independent sellers, is not fully factored
in, since it has been moving its volume towards its own Amazon logistics and does
not participate in the IMRG data capture; its volumes with Royal Mail are in the
numbers in Table 2.1.
These areas could easily account for the discrepancy. But the scale of the e-commerce
delivery market is further increased in the following areas:
• Grocery online retailing is currently worth another £8.6 billion and is running at around
86 million orders per year (Allen et al., 2017: 25, Table 3.1). It is forecast to increase to
between £15 billion and £18 billion by 2020, which implies 150 million to 180 million
orders at an average of £100 per order. Average order values are known to be falling
(Ocado, 2017), so the number of orders could realistically be 200 million by 2020.
5 Marketplaces are digital platforms giving many independent traders customer access on a single website; eBay is perhaps the
most well known.
10 The Implications of Internet Shopping Growth on the Van Fleet and Traffic Activity• The figures do not include the captive click-and-collect volumes of major retailers
such as Argos, John Lewis and Marks and Spencer, which industry sources
indicate to comprise between 30% and 50% of such companies’ orders.
Using the insights from this analysis and triangulation (cross-checking) of sources, and
grossing up from the Postal and Logistics Consulting Worldwide’s 2015 report, an attempt
has been made to create a consolidated best estimate of the scale of the total parcel market
for all channels and segments. This is shown in Table 2.2 and gives a further uplift on the
previous numbers.
Table 2.2: Compilation of a best view of the total UK parcels market, 2016
Parcel segment Million parcels Source
Postal and Logistics Consultant’s report 2013 grossed up
Business-to-business 737
by 4% p.a.
Business-to-consumer
Derived from IMRG Metapack, adjusted by LCP for gaps
General merchandise 1,550
using carrier volume estimates
Food 86 Derived from IGD data by LCP Consulting
Captive click-and-collect 200 Estimated by LCP Consulting
1,836
Postal and Logistics Consultant’s report 2013 grossed up
Consumer-to-X 109
by GDP growth
Total market 2,682
B2C share of all deliveries 68%
B2C total transactions 1,836 Million transactions including click-and-collect
Source: Analysis by LCP Consulting
Table 2.2 shows that the total market for e-commerce deliveries is now dominated by the
B2C segment, with 68% of the entire market. Out of a total market of 2.7 billion packages,
e-commerce accounts for around 1.8 billion deliveries and collections for 2016.
2.2 The van resources that service the parcel delivery market
With the scale of the delivery challenge established, its impact on the courier and delivery
resources engaged in satisfying customers’ expectations for reliable delivery can be
examined. Again it is a case of piecing together the picture from a variety of sources.
The Van Excellence Report 2015–16 published by the Freight Transport Association (FTA,
2015) provides an outstanding appreciation of the importance of vans in the economy, and
focuses in part on the importance of vans for e-commerce. The principal points from the
report that are germane to this study are:
• There are 13,000 postal and courier firms in the UK, with the largest being Royal Mail.
• The post and parcel sector has an estimated fleet of 312,000 vehicles, of which
255,000 are company-owned, 42,000 are registered to individuals, and 15,000 are
involved in grocery home delivery.
www.racfoundation.org 11• The Van-Dependency Index (the number of vans per £1 million of economic gross
value added) for the postal and courier segment is the highest of any sector using
vans at 28.73; the next highest figure is that for specialised construction trades,
where the index is considerably less, at 15.9.
• It states that postal and courier vans between them constituted around 8% of the
van parc of 3.7 million vehicles in the UK at the end of Q2 2015.
On the role of vans in e-commerce, the FTA report states (FTA, 2015: 16) that:
“The e-commerce revolution, which has seen changing UK purchasing
patterns, could not be sustained without the LCV parc.”
The Van Excellence Report provides a useful anchor reference of the relative importance of
vans for e-commerce in terms of the total van parc, and hence the generation of traffic – the
main purpose of this report. It suggests that vans for parcel, post and grocery delivery total
just 8% of the total vans on the road – in other words they form an important, but not a
dominant, segment of van usage.
An attempt was made to validate the 8% proportion stated in the report on a bottom-up
basis, by both extrapolating the need for vans using average daily delivery activity and
looking at the major operators’ fleet sizes – and the characteristics of the vans they use.
The total parcel market, at 2.7 billion packages (see Table 2.2) including B2B and C2X
packages, would require just 110,000 vehicles if every van ran for six days per week
excluding bank holidays, and delivered 80 packages per day on average. Against this
average, on the upside, industry experts working with delivery companies Yodel and
Interlink/DPD have confirmed that a parcel delivery target is typically 120 to 150 per van day;
a recent BBC programme on Amazon confirmed 150 per day as being required of drivers.
At the lower end, where there is a different business model, Hermes couriers and Royal
Mail postmen can be making as few as 20 to 80 parcel deliveries per day. An average of
80 appears to be a good starting point, and this top-down analysis suggests that the FTA
estimate of the active fleet is too high.
Industry sources were used to compile a bottom up picture of van fleets, which generated
the numbers shown in Table 2.3.
12 The Implications of Internet Shopping Growth on the Van Fleet and Traffic ActivityTable 2.3: The major operators of van fleets in business-to-business (B2B) and
business-to-consumer (B2C) package delivery
Segment Operator Vans Vehicle type
Economy–mostly B2C
Royal Mail incl. Parcelforce 49,000 Small and medium vans
Lifestyle couriers-cars, car-derived and
Hermes couriers 9,500
small vans
Amazon couriers 3,800 Subcontractors out of 12 depots
Yodel 6,000 Mostly medium and large vans
68,300
B2B and B2C Premium
Interlink 2,500 Mostly 3.5-tonne vans
DPD 3,500 Mostly 3.5-tonne vans
DHL International 1,500 Mostly 3.5-tonne vans
UK Mail 2,400 Medium and large vans
APC 5,000 Mostly 3.5-tonne vans
Tufnells 800 Mostly 7.5-tonnes GVW
DX 2,800 Medium and large vans
UPS 2,200 Medium and large vans
Fedex 2,700 Medium and large vans
TNT 3,500 Mix of 3.5-tonne and 7.5 tonne
Remaining operators 20,000 Applying the 80:20 rule
46,900
Grocery Home Delivery
Tesco 4,000 3.5-tonne GVW vans
Asda 2,500 3.5-tonne GVW vans
Sainsbury 1,800 3.5-tonne GVW vans
Iceland 1,700 3.5-tonne GVW vans
Ocado 1,400 3.5-tonne GVW vans
Waitrose 700 3.5-tonne GVW vans
Morrisons 500 3.5-tonne GVW vans
Abel and Cole 200 3.5-tonne GVW vans
12,800
Total 128,000
Source: LCP Consulting; Triangle Research (2016); Internet research and industry inquiry
This compilation of the major van fleets may not be perfect, but is close to the 110,000
number derived earlier on the basis of delivery activity. Neither analysis approaches the
312,000 vans in the Van Excellence Report. However, for grocery home delivery the number
of vans reported as in use, at 12,800, is close to the 15,000 in the Van Excellence Report.
www.racfoundation.org 13Vans are used to deliver food to restaurants, plumbing supplies to building sites, printed
matter to newsagents, and for so many other non-Internet activities. Some of these will
fall into the general courier category, delivering anything from parts to printed material and
providing regional express delivery services. This wider courier fleet is inside the larger FTA
number of 312,000 vehicles; however, industry experience is that few of these vans deliver
the volumes defined in Table 2.2, except perhaps at peak demand.
These two pieces of analysis point to the share of the van parc used to service the parcel
market and grocery e-commerce market as being less than 4% – rather than the 8%
headlined earlier in this chapter. Since e-commerce represents only 68% of all parcel traffic,
the attribution of the parc specifically to e-commerce could be as low as 2.5%.
2.3 The impact of the growth in click-and-collect on delivery
volumes
To develop a picture of the growth in van activity for parcel delivery between 2016 and 2020,
it is necessary to first derive a forecast of how the continued increase in click-and-collect
might erode the potential need for courier and parcel traffic. Earlier in this section, click-and-
collect was shown to be limiting parcel delivery growth to between one half and two thirds
of the growth in the e-commerce market. This is a critical projection, and the underlying
trend needs to be described further, since it will influence the future growth in van use for
e-commerce.
The IMRG/Capgemini Quarterly Benchmarking Index reported in 2016 on the trend for
e-retail shopping using click-and-collect. This is shown in Figure 2.2; the main point is that
the use of click-and-collect has increased from 10% of the market for online orders to 29%
in the space of four years (IMRG, 2016b).
14 The Implications of Internet Shopping Growth on the Van Fleet and Traffic ActivityFigure 2.2: Click-and-collect sales as a percentage of sales completed online
35%
30%
Percentage of online sales
25%
20%
15%
10%
5%
0%
11 11 11 11 12 12 12 12 13 13 13 13 14 14 14 14 15 15 15 15 16 16 16 16 17 17 17
1 0/ 10/ 10/ 10/ 11/ 11/ 11/ 11/ 12/ 12/ 12/ 12/ 13/ 13/ 13/ 13/ 14/ 14/ 14/ 14/ 15/ 15/ 15/ 15/ 16/ 16/ 16/
20 20 20 20 20 20 20 20 20 20 20 20 20 20 20 20 20 20 20 20 20 20 20 20 20 20 20
1 2 3 4 1 2 3 4 1 2 3 4 1 2 3 4 1 2 3 4 1 2 3 4 1 2 3
Q Q Q Q Q Q Q Q Q Q Q Q Q Q Q Q Q Q Q Q Q Q Q Q Q Q Q
Source: IMRG (2016b)
Customers can have many different preferred delivery methods, including click-and-collect,
as is shown in Figure 2.3.
Figure 2.3: Customer preferences for fulfilment methods
Click-and-collect from a locker location
Delivered to my workplace
Click-and-collect from a parcel depot
Click-and-collect from a shop
(e.g. the retailer I have brought from)
Click-and-collect from a supermarket
Delivered to a friend/relative
Click-and-collect from my local convenience store
Click-and-collect from the Post Office
Delivered to my home
0% 10% 20% 30% 40% 50% 60% 70% 80% 90% 100%
Source: IMRG (2016a)
www.racfoundation.org 15The data in the figure comes from a 2016 report from CollectPlus on the cost of waiting
for a delivery. The percentage preferences in this chart sum to more than 100%, which
is explained by customers accepting goods down different channels depending on their
specific circumstances at the moment of purchase – although home delivery is clearly their
first choice. The use of click-and-collect is enabled by their use of mobile technology, and is
driven by convenience when they are on the go (IMRG, 2016a).
Figure 2.4 provides a view on what motivates customers’ decisions to collect from a
shop, and shows that price remains the major factor; all the experience of the author is
that delivery or collection method is extremely sensitive to the cost charged for the event.
One retailer that changed their terms to favour collection over delivery saw a 60% shift in
preference within the space of three weeks. Customers make quite careful and rather quick
choices between cost and convenience.
Figure 2.4: Motivations to use click-and-collect
100%
90%
80%
70%
60%
50%
40%
30%
20%
10%
0%
Delivery is free/cheaper You are rarely at You can examine/try It is easier to return You are able to
than home delivery home to receive a on your purchase and get credit if the combine this with
home delivery goods are not wanted other shopping activity
2012/13 2013/14 2014/15 2015/16
Source: IMRG (2016a)
16 The Implications of Internet Shopping Growth on the Van Fleet and Traffic ActivityThe implication of this analysis is that if retailers start seeking to optimise their profitability
rather than continue trying to grab e-commerce market share, the forecast of parcel growth
as against click-and-collect is likely to move further in favour of click-and-collect. Since the
typical cost to retailers of a delivery is in the range £3 to £5, while that for a click-and-collect
is between £1 and £1.50, retailers who have been funding the home delivery as a marketing
cost stand to gain savings of millions of pounds.6
2.4 Developing a forecast of parcel volumes for 2020
Using the information compiled in this section, an estimate of the parcel market and the
likely capacity required to service its projected growth has been developed, starting from the
estimate of the total parcel market given in Table 2.2. It has been derived from projections of
growth in e-commerce package delivery declining from 9% in 2016 to 5% in 2020 – allowing
for its partial substitution by click-and-collect. The market for B2B has been assumed to
grow in line with the economy as a whole. The high-level delivery metrics for the sector have
been carried over. The headline forecast is:
• The market for online e-commerce parcels is expected to grow by 600 million
parcels between 2015 and 2020 covering both delivered and click and collect.
• The overall market for B2C, B2B, grocery and C2X is expected to grow by
between 800 and 900 million parcels and deliveries by 2020.
• The total activity in the market to be serviced by vans or click and collect in 2020 is
therefore estimated at around 3.5 billion deliveries and collections, of which around
3.1 billion will be deliveries.
• The core fleet of vehicles for servicing all parcel deliveries represents less than
4% of the van parc (around 130,000 vans), and the proportion attributable to
e-commerce is around 2.5%.
• Using the metrics established earlier in this chapter, the van fleet will increase by
not more than a further 35,000 vehicles (net addition to the parc) by 2020.
• This is a 1% increase over five years on a van parc that is currently estimated at
3.7 million.
On the basis of this evidence, the case against vans for e-commerce deliveries as a
traffic ‘bête noire’ does not appear to be strong. But the role of vans in relation to traffic
congestion and air quality still needs to be examined, as this may show that this small
percentage of the parc is contributing disproportionately to the acknowledged problems.
The next chapter looks at traffic patterns, vans and congestion.
6 Figures based on the author’s industry experience.
www.racfoundation.org 17You can also read