US Solar Power Growth through 2040 Exponential or inconsequential? - Deloitte
←
→
Page content transcription
If your browser does not render page correctly, please read the page content below

US Solar Power
Growth through 2040
Exponential or
inconsequential?

September 2015

Contents

1    Executive summary

2    Introduction

3    Lend me your crystal ball

9    Two sides of the same coin: Enablers and
     constraints for US solar power growth
     through 2040

24   Continued exponential growth—what would
     it look like?

31   Concluding thoughts

33   Endnotes

36   About the authors

37   Acknowledgements
Executive summary

This paper provides perspectives on the long-term growth
trajectory for solar power in the US. Our goal in writing it is
to provide managements of solar and electric companies,
as well as companies in related industries and their
stakeholders, with insights to inform their strategies related
to solar power in the US. In the context of the evolving US
electric power industry and ecosystem, this paper provides
a perspective on one of several exponential technologies
that are transforming the industry.

Key takeaways:

1. Projections for long-term US solar power growth vary
   widely, and while most foresee growth moderating
   from recent exponential rates, the potential for
   continued exponential growth is worth consideration,
   as it has happened with other technologies. Solar
   power growth may continue to outpace most
   conventional projections.

2. Many factors may constrain or enable solar growth,
                                                                  This paper is informed by interviews and discussions with
   such as the cost of solar and enabling technologies;
                                                                  a number of experts from across the solar power industry,
   the rate of technological advances; the evolution of
                                                                  government research labs, solar industry associations,
   policies such as fiscal incentives and carbon reduction
                                                                  academic faculty devoted to energy research, and other
   programs; utility rate reform; and evolving financial
                                                                  stakeholders. A list of interviewees is provided at the end
   structures, business models, and customer sentiment.
                                                                  of the paper.

3. Regardless of the rate of solar growth in coming
   decades, solar power and other exponential
   technologies are already penetrating the traditional
   electric value chain and driving change throughout that
   value chain. How it plays out is uncertain, but what is
   certain is that now is the time for electric utilities and
   other electric value chain participants to embrace these
   technologies and the operating models and business
   ecosystems they imply.

                                                                                           US Solar Power Growth through 2040 Exponential or inconsequential?   1
Introduction

Projecting the path of a rapidly growing technology like

                                                                  “In 2016, 75 percent of all
solar power more than a few years forward is dicey at
best; many unpredictable variables inject a large dose of
uncertainty into the equation. Evolving cost structures,
new business models, developing technologies, policies
and customer attitudes are just a few pieces of the puzzle
                                                                  new generation will be solar.”
that may determine solar power’s future. So it’s not
surprising that forecasts for US solar power penetration by       Jigar Shah, Co-Founder Generate Capital Inc.
2040 do, indeed, range from almost inconsequential levels
to an exponential progression in which solar accounts for
                                                                  and Founder SunEdison
nearly all US power generation by 2030.
                                                                  Whether solar power follows those trajectories or not,
Energy industry analysts and executives discount the              its growth has been outpacing conventional projections
exponential scenario almost without exception, labeling           for some time and will likely continue to do so, especially
it naïve and unrealistic. While a US powered almost               given the recent breakneck speed of residential and
exclusively by the sun within 15 years is highly doubtful,        commercial solar installations. For example, in 2000, the
we’ll take a look “under the hood” of the exponential             US Energy Information Administration (EIA) projected US
scenario in addition to the others explored in this paper for     solar generation would total about 2.6 billion kilowatt
the following reasons: First, solar power has already been        hours (kWh) in 2015.1 Fast forward to 2014, and the
growing exponentially in the US and globally for at least a       country generated nearly 29 billion kWh of solar power,
decade, and there are some important trends underlying            with EIA projecting more than 36 billion kWh in 2015,
that growth. While such rapid growth is common for                roughly 15 times the amount projected 15 years earlier.2
successful new technologies, and it’s natural for growth          Most other sources also failed to anticipate the rapid
to plateau and then slow, technological change in general         growth seen in recent years. Likewise, it’s challenging to
is accelerating faster, and history tells us that sudden          project how long this exponential growth will continue
disruptive and largely unpredictable technology shifts do         and when, or if, the US will reach a point where the
occur. We have only to look back at the adoption of the           majority of electric power is generated from the sun.
automobile, the cell phone, or electricity itself to find other
examples of technologies whose growth followed an                 This paper will explore several projections for US solar
exponential progression for an extended period of time. In        power growth, including two scenarios from the EIA, two
each of these cases, analysts in the original core industry       from the National Renewable Energy Laboratory (NREL),
were taken by surprise at the speed with which these              one from a leading renewable energy data provider, and,
innovations displaced prior technologies.                         finally, the picture painted by those who contend that
                                                                  recent exponential growth rates will continue unabated.
                                                                  We’ll examine the enablers and constraints for solar
                                                                  growth and the most promising technologies, innovations,
                                                                  and trends that could promote continued exponential
                                                                  growth.

2
Lend me your crystal ball

To explore projections for US solar power growth through                       In the solar power generation scenarios depicted in Figure
2040, we’ll start with the last 10 years history and                           1, the EIA and others project a slower growth rate beyond
compare government and private energy data providers’                          2014. For example, the compound annual growth rate
projections for the next 25 years, through 2040. Then we’ll                    (CAGR) of US solar generation in billion kWh in the last 10
add a more aggressive scenario, from those who expect                          years (2004–2014) was 43 percent, climbing to 59 percent
continued exponential growth, in a separate graph, since                       in the last five years (2009–2014). The lines in Figure 1
it changes the scale considerably. We chose 2040 because                       do not appear to be advancing very rapidly before 2015
it is consistent with the 25–30 year utility planning horizon                  because the absolute amounts were so small, but it was
for major capital expenditures such as power plants. We’ll                     actually more than doubling every two years. Between
focus on total US solar power generation, in billion kWh.                      2014 and 2040, however, the EIA projects the CAGR will
                                                                               slow to about 5 percent.3 Bloomberg New Energy Finance
                                                                               (BNEF) pegs growth at about 12 percent from 2014–
                                                                               2040,4 and NREL’s SunShot scenario, the most aggressive,
                                                                               projects a CAGR above 15 percent.5 The Department
                                                                               of Energy’s (DOE) SunShot Initiative aims to make solar
                                                                               energy cost-competitive with other forms of electricity by
                                                                               2020.6 The pace of growth in all of these scenarios is well
                                                                               below the 43 percent CAGR witnessed in the last decade.

Figure
 Figure 1:
        1: Total historical
           Total US         and projected
                    solar power  generationUS solar power
                                            2004–2040      generation,
                                                       (billion kWh) 2004–2040

            1,400
            1,400

            1,200
            1,200

            1,000
            1,000

              800
              800
Billion kWh
              600
              600

              400
              400

              200
              200

                 00
                                            2012

                                                                                  2022

                                                                                                                     2032
                       2006

                              2008

                                     2010

                                                   2014

                                                          2016

                                                                 2018

                                                                        2020

                                                                                         2024

                                                                                                2026

                                                                                                       2028

                                                                                                              2030

                                                                                                                            2034

                                                                                                                                   2036

                                                                                                                                          2038

                                                                                                                                                 2040

                                                                                     Year
                                                                                     Year
                                 EIA
                                  NREL 2015        EIA - CPP
                                                           NREL SunShotNREL 2015BNEF                BNEFEIA - CPP NREL SunShot     EIA
Source notes:
EIA — EIA’s “Reference Case” scenario from 2015 Annual Energy Outlook
EIA-CPP — EIA’s “Base Policy” scenario models the impact of EPA’s proposed Clean Power Plan
NREL 2015 — The “Central Scenario” from NREL’s 2015 Standard Scenarios Annual Report assumes utility-scale solar PV costs fall to $1.50/Watt by
2020 and to $1/Watt by 2030
NREL SunShot — The NREL SunShot Vision Study projection from 2011 assumes utility-scale solar costs meet the SunShot Initiative’s target of
$1/Watt by 2020 and stay there.
BNEF — Bloomberg New Energy Finance, 2015 New Energy Outlook — Americas

Note: Historical data through 2014 is from EIA. NREL’s near term data for 2015-2018 is adjusted to match the EIA Reference Case, as NREL is
updating its database with new plant information. NREL projections are biannual, so data points for odd-numbered years were provided by
calculating the midpoint between adjacent years.

                                                                                                              US Solar Power Growth through 2040 Exponential or inconsequential?   3
Exploring the exponential scenario                               These theorists point to solar’s exponential growth in the
The many factors that impact these projections will be           last 20 years and suggest a similar pace will continue due
discussed further in the next section. But first, let’s engage   to exponentially advancing technologies. Diamandis wrote
in a thought experiment by exploring a final scenario,           in 2014 that seven more doublings of solar capacity are
which is a bit more controversial, both because it is            required to meet all global energy needs and this would
difficult to envision, and because it is largely espoused by     occur in about 20 years.7 Kurzweil suggested in 2011
thought leaders outside the energy industry. This scenario       that it would take eight more doublings, which would
shows global and US solar power continuing to grow at            happen in 16 years (by 2027).8 When we extrapolate
the recent exponential pace until solar power becomes the        the 2004–2014 US growth rate forward from 2014, it
predominant source of electricity by about 2030.                 takes about 15 more years for US solar generation to
                                                                 equal total projected US electricity generation, as we will
Those who imagine this scenario include inventor and             demonstrate below. The technological advances they
futurist Ray Kurzweil; engineer, physician, and innovator        suggest will underpin this scenario include continuing
Peter Diamandis; and entrepreneur, educator, and business        progress in solar panel, battery storage, and electric vehicle
consultant Tony Seba, among others. None of them have            (EV) technologies (i.e., rising EV production would help
roots in the traditional electric power industry, which may      reduce battery costs, enabling wider use of electricity
prompt some to discount their projections. But in the past       storage to mitigate solar intermittency, and spurring solar
they have projected with some accuracy the rapid spread          growth). “The convergence of solar, batteries, and EVs
of other technologies, such as the internet and mobile           will democratize energy production and offer billions of
phones, when others foresaw more moderate growth.                people access to cheap, carbon-neutral energy,” Diamandis
In the case of solar power, the scenarios they describe          writes.9 They also mention satellite-earth imaging,
sometimes lack specific details, although not in the case        nano-technology, and digital technologies as enabling
of Seba, who has written a book that discusses solar             technologies for solar growth.
disruption.
                                                                 Similarly, Tony Seba writes “Should solar continue on its
                                                                 exponential trajectory, the energy infrastructure will be
                                                                 100 percent solar by 2030,” and follows by suggesting
                                                                 “the solar growth rate could actually accelerate (beyond
                                                                 that rate).”10 We will explore the reasoning behind these
                                                                 statements further in the upcoming sections. First, let’s do
                                                                 the math.

4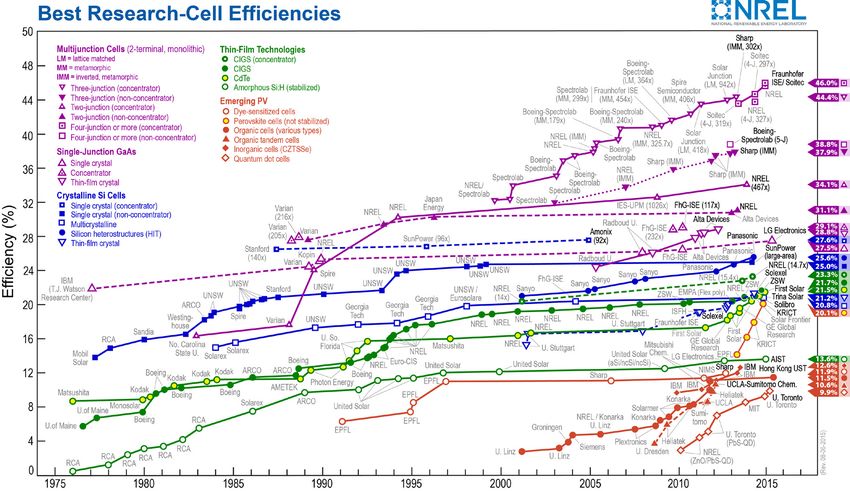
To start, we’ll define the term “exponential.” As many                   When charted at logarithmic scale (base 10) in Figure
readers will remember from math class, if a quantity                     3, it’s almost a straight line, which is an indicator of an
changes (increases or decreases) by a fixed fraction per unit            exponential progression. To project these exponential
time, (for example, 25 percent per year), the quantity is                growth rates forward, we will use the CAGR for US solar
said to be changing exponentially. An example would be a                 generation from 2004–2014 (43 percent) from Figure 3.
population that increases (or decreases) by 5 percent each
month.11 Solar power generation for the last 10 years did
not grow by a precisely constant percentage. But in Figure
2, you can see that while the pace accelerated during the
period, the numbers roughly doubled every two years, at a
CAGR of about 43 percent.

Figure 2: US solar generation growth, 2004–2014
 US Solar Generation
                               2004     2005      2006         2007      2008      2009     2010     2011    2012     2013      2014
 (Billion kWh)
 EIA Total Solar
                               .81      .83       .95          1.35      2.08      2.83     4.06     6.24    11.23    18.54     28.87
 Generation
Source: EIA Annual Energy Outlook 2015 Reference Case

Figure 3:
Figure 3: US solar generation growth, logarithmic scale

              100

          100

               10

Billion kWh
              10
                   1

                        2004    2005       2006         2007      2008       2009         2010     2011     2012     2013       2014
               1
               0.1

                       2004    2005       2006          2007      2008          2009      2010      2011     2012       2013       2014
                                                                            Year
           0.1                                                    EIA Total Solar Generation
Source: EIA Annual Energy Outlook 2015 Reference Case

                                                                  EIA Total Solar Generation

                                                                                                    US Solar Power Growth through 2040 Exponential or inconsequential?   5
As you can see in Figure 4, projecting this historical growth              But first, let’s look at two underlying trends that have
rate forward yields a dramatic increase in solar generation,               contributed to solar power’s accelerating growth—
intersecting with the EIA’s projection of total US generation              exponentially declining costs and rapidly improving
by about 2029 (the exponential trajectory would extend                     efficiency of solar panels. The conviction that these trends
higher, but we leveled it off when it surpassed EIA’s                      will continue is at the foundation of some of the more
total US electricity generation projection for each year).                 aggressive projections for solar growth.
Of course, one should always be skeptical of any such
“hockey stick” projections.

As noted earlier, many government and energy industry
analysts do not see this growth trajectory as realistic, nor
do many solar industry executives, even in their best case
scenarios. We’ll explore some of the assumptions behind
this scenario in a later section, so you can evaluate them
yourself.

       4: Total
Figure 4: Total US
                historic and projected
                   solar power         US Historical
                               generation solar powerandgeneration, 2004–2040
                                                         projected 2004-2040 (billion kWh)

              6000
               60006000

              5000
               50005000

              4000
               40004000
              Billion kWh

Billion kWh 3000
             3000
                                3000

              2000
               2000
                                2000

              1000
               1000
                                1000
                            0
                                0
                                    0

                                                                                 Year
                                                                                   Year
                                    EIAEIA - CPP
                                               EIA - CPPNREL 2015     NREL SunShot
                                                               NREL 2015      BNEF           BNEF     10-year CAGR
                                                                                              NREL SunShot         (43%)CAGR (43%)
                                                                                                                10-year       EIA
                                         EIA - CPP       NREL 2015     NREL SunShot           BNEF     10-year CAGR (43%)      EIA
Source notes:
EIA — EIA’s “Reference Case” scenario from 2015 Annual Energy Outlook
EIA-CPP — EIA’s “Base Policy” scenario models the impact of EPA’s proposed Clean Power Plan
NREL 2015 — The “Central Scenario” from NREL’s 2015 Standard Scenarios Annual Report assumes utility-scale solar PV costs fall to $1.50/Watt by
2020 and to $1/Watt by 2030
NREL SunShot — The NREL SunShot Vision Study projection from 2011 assumes utility-scale solar costs meet the SunShot Initiative’s target of
$1/Watt by 2020 and stay there
BNEF — Bloomberg New Energy Finance, 2015 New Energy Outlook — Americas
The 10-year curve is extrapolated using the CAGR of US solar power generation from 2004-2014 (43%) and leveled off when it reached EIA’s total
generation projections

Note: Historical data through 2014 is from EIA. NREL’s near term data for 2015-2018 is adjusted to match the EIA Reference Case, as NREL is
updating its database with new plant information. NREL projections are biannual, so data points for odd-numbered years were provided by
calculating the midpoint between adjacent years.

6
Solar photovoltaic (PV) costs are declining                                  One snag some analysts point to is that Swanson’s Law
exponentially due to scale and efficiency gains                              applies only to solar module costs, which are a shrinking
As illustrated in Figure 5, solar PV costs have fallen                       portion of total system costs. As a result of falling module
sharply as solar installations have increased. This is due                   costs, balance of system (BOS) costs now comprise more
to an experience curve that some have equated with                           than half of the total cost of a solar installation.14 These
the well-known “Moore’s Law” in the semi-conductor                           costs include equipment such as inverters and racking, plus
industry. However, the experience curve observed in solar                    soft costs like installation, labor, permitting, financing, and
PV production is commonly known as “Swanson’s Law.”                          customer acquisition costs. The DOE’s SunShot initiative is
Moore’s Law was an observation by Intel’s Gordon Moore                       focused on decreasing BOS costs, and a Berkeley Lab study
in 1965 that the number of transistors on an integrated                      suggests BOS costs will continue falling as the US market
circuit would double every two years, increasing processing                  achieves scale, similar to Germany, where solar system
power.12 Swanson’s Law was an observation by Richard                         installed costs are roughly half those in the US.15
Swanson, the founder of SunPower Corporation, that since
the 1970s, for every doubling of global shipments of PV
cells, the module cost drops by about 20 percent.13 These
cost reductions result from the benefits of experience;
for example materials costs fall with scale and labor costs
decline through manufacturing automation.

Figure 5: Swanson’s Law—module costs decline as shipments increase
Figure 5:

            100                  1977
                      1976
                                        1978
                                           1979
                                            1980      1981
                                                                1983
                                                     1982
                                                                       1985
             10                                                               1990
                                                                                      1997
                                                                                              2001      2006
 Module
  cost                                                                                                              2009
 $/watt                                                                                                                 2010
              1
                                                                                                                                  2014

            0.1
                  0               1                 10               100              1,000            10,000           100,000          1,000,000
                                                              Cumulative module shipments (MWp)

Source: SEMI (the global industry association serving the manufacturing supply chain for the micro- and nano-electronics industries,
including PV); International Technology Roadmap for Photovoltaic (ITRPV)

                                                                                                            US Solar Power Growth through 2040 Exponential or inconsequential?   7
Solar cell efficiency is improving rapidly with                            As solar costs decline, residential system sales
technological progress                                                     increase exponentially
Another contributor to fast declining solar PV system                      As solar system costs have declined across US residential
costs is the increasing efficiency of the cells themselves.                markets, it’s no surprise that sales have accelerated
Advances in solar cell technology mean the same square                     accordingly. In fact, the US solar industry’s largest
foot of solar panels now captures more power from the                      residential installer, SolarCity Corp., has highlighted its
sun, providing greater energy output and thereby reducing                  own exponential sales trajectory and publicized its goal to
the cost of each watt of electricity produced.16 Figure 6                  reach one million customers in the five year period from
shows the best results researchers have achieved in solar                  2013–2018.17 So far, the company appears to be close to
cell efficiencies for various PV technologies since 1976, and              its goal of roughly doubling its customer base annually;
the trend is clearly moving upward.                                        it grew by 96 percent year-over-year in 2014, to nearly
                                                                           190,000 customers, and by almost 40 percent in the first
                                                                           half of 2015, to 262,000.18

                                                                           So, what is a realistic scenario for US solar generation
                                                                           growth over the next 15 to 25 years? In the next sections,
                                                                           we’ll discuss some of the key technology, cost, and
                                                                           consumer trends enabling the growth of the solar industry,
                                                                           as well as those factors that could potentially constrain
                                                                           that growth.

Figure 6: Best research-cell efficiencies, 1976–2015

Source: National Renewable Energy Laboratory. For a larger view, go to: http://www.nrel.gov/ncpv/images/efficiency_chart.jpg

8
Two sides of the same coin:
Enablers and constraints for US solar power
growth through 2040
Projecting the path of US solar growth in the short or long-term is a matter of weighing the impact of many factors that
will likely enable or constrain growth during the period. Frequently, enablers and constraints are two sides of the same
coin, and will impact solar power growth positively or negatively depending on how the issues evolve. Figure 7 outlines
the variables that impact solar power’s future in the US, followed by further discussion of each one.
Figure 7: Enablers and constraints for US solar power growth
Enablers Constraints
Costs
Solar system costs are declining fast Total system costs still a deterrent in many areas
Technological progress
Technological advances are spurring additional cost Research funding may be declining and barriers are high
reductions and rapid growth for new solar technologies
Grid integration
Experience and new solutions are enabling integration of Variable solar must be balanced with other resources to
increasing volumes of variable renewables like solar avoid unanticipated voltage fluctuations or circuit overload
Enabling technologies
Other rapidly advancing technologies, like storage, can Technologies such as battery storage may be
enable further solar growth uneconomical for large-scale solar back-up
Cost of capital
Financial innovations are reducing the cost of capital for
Solar growth can be limited by the high cost of capital
solar systems
Addressable market
New business models are enhancing solar power’s reach Not everyone owns their rooftop, has good credit, or
and value proposition access to capital
Policies
New policies may support solar growth and existing Key incentives are expiring and new policies are evolving
incentives may be extended that may add costs
Carbon
Rising cost of carbon emissions could make solar Other existing and emerging low carbon technologies
increasingly attractive could compete with solar
Competition
Natural gas and electricity prices are projected to rise, Natural gas prices are relatively low and it often
which may make solar more competitive out-competes solar as a source for new generation
Adoption
Customer sentiment increasingly favors solar power and Scant need for new generating capacity and stagnant
falling costs may spur future adoption electricity demand may slow future adoption
US Solar Power Growth through 2040 Exponential or inconsequential? 9Costs: Will solar costs decline fast enough to In some cases, large solar developers have already reached
continue supporting rapid growth? the SunShot goal. Speaking at an industry conference
Sharp cost declines have been a primary driver of growth in June 2015, First Solar CEO Jim Hughes said, “I don’t
and will likely continue to spur adoption, though some remember the last time I saw pricing that had a 7- or
suggest costs may not fall fast enough to offset the effects 8-cent price in front of it...we’re regularly bidding in at...
of pending policy changes. “There’s a high degree of price 5- and 6-cent power. We’re beginning to see 4- to 5-cent
elasticity and unfettered growth based on economics. power. I fully believe that within 10 years we’ll be talking
The decrease in costs is amazing and there’s no end in about low-3-cent power on a peak basis.”22
sight,” said Dan Shugar, chief executive officer (CEO) of
NEXTracker, which provides tracking systems to help PV As discussed earlier, the solar industry is focusing on
installations follow the sun’s path.19 Indeed, the industry reducing BOS costs in the near future, since module costs
is ahead of schedule to meet the DOE’s SunShot Initiative have already fallen sharply.23 “Balance of system costs
goals, which aim to reduce the total installed cost of continue to decline; inverters are becoming more efficient
solar systems to $.06 per kWh by 2020, which the DOE and cheaper, and in particular the cost of acquisition is
considers “grid parity.”20 Three years after the program’s coming down. Companies are deploying technology and
inception, SunShot is already 70 percent of the way sophisticated sales techniques to lower acquisition costs,”24
there, as the average price of a utility-scale PV project has said Rhone Resch, president and CEO of the Solar Energy
dropped from about $0.21 to about $0.11 per kWh.21 Industries Association (SEIA).
Despite continuing cost declines, analysts point out that
the variable nature of solar power means systems must be
“I think solar will easily get to backed up by additional generation, transmission, storage,
or other resources, all of which can add significant costs.
10 percent of generation within In addition, today’s declining costs still depend heavily
on incentives such as the investment tax credit (ITC), net
a decade—if not more. It took metering, and other federal and state policies, some of
which are scheduled to expire or are under review. All of
40 years to get the first 1 these issues will be discussed further below.
percent—we could get to 10 Another potential constraint in the cost category is that as
solar penetration increases in specific locations, the market
times that in the next 10 prices for solar power will likely be depressed during the
sunniest part of the day, since competition will be higher
years—it’s doable.” from a growing number of solar generators.25 At the same
time, other sources of generation will face the same issue
during peak solar hours in these locations.
Rhone Resch, President and CEO, SEIA
10Technology: Is a solar technology break-through on
“PV could be much larger than
the horizon, or do we need one?
The solar industry can cut costs and support widespread
deployment by continuing to improve current crystalline
silicon based solar cell technology and developing other
attractive alternatives, specifically polycrystalline thin film
most people in the US think.
and low-cost III-V PV technologies,* according to Gregory
Wilson, National Center for Photovoltaics (NCPV) director
The ultimate fraction of
at NREL. To back that effort, he says there are three key
areas researchers are working on and “breakthroughs in
electricity generation from PV
any one of them could take us down the experience curve
much faster.”26 These include:
will depend on the price of
1. Finding more cost-effective ways of manufacturing carbon and the cost of storage.
high efficiency silicon PV cells. Examples of this work
include the development of low cost silicon tandem In the US, I think PV could
cells (i.e., adding a second PV cell to a silicon bottom
cell) and developing high efficiency silicon cells that can supply as much as 50 percent
be produced without using a wafer cut from a silicon
ingot. of our electricity needs by
2. Reducing production costs for much more efficient
solar technologies, such as III-V multi-junction materials,
mid-century.”
which are used on the international space station. “We Gregory Wilson, Director, National Center for
need space cells at earth prices,” added NREL’s Strategic
Energy Analysis Center Director, David Mooney.27
Photovoltaics, NREL
3. Developing the next generation of polycrystalline thin
film PV technologies, which can compete with silicon
PV in terms of efficiency and durability, but require as
much as 100 times less semiconductor material and can
be manufactured using a roll-to-roll method similar to
newspaper printing.28
*For further information on polycrystalline silicon and III-V
PV technologies, see endnotes.29
US Solar Power Growth through 2040 Exponential or inconsequential? 11One factor that may limit progress, however, is the The US federal government has been supporting solar
lack of adequate research funds in nearly every nation RD&D since the 1970s, and manages that support largely
where major PV research institutions exist, according through the Solar Energy Technologies Office (SETO) within
to NREL’s Wilson. Even here in the US, “the entire PV DOE’s Office of Energy Efficiency and Renewable Energy
research community, research universities, and national (EERE).32 Figure 8 traces SETO’s research budget for solar
labs, are dealing with reduced funding,” Wilson said.30 power technologies from 2005–2015, including a spike
MIT researchers suggest the variation in US federal in 2009 when $116 million in additional funding was
government spending on solar research, development, and authorized under the American Recovery and Reinvestment
deployment (RD&D) over time reduces the efficiency of Act of 2009 (the Stimulus Act).33 SETO funding devoted
the research because it makes it difficult to assemble and specifically to PV research and development (R&D)
retain the necessary talent to develop breakthrough solar declined more than 75 percent from 2013 to 2015, as the
technologies.31 department increasingly focused resources on reducing
BOS costs and pursuing innovations in manufacturing, in
an effort to accelerate deployment. In another move to
boost deployment, the DOE made $1 billion in additional
loan guarantee authority available in August 2015 for
innovative distributed energy projects, including solar
projects. At the same time, DOE expanded a previously
announced $10 billion loan guarantee solicitation to
include distributed energy projects.34 The DOE’s FY 2016
budget includes a 76 percent increase in SETO funding
for PV R&D, but it is not clear whether the budget will be
approved by Congress.35
Figure 8: DOE Solar research budget
Figure 8: US Solar Energy Technologies Office budget for solar power RD&D, 2005–201536
350,000
300,000
250,000
Thousands
of dollars
200,000
150,000
100,000
50,000
0
2005 2006 2007 2008 2009 2010 2011 2012 2013 2014 2015
Year
PV R&D Concentrating Solar Power (CSP) R&D SETO total solar power RD&D budget*
* SETO total above excludes funding allocated to solar heating, cooling and lighting research, and funding for Fuels from Sunlight Energy Innovation
Hub. See endnotes for further details on categories included in this chart.37 Totals also exclude funding through DOE’s Office of Science and
Advanced Research Projects Agency—Energy (ARPA-E), which is often targeted toward individual projects.
12In the private sector, venture capital and private equity However, according to Shah and other solar experts, we
investment in the solar industry rose from $379 million don’t need a breakthrough in solar cell technology to drive
in 2013 to $1.2 billion in 2014,38 and Bill Gates recently continued rapid solar deployment. That can be largely
pledged to donate $2 billion for alternative energy driven, especially in the near term, by reduced BOS costs,
research.39 But it’s not clear how much of these sums will new business models, and access to lower cost capital,
be devoted to solar power research and development. which will be discussed further below. First, let’s examine
another technology issue related to solar—grid integration.
In addition, there are high barriers for new technologies
trying to beat silicon, according to Mooney. “A technology
will have to be a lot better than silicon for banks to
finance it—you’d have to beat it on performance, cost,
and reliability,” he said.40 SunEdison founder Jigar Shah
confirms “There’s little funding for technologies that
have been in the field for less than five years; the state of
solar technology won’t change much in the near future.
There will be 4–5 percent cost reductions annually; the 20
percent reductions won’t go on forever.”41
US Solar Power Growth through 2040 Exponential or inconsequential? 13Grid integration: Will grid integration challenges An NREL study suggested variable generation levels of
hinder solar growth? up to 50 percent could be accommodated using a broad
An often discussed constraint to widespread solar portfolio of supply and demand side flexibility resources
adoption is its intermittent nature, since the sun doesn’t and options.44 Storage is often the first solution that
always shine when you need it. Variable resources like comes to mind, but the list also includes grid automation,
wind and solar must be integrated into the grid and sensors, advanced analytics, forecasting, energy efficiency,
balanced with demand and supply from other sources to demand response, traditional generation resources,
avoid unanticipated voltage fluctuations or circuit overload and transmission over greater distances to smooth out
that could trigger blackouts or brownouts. According variations and meet load with remote generation. “The key
to NREL’s Mooney, the amount of variable renewable is flexibility,” said Mooney. “Now they can dispatch on a
energy the grid can handle depends on the local footprint, sub-hourly basis, which makes it easier.”45
or mix, of generation, transmission and distribution
resources, but “in general there’s a lot of headroom for Germany, Australia, and Hawaii, locations that can
continued renewables development. Five years ago they experience peak load solar penetration of 25 percent
were reluctant to have more than 10 percent, but with or more, are at the front edge of finding solutions to
experience they’ve figured it out. Now it’s 20 percent and integrate solar power, and are generating some important
the margin will grow significantly.”42 Mooney mentions a learnings for the industry. Through collaborative research
utility that has integrated periods of as much as 50 percent with NREL and SolarCity, the Hawaiian Electric Companies
wind power on its system, starting up and stopping (Hawaiian Electric) found that high traffic circuits could
without a problem. Haresh Kamath, an energy storage absorb twice as much solar energy as they had thought.
and distributed generation expert with the Electric Power Specifically, after asking solar installers to upgrade software
Research Institute says “We know we can get to at least for inverters connecting solar systems to the grid, Hawaiian
35–40 percent. Now that we’re getting to those numbers, Electric was able to increase circuit thresholds from their
people are pushing them up again.”43 current levels of 120 percent of daytime minimum load
(DML) to 250 percent of DML, more than doubling the
hosting capacity of circuits to integrate rooftop solar.46
14Enabling technologies: Will storage and other While the cost-benefit ratio of grid-scale battery storage
emerging technologies enable faster solar growth? may not always make sense yet for a single application—
The impact of cost-effective electricity storage on like solar back-up—batteries can efficiently provide
the electric power industry could be transformative. multiple services, yielding multiple revenue streams, such
Traditional storage technologies, such as pumped hydro as ancillary services, for the same investment.52 This makes
and compressed air, have limited applicability and are battery storage increasingly viable on US electric grids,
losing market share to emerging battery technologies, particularly as markets evolve to allow system owners to
according to a Deloitte report.47 “For PV to quickly grow to capture all the value streams created. For example, “As
the terawatt scale that we need, it must be dispatchable; utilities and system operators continue pulling batteries
therefore low cost energy storage is critical,” said NCPV’s onto the grid to improve reliability, they can use them to
Wilson.48 And that goal is getting closer. In 2014, a back up solar as well,” Shah observed.53
report prepared for an electric utility calculated grid-scale
batteries’ benefits would surpass costs if batteries were In the residential market, solar systems with batteries
priced at $350 per kWh of capacity.49 In the spring of make sense only in the markets with the highest retail
2015, grid-scale batteries were offered at $250 per kWh electricity rates, such as Japan, Germany, Hawaii, and parts
of capacity,50 which is several years ahead of most industry of California. But that is changing fast as solar and battery
forecasts for battery prices.51 technologies travel down the experience curve and prices
fall rapidly. “Storage is a big enabling technology,” said
SEIA’s Rhone Resch. “In time, every solar system installed
will have storage, which will act as a backup generator
“If residential solar adoption for the home. Then residential and small commercial
customers’ ability to sell excess electricity back to the grid
is like air conditioning, where will be less significant, as they will be able to store it for
use later.”54 Currently, a 10 kWh capacity battery designed
50 years later they had 80 for residential and small commercial customers is priced at
$350 per kWh, and that price is expected to decline below
percent saturation, solar on
$200 per kWh of capacity by 2020.55 The 10 kWh battery
is described as sufficient to power most homes during
peak evening hours, and multiple batteries may be installed
buildings could follow a together for homes with greater energy needs.56
similar path.”
Dan Shugar, CEO, NEXTracker
US Solar Power Growth through 2040 Exponential or inconsequential? 15In addition to storage, another technological advance Some expect a rapid increase in EV adoption as lower-
that supports solar power’s growth is the increasing priced models hit the market in the next few years. Of
deployment of digital technology, communications, and course, competition becomes tougher if gasoline prices
advanced analytics on the grid. As networked devices stay low. But if EV adoption increases, it could feed solar
begin to monitor systems and physical conditions—such adoption in several ways. First, an increase in battery
as cloud cover patterns, solar intensity and output across production for EVs will accelerate battery technology’s
the grid—and feed data into applications that aggregate, journey down the experience curve and reduce battery
analyze and learn from it, the whole system will become costs, which will in turn make them a more economically
smarter, more predictive, and efficient. “The integration of viable solution for solar intermittency. Second, if more
solar generation and digital communications interfacing EVs with batteries are connected to the grid, they too can
with the grid will increase stability and lower costs for act as storage for excess grid capacity and as a source
consumers,” said Resch.57 Such technologies are part of for grid power when needed, which would help mitigate
what is known as the “Internet of Things,” or alternatively solar power’s variability. Finally, EV purchasers who are
by some in the power industry, the “Grid of Things.” interested in reducing their carbon footprints further
may consider installing solar panels to charge their cars.
Research suggests that approximately one in three EV
owners already have solar panels to generate electricity
at home,58 which far exceeds the 3 percent found in an
overall sampling of US consumers in the Deloitte Resources
2015 Study, an annual survey that provides insight into
consumer and business attitudes and practices regarding
energy management.59 In view of this trend, homebuilders
are already teaming with auto companies to integrate EV
management systems and solar power into new “net-zero
energy” homes.60
16Cost of capital: Will solar’s cost of capital Today, across high penetration solar markets in the US, this
continue falling? third-party ownership model represents about 80 percent
One of the biggest contributors to solar system costs for of solar installations,” said Resch.62 From 2010–2015, the
utility-scale, commercial, and residential installations is the industry also saw the introduction of innovative financial
cost of capital. The solar industry has been introducing tools to fund the growing number of solar installations
financial innovations at a furious pace to bring these costs including solar securities; green bonds; YieldCos; online
down. One of the first breakthroughs was the introduction crowd-funding sites like Mosaic; and new solar-optimized
of “solar-as-a-service,” which brought the concept of loans, which are making direct ownership a more attractive
power purchase agreements and leasing to residential option for customers in some areas of the country.
and commercial markets. This model requires customers
to pay nothing upfront, as the installer designs, installs, “The solar industry is just catching up to other industries;
owns, and maintains the system. Customers sign a power these tend to be financial structures developed by other
purchase agreement for a fixed period (typically 10–25 industries. We also expect to see new rule changes coming
years), which covers the aforementioned costs and usually up, such as the ability to include solar assets in Real Estate
reflects savings compared with the customers’ current and Investment Trusts” said SEIA’s Resch.63
projected future electricity bills.61 The developer/installer
monetizes any applicable tax credits, while the customer In the commercial market, developers sell multi-site
benefits from net metering payments, if available. These portfolios to retailers, standardize contracts to streamline
incentives are still a critical component of solar economics financing, and now offer energy storage as an add-on to
in most states, and are explained further in the policy maximize solar’s benefits by reducing demand charges.64
discussion below. That may change as solar system costs Demand charges are based on commercial and industrial
fall further and as storage becomes more widespread. customers’ peak electricity usage during a billing period,
Most customers continue to use the grid for back-up and that peak usage can be reduced by using solar power
power. or storage.
These financial tools help the solar industry tap into capital
from both large and small investors. But to keep reducing
“Conventional projections have a the cost of capital, the industry must attract broader
capital market participation. In order to do this, they must
poor track record; they often continue to work toward providing a liquid, tradable
product priced by the market. NREL’s Solar Access to
don’t account for the rapid pace Public Capital working group is pursuing solutions through
measures such as standardizing documents, recording best
of innovation. At the same time, practices and promoting their adoption by the industry,
and expanding access to data and tools to conduct due
continued 45 percent growth diligence necessary to build market confidence in the asset
class.65
breaks down due to constraints
such as costs and variability.”
Ramez Naam, Energy Analyst and Faculty Member,
Singularity University
US Solar Power Growth through 2040 Exponential or inconsequential? 17Addressable market: Not everyone owns their
homes—doesn’t that limit the addressable market?
Community Solar
Some cite limits to the addressable solar market as a
The term “community solar” refers to community-shared
long-term barrier to rapid growth in the US. But new
solar projects that are not physically connected to the
business models, like community solar programs, may be
customer’s property. It includes a wide spectrum of
able to address more of the market. “Not all roofs are
offerings, ranging from utility-owned projects offered
suitable for solar and not all customers are homeowners,
through rate-based programs, to “virtual net-metered”
have good credit scores, available capital or even the desire
installations that customers buy shares of according to
to put systems on their own property,” said Tanuj Deora,
their needs.68 Credits are applied to customers’ bills in
chief strategy officer, Solar Electric Power Association.66
accordance with their ownership stakes. These facilities
According to these criteria, only between 10–20 percent
average in the 1–2 megawatt (MW) range, which is large
of US residential households would likely acquire or lease
enough to access utility-scale benefits such as project
rooftop solar PV systems, Deora added. But a new and
financing and more efficient sources of capital. The larger
increasingly popular alternative is community solar, a
scale and more attractive financing can help bring the cost
market segment that could have the largest growth rate
of shared residential solar systems down 30–50 percent
in the US in the next three to four years, Deora said.67 (see
compared with individual rooftop solutions.69 There are
sidebar)
currently more than 50 shared solar programs across 19
states and dozens of cooperative, municipal and investor-
Policies: Will utility rate restructuring or potential
owned utilities, exceeding 170 MW of capacity.70 NREL
changes to net metering slow solar growth?
projects community solar installations could total as much
Utilities across the country have expressed concern that
as 11 gigawatts (GW) of capacity by 2020, but growth
customers with solar installations are not paying their share
will depend in part on how many states adopt community
of the cost of maintaining the grid. As these customers’
solar or virtual net metering legislation.71
usage of utility-provided electricity declines, utilities receive
less revenue to cover the fixed costs of maintaining the
Utility-owned programs require the approval of state
grid and access to generation, and these costs must then
utility commissions, which may be less difficult than
be spread across all customers’ bills. Some utilities say that
passing legislation, as these programs can reduce costs
customers who do not install solar panels are in effect
for consumers and help states meet Renewable Portfolio
subsidizing the solar customers’ access to and usage of
Standard (RPS) goals. The federal government has also
the reliability provided by the integrated electric grid and
joined the effort to increase access to solar energy,
associated generation capacity. Electric companies in more
particularly in low to moderate income communities
than 20 states have asked their regulators to help them
through new initiatives like its National Community Solar
recover such costs through rate restructuring. A variety of
Partnership, which aims to unlock access to solar for the
rate revisions have been proposed and some have been
nearly 50 percent of US households and businesses that
implemented. The net effect of most of these revisions for
rent or do not have adequate roof space.72
solar customers would be to raise costs. This will likely cut
into solar sales, depending on the extent of the additional
cost.
18In addition, most states have net metering programs Policies: What does pending expiration of the
that require electric companies to buy the excess energy federal ITC mean for solar?
produced by various types of distributed energy, including Another policy that has been foundational to the solar
rooftop solar, from customers at retail rates. Since electric industry is the ITC, which is scheduled to step down from
companies could generally produce this power themselves 30 percent to 10 percent after 2016 for utility-scale solar
or buy it on wholesale markets from other electricity projects, and to zero for installations directly owned by
providers at lower cost, they are calling for net metering residential and small commercial customers.75 The solar
policies to be revised. One suggestion is that net-metered industry is still lobbying for an extension of the ITC or
customers be compensated using the wholesale price for a change in the ruling to include projects that begin
the electricity they produce, similar to other electricity construction by the deadline rather than go in service. If
providers.73 There will be different outcomes across utility that doesn’t happen, “After expiration, solar will probably
territories, and some of them could potentially pose big take a hit, but the 20–30 percent increase in costs will
challenges for solar companies, according to solar industry be made up for in about two to three years by price
executives. declines. There may be some loss in 2018–19, but then it
will bounce back,” said Ramez Naam, energy analyst and
It will likely take more time for commercial and residential faculty member at Singularity University.76
solar systems to become economically viable in areas that
impose or increase grid charges or alter net metering One view is that expiration of incentives will allow the
programs. But in the meantime, the cost of solar systems solar industry to focus more on the value proposition of
will likely continue to decline in many parts of the country, the services they are selling. Solar energy companies are
and installers will focus on these areas. Many suggest as beginning to sell a suite of products that includes not just
storage prices fall in the next few years, more solar systems solar panels and storage, but other products like energy
will include storage so customers will not have to rely on management and microgrids. For example, SolarCity offers
net metering to make their systems economic; they would a turnkey microgrid service that combines solar panels,
just store excess energy and use it later, thereby saving battery storage and a monitoring and control system to
further on electric bills. Regarding net metering policies, manage the mix.77 The service, targeted at municipalities,
Resch says, “Until low cost storage becomes available, remote communities, campuses and military bases, can
net metering will remain an important policy; it has been be financed with no upfront costs in a pay-as-you-go
foundational for creating markets for the last 10 years. But “microgrid as a service” model, or it can be purchased.78
if we get storage technology right, then solar will become “The vision you’re selling companies is microgrids, more
cost competitive in all 50 states without it. And most reliability, power quality. Now you’re just selling solar
experts feel that this is less than five years away.”74 because of the ITC, but when the ITC goes away, it
becomes broader than solar. Now solar has a 6 percent
return, but the overall package after adding these other
services may have a 9 percent return” for customers, said
Shah.79
US Solar Power Growth through 2040 Exponential or inconsequential? 19Carbon: How will environmental considerations and Most industry observers see the future of carbon policy
initiatives impact solar growth? as an important driver for solar growth. NREL’s Wilson
Low carbon energy sources like solar are gradually suggests “any discussion about future terrawatt-
becoming more valuable as policies like the Environmental scale growth for solar depends on whether there’s an
Protection Agency’s (EPA) Clean Power Plan (CPP) are appropriate price on carbon. Once we have a global
proposed and implemented. The CPP seeks to lower climate change policy framework that addresses carbon
carbon dioxide emissions from the US power sector by emissions costs, PV industry growth will accelerate.”82 Even
19.2 percent from 2012 levels by 2030.80 While there are while the policies are still uncertain, the issue is impacting
legal challenges to the EPA ruling, if it goes forward “it corporate decisions about energy use. An energy manager
will be a major driver for solar in all markets—residential, for a large technology company told us companies like his
commercial, and utility scale. The demand for solar from are beginning to address carbon dioxide reduction sooner
the CPP could be an order of magnitude bigger than all of rather than later because they expect a price to be put
the RPS combined,” according to Resch.81 on carbon eventually, so it’s probably cheaper to reduce
carbon now. In the Deloitte Resources 2015 Study, 57
percent of companies surveyed reported having carbon
emissions reduction goals in 2015 compared with 46
percent in 2014 and 49 percent in 2013.83
20Competition: Will competitive electricity sources Natural gas plants’ key advantages are their lower cost
slow or complement solar’s growth? to construct and relatively short time to build compared
Competition from existing and future power generation with other dispatchable sources like coal and nuclear, plus
technologies will likely impact the rate of growth of solar availability of abundant US shale gas supplies. Wind and
power in the US, as will continued advances in energy solar boast falling costs to build plants and no fuel costs,
efficiency. At the same time, all of these sources can be providing generators with valuable price certainty over the
complementary to solar, helping to serve load when the long term. Figure 10 provides EIA estimates of levelized
sun isn’t shining. For example, the wind tends to blow cost of energy (LCOE) for various technologies.
strongest in the evening, while solar power is obviously
diurnal, creating convenient synergies between the two
power sources. Natural gas peaker plants, with their ability
to start and stop quickly, are also a good complement to
solar power.
These three technologies have been the leading sources
of new generation in the US in recent years and will likely
continue to lead in the near term (see Figure 9).
Figure 9:
Figure 9: Share
120%of new US generating capacity by energy source
100% 4% 3%
8%
7%
23%
80% 41%
10%
% Share of
New
Generating
Capacity 60%
46% 42%
16%
40%
31%
20%
29% 32%
10%
0%
2012 2013 2014
Year
Solar Natural Gas Coal Wind Other
Source: GTM Research, Federal Energy Regulatory Commission
US Solar Power Growth through 2040 Exponential or inconsequential? 21Figure 10: US average levelized cost of energy (LCOE) for plants entering service in 2020 (in 2013 $/mWh)1
Fixed Variable
Total LCOE
Capacity Levelized Operations & O&M Transmission Total system
Plant type Subsidy2 including
factor capital cost Maintenence (including investment LCOE
subsidy
(O&M) fuel)
Dispatchable
Coal-fired
Conventional coal 85 60.4 4.2 29.4 1.2 95.1
Advanced coal 85 76.9 6.9 30.7 1.2 115.7
Natural gas-fired
Conventional combined cycle 87 14.4 1.7 57.8 1.2 75.2
Advanced combined cycle 87 15.9 2 53.6 1.2 72.6
Advanced nuclear 90 70.1 11.8 12.2 1.1 95.2
Non-dispatchable3
Wind 36 57.7 12.8 0 3.1 73.6
Solar PV 25 109.8 11.4 0 4.1 125.3 -11 114.3
Solar thermal 20 191.6 42.1 0 6 239.7 -19.2 220.6
Source: US Energy Information Administration, Annual Energy Outlook 2015
1
LCOE represents cost of building and operating a generating plant over an assumed financial life and duty cycle. Costs for advanced nuclear technology reflect an online date of 2022
2
The subsidy component only reflects subsidies available in 2020, which include a permanent 10 percent investment tax credit for solar technologies
3
Non-dispatchable energy sources like wind and solar cannot be directly compared with dispatchable sources like natural gas, coal and nuclear. Refer to EIA’s LCOE/LACE analysis for
further information http://www.eia.gov/forecasts/aeo/pdf/electricity_generation.pdf
Energy efficiency technologies are advancing fast as well, While solar power is gaining value for its attractive
and costs to save energy are below those for building environmental profile, other emerging low carbon
most types of new generation.84 The average total cost technologies may also be advancing. Two technologies
of saving electricity by US utility efficiency programs from being researched and tested are carbon capture and
2009–2013 was 4.6 cents per kWh across 20 states, storage, which would dramatically cut carbon emissions
according to a Berkeley Lab study.85 Increasing adoption from coal-fired and natural gas-fired generation by
of systems to manage and reduce energy usage across capturing and storing them, and small modular nuclear
homes, buildings, and cities is reducing the need for new reactors designed to be built faster and more cost
generation overall, which could constrain solar growth. effectively than today’s reactors. Breakthroughs in these
technologies or others could create competition that could
potentially slow the growth trajectory of solar power,
depending on the timing of commercialization.
22Adoption: New energy technologies don’t just take So, if a shift toward solar dominating the US generation
hold overnight mix depends on traditional utility-scale generation
Energy analysts make the point that large scale- deployment (through electric companies and independent
deployment of new energy technologies doesn’t power producers) it will likely happen gradually. But does it
happen fast; new technologies have historically grown depend only on traditional utility-scale deployment? Those
exponentially until they reach about 1 percent of the who envision continued exponential solar growth in the
energy mix, which solar is approaching now, and then US leading to its dominance within as little as 15 years do
growth slows to a linear pace.86 This is due partly not think so. They believe it will come as a combination of
to limitations related to manufacturing capacity and utility and customer-initiated deployment. Some suggest
investment dollars. And importantly, analysts argue that that at the end-user level, solar systems have already
“unlike consumer goods, which may become obsolete become a consumer good, like a refrigerator, a furnace,
in a few years, the capital goods of the energy system or a car, so solar adoption may no longer be subject to
have a lifetime of 25–50 years, so only 2–4 percent of the previous “laws” of energy technology adoption. They
existing technology needs replacement in a given year.”87 suggest this shift will happen because of customer choices
The economic barrier to replacing existing power plants and sentiment, which is on the verge of, or already at, the
with solar plants is high, they would argue, because the “tipping point” for solar power. These concepts will be
total cost of new solar plants (capital and operating costs) explored further in the next section.
would have to fall below the operating costs of existing
plants. And that is unlikely to happen, even with rapidly
declining solar costs.
US Solar Power Growth through 2040 Exponential or inconsequential? 23You can also read