New Hampshire Turnpike System Traffic and Revenue Study - May 29, 2015 - New Hampshire Department of Transportation - NH.gov
←
→
Page content transcription
If your browser does not render page correctly, please read the page content below
Submitted to:
                        New Hampshire
                        Department of Transportation

New Hampshire
Turnpike System
Traffic and Revenue Study

May 29, 2015

Submitted by:

Jacobs Engineering Group Inc.
2 Penn Plaza, Suite 603
New York, NY 10121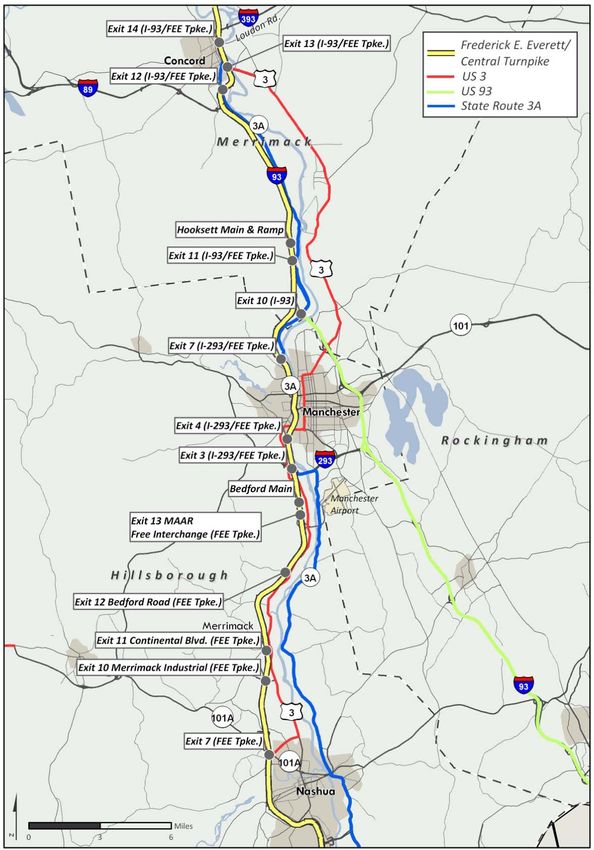
(this page left intentionally blank)
NH Turnpike System Traffic and Revenue Study

Table of Contents

1.     Executive Summary................................................................................................ 1
2.     Introduction ............................................................................................................. 3
3.     Description of New Hampshire Turnpike System ................................................ 4
4.     Historical Traffic and Revenue ............................................................................ 11
     4.1.    Historical Toll Transactions and Toll Revenue Trends ................................................. 11
     4.2.    Toll Transaction Trends ................................................................................................ 12
     4.3.    Toll Revenue Trends .................................................................................................... 17
     4.4.    Comparison of Actual Toll Revenues to Recent Projections ........................................ 21
5.     Review of Proposed Capital Improvement Program ......................................... 22
6. Review of Historical and Projected Operation, Maintenance, Renewal and
Replacement, and Debt Service Expenditures ......................................................... 24
     6.1.    Toll Processing Costs ................................................................................................... 24
     6.2.    Operating Expenditures ................................................................................................ 25
     6.3.    Debt Service Requirements .......................................................................................... 28
7.     Review of National and Regional Socioeconomic Factors ............................... 30
     7.1.    National Economic Trends ........................................................................................... 30
       7.1.1.      Output and Growth ................................................................................................ 30
       7.1.2.      Prices .................................................................................................................... 33
       7.1.3.      Employment .......................................................................................................... 35
       7.1.4.      Consumer and Investment Spending .................................................................... 39
       7.1.5.      Short Term Economic Forecast ............................................................................. 42
       7.1.6.      Transportation Trends and Energy Prices ............................................................. 44
       7.1.7.      Long Term Economic and Travel Trends .............................................................. 51
     7.2.    New Hampshire Demographic Trends ......................................................................... 55
       7.2.1.      Population ............................................................................................................. 55
       7.2.2.      Population Age Distribution ................................................................................... 59
     7.3.    New Hampshire Economic Trends ............................................................................... 59
       7.3.1.      Output and Growth ................................................................................................ 60
       7.3.2.      Employment .......................................................................................................... 62

                                                                  Page i                                                    May 29, 2015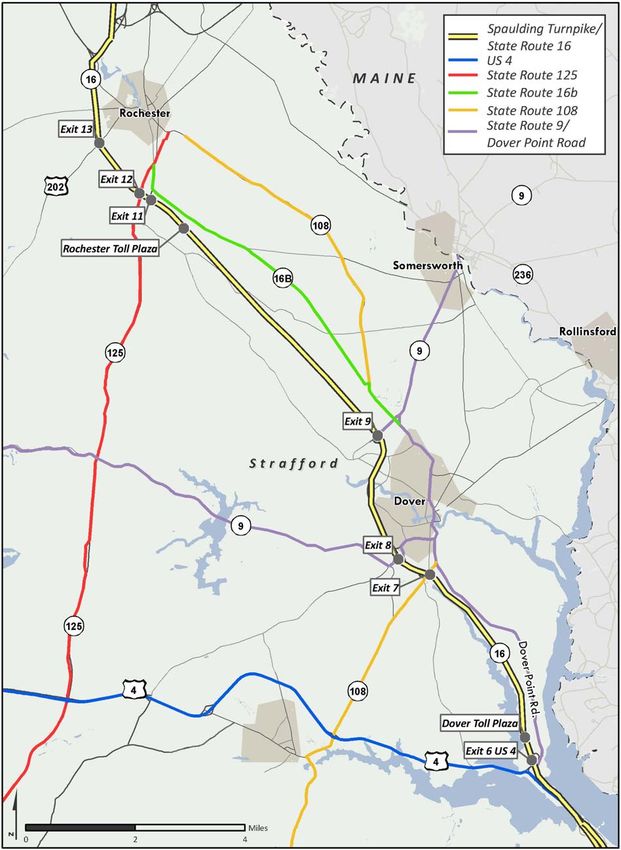
NH Turnpike System Traffic and Revenue Study
7.3.3. Income ................................................................................................................... 64
7.3.4. Tourism and Travel Trends ................................................................................... 64
7.3.5. Commuting Trends ................................................................................................ 65
7.4. Historical Traffic and Economic Recessions ................................................................ 66
8. Transportation Projects Relative to the NH Turnpike System .......................... 68
8.1. Feeder Roads ............................................................................................................... 68
8.2. Competitive Roads ....................................................................................................... 68
8.2.1. Central Turnpike Parallel Routes - US Route 3 and NH 3A .................................. 69
8.2.2. Spaulding Turnpike Parallel Routes - Dover Point Rd / NH 9 / NH 108 ................ 72
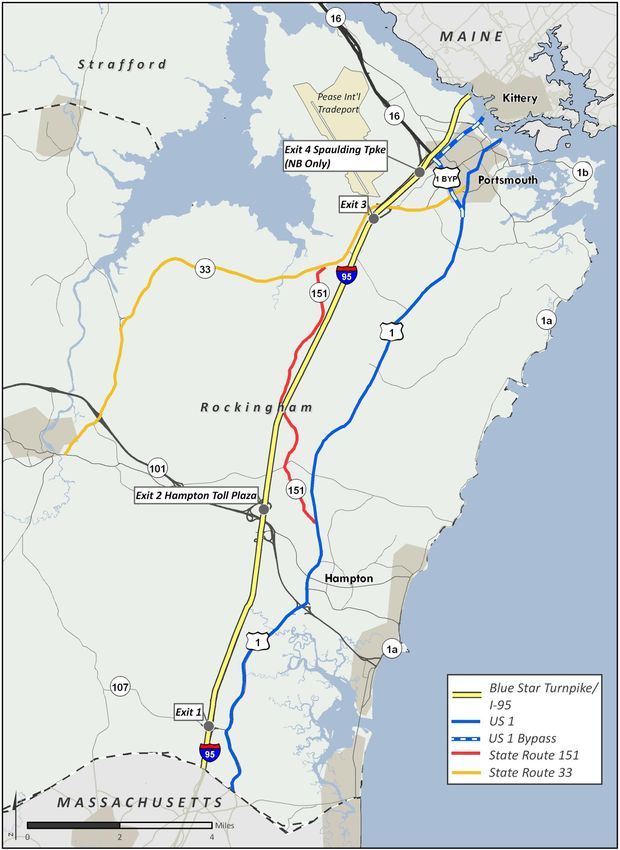
8.2.3. Blue Star Turnpike Parallel Route - US Route 1 ................................................... 74
8.2.4. Summary of Alternate Routes ............................................................................... 74
8.3. Potential Future Transportation Projects ...................................................................... 76
8.3.1. Central (Everett) Turnpike Region ......................................................................... 76
8.3.2. Blue Star Turnpike Region .................................................................................... 77
8.3.3. Spaulding Turnpike Region ................................................................................... 77
9. Traffic and Revenue Projections, FY 2015-2024 ................................................ 78
9.1. Toll Rates ..................................................................................................................... 78
9.1.1. Assumed Toll Rates .............................................................................................. 78
9.1.2. Reasonableness of Tolls / Comparison to Other E-ZPass Toll Facilities .............. 78
9.2. Methodology Used for Traffic and Revenue Forecasts ................................................ 80
9.2.1. Fiscal Year 2015 Estimates ................................................................................... 80
9.2.2. Correlation to Economic Factors ........................................................................... 80
9.2.3. E-ZPass Market Shares ........................................................................................ 81
9.2.4. System Changes and Developments .................................................................... 81
9.3. Toll Transaction Projections by Turnpike ..................................................................... 83
9.4. Toll Revenue Projections by Turnpike .......................................................................... 85
9.5. E-ZPass Market Share Projections .............................................................................. 86
10. Financial Model Analysis ..................................................................................... 88
10.1. Total Turnpike System Expenditures ........................................................................ 88
10.2. Turnpike System Funds ............................................................................................ 89
10.3. Turnpike Coverage Ratio Analysis ............................................................................ 90
10.4. Limits and Disclaimers .............................................................................................. 92
Page ii May 29, 2015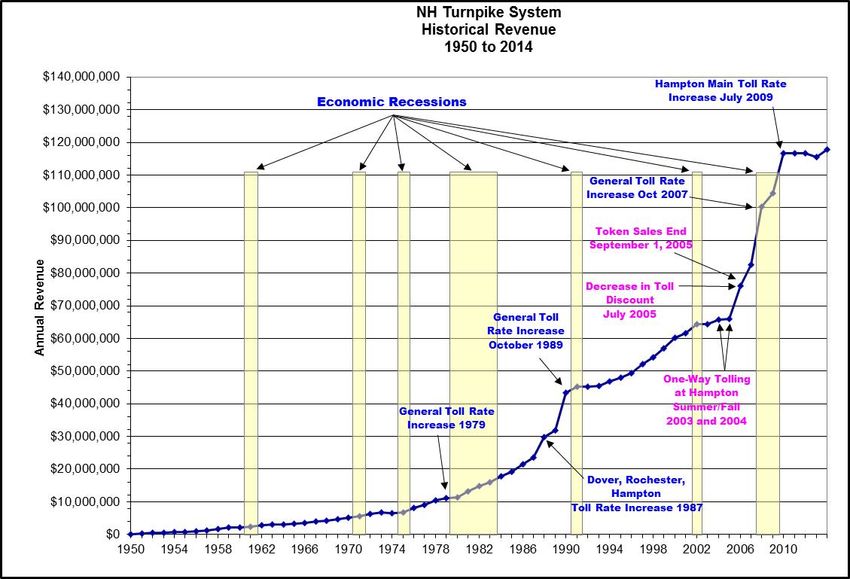
NH Turnpike System Traffic and Revenue Study

Figures
Figure 1: New Hampshire Turnpike System ................................................................................. 5
Figure 2: NH Turnpike System Historical Toll Transactions and Toll Revenue Trends .............. 12
Figure 3: NH Turnpike System Historical Toll Transaction Trends ............................................. 14
Figure 4: Historical Toll Transaction Trends by Turnpike, FY 1991-2014 ................................... 15
Figure 5: NH Turnpike System Historical Toll Revenues ............................................................ 19
Figure 6: Historical Toll Transaction and Revenue Trends by Turnpike ..................................... 20
Figure 7: Funding Sources for Capital Improvement Program ................................................... 23
Figure 8: Real Growth Domestic Product ................................................................................... 30
Figure 9: Annual Rate of Change in Real Domestic Product ...................................................... 31
Figure 10: Per Capita Real Gross Domestic Product ................................................................. 32
Figure 11: Industrial Production Index and Capacity Utilization .................................................. 33
Figure 12: Consumer and Producer Price Indices ...................................................................... 34
Figure 13: Employment Cost Index ............................................................................................. 35
Figure 14: Civilian Employment .................................................................................................. 36
Figure 15: Unemployment Rate .................................................................................................. 37
Figure 16: Labor Participation and Employment to Population Ratio ......................................... 38
Figure 17: Median Duration of Unemployment ........................................................................... 39
Figure 18: Real Personal Consumption Expenditures ................................................................ 40
Figure 19: Household Debt to GDP Ratio ................................................................................... 41
Figure 20: Household Debt Service Payments as a Percent of Disposable Income .................. 41
Figure 21: Real Gross Private Investment .................................................................................. 42
Figure 22: Forecast Change in Real GDP, 2015 and 2016 ........................................................ 43
Figure 23: Forecast Change in Industrial Production, 2015 and 2016 ........................................ 43
Figure 24: Moving 12-Month Total Vehicle Miles Traveled, 1971-2014 ...................................... 44
Figure 25: Per Capita Vehicle Miles Traveled ............................................................................. 45
Figure 26: Motor Gasoline Regular Grade Retail Price .............................................................. 48
Figure 27: West Texas Intermediary Crude Oil Prices ................................................................ 48
Figure 28: U.S. Gasoline and Crude Oil Price Forecasts ........................................................... 49
Figure 29: Motor Vehicle Fuel Economy ..................................................................................... 50
Figure 30: Moving 12-Month Total Vehicle Miles Traveled, Nov. 2007-Nov. 2014 ..................... 51
Figure 31: U.S. Population Distribution by Age Group ................................................................ 53
Figure 32: Average VMT per Person by Age Group in 2009 ...................................................... 54
Figure 33: Survey Respondents Who Stated They Sometimes Choose to Spend Time with
Friends Online Instead of Driving to See Them .......................................................................... 55
Figure 34: Resident Population in New England States in 2014 ................................................ 56
Figure 35: Index of Resident Population in New England from 1970 to 2014 ............................ 57
Figure 36: Resident Population in New Hampshire .................................................................... 58
Figure 37: Age Distribution of Population in New Hampshire ..................................................... 59
Figure 38: Real per Capita Gross Domestic Product in New Hampshire and the United States 60
Figure 39: Change in Real Total Gross Domestic Product in New Hampshire and the United
States .......................................................................................................................................... 61
Figure 40: Nonfarm Employment in New Hampshire .................................................................. 62

                                                                    Page iii                                                  May 29, 2015
NH Turnpike System Traffic and Revenue Study
Figure 41: Unemployment Rate in New Hampshire and the United States ................................ 63
Figure 42: Real Median Household Income in New Hampshire and the United States .............. 64
Figure 43: National VMT and New Hampshire Turnpike Traffic Reflecting Recent and Historical
Recessions ................................................................................................................................. 66
Figure 44: Central Turnpike and Parallel Routes ....................................................................... 71
Figure 45: Spaulding Turnpike and Parallel Routes ................................................................... 73
Figure 46: Blue Star Turnpike and Parallel Routes ..................................................................... 75
Figure 47: Passenger Car Toll Rates per Mile on Select E-ZPass Toll Facilities ....................... 79
Figure 48: Commercial Vehicle Toll Rates on Select E-ZPass Toll Facilities ............................. 80
Figure 49: NH Turnpike System Historical and Projected Toll Transaction and Revenue Trends,
FY 1950-2024 ............................................................................................................................. 86
Figure 50: NH Turnpike System Historical and Projected E-ZPass Market Shares, FY 2008-
2024 ............................................................................................................................................ 87
Page iv May 29, 2015NH Turnpike System Traffic and Revenue Study
Tables
Table 1: Major Events on the New Hampshire Turnpike .............................................................. 6
Table 2: NH Turnpike System Historical Annual Toll Transactions (in millions) ......................... 13
Table 3: NH Turnpike System Historical Annual Toll Revenues (in millions) .............................. 17
Table 4: Actual Toll Revenues vs. 2012 Projections, Millions ..................................................... 21
Table 5: Historical and Proposed NHDOT Capital Expenditures, Millions .................................. 22
Table 6: Toll Processing Costs, Millions ..................................................................................... 24
Table 7: Historical and Projected NHDOT Operating Expenditures, Millions.............................. 26
Table 8: Historical Lapse ............................................................................................................ 27
Table 9: Historical and Scheduled Debt Service Expenditures, Millions ..................................... 28
Table 10: Annual Highway Travel Trends ................................................................................... 46
Table 11: Per Capita Daily Highway Travel Trends by Age and Sex .......................................... 47
Table 12: Resident Population Projections for New Hampshire Counties .................................. 58
Table 13: Tourist Activity in New Hampshire .............................................................................. 65
Table 14: Mean Time to Commute to Work in New Hampshire Counties................................... 65
Table 15: Toll Rates for Selected Vehicle Classes on the New Hampshire Turnpike System.... 78
Table 16: Estimated Losses in Annual Revenues ($M) at Bedford/Merrimack Plazas due to Exit
12 Toll Removal .......................................................................................................................... 82
Table 17: FY 2014 and Projected Annual Toll Transactions, FY 2015-2024 (in millions) ........... 83
Table 18: Detailed Traffic and Revenue, FY 2014 Actual and FY 2015-2024 Projections ......... 84
Table 19: FY 2014 and Projected Annual Toll Revenue, FY 2015-2024 (in millions) ................. 85
Table 20: Actual and Projected E-ZPass Market Shares, FY 2014-2024 ................................... 87
Table 21: Historical and Projected Total NH Turnpike Expenditures, Millions ............................ 88
Table 22: Historical and Projected NH Turnpike Funds, Millions ................................................ 89
Table 23: NH Turnpike Debt Coverage Analysis, FY 2015-2024, Millions ................................. 90
Table 24: Projected Cash Flow Analysis, FY 2015-2024 (in millions) ........................................ 91
Page v May 29, 2015NH Turnpike System Traffic and Revenue Study
1. EXECUTIVE SUMMARY
Jacobs Engineering was retained by the New Hampshire Department of Transportation
(NHDOT) to conduct this traffic and revenue study for the New Hampshire Turnpike System (the
“Turnpike System”). Jacobs analyzed historical traffic and revenue data for the entire Turnpike
System to determine historical trends, correlated traffic with key economic indicators, and
researched demographic data and other factors that have affected recent traffic and/or will
affect future traffic. In addition, Jacobs reviewed the historical and proposed Turnpike Capital
Improvement Program as well as historical and projected expenditures for the Turnpike System
related to operations, maintenance, renewal and replacement, and toll processing.
All of this information and analyses were then used to develop a traffic and revenue model to
estimate annual traffic and toll revenue for the ten-year period from Fiscal Year 2015 (i.e., July
2014 – June 2015) through Fiscal Year 2024. Fiscal Year (FY) 2014 and projected annual toll
revenue is summarized in Table ES-1. These forecasts assume no future toll increases. They
take into account the estimated loss in Central Turnpike toll traffic due to the removal of the
Bedford Road (Exit 12) ramp tolls in July 2014, as well as growth in traffic from the widening and
improvement projects on the Spaulding Turnpike.
Table ES- 1: FY 2014 and Projected Annual Toll Revenue, FY 2015-2024 (in millions)
Spaulding
Fiscal Year Central Turnpike Blue Star Turnpike Total
Turnpike
2014 Actual
$43.2 $59.6 $15.1 $117.9
(Cash Basis)
2014 Actual
$43.5 $59.2 $14.8 $117.5
(Accrual Basis)
2015 $43.6 $60.6 $15.6 $119.8
2016 $44.4 $61.5 $15.8 $121.6
2017 $45.2 $62.3 $16.0 $123.5
2018 $46.0 $63.1 $16.2 $125.4
2019 $46.9 $63.8 $16.5 $127.1
2020 $47.7 $64.5 $16.9 $129.1
2021 $48.5 $65.3 $17.2 $131.0
2022 $49.4 $66.0 $17.6 $132.9
2023 $50.2 $66.7 $17.9 $134.8
2024 $51.0 $67.4 $18.3 $136.8
Notes: Future year revenues were forecasted using 2014 cash basis revenues as a base.
Data will not necessarily add to totals because of rounding.
The study also included the use of a financial model to estimate net revenues, operating costs,
debt service requirements, and bond coverage ratios and cash reserves for the Turnpike
System. The analysis of the financial plan showed that sufficient revenues will be generated to
fund the proposed capital plan and to meet both the state’s bond resolution’s minimum debt
Page 1 May 29, 2015NH Turnpike System Traffic and Revenue Study
service coverage requirements as well as the Turnpike’s internal minimum requirements for the
ten-year forecast period, FY 2015-2024.
Page 2 May 29, 2015NH Turnpike System Traffic and Revenue Study
2. INTRODUCTION
Jacobs was retained by NHDOT to conduct a traffic and revenue study for the Turnpike System.
In conducting this study, historical traffic and revenue data for the entire Turnpike System were
collected and analyzed to determine historical trends and travel characteristics. Previous traffic
and revenue projections were reviewed and compared to actual traffic and revenue data
recorded by NHDOT.
This study also included a review of the historical and proposed Turnpike Capital Improvement
Program, as well as historical and projected expenditures for the Turnpike System related to
operations, maintenance, renewal and replacement, and toll processing. An additional review
was conducted for regional and national economic factors such as gross domestic product, fuel
cost impacts, housing and employment. The study also examined feeder and competitive roads
and their impact on traffic on the Turnpike System.
All of this information and analyses were then used to develop a traffic and revenue model to
estimate annual traffic and toll revenue for Fiscal Years 2015 through 2024. The study also
included the development of a financial model to estimate net revenues, operating costs, debt
service requirements and bond coverage ratios. An assessment was made to determine
whether the toll revenues would be sufficient to meet the Turnpike bond requirements.
Page 3 May 29, 2015NH Turnpike System Traffic and Revenue Study
3. DESCRIPTION OF NEW HAMPSHIRE TURNPIKE SYSTEM
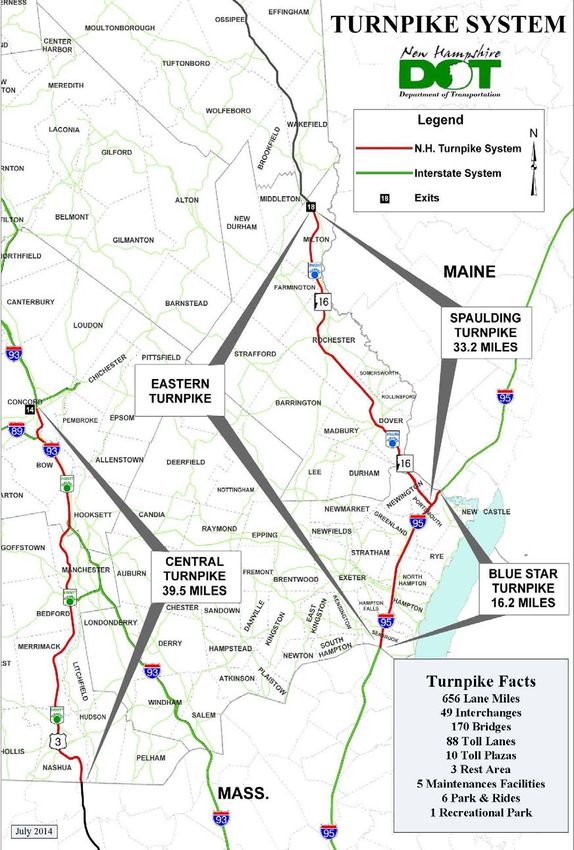
The current Turnpike System is an open barrier toll system comprised of 49 interchanges, 9 toll
plazas, 84 toll lanes, and approximately 89 linear miles. The system is composed of three
independent turnpike systems; the Central (F.E. Everett) Turnpike, the Blue Star Turnpike and
the Spaulding Turnpike, as shown in Figure 1.
The Central Turnpike, also known as the F.E. Everett Turnpike (or “FEET”) is the longest at 39.5
miles, extending from the Massachusetts state line in Nashua, New Hampshire to Exit 14 in
Concord, New Hampshire. It comprises, in part, a portion of U.S. Interstate Highways 93 and
293 and connects the three largest cities in New Hampshire (Nashua, Manchester and
Concord). The Central Turnpike also connects with major east-west highways such as NH 101,
US 4 as well as Interstate 89. Currently there are two mainline toll plazas at Hooksett and
Bedford, and three ramp plazas at Hooksett (I-93 Exit 11), Continental Boulevard (FEET Exit
11), and Merrimack Industrial Drive (FEET Exit 10). Tolling at Bedford Road (FEET Exit 12)
ramp plaza was discontinued in late July 2014.
The Blue Star Turnpike extends from the Massachusetts state line in Seabrook, New Hampshire
to the Maine state line in Portsmouth, New Hampshire. It is 16.2 miles in length and constitutes
a portion of Interstate 95. The Blue Star Turnpike connects with major highways that include
NH 101 and US 4. There is a mainline toll plaza and an entry/exit (“side”) toll plaza on the Blue
Star Turnpike, both located in the Town of Hampton.
The Spaulding Turnpike is 33.2 miles long, extending from Portsmouth, New Hampshire, to Exit
18 in Milton, New Hampshire. It is the major north-south road in the eastern portion of the state,
and connects the Blue Star Turnpike to NH 16, which is the major roadway to northern New
Hampshire along the eastern border of New Hampshire. It also connects the three major cities
in eastern New Hampshire (Portsmouth, Dover and Rochester) and connects to several major
highways that include US 4, NH 16, NH 125 and Interstate 95. There are two mainline toll
locations at Dover and Rochester. The Spaulding Turnpike and Blue Star Turnpike are also
collectively known as the Eastern Turnpike.
Page 4 May 29, 2015NH Turnpike System Traffic and Revenue Study
Figure 1: New Hampshire Turnpike System
Page 5 May 29, 2015NH Turnpike System Traffic and Revenue Study
The major events that occurred in the development of the Turnpike System are summarized in
Table 1, as follows:
Table 1: Major Events on the New Hampshire Turnpike
Date Activity
1950 (Jun. 24) First toll plaza opens - Hampton (toll was 20¢ for a passenger car).
1955 Completion of the Nashua to Manchester segment of the Central Turnpike.
1955 (Aug. 21) Merrimack Toll Plaza opens. Toll was 25¢ for a passenger car.
Tokens authorized providing a 1/3 discount. Two types of tokens were
1955 authorized. An “A” token had a trip fare value of 10¢ and a “B” token had a trip
fare value of 15¢. Tokens could be used by any class of vehicle.
1956 The Portsmouth to Dover segment of the Spaulding Turnpike was completed.
1956 (Oct. 3) Dover Toll Plaza opens. Toll was 10¢ for a passenger car.
1957 Increase in toll rate at Dover Toll to 15¢ for a passenger car.
1957 The Manchester to Concord segment of the Central Turnpike was completed.
1957 The Dover to Rochester segment of the Spaulding Turnpike was completed.
1957 (Aug. 29) The Rochester Toll Plaza opens. Toll was 15¢ for a passenger car.
1957 (Aug. 30) The Hooksett Toll Plaza opens. Toll was 25¢ for a passenger car.
1961 The rate decreased at Dover Toll to 10¢ for a passenger car.
1961 (Jun. 21) Toll rate increased at Hampton Toll to 25¢ for a passenger car.
Initiated charge program for commercial accounts. A 1/3 discount was provided
1972
in the program.
1975 (Jul. 1) Toll rate increase at Hampton Toll to 40¢ for a passenger car.
1977 Eastern Turnpike (I-95) widened from 4 to 8 lanes.
Reconstruction and relocation of Hampton Toll completed with new ramp and
1977 (Feb. 1)
mainline plazas opened to traffic.
Toll rates at Hooksett and Merrimack Tolls increased to 40¢ for a passenger car.
1977 (Apr. 1) Discontinued the sale of “A” tokens. Tokens restricted to two axle or four tire
vehicles. Eliminated the 1/3 discount for commercial charge accounts.
1979 (Aug. 23) Tolls eliminated at the Hampton Ramp Toll Plaza.
Central Turnpike widened from 4 to 6 lanes from the junction of I-93/I-293 in
1979
Hooksett to I-93/I-89 in Bow.
1979 (Dec. 3) Reconstruction completed on new Hooksett Toll Plaza ramp and mainline barrier.
Toll rates increased as follows. Merrimack, Hooksett & Hampton (main) 50¢ for a
1979 (Dec. 3) passenger car. Dover 15¢ for a passenger car. Rochester 20¢ for a passenger
car.
1979 (Dec. 3) Discount for commuter tokens increased to 50%.
Page 6 May 29, 2015NH Turnpike System Traffic and Revenue Study
Date Activity
1981 (Jul. 1) Toll reinstated on the Hampton Ramp Toll Plaza.
1981 (Aug. 20) Spaulding Turnpike Extension opened from Rochester to Milton.
1986 (Dec. 1) Automated truck charge system initiated.
1987 (Apr. 15) Toll rates increased at Dover & Rochester Toll to 25¢ for a passenger car.
Toll increased at Hampton Toll (mainline to 75¢ and ramp to 40¢ for a passenger
1987 (Jul. 1)
car).
Toll reduced at Hampton Toll (mainline to 50¢ and ramp to 25¢ for a passenger
1987 (Oct. 28)
car).
Exit 8 Interchange, Nashua, New Hampshire. The first project to be completed in
the Ten Year Plan to expand and improve the New Hampshire Turnpike System
1987
(Chapter 203, Laws of 1986) was the Exit 8 Interchange in Nashua, New
Hampshire that opened to traffic in June 1987.
Toll increased at Hampton Main Toll to 75¢ for passenger cars, Hampton Ramp
1988 (Jan. 1)
remains at 25¢.
Merrimack Toll Plaza (Mainline and Ramps) closed. On this date, the Merrimack
1989 (Jan. 4)
Toll Plaza discontinued collection of tolls and was dismantled.
1989 (Jan. 4) Bedford Toll Plaza opened to traffic.
Exit 11 Ramp (Temporary) Toll Plaza opened to traffic. On this date, the Exit 11
1989 (Jan. 4)
Toll Plaza opened to traffic replacing the dismantled Merrimack Toll (Ramps).
General toll rate increase for entire Turnpike System. Increase of 25 cents at
each plaza for passenger cars. Substantial increase for commercial vehicles (to
1989 (Oct. 16) recognize weight on turnpike infrastructure). Discount for commercial charge
program 5% to 30% graduated. Discount for commuters decreased from 50% to
40%.
Commuter discount (Tokens) revised from 40% to 50%. Change in commercial
1990 (Jul. 11)
charge discount (5-30%) applies to total transactions monthly.
1990 (Oct. 2) Merrimack Industrial Interchange Toll Plaza opened to traffic.
1990 (Nov. 29) Bedford Road Interchange Toll Plaza opened to traffic.
“Honor System” Toll Collection Began at Exit 11 Toll Plaza. Initiated unattended
1991 (Feb. 4)
toll collection at Exit 11 Toll Plaza between the hours of 9 PM and 5 AM daily.
1991 (May 15) Hampton Main Toll Plaza expansion completed.
1991 (Aug. 30) Cheshire Toll Bridge began operation by the Bureau of Turnpikes.
1991 (Oct. 1) Bedford Toll Plaza Toll Collection System Conversion.
1991 (Nov. 18) Exit 11 Interchange Toll Plaza opens to traffic.
1991 (Dec. 1) Hampton Main Toll Plaza Toll Collection System Conversion.
1992 (Feb.) Hampton Ramp Toll Plaza Toll Collection System Conversion.
1992 (Apr. 1) Dover Toll Plaza Toll Collection System Conversion.
1992 (Jun. 1) Rochester Toll Plaza Toll Collection System Conversion.
Page 7 May 29, 2015NH Turnpike System Traffic and Revenue Study
Date Activity
1992 (Aug. 3) Cheshire Bridge closed for rehabilitation.
1992 (Nov. 14) Exit 11 Toll Plaza Toll Collection System Conversion.
1993 (Aug. 9) “Honor System” Toll Collection begins at Cheshire Toll Bridge.
Exit 11 Interchange (Merrimack) completed as part of the Capital Improvement
1993 (Jul. 30)
Program.
1993 (Nov. 18) Gosling Road Interchange on the Spaulding Turnpike opened.
1993 (Dec. 20) “Honor System” Toll Collection begins at Exit 10 and Exit 12.
1994 (Jun.) Two seasonal toll lanes added to Hooksett Main Toll Plaza.
1994 (Jun.) Hampton Main Toll Plaza changed to all-attended operation.
1994 (Nov. 1) Increased discount in Commercial Charge Program to 50%.
Changes at Hampton Main Toll Plaza adding one reversible lane (replacing
1995 (Jul. 30) standard ACM lane) allowing 10 operational lanes in one direction of travel for the
first time.
1995 (Aug. 4) Initiated Tandem Toll Collection at Hampton Main Toll Plaza.
1995 (Aug. 14) “Honor System” Toll Collection began at Hooksett Ramp Toll Plaza.
1995 (Aug. 14) “Bi-directional” Toll Collection began at Rochester Toll Plaza.
1995 (Aug. 14) “HOV” (High Occupancy Vehicle) Test began at Bedford Toll.
1995 (Oct.) Reactivated Automatic Toll Lanes at Hampton Main Toll.
1995 (Nov. 1) Truck charge card discount set at a flat 30% rate.
Hampton Main Toll Plaza converted to entirely attended operation with all
1996 (May)
automatic lane equipment taken out of service.
1997 (Jun.) Expanded Hampton Ramp Toll Plaza from 5 to 7 toll lanes.
1997 (Nov.) Ended a two-year HOV Test at Bedford Toll Plaza.
2000 (Jul. 19) Expansion of Dover Toll Plaza complete.
2001 (Jul. 1) Toll collection ceased at Cheshire Toll Bridge - per legislation.
2002 (Apr. 5) Rochester Toll Plaza staffing changed back to conventional staffing.
2002 Completed the 5th lane project at the Hampton Toll Plaza on I-95.
2003 (Jul. 23) Opened an additional lane for the first time at the Hooksett Ramp toll facility.
2003 (Aug. 21) One-way toll collection test initiated at the Hampton Toll Plaza.
2003 (Nov. 1) Two-way tolling returns to Hampton Main Toll Plaza for the winter months.
2004 (Jan. 9) Hampton Ramp Toll Plaza converted to all attended capability.
Two new toll lanes, one north and one south, at Bedford Toll Plaza, were opened
2004 (Jan. 29)
to revenue collection.
Page 8 May 29, 2015NH Turnpike System Traffic and Revenue Study
Date Activity
2004 (Jun. 30) One-way toll collection reinstated at the Hampton Toll Plaza.
2004 (Oct. 21) Two way tolling returns to Hampton Main Toll Plaza.
2005 (Mar.) Hampton Ramp converted to an all attended plaza just like Hampton Main.
2005 (Apr. 12) Hooksett Ramp converted back to a 24/7/365 plaza.
The first NH toll facilities to be converted to E-ZPass – Hooksett Main, Hooksett
Ramp and Bedford Toll. Cars with NH E-ZPass tags receive a 30% discount
from cash (compared to a 50% discount for tokens) and trucks with NH E-ZPass
2005 (Jul. 11)
receive a 10% discount from cash (compared to a 30% discount with the
Commercial Charge program). Non-New Hampshire E-ZPass tagholders pay the
cash rates.
Phase Two of E-ZPass conversion takes place: Merrimack Ramp Toll Plazas
2005 (Jul. 18)
(Exits 10, 11 and 12).
2005 (Aug. 2) Phase Three of E-ZPass deployed at Hampton Main and Hampton Ramp.
2005 (Aug. 3) The price of transponders increased from $5.00 to $23.85 each.
2005 (Aug. 15) Phase Four of E-ZPass deployed at Dover and Rochester Toll Plazas.
NH Turnpike Token Sales cease per HB 2 of the FY 2006/FY 2007 biennial
2005 (Sept. 1)
budget.
2005 (Sept. 26) Price of transponders increased – from $23.85 to $24.61 for flat packs
Commercial Charge Program ends at 11:59:59. Magnetically encoded card
2005 (Sept. 30)
system replaced by E-ZPass.
NH Turnpike Tokens (B) are no longer accepted as valid toll fare payment per
2006 (Jan. 1) state law. Staffed ACM lanes from 1-1 through 1-9-2006 to ensure that motorists
were aware that tokens are no longer accepted.
New toll rate implemented at Dover $0.50-$0.75; Rochester $0.50-$0.75,
2007 (Oct. 22) Hampton Ramp $0.50-$0.75; Bedford and Hooksett $0.75-$1.00; and Hampton
Main $1.00-$1.50
New terms, conditions, application and transponder price change went into effect.
2008 (May 1) Price changed for interior tag from $24.61 to $20.95, and exterior tag from $31.83
to $33.04
2008 (Jun. 9 & 16) Granite Street ramps open to traffic at Exit 5 in Manchester
HB 391 passes, authorizing the Turnpike Bureau to purchase the 1.6 miles of I-95
from the Portsmouth Traffic Circle to the Maine border, and authorizing the
2009 (Jun. 30) following projects: Hampton Open Road Tolling (“ORT”), Bedford ORT, Hooksett
ORT, Portsmouth I-95 Soundwall, Seabrook NH 107 Bridge over I-95 and the
Dover segment of the Newington –Dover Projects.
2009 (Jul. 1) New toll rate implemented at Hampton Main $1.50 – $2.00
ORT lanes opened at Hampton Main plaza, allowing high-speed toll collection for
2010 (Jun. 17)
E-ZPass customers
Page 9 May 29, 2015NH Turnpike System Traffic and Revenue Study
Date Activity
Manchester Airport Access Road opens, connecting to the Central Turnpike near
2011 (Nov. 11) the Bedford Main plaza. Vehicles using this road avoid all tolls in the
Bedford/Merrimack area.
E-ZPass transponder prices changed. Price dropped for interior tag from to
2012 (Apr. 1)
$20.95 to $8.90, and exterior tag from $33.04 to $15.19.
Premium Outlets, with 100 stores and more than 400,000 square feet, opens
2012 (Jun. 14)
adjacent to Exit 10 in Merrimack, increasing toll transactions at the Exit 10 ramp.
ORT lanes opened at Hooksett Main plaza, allowing high-speed toll collection for
2013 (May 22)
E-ZPass customers
Tolls were discontinued at the Bedford Road ramps (Exit 12 of the Central
2014 (Jul. 18)
Turnpike)
Page 10 May 29, 2015NH Turnpike System Traffic and Revenue Study
4. HISTORICAL TRAFFIC AND REVENUE
This section discusses historical traffic and toll revenue trends of the Turnpike System.
4.1. HISTORICAL TOLL TRANSACTIONS AND TOLL REVENUE TRENDS
Figure 2 illustrates toll transactions and revenue for the entire Turnpike System for FY 1950
through FY 2014. Both toll transaction and revenue graphs are generally upward sloping
throughout time, indicating that toll transactions and revenues have generally increased
consistently across the Turnpike System. The graph shows that there were some short periods
where toll transactions decreased but later recovered, and these appear to coincide with
economic recessions and toll rate increases. Revenues generally increased across the
Turnpike System, although the growth was relatively flat for some short time periods. Tolls were
last increased system wide in October 2007; the toll increases prior to that were in October
1989 and December 1979. After the 1989 toll increase, both traffic and revenue increased
steadily until 2005. In July 2005, E-ZPass was implemented on the Turnpike System, and the
toll discount was lowered from 50 percent to 30 percent for passenger cars and from 30 percent
to 10 percent for commercial vehicles. NHDOT stopped accepting tokens (which provided a 50
percent discount for passenger cars) in January 2006. The October 2007 toll increase – 25
cents for cars and 50 cents for trucks at most locations – brought about a small decline in traffic
but a significant increase in toll revenue. In FY 2009, traffic continued to decrease but revenue
increased over the previous year due to the October 2007 toll increase, though some of the
traffic decrease could also be attributed to economic conditions, gas prices, and factors that
caused traffic levels to flatten, then decrease, throughout the nation (as further discussed in
Section 7.1). The Hampton Main Plaza saw a toll increase from $1.50 to $2.00 which had little
effect on traffic but increased revenues at that location. In November 2011 the Manchester
Airport Access Road opened, causing some losses in traffic and revenue at the Bedford toll
locations primarily due to traffic to and from the south having free access into the airport. FY
2013 saw the opening of an outlet mall in Merrimack, which has contributed to most of the
growth in traffic observed at Exit 10. In July 2014 – a few weeks into FY 2015 - the Bedford
Ramp Toll was discontinued. The impact of this toll removal is discussed along with the rest of
FY 2015 later in this report in Section 9.2.
Page 11 May 29, 2015NH Turn
npike System
m Traffic and
d Revenue S
Study
Figurre 2: NH Turrnpike Syste
em Historic
cal Toll Tran
nsactions a
and Toll Rev
venue Trend
ds
4.2. TOLL
T TRANS
SACTION TRENDS
T
Table 2 summarizes
s the annual toll transacttions betwee en FY 1991 and FY 2014 for each o of the
three Turnpikes as well
w as the entiree Turnpiike System. Annual tolll transaction ns have gene erally
increasedd every yeaar across the e Turnpike System.
S Hoowever, Blue e Star Turnp pike transacctions
decreaseed in both FYY 2004 and FY 2005 du ue to the inaability to cou
unt southbou und traffic da
ata at
the Hammpton Toll Plaza during the one-wa ay tolling ex periments cconducted by NHDOT in the
summer//fall of 20033 and 2004 4. The dive ersion caussed by the October 20 007 toll incrrease
contributed to both the FY 20 008 and 20 009 decreasse in Turnp pike traffic, and the Ce entral
Turnpikee’s free inte
erchange with the Man nchester Airrport Accesss Road in November 2011
contributed to some toll traffic los
ss in the Beddford area in
n FY 2012 and FY 2013.
Page 12 May 29, 2015NH Turnpike System Traffic and Revenue Study
Table 2: NH Turnpike System Historical Annual Toll Transactions (in millions)
Blue Star Spaulding
Fiscal Year Central Turnpike Total System
Turnpike Turnpike
1991 32.5 23.4 13.7 69.6
1992 33.2 23.6 14.0 70.8
1993 33.5 24.0 14.5 72.0
1994 34.7 24.8 15.4 74.9
1995 35.9 26.1 16.5 78.5
1996 37.2 27.0 17.2 81.4
1997 38.9 28.1 18.0 85.0
1998 40.6 29.4 19.0 89.0
1999 42.6 31.4 20.0 94.0
2000 45.3 33.2 20.9 99.4
2001 47.6 34.0 22.0 103.6
2002 49.3 35.8 22.6 107.7
2003 50.5 36.4 23.1 110.0
20041 52.2 34.6 23.8 110.6
20051,2 53.9 32.2 23.9 110.0
20062 54.6 36.6 23.3 114.6
2007 54.7 37.4 23.4 115.5
20083 53.8 36.6 22.8 113.2
2009 51.5 34.7 21.4 107.7
20104 51.9 35.3 21.1 108.3
2011 52.4 35.3 21.1 108.7
20125 51.5 35.8 21.5 108.7
2013 50.7 35.8 21.8 108.2
2014 52.2 36.8 22.5 111.5
1
One-way tolling at Hampton Main Toll Plaza
2
Conversion to new toll system and implementation of E-ZPass
3
General toll Increase October 22, 2007
4
Hampton Main toll Increase July 1, 2009
5
Manchester Airport Access Road opened November 2011
Notes: Non-paying transactions (valid and violations) are included in these numbers.
Data will not necessarily sum to totals due to rounding.
Between FY 1991 and FY 2003, total toll transactions across the entire Turnpike System
increased annually by an average of 3.9 percent per year. After that time there was a period of
flattened traffic for several years, through about 2007, followed by a 2.0 percent decrease in FY
2008. Traffic continued to decline another 4.9 percent in FY 2009 both as a result of the mid-FY
2008 toll increase and the economic downturn. This was followed by low growth rates of 0.6
percent in FY 2010 and 0.4 percent in FY 2011. There was no overall growth from FY 2011 to
FY 2012, mainly due to a shift in traffic to the free Manchester Airport Access Road (MAAR)
interchange on the Central Turnpike. FY 2013 had a slight decrease in traffic of 0.4 percent
Page 13 May 29, 2015NH Turn
npike System
m Traffic and
d Revenue S
Study
with morre Central Turnpike
T trafffic shifting to
t the free M
MAAR intercchange, while FY 2014 4 saw
some reccovery with 3.0 percentt growth in tollt transacti ons. Toll trransactions on the indivvidual
Turnpike
es increasedd at an average annual rate of 2.1 1 percent o on the Centrral Turnpikee, 2.2
percent on
o the Spauulding Turnp pike, and 2.0 0 percent o n the Blue SStar Turnpikke during th
he FY
1991 to FY
F 2014 time e period, forr a systemwiide growth raate of 2.1 pe
ercent.
Historical toll transac
ction trends between FYY 1950 and FY 2014 arre illustratedd in Figure 3 with
volumes indexed to FY 1991 values. From this graphicc, we can ob bserve that tthe three geeneral
toll rate increases occcurred close
e to periods of economiic recessions, and in all cases, toll ttraffic
transactio ons decreassed. Trans saction grow owed down during the other econ
wth also slo nomic
recession n periods.
Figure 3: NH Turn
npike System
m Historica
al Toll Trans
saction Tren
nds
Figure 4 shows the historical to oll transactio
on trends fo
or cars and trucks on e each of the three
Turnpike es for the FYY 1991-2014 4 period. Thhe three turrnpikes exhiibited simila
ar patterns in car
traffic, grrowing stead
dily from FY
Y 1991 throu ugh the earrly 2000s, fo
ollowed by fflat growth iin FY
2006 and d 2007 and declines in FY 2009 and 2010. A Annual traffic between F FY 2010 an nd FY
2013 rem mained virtuaally unchang
ged, while FYY 2014 has shown some e recovery ttoward previously
higher traaffic volumes
s.
Page 14 May 29, 2015NH Turn
npike System
m Traffic and
d Revenue S
Study
The Central and Spa aulding Turnpikes, both serving
s more e local than long-distancce traffic, ha
ad flat
to declining truck groowth in 2006 6 through 20 008, while th he Blue Star Turnpike – more of a long-
haul routte – had inc
creasing truc ck traffic from
m FY 2006 through 200 08. All three facilities ssaw a
decline in truck trafffic in FY 200 09 and FY 2010 due to o the downtturn in the e economy an nd FY
2008 tolll increases. Similar to thet car trafffic, the truckk traffic cha
anged very little betwee en FY
2010 and d FY 2013, except at th he Central Turnpike whicch saw som me traffic loss due to the e free
MAAR in nterchange. Some prom mising growtth was seen n in FY 2014 4 on all thre
ee turnpikes, with
overall passenger ca ar traffic growth of 2.9 percent
p overr FY 2013 and truck trafffic growth o of 5.3
percent over
o FY 2013.
Figure 4: Historical Toll
T Transac s by Turnpiike, FY 1991
ction Trends 1-2014
Page 15 May 29, 2015NH Turn
npike System
m Traffic and
d Revenue S
Study
Figurre 4: Historical Toll Tra
ansaction Trends
T by T urnpike, FY
Y 1991-2014
4 (continued
d)
Page 16 May 29, 2015NH Turnpike System Traffic and Revenue Study
4.3. TOLL REVENUE TRENDS
Annual toll revenues for each of the three Turnpikes as well as the entire system are
summarized in Table 3 for the period FY 1991 to FY 2014.
Table 3: NH Turnpike System Historical Annual Toll Revenues (in millions)
Central Blue Star Spaulding
Fiscal Year Total System
Turnpike Turnpike Turnpike
1991 $18.9 $20.8 $5.5 $45.3
1992 $18.9 $20.7 $5.5 $45.2
1993 $18.8 $20.8 $5.7 $45.4
1994 $19.5 $21.4 $6.0 $46.9
1995 $19.8 $22.2 $6.2 $48.1
1996 $20.4 $22.5 $6.4 $49.3
1997 $21.6 $23.8 $6.7 $52.2
1998 $22.5 $24.8 $7.1 $54.3
1999 $23.6 $26.1 $7.4 $57.1
2000 $25.0 $27.5 $7.7 $60.2
2001 $26.0 $27.5 $8.0 $61.5
2002 $27.5 $28.6 $8.2 $64.4
2003 $27.3 $28.7 $8.4 $64.4
20041 $28.1 $29.1 $8.6 $65.8
20051,2 $28.7 $28.4 $8.8 $65.9
20062 $33.6 $32.3 $10.1 $76.0
2007 $36.7 $34.8 $11.1 $82.6
20083 $42.9 $43.4 $14.1 $100.3
2009 $43.5 $46.3 $14.7 $104.4
20104 $44.0 $58.1 $14.5 $116.6
2011 $44.2 $58.2 $14.4 $116.7
20125 $43.3 $58.8 $14.6 $116.6
2013 $41.9 $58.8 $14.7 $115.4
2014 $43.2 $59.6 $15.1 $117.9
1
One-way tolling at Hampton Main Toll Plaza
2
Conversion to new toll system and implementation of E-ZPass
3
General toll Increase October 22, 2007
4
Hampton Main toll Increase July 1, 2009
5
The free Manchester Airport Access Road interchange on the Central Turnpike opened November 11, 2011
Notes: This table shows the historical toll revenues recorded on a cash basis.
FY 1991-2006 reported figures are derived from the Turnpike System’s internal, monthly traffic and revenue report, which is
prepared from information from the Turnpike System’s E-ZPass and toll collection system vendors and does not include other
income such as property sales.
Fiscal Years 2006-2011 figures are derived from the Turnpike System’s internal accounting system and do not include property
sales or other income.
Data will not necessarily add to totals because of rounding.
Page 17 May 29, 2015NH Turnpike System Traffic and Revenue Study
The table shows that annual toll revenues have generally increased each year across the
Turnpike System throughout the period shown. The first large increase in toll revenues
occurred between FY 2005 and FY 2006 due to the implementation of E-ZPass on the Turnpike
System and discontinuation of token usage, which coincided with a decrease in the toll discount
rate. In FY 2008, there was another significant increase in revenues - $17.7 million or 21.4
percent over FY 2007– due to the October 2007 toll increase, and FY 2009 also saw a revenue
increase of 4.1 percent due to this toll increase. The July 1, 2009 toll increase at the Hampton
Main Plaza increased systemwide revenue by 11.6 percent in FY 2010 compared to the
previous year. There was little change in total system revenue between FY 2010 and FY 2012,
however, some losses were seen in FY 2012 and FY 2013 on the Central Turnpike due to the
opening of the Manchester Airport Access Road on November 11, 2011 and the following shift
in traffic from the Bedford area toll plazas to this free interchange. This reduced systemwide toll
revenues for those two years. As the economy started improving, FY 2014 saw 2.2 percent
revenue growth over FY 2013.
Between FY 1991 and FY 2014, toll revenues increased annually by an average of 4.2 percent
across the entire Turnpike System. The individual turnpikes experienced annual revenue
growth rates of 3.7 percent on the Central Turnpike, 4.5 percent on the Spaulding Turnpike, and
4.7 percent on the Blue Star Turnpike.
Figure 5 shows historical annual toll revenues between FY 1950 and FY 2014. This graphic
shows that total system wide toll revenues generally showed little to no growth during all periods
of economic recession. The exceptions were the economic recession in the early 1980s when
revenue actually increased, and the recent recession, due to the general toll increase in October
2007 and the Hampton Main toll increase in July 2009. Even after the official end of the recent
recession, toll revenue remained flat for several years. However, the slowly-improving economy
is finally leading to some traffic growth, both on the New Hampshire Turnpike System and on a
nationwide basis, which produced toll revenue growth in FY 2014.
Page 18 May 29, 2015NH Turnpike System Traffic and Revenue Study
Figure 5: NH Turnpike System Historical Toll Revenues
Figure 6 shows historical toll transaction and revenue trends for each of the three Turnpikes for
the FY 1991 to FY 2014 period. Through about FY 2005, total toll revenue generally increased
consistently on each turnpike, with a small decrease on the Blue Star Turnpike in FY 2005.
Also, toll revenues on the Blue Star Turnpike experienced very little growth between FY 2002
and FY 2005, due in part to the one-way tolling experiment. In FY 2005/2006 through FY 2007,
all three Turnpikes experienced a flattening and then a decline in traffic after the October 2007
toll increase. After FY 2009 traffic has remained nearly flat on all three turnpikes until FY 2014,
when it increased by three percent over FY 2013. Toll revenues grew at a greater rate than
usual in the past decade due to E-ZPass implementation and the end of token sales in FY
2006 (increasing the tolls for discounted trips), the October 2007 systemwide toll increase, and
the July 2009 Hampton Main toll increase. The recovering traffic growth in FY 2014 increased
total toll revenue by 2.2 percent.
Page 19 May 29, 2015NH Turn
npike System
m Traffic and
d Revenue S
Study
Figure 6: Historical Toll
T Transac
ction and R
Revenue Tre
ends by Turrnpike
Page 20 May 29, 2015NH Turn
npike System
m Traffic and
d Revenue S
Study
Figu
ure 6: Historrical Toll Transaction and
a Revenu
ue Trends b
by Turnpike (continued
d)
4.4. COMPARISO
C ON OF ACTU
UAL TOLL REVENUES
R S TO RECEN
NT PROJEC
CTIONS
Jacobs previously
p projected trafffic and reve
enue on the e Turnpike S System for tthe August 2012
bond issuuance. Table 4 comparres Jacobs’ projections
p a
against the a
actual toll re
evenues colle ected
by the Turnpike
T Syystem for thhe fiscal yeaars 2012 th hrough 2014 4. Note th hat the reve enues
projected
d for August 2012 bond d issuance did not inc lude adjustm ments for violation reve enue;
e, FY 2012 the actual revenues collected w
therefore were slightlyy more than n projected (0.4
percent).. FY 2013 ac ctual revenu
ues were 0.44 percent be elow the fore
ecast, due to o traffic losse
es on
the Centtral Turnpikee that were slightly
s grea
ater than exp pected, and no growth on the Blue e Star
Turnpikee that year. In
I FY 2014, the actual trraffic was 1.0
0 percent ovver Jacobs’ fforecast.
Tablle 4: Actual Toll Reven
nues vs. 201
12 Projectio
ons, Millions
s
August 2012
2
Fiscal Year Actual Revenue
Projected
P Reevenue
201
12 $116.1
1 $116.6
201
13 $115.9
9 $115.4
201
14 $116.7
7 $117.9
Note: Viola
ation revenue not
n included in projected
p reven
nues, but is inccluded in actua
al revenues.
Page 21 May 29, 2015NH Turnpike System Traffic and Revenue Study
5. REVIEW OF PROPOSED CAPITAL IMPROVEMENT PROGRAM
This section presents a review of the Turnpike System’s historical and proposed capital
improvement program for the 20-year period FY 2005-2024 as shown in Table 5 below.
Table 5: Historical and Proposed NHDOT Capital Expenditures, Millions
Central Blue Star Spaulding Other Total
Fiscal Year Turnpike Turnpike Turnpike Projects1 Turnpike
2005 $1.2 $0.2 $19.0 $20.4
2006 $2.5 $1.9 $8.8 $13.2
2007 $2.0 $6.5 $8.5
2008 $0.4 $0.2 $7.4 $3.0 $11.0
2009 $6.5 $0.2 $18.5 $0.9 $26.1
2010 $9.8 $11.8 $42.0 $2.9 $66.4
2011 $7.2 $4.3 $40.0 $1.2 $52.8
2012 $12.5 $1.0 $32.7 $0.7 $46.9
2013 $27.3 $5.0 $32.4 $4.9 $69.6
2014 $21.2 $2.4 $20.4 $5.8 $49.7
Total '05-'14 $90.6 $24.9 $195.5 $53.7 $364.6
2015 $14.7 $0.9 $22.7 $2.6 $40.9
2016 $15.4 $4.4 $21.7 $0.5 $42.0
2017 $11.9 $5.0 $14.5 $0.5 $31.9
2018 $5.0 $2.4 $16.2 $0.5 $24.1
2019 $3.0 $1.0 $18.9 $0.5 $23.4
2020 $5.0 $1.0 $27.8 $0.5 $34.3
2021 $4.0 $- $30.2 $0.5 $34.7
2022 $20.0 $- $16.1 $0.5 $36.6
2023 $24.0 $0.5 $24.5
2024 $21.0 $0.5 $21.5
Total '15-'24 $126.0 $14.7 $168.1 $7.1 $313.9
1
Miscellaneous Turnpike System Projects funded with Federal Aid and matched with Turnpike funds, and/or
Systemwide projects.
Notes:
-Central Turnpike Projects include: Bow-Concord I-93 Bridge Redecking, Manchester Interstate 293 Exit 4 Bridge
Replacements, Bedford ORT, and Nashua-Bedford Turnpike widening.
-Blue Star Turnpike Projects include: I-95 Bridge over the Taylor River.
-Spaulding Turnpike Projects include: Newington-Dover Little Bay Bridges and Roadway Expansion Exits 3-6
-Data will not necessarily add to totals because of rounding.
Over the ten-year period FY 2005-2014 Turnpike System-funded capital expenditures totaled
$364.6 million. The largest share of this - $195.5 million - was spent on Spaulding Turnpike
projects. Funding sources for these projects include toll revenues, other Turnpike System
revenues and Turnpike System bond proceeds. Not included in these numbers are a total of
$125.1 million of federal funds expended on Turnpike System fixed assets during the FY 2005-
FY 2014 period. Turnpike System-funded capital expenditures are programmed at a total of
$313.9 million over the FY 2015-2024 period.
Page 22 May 29, 2015NH Turn
npike System
m Traffic and
d Revenue S
Study
After the completion of the turnppike expansion in Nashu ua in the late
e 1990s, the
e ten-year ca apital
improvemment program had few major proje ects with thee exception of the impleementation of E-
ZPass and
a the construction of the Granite e Street inte
erchange in n Mancheste er. The tolll rate
increase in 2007, the first sincee 1989, has allowed the e capital impprovement pprogram to m move
forward with
w the exp pansion of the
t Spauldin
ng Turnpikee in Rochesster along w with several other
major turrnpike projeccts. These are improveement projeccts that are cconsidered to be prioritiies to
address red listed brridges and im
mprove safetty and congeestion on thee Turnpike S
System.
Forty peercent of Tu urnpike Systtem capital expenditure es over the
e next ten yyears will bbe for
projects on the Spau ulding Turnpike, includin
ng widening and improveements from
m Exits 3 to 6 and
the comp pletion of th
he Newingtoon-Dover Litttle Bay Brid
dges. Upcomming capital expenditure es on
the Central Turnpike e include Bow
w-Concord I-93 Bridge RReplacemen nt, Manchestter Interstate
e 293
Exit 4 Bridge
B Replaacements, and
a Bedfordd ORT. To owards the end of the forecast pe eriod,
Nashua-Bedford Turrnpike widen ning is expeected to com
mmence. T The I-95 Tayylor River BBridge
and Dam m Replacement is the la argest upcoming projecct planned foor the Blue Star Turnpiike in
terms of capital expeenditures.
Figure 7 shows how w the capital plan was funded in th he past ten years versu us how it w
will be
funded over
o the nextt ten years. The shares
s of funding by Turnpike e System fun nds are expe
ected
to grow, while
w there will
w be no prrojects funde
ed by federaal funds in futture years.
Figurre 7: Fundin s for Capitall Improvement Program
ng Sources m
Page 23 May 29, 2015NH Turnpike System Traffic and Revenue Study
6. REVIEW OF HISTORICAL AND PROJECTED OPERATION, MAINTENANCE,
RENEWAL AND REPLACEMENT, AND DEBT SERVICE EXPENDITURES
This section presents a review of historical and projected Turnpike System operational
expenditures that consist of administrative costs, toll operations costs, maintenance costs, state
police enforcement costs, welcome centers and rest areas, renewal and replacement (R&R)
costs, toll processing costs, and payment for the new section of the Blue Star Turnpike (I-95). It
also includes a review of the Turnpike System’s historical and projected debt service
expenditures.
Administrative costs include administrative salaries, benefits, expenses, equipment, indirect
costs, cleaning, utilities, travel costs, audit expenses, and payments to other state agencies or
DOT Bureaus for services.
Toll operations costs include toll operations salaries, benefits, expenses, utilities, toll system
warranty, equipment and travel costs.
Maintenance costs include maintenance salaries, benefits, expenses, rents and lease costs,
utilities, equipment and travel costs.
Renewal and replacement costs are related to construction projects to preserve, maintain and
upgrade the existing infrastructure (i.e., paving, signing, guardrail, bridge rehabilitation, building
and toll plaza repairs, bridge painting etc.).
Toll processing costs include banking and credit card fees, E-ZPass-related costs (customer
service center expenses, walk-in center expenses, Interagency Group (IAG) organizational
dues, violation processing expenses, and vehicle registration look-up fees), toll system
maintenance expenses through a vendor, and transponder purchases and replacement.
6.1. TOLL PROCESSING COSTS
Table 6 summarizes historical and projected NHDOT toll processing expenses for the period FY
2005 through 2024.
Table 6: Toll Processing Costs, Millions
Banking/ EZPass Toll EZPass
Credit Card CSC Maintenance Transponder Total Toll
Fiscal Year Fees Costs Costs Expenses Processing Costs
2005 $0.9 $0.7 $0.5 $1.6 $3.7
2006 $1.5 $3.7 $0.1 $5.5 $10.8
2007 $1.4 $3.8 $1.2 $1.0 $7.4
2008 $1.7 $4.3 $1.0 $0.8 $7.8
2009 $1.8 $5.1 $1.3 $0.7 $8.9
2010 $2.1 $5.3 $1.6 $0.8 $9.8
2011 $2.2 $5.8 $1.8 $0.8 $10.6
Page 24 May 29, 2015You can also read


