Maize root and shoot litter quality controls short-term CO2 and N2O emissions and bacterial community structure of arable soil
←
→
Page content transcription
If your browser does not render page correctly, please read the page content below
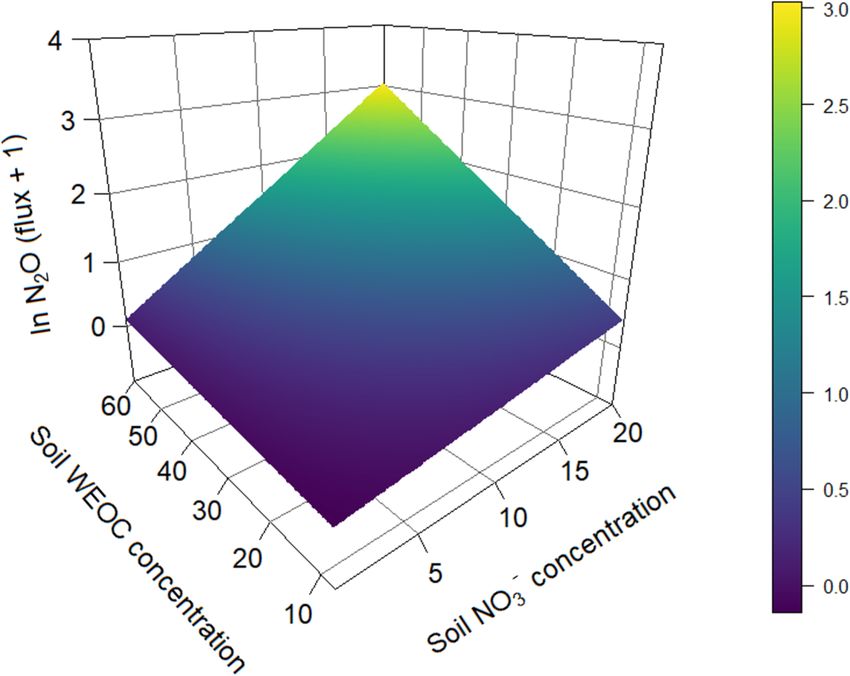
Biogeosciences, 17, 1181–1198, 2020
https://doi.org/10.5194/bg-17-1181-2020
© Author(s) 2020. This work is distributed under
the Creative Commons Attribution 4.0 License.

Maize root and shoot litter quality controls short-term CO2 and
N2O emissions and bacterial community structure of arable soil
Pauline Sophie Rummel1 , Birgit Pfeiffer1,2 , Johanna Pausch3 , Reinhard Well4 , Dominik Schneider2 , and
Klaus Dittert1
1 Division  of Plant Nutrition and Crop Physiology, Department of Crop Science,
University of Göttingen, Göttingen, Germany
2 Institute of Microbiology and Genetics, Department of Genomic and Applied Microbiology,

University of Göttingen, Göttingen, Germany
3 Agroecology, Faculty for Biology, Chemistry, and Earth Sciences,

University of Bayreuth, Bayreuth, Germany
4 Thünen Institute, Climate-Smart Agriculture, Braunschweig, Germany

Correspondence: Pauline Sophie Rummel (pauline.rummel@uni-goettingen.de)

Received: 15 August 2019 – Discussion started: 13 September 2019
Revised: 27 January 2020 – Accepted: 28 January 2020 – Published: 28 February 2020

Abstract. Chemical composition of root and shoot litter con-      identified a strong positive correlation between cumulative
trols decomposition and, subsequently, C availability for bi-     CO2 and N2 O emissions, supporting our hypothesis that
ological nitrogen transformation processes in soils. While        litter quality affects denitrification by creating plant-litter-
aboveground plant residues have been proven to increase           associated anaerobic microsites. The interdependency of C
N2 O emissions, studies on root litter effects are scarce. This   and N availability was validated by analyses of regression.
study aimed (1) to evaluate how fresh maize root litter affects   Moreover, there was a strong positive interaction between
N2 O emissions compared to fresh maize shoot litter, (2) to       soil NO− 3 and WEOC concentration resulting in much higher
assess whether N2 O emissions are related to the interaction      N2 O emissions, when both NO−       3 and WEOC were avail-
of C and N mineralization from soil and litter, and (3) to an-    able. A significant correlation was observed between total
alyze changes in soil microbial community structures related      CO2 and N2 O emissions, the soil bacterial community com-
to litter input and N2 O emissions.                               position, and the litter level, showing a clear separation of
   To obtain root and shoot litter, maize plants (Zea mays        root + shoot samples of all remaining samples. Bacterial di-
L.) were cultivated with two N fertilizer levels in a green-      versity decreased with higher N level and higher input of eas-
house and harvested. A two-factorial 22 d laboratory incu-        ily available C. Altogether, changes in bacterial community
bation experiment was set up with soil from both N levels         structure reflected degradability of maize litter with easily
(N1, N2) and three litter addition treatments (control, root,     degradable C from maize shoot litter favoring fast-growing
root + shoot). We measured CO2 and N2 O fluxes, analyzed          C-cycling and N-reducing bacteria of the phyla Actinobacte-
soil mineral N and water-extractable organic C (WEOC) con-        ria, Chloroflexi, Firmicutes, and Proteobacteria. In conclu-
centrations, and determined quality parameters of maize lit-      sion, litter quality is a major driver of N2 O and CO2 emis-
ter. Bacterial community structures were analyzed using 16S       sions from crop residues, especially when soil mineral N is
rRNA gene sequencing.                                             limited.
   Maize litter quality controlled NO− 3 and WEOC availabil-
ity and decomposition-related CO2 emissions. Emissions in-
duced by maize root litter remained low, while high bioavail-
ability of maize shoot litter strongly increased CO2 and N2 O
emissions when both root and shoot litter were added. We

Published by Copernicus Publications on behalf of the European Geosciences Union.
1182                  P. S. Rummel et al.: Maize root and shoot litter quality controls short-term CO2 and N2 O emissions

1   Introduction                                                      ulated by input of easily degradable C compounds (Fierer
                                                                      et al., 2016; Pascault et al., 2013), abundance of Acidobac-
Chemical composition controls decomposition of both roots             teria decreased following the addition of dissolved organic
(Birouste et al., 2012; Redin et al., 2014; Silver and Miya,          matter into the soil (Fierer et al., 2016). Similarly, denitri-
2001) and plant litter (Jensen et al., 2005; Kögel-Knabner,           fying microorganisms are found in bacteria, fungi, and ar-
2002; Zhang et al., 2008) and, subsequently, C availabil-             chaea depending on substrate availability and environmen-
ity for biological nitrogen transformation processes in soils.        tal conditions (Zumft, 1997). Fungi are seen as major con-
When O2 concentrations are low, denitrifying soil microor-            tributors to denitrification under aerobic and weakly anaer-
ganisms may use nitrate (NO−     3 ) as an electron acceptor in the   obic conditions, while bacterial denitrification predominates
respiratory chain to break down organic compounds (Zumft,             under strongly anaerobic conditions (Hayatsu et al., 2008).
1997). This leads to loss of plant-available N (Müller and            Denitrifying bacteria can be found in most phyla (Zumft,
Clough, 2014) and makes soils an important source of the              1997), with dominant populations in Pseudomonas and Al-
greenhouse gas N2 O (Ciais et al., 2013).                             caligenes (Gamble et al., 1977; Megonigal et al., 2013). The
    Plant residues have been proven to increase N2 O emis-            most abundant denitrifying bacteria in soil are heterotrophic
sions upon incorporation into soil. When different types of           and, as such, require a source of electrons or reducing equiv-
litter were compared, quality parameters of plant residues,           alents contained in C compounds of organic matter or plant
such as C : N ratio, lignin : N ratio, and chemical composi-          residues. Availability of organic C may thus affect both de-
tion of structural components explained a large share of vari-        composing and denitrifying soil microorganisms.
ances in N2 O emissions (Baggs et al., 2000; Chen et al.,                In most reported studies on decomposition and N2 O emis-
2013; Millar and Baggs, 2004). Especially in drier soils, den-        sions, dried and often ground plant material was used. This
itrification is largely controlled by the supply of readily de-       facilitates a homogenous distribution in soil and minimizes
composable organic matter (Azam et al., 2002; Burford and             differences between replicates. Nevertheless, drying of fine
Bremner, 1975; Loecke and Robertson, 2009). Availability of           roots prior to incubation increased their decomposition rate
easily degradable C compounds stimulates microbial respi-             and led to overestimation of decomposition and nutrient cy-
ration, limiting O2 at the microsite level and increasing N2 O        cling rates (Ludovici and Kress, 2006). Additionally, for-
emissions (Azam et al., 2002; Chen et al., 2013; Miller et            mation of plant-litter-associated anaerobic hot spots was re-
al., 2008). Furthermore, plant litter enhances local anaero-          duced when ground plant material was homogenously mixed
bicity by absorbing water from surrounding pores and retain-          with the soil, while litter aggregation significantly increased
ing high moisture concentrations (Kravchenko et al., 2017,            soil N2 O emissions (Loecke and Robertson, 2009). Differ-
2018).                                                                ences in N2 O emissions between two clover species were
    While effects of aboveground plant residues on N2 O emis-         observed only with intact (but dried) leaves, but not when
sions have been studied extensively, studies of root residues         ground material was used (Kravchenko et al., 2018).
on N2 O emissions are scarce. In a temperate forest soil, fine           The aims of this study were (1) to evaluate how fresh
root litter of maize and native tree species did not cause any        maize root litter affects N2 O emissions compared to fresh
N2 O emissions, but a very close interrelation between C min-         maize shoot litter, (2) to assess to what extent N2 O emissions
eralization of fine root litter and N2 O emissions was found in       are related to the interaction of C and N mineralization from
other biomes (Hu et al., 2016). In other studies, lower cumu-         soil and litter, and (3) to analyze the changes in soil microbial
lative N2 O emissions were reported after addition of sugar           community structures related to litter input and N2 O emis-
beet roots compared to leaves (Velthof et al., 2002) and rice         sions. We hypothesize that differences in N2 O emissions be-
roots compared to rice straw (Lou et al., 2007). Furthermore,         tween treatments can be related to degradability of maize lit-
decomposition dynamics of roots have been studied in great            ter with more easily degradable shoot litter leading to higher
detail, revealing that chemical composition explains most of          N2 O formation. We further expect that differences in litter
its variation (Birouste et al., 2012; Johnson et al., 2007; Ma-       chemical quality are reflected in the structural composition
chinet et al., 2011; Redin et al., 2014; Silver and Miya, 2001;       of the soil microbial community with higher availability of
Zhang and Wang, 2015). In general, decomposition rates of             N and C leading to a more specialized community.
hemicelluloses and pectin are higher than that of cellulose,             Maize plants were grown in a greenhouse to produce root
while among cell wall components lignin is most resistant             and shoot litter. As in many European countries the law
against microbial decomposition (Kögel-Knabner, 2002).                prohibits addition of mineral N with incorporation of crop
    Soil microorganisms are often specialized in specific sub-        residues or catch crops, we applied two N fertilizer regimes
strates with fungi being regarded as the main decomposers             (low vs. high) to realize differences in soil Nmin concentra-
of plant materials rich in cellulose and lignin, while hemi-          tion at harvest. We then set up a laboratory incubation experi-
celluloses and pectin are decomposed by many aerobic and              ment with fresh maize root or root and shoot litter under fully
anaerobic bacteria and fungi (Kögel-Knabner, 2002). While             controlled conditions and determined CO2 and N2 O fluxes
the phyla Firmicutes, Proteobacteria, and Bacteroidetes are           for 22 d. Soil samples were taken in regular intervals and
described as fast-growing copiotrophic bacteria that are stim-        analyzed for soil mineral N and water-extractable organic C

Biogeosciences, 17, 1181–1198, 2020                                                        www.biogeosciences.net/17/1181/2020/
P. S. Rummel et al.: Maize root and shoot litter quality controls short-term CO2 and N2 O emissions 1183
(WEOC) concentrations. At the end of the incubation exper- equal to ADFom minus ADL; lignin is equal to ADL. An-
iment, soil microbial community structures were analyzed to other subsample was milled using a ball mill, and total car-
identify adaptions to litter input. bon and nitrogen concentrations were analyzed using a C : N
analyzer (model 1110, Carlo Erba, Milan, Italy).
2 Material and methods 2.2 Incubation experiment
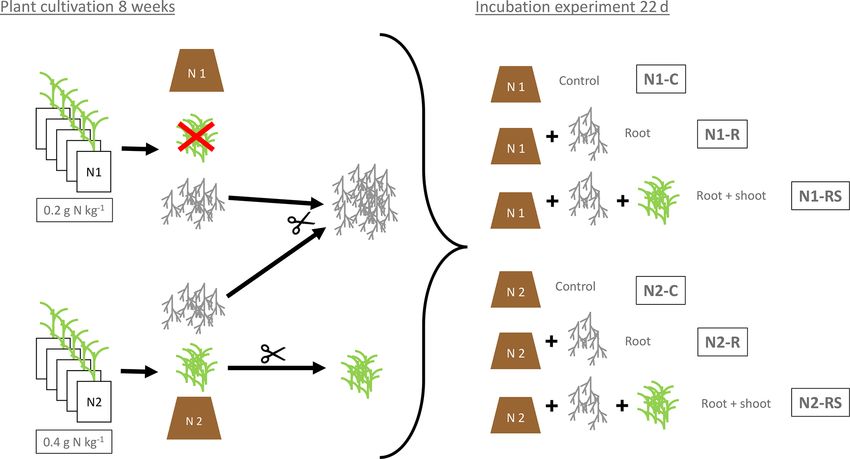
2.1 Preparation of plants and soils prior to incubation The incubation experiment consisted of a two-factorial setup
experiment comprising two N levels (N1 and N2) and three litter lev-
els (control: Cn; root: Rt; root + shoot: RS) (see Table 1 and
The soil for the experiment was collected 10 km south of Fig. 1 for details). To allow comparison of litter treatments
Göttingen, Germany, at the experimental farm Reinshof over soil conditions, the same litter types for both soil N lev-
of the University of Göttingen (51.484◦ N, 9.923◦ E). Soil els were used. As N2 plants had produced greater and health-
was classified as gleyic Fluvisol (21 % clay, 68 % silt, ier biomass during the pre-experimental growth phase, only
11 % sand) containing 1.5 % C and 2.81 % humus, with a N2 shoots were used for both soils. Roots from N1 and N2
pH (CaCl2 ) = 7.44. plants were mixed to ensure sufficient amounts for all repli-
Prior to the incubation experiment, maize plants were cates. Control soils (N1-Cn and N2-Cn) did not receive plant
cultivated to obtain shoot and root biomass. For maize biomass, yet they contained C input from rhizodeposition of
cultivation, Mitscherlich pots were filled with 5 kg of the previous maize growth. C remaining from rhizodeposi-
air-dried and sieved (2 mm) soil previously mixed with tion, root hairs, and small root fragments was calculated as
fertilizers (0.2 g N kg−1 as NH4 NO3 , 0.14 g P kg−1 as the difference in soil C concentration before and after maize
Ca(H2 PO4 )2 , 0.2 g K kg−1 as K2 SO4 and 0.04 g Mg kg−1 growth. For the root treatment 100 g of fresh root biomass
as MgSO4 × 7 H2 O including 0.135 g S kg−1 ). Soil mois- was added per kilogram of dry soil (N1-Rt and N2-Rt), and
ture was adjusted to 25 vol. %, and volumetric water content in the root-and-shoot treatment, 100 g of fresh root and 100 g
(VWC) sensors (EC-5, Decagon Devices, Pullman, USA) of fresh shoot biomass were added per kilogram of dry soil
were used to monitor soil water content. Six maize plants (N1-RS, N2-RS). Each treatment was replicated four times.
(Zea mays L. var. Ronaldinio) were sown per pot and culti- Within each N level, soil was homogenized to ensure sim-
vated in a greenhouse with 16 h light and 8 h dark cycles. Pots ilar starting conditions. Subsamples of both soils were taken
were randomized in regular intervals to avoid microclimatic for analysis of mineral N, water-extractable Corg concentra-
effects in the greenhouse. tion, and total soil C. Soil mineral N concentrations were
To get different soil mineral N concentrations in soil, a sec- 0.93 and 1.97 µg N g−1 for N1 and N2, respectively. Plant lit-
ond N fertilizer dose (0.2 g N kg−1 as Ca(NO3 )2 × 4 H2 O) ter was cut to a size of 2 cm and homogeneously mixed with
was applied to half of the pots 6 weeks after sowing. Soil the soil, simulating residue incorporation and tillage. PVC
with one N dose is referred to as N1 (0.2 g N kg−1 ) and soil pots with a diameter of 20 cm and a total volume of 6.8 L
with two N doses is referred to as N2 (2 × 0.2 g N kg−1 ). were filled with fresh soil equivalent to 3.5 kg dry weight pre-
Plants were harvested 8 weeks after sowing: maize plants viously mixed with plant litter. Soil was compacted in a step-
were cut above the soil surface and roots were removed from wise mode by filling a 2 cm layer of soil in pots and compact-
soil by sieving and handpicking. Fresh roots were shaken and ing it with a plunger. To ensure continuity between soil lay-
slightly brushed to remove adhering soil. ers, the surface of the compacted layer was gently scratched
A subsample of aboveground maize biomass and maize before adding the next soil layer. Due to high litter input,
roots was dried at 60 ◦ C to determine dry matter contents target bulk density was 1.1 g cm−3 . Actual bulk density was
and milled to a particle size < 1 mm. To determine water- determined by measuring headspace height, and these values
extractable C and N concentrations, subsamples were ex- were used for calculations.
tracted with H2 Obidest (maize root 1 : 1000 w/v; maize shoot To adjust soil moisture of all pots to 70 % water hold-
1 : 10000 w/v) for 16 h and analyzed using a multi N/C® ing capacity (WHC), equivalent to 49 % WFPS, water was
analyzer (model 3100, Analytik Jena, Jena, Germany). An- dripped on the soil surface through hollow needles (outer di-
other subsample was analyzed for the sum of structural ameter 0.9 mm). Pots were covered with PVC lids to mini-
components following established feedstuff analysis proto- mize evaporation from the soil and to incubate samples in the
cols based on the method proposed by Goering and Van dark. The incubation experiment was carried out under con-
Soest (1970), namely ash-free neutral detergent fiber aND- trolled temperature conditions (16 h day at 25 ◦ C, 8 h night
Fom (VDLUFA, 2012a), acid detergent fiber ADFom (VD- at 19 ◦ C) for 22 d. Volumetric water content (VWC) sensors
LUFA, 2011), and acid detergent lignin ADL (VDLUFA, (EC-5, Decagon Devices, Pullman, USA) were used to mon-
2012b). According to the definitions, hemicellulose, cellu- itor soil water content.
lose, and lignin contents were calculated as follows: hemi-
cellulose is equal to aNDFom minus ADFom; cellulose is
www.biogeosciences.net/17/1181/2020/ Biogeosciences, 17, 1181–1198, 20201184 P. S. Rummel et al.: Maize root and shoot litter quality controls short-term CO2 and N2 O emissions
Table 1. Two-factorial setup of the incubation experiment. Soil mineral N (Nmin ) concentrations were measured directly before onset of the
incubation experiment. C input in the control treatment is from rhizodeposition (RD) only, C input in the root treatment is from rhizode-
position and roots, and C input in root + shoot is from rhizodeposition, roots, and shoot biomass. N input is from root and shoot biomass,
respectively (FM: fresh matter).
N level Nmin Treatment Litter input C input N input
(µg NO−
3 -N g−1 dry soil) (mg FM g−1 dry soil) (mg C g−1 dry soil) (mg N g−1 dry soil)
N1 0.93 Control RD 3.47 n.d.
Root RD + 100 3.47 + 4.18 = 7.65 0.25
Root + shoot RD + 100 + 100 3.47 + 4.18 + 6.16 = 13.80 0.25 + 0.27 = 0.52
N2 1.97 Control RD 2.74 n.d.
Root RD + 100 2.74 + 4.18 = 6.92 0.25
Root + shoot RD + 100 + 100 2.74 + 4.18 + 6.16 = 13.07 0.25 + 0.27 = 0.52
Figure 1. Preparation and experimental setup of the incubation experiment. N1 (0.2 g N kg−1 ) and N2 (2 × 0.2 g N kg−1 ) referring to the
N levels during plant growth. Control soil (N1-C and N2-C) without addition of plant litter. Root treatment with addition of 100 g of fresh
root biomass per kilogram of dry soil (N1-R and N2-R) and root + shoot treatment with addition of 100 g of root and 100 g of shoot biomass
per kilogram of dry soil (N1-RS, N2-RS).
2.3 Gas sampling and analysis tector (ECD) for N2 O and a thermal conductivity detector
(TCD) for CO2 . Samples were introduced using a Gilson au-
tosampler (Gilson Inc., Middleton, WI, USA). Data process-
Gas fluxes were measured using the closed-chamber method ing was performed using CompassCDS software. The ana-
(Hutchinson and Mosier, 1981). Gas samples were taken ev- lytical precision was determined by repeated measurements
ery 12 h (morning and evening) for the first 15 d and every of standard gases (2500 and 550 ppm CO2 , 307, 760, and
24 h (midday) for the remaining 7 d. Due to technical issues, 6110 ppb N2 O) and was consistently < 2 %.
gas samples taken in the morning of day 10 to day 15 had to
be discarded. Before gas sampling, all pots were opened for 2.4 Soil analyses
ventilation to ensure homogenous ambient air background
conditions. Pots were closed with gastight PVC lids, and Soil samples were taken from the pots using a soil auger of
30 mL gas samples were taken from each pot 0, 20, and 16 mm diameter on 5, 9, 14, and 22 DAO (days after onset
40 min after closure and filled into pre-evacuated 12 mL Ex- of experiment). Holes were closed with glass tubes to avoid
etainer glass bottles (Labco, High Wycombe, UK). Samples variation in the soil surface. Fresh subsamples were analyzed
were analyzed on a Bruker gas chromatograph (456-GC, for water-extractable Corg concentration (WEOC), and a sub-
Bruker, Billerica, USA) deploying an electron capture de- sample was frozen at −20 ◦ C for soil mineral N analysis. To-
Biogeosciences, 17, 1181–1198, 2020 www.biogeosciences.net/17/1181/2020/P. S. Rummel et al.: Maize root and shoot litter quality controls short-term CO2 and N2 O emissions 1185
tal soil carbon and nitrogen concentrations were analyzed us- was used for DNA amplification: initial denaturation at 98 ◦ C
ing a C : N analyzer (model 1110, Carlo Erba, Milan, Italy). for 5 min and 25 cycles of denaturation at 98 ◦ C for 45 s, an-
For determination of soil mineral N content, frozen samples nealing at 60 ◦ C for 30 s, and extension at 72 ◦ C for 30 s, fol-
were extracted with a 0.0125 M CaCl2 solution (1 : 5 w/v) lowed by a final extension at 72 ◦ C for 10 min. For each sam-
for 60 min on an overhead shaker (85 rpm). The extracts were ple, PCR reactions were performed in triplicate. Resulting
filtered with 615 1/4 filter paper (Macherey-Nagel GmbH & PCR products were pooled in equimolar amounts and puri-
Co. KG, Düren, Germany) and stored at −20 ◦ C. The ex- fied using the QIAquick Gel Extraction kit (Qiagen, Hilden,
tracts were analyzed colorimetrically for the concentrations Germany) as recommended by the manufacturer. Quantifica-
of NO− +
3 and NH4 using the San
++ continuous-flow analyzer tion of the PCR products was performed using the Quant-iT
(Skalar Analytical B.V., Breda, the Netherlands). Soil water dsDNA HS assay kit and a Qubit fluorometer as described by
content was determined with a parallel set of samples. Net N the manufacturer (Invitrogen GmbH, Karlsruhe, Germany).
mineralization was calculated as the difference between the Indexing of the PCR products was performed by the Göt-
NH+ −
4 −N+NO3 −N concentrations at the start and end of the tingen Genomics Lab (G2L, Göttingen, Germany) using the
incubation period plus N lost as N2 O-N (Eq. 1). Nextera XT Index kit as recommended by the supplier (Illu-
mina, San Diego, CA, USA), and sequencing of 16S rRNA
Net mineralization = NO− +
3 + NH4 end amplicons was performed using the dual index paired-end
− NO− + approach (2 × 300 bp) with v3 chemistry for the Illumina
3 + NH4 start + N2 O (1)
MiSeq platform.
WEOC was determined according to Chantigny et al. (2007).
Briefly, fresh soil was homogenized with deionized water 2.5.2 Sequence processing
(1 : 2 w/v), and samples were centrifuged and filtered with
0.45 µm polyether sulfone syringe filters (Labsolute, Rennin- All bioinformatic processing of sequence data was done us-
gen, Germany) and stored at −20 ◦ C. The extracts were an- ing Linux-based software packages. Adapter removal and
alyzed using a multi N/C® analyzer (Analytik Jena, Jena, quality filtering of raw paired-end sequences was done us-
Germany). ing fastp v0.19.6 (Chen et al., 2018), with base correc-
tion in overlapped regions, a qualified quality phred of 20,
2.5 Analysis of bacterial community structures size exclusion of sequences shorter than 50 bp, and per read
trimming by quality (phred 20). Merging of quality-filtered
2.5.1 DNA isolation and 16S rRNA gene amplification paired-end reads was done by PEAR v0.9.11 (64 bit) with
default parameters (Zhang et al., 2014). Primer removal
To analyze the soil-inhabiting bacterial communities, DNA was conducted using cutadapt v1.18 (Martin, 2013). Subse-
was extracted from 0.5 g (fresh weight) of soil sample taken quently, dereplication, denoising, and chimera detection and
at the end of the incubation experiment (22 DAO) us- removal (denovo followed by reference based against the
ing the DNA extraction protocol described by Griffiths et SILVA 132 SSU database) were performed with VSEARCH
al. (2000). Plant litter was removed from samples prior to v2.13.0 (64 bit) (Rognes et al., 2016). Taxonomic classi-
extraction. In brief, cells were mechanically disrupted us- fication of the amplicon sequence variants (ASVs, 100 %
ing bead beating, and nucleic acids were extracted using sequence identity) was performed with BLAST + v2.7.1
phenol : chloroform : isoamyl alcohol (25 : 24 : 1; Carl Roth, against the SILVA 132 SSU reference database (Quast et
Karlsruhe, Germany). Nucleic acids were then precipitated al., 2013). Subsequently, extrinsic domain ASVs and chloro-
using polyethylene glycol (Carl Roth, Karlsruhe, Germany) plasts were removed from the dataset. Sample comparisons
and washed with 70 % ice-cold ethanol (VWR, Radnor, were performed at the same surveying effort of 61200 se-
Pennsylvania, USA). Subsequently, RNA was removed by quences. Statistical analyses were done using ASVs in R
RNase A digestion (Thermo Fischer Scientific, Waltham, version 3.5.3 (R Core Team, 2019). The R package am-
Massachusetts, USA) as described by the manufacturer. The pvis2 v2.4.7 (Andersen et al., 2018) was used to determine
RNA-free DNA was used for amplification of the V3 to V4 species richness, alpha diversity estimates, and rarefaction
region of the 16S rRNA gene. We used the bacterial primer curves and to prepare all graphs. To visualize the multivariate
pair S-D-Bact-0341-b-S-17 and S-D-Bact-0785-a-A-21 tar- constrained dispersion, canonical correspondence analysis
geting the V3–V4 region of the 16S rRNA gene described by (CCA) was conducted with Hellinger transformed data (Leg-
Klindworth et al. (2013) with adapters for Illumina MiSeq endre and Gallagher, 2001), and ASVs with a relative abun-
sequencing. The polymerase chain reaction (PCR) reaction dance lower than 0.1 % in any sample were removed. Cor-
mixture contained five-fold Phusion GC buffer, 200 µM of relations of environmental parameters to the bacterial com-
each of the four deoxynucleoside triphosphates, 5 % DMSO, munities were analyzed using the envfit function of the ve-
0.4 µM of each primer, 1 U of Phusion HF DNA polymerase gan package v2.5-4 (Oksanen et al., 2015) and projected into
(Fisher Scientific GmbH, Schwerte, Germany), and 25 ng of the ordination with arrows with a p-value cutoff of 0.005.
RNA-free DNA as template. The following cycling scheme For further statistical analysis of the microbial community
www.biogeosciences.net/17/1181/2020/ Biogeosciences, 17, 1181–1198, 20201186 P. S. Rummel et al.: Maize root and shoot litter quality controls short-term CO2 and N2 O emissions
composition (on phyla, order, and genus levels) and diver- Table 2. Chemical characteristics of maize root and shoot litter used
sity (Shannon, Simpson, and PD index), multivariate gener- in the incubation experiment. Hemicellulose and cellulose are ex-
alized linear models (MGLMs; with N level and litter addi- pressed relative to lignin content.
tion as factors) as implemented in the mvabund R package
v4.0.1 were employed with adjusted p values (Wang et al., Root Shoot
2019). For the generalized linear model analysis of variance Dry matter (%) 62.9 14.7
(MGLM-ANOVA) tests, p values < 0.05 were considered to
be significant. In addition, core microbiomes and respective C : N ratio 17.0 23.2
Lignin : N ratio 2.82 1.44
responders were analyzed at the genus level, grouped by ei-
Water-soluble Corg (percent of total C) 11.6 23.4
ther the applied litter treatment or N fertilizer levels using Water-soluble N (percent of total N) 8.8 25.8
ampvis2 v2.4.7.
For one replicate of N2-Rt, DNA concentration was Hemicellulose (relative content) 3.36 9.08
very low and the 16S rRNA gene could not be amplified. Cellulose (relative content) 3.18 11.5
Thus, we only evaluated the remaining three replicates of Lignin (relative content) 1 1
this treatment. In addition, we attempted to analyze the
soil-inhabiting fungal community using the fungus-specific
primer set ITS3_KYO2 and ITS4 (Toju et al., 2012), but we MIn v1.42.1 (Barton, 2018). Soil NO− 3 -N and WEOC con-
were not able to amplify them. centrations between sampling dates were estimated by linear
interpolation. Only evening and midday gas measurements
2.6 Calculations and statistical analyses were included in model calculations. To account for repeated
measurements, incubation vessel and sampling day were set
All statistical analyses were performed using the statistical as random effects. Models were compared using maximum
software R version 3.5.2 (R Core Team, 2018). Arithmetic likelihood (ML), selected using AIC (Akaike’s information
means and standard error of the four replicates were calcu- criterion), and fitted using restricted maximum likelihood
lated for CO2 and N2 O fluxes. Cumulative gas emissions (REML).
were calculated by linear interpolation between measured All plots were made using the statistical software R ver-
fluxes. To account for different C input in treatments, cu- sion 3.5.2 (R Core Team, 2018) including the packages
mulative CO2 and N2 O emissions were standardized against plotrix v3.7.4 (Lemon, 2006), plot3D v1.1.1 (Soetaert,
the C input per treatment (see Table 1 for details on C in- 2017), and viridisLite v0.3.0 (Garnier, 2018).
put). Tukey’s HSD test was used after analysis of variance
to test for treatment effects (i.e., N level and litter addition)
on cumulative CO2 emissions. An interaction was identified 3 Results
between N level and litter addition on cumulative N2 O emis-
3.1 Chemical analyses of maize litter
sions using interaction plots from the package HH v3.1-35
(Heiberger, 2018). A linear model using generalized least Maize root and shoot litter differed in their chemical com-
squares (gls) was fitted between cumulative N2 O as a re- positions (Table 2). Dry matter content of maize roots was
sponse variable and N level, litter addition, and their interac- much higher compared to shoot as roots had not been washed
tion as fixed effects. Additionally, the model was fitted to ac- prior to analyses, so some soil adhering to roots was in-
count for inhomogeneous within-class variances. Estimated cluded in dry matter determinations. Thus, we calculated
marginal means were then computed to analyze treatment ef- water-extractable concentrations in relation to total C instead
fects using the R package emmeans v1.3.4 (Lenth, 2018). of dry matter. Maize shoot litter was characterized by higher
Several regression models were tested to analyze the effect of concentrations of water-soluble C and N and a higher share
maize litter on cumulative N2 O emissions including the fac- of easily degradable compounds like hemicellulose and cel-
tors cumulative CO2 emissions, initial soil NO− 3 concentra- lulose compared to maize roots.
tion, and net N mineralization during the incubation period.
For cumulative CO2 emissions, regression models included 3.2 CO2 and N2 O fluxes and cumulative emissions
the factors total C input, water-extractable C input, hemicel-
lulose fraction, cellulose fraction, and lignin fraction from all Addition of maize litter increased CO2 fluxes compared to
litter treatments (Cn, Rt, RS, n = 24). the control treatment (Fig. 2), where addition of root and
To evaluate effects of soil environmental variables on N2 O shoot litter (N1-RS, N2-RS) resulted in much higher fluxes
and CO2 fluxes, a linear mixed-effect model (lme) was fit- compared to roots only (N1-Rt, N2-Rt). While absolute emis-
ted between N2 O fluxes (ln transformed), soil NO− 3 -N and sion rates were strongly affected by litter input, time courses
WEOC concentrations using the lme function from the pack- were similar in all litter treatments without visible differ-
age nlme v3.1-131 (Pinheiro et al., 2017). Pseudo-R 2 for lme ences between N1 and N2. CO2 fluxes stayed on a similar
was calculated using r.squaredGLMM from the package Mu- level for the first 10 d after onset of incubation, showing fluc-
Biogeosciences, 17, 1181–1198, 2020 www.biogeosciences.net/17/1181/2020/P. S. Rummel et al.: Maize root and shoot litter quality controls short-term CO2 and N2 O emissions 1187
put per treatment (Table 3). Still, cumulative CO2 emissions
were almost twice as high in Rt and about 4 times higher
in RS compared to Cn (p1188 P. S. Rummel et al.: Maize root and shoot litter quality controls short-term CO2 and N2 O emissions
Figure 4. (a–c) NO− +
3 , WEOC, and NH4 concentration from soils with two N levels (N1, N2) after incorporation of maize root litter (Rt),
maize root + shoot litter (RS), and control (Cn) without litter. Error bars show the standard error of mean values (n = 4) (day 0: n = 3). When
not visible, error bars are smaller than the symbols.
tion or water-extractable C fraction of plant litter explained
more than 96 % of variance of total cumulative CO2 emis-
sions (pP. S. Rummel et al.: Maize root and shoot litter quality controls short-term CO2 and N2 O emissions 1189
Table 3. Absolute cumulative N2 O and CO2 emissions and relative to C input and N2 O / CO2 ratio of 22 d incubation experiment with two pre-incubation N levels (N1, N2) and three
Table 4. N mineralization during the incubation period.
N Treatment N mineralized during incubation
level (µg N g−1 dry soil)
N1 Control 7.61 ± 0.98 b
Root 1.44 ± 0.72 a
Root + shoot 14.32 ± 2.66 c
N2 Control 10.08 ± 1.76 b
N2 O/CO2 ratio
(ng N µg−1 C)
Root 1.10 ± 0.68 a
Root + shoot 14.14 ± 4.83 c
Values represent means (n = 4) ± standard deviation. Different letters in the
litter addition treatments (control: no litter input; root: 100 mg root M g−1 dry soil; root + shoot: 100 mg root FM + 100 mg shoot FM g−1 dry soil).
0.07
0.23
1.91
0.08
0.31
2.25
same column indicate a significant difference according to Tukey’s HSD post
hoc tests at p ≤ 0.05.
(µg CO2 -C mg−1 C input)
Values represent means (n = 4) ± standard deviation. Different letters in the same column indicate a significant difference according to Tukey’s HSD post hoc tests at p ≤ 0.05.
Table 5. Significance of fixed effects of soil NO−
3 -N (µg NO3 -
−
b
b
a
c
a
c
N g−1 ), water-extractable organic C (WEOC, µg C g−1 ), and first-
order interaction on N2 O fluxes (pg N2 O-N g−1 h−1 ; ln trans-
CO2
165.72 ± 20.97
180.63 ± 21.97
69.78 ± 10.88
47.30 ± 17.35
93.61 ± 28.36
40.94 ± 8.58
formed) using a linear mixed-effect model.
Estimate Standard error p value
Intercept −0.2181 0.1268 0.0860
NO− 3 -N −0.0043 0.0165 0.7930
(µg CO2 -C g−1 dry soil)
ab
WEOC 0.0094 0.0053 0.0770
b
a
c
a
c
NO− 3 -N × WEOC 0.0023 0.0008 0.0024
2287.23 ± 289.48
2361.19 ± 287.20
647.48 ± 196.13
141.89 ± 29.74
533.51 ± 83.19
129.44 ± 47.47
CO2
ples (Fig. 6). With increasing C input, N2 samples cluster
more closely than N1 samples. No significant correlation of
litter level and microbial diversity was observed and PD in-
dex increased in N1 samples with increasing C input, while
(ng N2 O-N mg−1 C input)
the opposite was found for N2 samples. Comparison of N1-
Cn and N1-RS revealed no difference in diversity indices
ab
b
a
c
a
c
(Shannon and Simpson), while N1-Rt showed lower Shan-
N2 O
non and Simpson diversity indices (Table S4). The Shannon
314.25 ± 30.95
409.82 ± 91.30
29.08 ± 15.27
15.81 ± 3.15
diversity index was lowest in N2-Rt comparing all N2 treat-
2.95 ± 1.22
4.15 ± 2.47
ments, while the Simpson index was lowest for N2-RS.
Overall, the soil bacterial communities were dominated
by Actinobacteria, Proteobacteria, and Chloroflexi account-
ing for 151 % to 31 % (Fig. S2). The highest relative abun-
(ng N2 O-N g−1 dry soil)
ab
dance of Actinobacteria and Chloroflexi was found in N2-
b
a
c
a
c
Rt and of Proteobacteria in N1-R. Among these phyla, the
5357.87 ± 1193.50
4337.31 ± 424.98
orders Gaiellales (Actinobacteria), Sphingomonadales (Pro-
201.14 ± 105.62
120.91 ± 24.09
N2 O
teobacteria), and Thermomicrobiales (Chloroflexi) showed
10.21 ± 4.23
11.35 ± 6.75
the highest relative abundance, especially in N2-Rt (9.3 %),
N1-Rt (7.5 %), and N2-RS (9 %), respectively. Nevertheless,
the phyla Acidobacteria, Planctomycetes, Verrucomicrobia,
Gemmatimonadetes, Firmicutes, Patescibacteria, and Bac-
teroidetes were also detected (> 1 %) (Fig. 7). In detail, Bac-
Root + shoot
Root + shoot
teroidetes and Gemmatimonadetes decreased (with a neg-
Treatment
Control
Control
ative slope, but not significant) with increasing N level,
Root
Root
while the abundance of Firmicutes increased significantly
(p = 0.038). In addition, although present only in low rel-
ative abundance, the Cyanobacteria decreased significantly
level
N1
N2
N
(p = 0.003) with increasing N levels. At the genus level,
www.biogeosciences.net/17/1181/2020/ Biogeosciences, 17, 1181–1198, 20201190 P. S. Rummel et al.: Maize root and shoot litter quality controls short-term CO2 and N2 O emissions
Table 6. Results of regression analyses of the relationship between total cumulative CO2 emissions and C quality parameters of plant litter
(AICc: Akaike’s information criterion).
Regression Residual standard Degrees of Adjusted R 2 p value AICc
model error freedom
CO2 ∼ Total litter C input 274.5 22 0.9213 7.65 × 10⁻¹⁴ 342.73
CO2 ∼ Water-soluble C input 181.9 22 0.9655 < 2.2 × 10⁻¹⁶ 322.98
CO2 ∼ Hemicellulose 272.4 22 0.9225 6.497 × 10⁻¹⁴ 342.38
CO2 ∼ Cellulose 221.1 22 0.9489 6.478 × 10⁻¹⁶ 332.35
CO2 ∼ Lignin 496.6 22 0.7425 3.873 × 10−08 371.19
CO2 ∼ Hemicellulose + cellulose 180.2 21 0.9661 < 2.2 × 10⁻¹⁶ 324.32
Table 7. Results of regression analyses of the relationship between total cumulative N2 O emissions, total cumulative CO2 emissions, and N
parameters of plant litter and soil (AIC: Akaike’s information criterion).
Regression Residual standard Degrees of Adjusted R 2 p value AIC
model error freedom
N2 O ∼ CO2 593.9 22 0.9366 7.073 × 10⁻¹⁵ 379.78
N2 O ∼ Initial soil NO−
3 2404 22 −0.03885 0.7119 446.89
N2 O ∼ Mineralized N 2191 22 0.5791 9.551 × 10−06 425.21
Pseudomonas, Altererythrobacter, Gaiella, Nocardioides, Nitrosospira briensis, Alcaligenes sp., and Mesorhizobium
Agromyces, Bacillus, and Lysobacter were most abundant, sp. were also identified. Overall, the bacterial community
accounting for up to 5.7 % of all ASVs. Accordingly, these composition was significantly influenced by N level (p =
were also the most abundant genera attributed to the core 0.005) and maize litter treatment (p = 0.033).
microbiome (Tables S6 and S8). Overall, 80 genera rep-
resented the core microbiome, when grouped by N levels,
while 21 genera and six genera were identified as responders 4 Discussion
to N1 and N2, respectively (Fig. S5). In detail, the classi-
fied responders to the applied N treatments were the gen- 4.1 Decomposability of maize litter
era Chthonibacter, Luteimonas, Sphingobium, Novosphingo-
bium, Adhaeribacter, Nitrospira, Gemmata, and Devosia for Maize root and shoot litter quality controlled NO− 3 and
N1 and Conexibacter for N2 samples (Table S8). The gen- WEOC availability and decomposition-related CO2 emis-
era Bacillus, Gaiella, Altererythrobacter, Blastococcus, and sions during the initial phase of maize litter decomposition.
Pseudomonas showed the highest abundance in N2 sam- Harvest of plants, removal of roots, and mixing of soil fos-
ples, while Lysobacter and Sphingomonas were more abun- tered mineralization and nitrification, as reflected by grad-
dant in N1 samples (Fig. S3). When grouped by litter treat- ually increasing soil NO− 3 concentrations. The absence of
ment, the core microbiome comprised 77 genera accounting changes in soil NH+ 4 concentrations in control treatments
for 73 % of the relative abundance, while 9, 3, and 10 gen- without litter addition (N1-Cn, N2-Cn) indicates that all
era were identified as responders to the applied litter treat- NH+ 4 was directly nitrified. Also in controls, available C
ments control, root, and root + shoot, respectively (Fig. S5). was low as indicated by low CO2 emissions and decreas-
Nonomuraea, Fluviicola, and Nitrospira responded to the ing WEOC concentrations. The potential for mineralization
root + shoot treatment, while the genera Lapillicoccus and in soil is known to be high after tillage (Höper, 2002) and
Adhaeribacter responded to the root treatment (Table S7). positive net mineralization has been reported in control soil
The genera Litorilinea, Gemmata, Novosphingobium, and without litter addition (Machinet et al., 2009; Velthof et al.,
Opitutus were identified as responders to the control treat- 2002) and in the fallow period after rice harvest (Aulakh et
ment. For N levels and litter treatments, respectively, 833 al., 2001).
and 838 genera were identified as non-core microbiomes, ac- Maize shoot litter was characterized by a high share of
counting for 20 % and 19.5 % of relative abundance (Fig. S5). easily degradable compounds. High percentages of water-
The most abundant classified species found were soluble N and water-soluble Corg from maize shoot litter
Agromyces sp., Bacillus sp., and Sphingomonas sp. Never- strongly increased soil WEOC and NO− 3 concentrations.
theless, species such as Pseudomonas sp., Nitrosospira sp., Availability of easily degradable compounds was also re-
flected by strongly increased CO2 fluxes and cumulative
Biogeosciences, 17, 1181–1198, 2020 www.biogeosciences.net/17/1181/2020/P. S. Rummel et al.: Maize root and shoot litter quality controls short-term CO2 and N2 O emissions 1191 Figure 6. Canonical correspondence analysis (CCA) displaying the compositional distribution of the soil-inhabiting bacterial communities between the control (N1-C and N2-C; n = 4), root (N1-R and N2-R; n = 4 and n = 3), and root + shoot (N1-RS and N2-RS; n = 4) treat- ments. Significant correlations of total CO2 and N2 O emissions are shown by black arrows(p ≤ 0.005). The relative contribution (eigenvalue) of each axis to the total inertia in the data as well as to the constrained space only are indicated in percent in the axis titles. emission from N1-RS and N2-RS. While net mineralization tween cell wall polymers were important in the long term in RS was similar to Cn, it was very small in Rt, indicating (Machinet et al., 2011). In our study, regression analyses that N from mineralization was immobilized by soil microor- identified a strong positive relationship between cumulative ganisms to decompose root C compounds (Robertson and CO2 emissions and water-extractable C fraction of plant litter Groffman, 2015). Cumulative CO2 emissions in litter treat- (R 2 = 0.966, p
1192                  P. S. Rummel et al.: Maize root and shoot litter quality controls short-term CO2 and N2 O emissions

ing plant-litter-associated microsites with low O2 concentra-        (Bending and Turner, 1999; Troung and Marschner, 2018).
tions.                                                               When N is abundant relative to C availability, excess N is re-
   High mineralization in RS treatments may have especially          leased by soil microorganisms and can be lost as N2 O. In Rt,
favored coupled nitrification–denitrification where NO−      2 and   where N availability was low, N was immobilized by soil mi-
NO− 3  are produced   by nitrifiers in aerobic habitats and subse-   croorganisms and N2 O emission were low. When more easily
quently denitrified by denitrifiers in close-by anaerobic habi-      degradable N was added with maize shoots, N released from
tats (Butterbach-Bahl et al., 2013; Wrage et al., 2001). Here,       decomposition of maize shoots presumably fostered decom-
N2 O is mainly produced in the interface of aerobic and anaer-       position of maize roots (Robertson and Groffman, 2015) and
obic zones, which are typically found in plant litter associ-        denitrification of excess N, leading to strongly increased CO2
ated hot spots (Kravchenko et al., 2017). In addition, N2 O          and N2 O emissions in RS. To estimate the contribution of
can also be produced aerobically during heterotrophic and            plant litter N to mineralization, immobilization, and denitri-
autotrophic nitrification (Anderson et al., 1993; van Groeni-        fication, 15 N-labeled litter together with analysis of microbial
gen et al., 2015; Wrage et al., 2001; Zhang et al., 2015).           biomass N and 15 N2 O emissions could be used (e.g., Frim-
In both processes, N2 O can be formed as a byproduct from            pong and Baggs, 2010; Ladd et al., 1981).
chemical hydroxylamine oxidation (Butterbach-Bahl et al.,                The interdependency of C and N availability was further
2013; van Groenigen et al., 2015). Nitrifier denitrification         validated by analyses of regression, highlighting a strong
as a pathway of autotrophic nitrification has been reported          positive interaction between soil NO−    3 and WEOC concen-
mostly under soil conditions differing from our study, namely        trations resulting in much higher N2 O emissions only when
high NO−   2 , NH3 , or urea concentrations and low organic C        both NO−   3 and WEOC were available. This further supports
availability (Wrage-Mönnig et al., 2018; Wrage et al., 2001).        our findings that high bioavailability of maize shoot litter in-
In contrast, with high availability of organic C and N com-          creased microbial respiration by heterotrophic microorgan-
pounds, high N2 O emissions from heterotrophic nitrification         isms, resulting in plant-litter-associated hot spots with high
have been reported (Anderson et al., 1993; Hu et al., 2016;          N2 O formation.
Papen et al., 1989; Wrage et al., 2001). Zhang et al. (2015)             Variation in N2 O emissions is often related to quality pa-
reported 72 %–77 % of N2 O being produced by heterotrophic           rameters of plant residues, mostly the C : N ratio (Baggs et
nitrification from an arable soil under incubation conditions        al., 2000; Chen et al., 2013; Millar and Baggs, 2004; Novoa
similar to our study. However, Li et al. (2016) estimated that       and Tejeda, 2006). Especially easily degradable fractions,
denitrification was the dominant source of N2 O in residue-          such as water-soluble C (Burford and Bremner, 1975) or the
amended soil at 40 %–60 % WFPS. High correlation of cu-              holocellulose fraction (hemicelluloses + cellulose) (Jensen
mulative N2 O emissions and mineralized N during the in-             et al., 2005), explained a large share of variability of C min-
cubation period (R 2 = 0.5791, p
P. S. Rummel et al.: Maize root and shoot litter quality controls short-term CO2 and N2 O emissions                                  1193

Figure 7. Heat map of the 16 most abundant bacterial orders of the soil-inhabiting bacterial community grouped by N levels and litter input
(n = 4, except for N2 root: n = 3).

different soil moisture contents should include methods to              level. Accordingly, the increase in N2 O emissions from N2
differentiate between N2 O formation pathways.                          compared to N1 was smaller in RS where C availability was
                                                                        the highest, indicating that N was limited here.
4.3   Bacterial community response to maize litter input                   The most abundant phyla in our soil samples were the Acti-
      and soil N level                                                  nobacteria, Proteobacteria, and Chloroflexi. Among these
                                                                        phyla, the genera Pseudomonas (Proteobacteria) and Gaiella
After litter addition, the bacterial community adapts within a          (Actinobacteria) were also affiliated with the core micro-
few days to substrate availability (Pascault et al., 2013). The         biomes. Thermomicrobiales (Chloroflexi) showed the high-
canonical correspondence analysis (CCA) showed a clear                  est abundance in N2 samples, indicating their involvement
correlation of the soil-inhabiting bacterial community, litter          in N cycling. Pseudomonas species such as Pseudomonas
input, and total CO2 and N2 O emissions. As shown by the                aeruginosa, P. stutzeri, and P. denitrificans are known to re-
CCA, the bacterial community structure in N1-RS and N2-                 duce NO− 3 and to contribute to N2 O and N2 emissions (Carl-
RS was distinct from that in the control samples and soil               son and Ingraham, 1983). Gaiella occulta, belonging to Acti-
with addition of root residues. Combined addition of root               nobacteria, is also known for the reduction of NO−  3 to NO2
                                                                                                                                     −

and shoot litter affected the soil bacterial community, lead-           (Albuquerque et al., 2011). The genus Thermomicrobiales
ing to a less diverse and more specialized community struc-             comprises species which can grow on nitrate, ammonia, and
ture, which was also shown by the alpha diversity indices               alanine as sole nitrogen sources and are able to hydrolyze cel-
(see Table S1). A significant reduction of soil bacterial diver-        lulose or starch (Houghton et al., 2015). Relative abundance
sity was induced by different N levels, as previously shown             of Thermomicrobiales increased with N and C input, indicat-
by Zeng et al. (2016). In addition, Rousk and Bååth (2007)              ing favorable growth conditions for this genus (Fig. 7).
observed a negative correlation between mineral N addition                 We further identified several genera involved in C cy-
and bacterial growth, while the addition of barley straw and            cling including members of Agromyces, Bacillus, and Mi-
alfalfa correlated positively. The phylogenetic diversity (PD)          cromonospora, which were also affiliated with the core mi-
supports these findings by showing a more complex picture.              crobiome. Agromyces ulmi was present in low abundance in
While PD in N1 samples increased with increasing C input,               our samples and it is known to contribute to C cycling in soils
it decreased in N2 samples with increasing C input, indicat-            through xylanolytic activity (Rivas et al., 2004). Members of
ing a shift of the influencing factors from the C input to the N        the genus Bacillus (Firmicutes) have been reported to play

www.biogeosciences.net/17/1181/2020/                                                            Biogeosciences, 17, 1181–1198, 2020
1194 P. S. Rummel et al.: Maize root and shoot litter quality controls short-term CO2 and N2 O emissions
a crucial role in carbon cycling in a wide range of environ- of maize shoot litter strongly increased microbial respira-
ments by functions such as plant growth promotion or pro- tion in plant-litter-associated hot spots, leading to increased
duction of amylases and cellulases (Lyngwi and Joshi, 2014). N2 O emissions when both C and NO− 3 were available. Cou-
Among the genus Bacillus, we found one species, Bacillus pled nitrification–denitrification and heterotrophic nitrifica-
sp. KSM-N252, in relatively high abundance (1 %–2 %) in tion presumably contributed to N2 O formation. Maize root
N2 samples. This species encodes an alkaline endoglucanase, litter was characterized by a higher share of slowly degrad-
which can hydrolyze cellulose (Endo et al., 2001). Similarly, able C compounds and lower concentrations of water-soluble
Micromonospora (Actinobacteria) are known to produce hy- N; hence formation of anaerobic hot spots was limited and
drolytic enzymes showing cellulolytic and xylanolytic ac- microbial N immobilization restricted N2 O emissions. Bac-
tivity (Carro et al., 2018; de Menezes et al., 2012). Abun- terial community structures reflected degradability of maize
dance of Bacillus sp. KSM-N252 (N2-Cn 2 %, N2-Rt 1.1 %, litter types. Its diversity decreased with increasing C and N
and N2-RS 0.8 %) and Micromonospora (N2-R 1.9 %, N2- availability, favoring fast-growing C-cycling and N-reducing
RS 1 %) decreased with increasing input of water-extractable bacteria, namely Actinobacteria, Chloroflexi, Firmicutes, and
C, indicating that cellulose was only decomposed when no Proteobacteria.
easily degradable C was available. Hence, litter quality is a major driver of N2 O and CO2
Culture-independent sequence techniques have revealed emissions from crop residues, especially when soil mineral
that members of the phyla Actinobacteria, Chloroflexi, Fir- N is limited.
micutes, Bacteroidetes, and Nitrospirae possess nirK or nirS
and can reduce nitrite to nitric oxide (Cantera and Stein,
2007; Nolan et al., 2009). In our treatments, Actinobacte- Data availability. The 16S rRNA gene sequences were deposited
ria, Chloroflexi, and Firmicutes were more abundant in N2 in the National Centre for Biotechnology Information (NCBI)
samples, whereas Bacteroidetes and Nitrospirae were more Sequence Read Archive (SRA) under bioproject number PR-
abundant in N1 samples, which may indicate that the lat- JNA557843. Data from measurements are available upon request
from the corresponding author.
ter are more competitive under conditions of very low min-
eral nitrogen availability in soil. This was further validated
as Nitrospira (Nitrospirae), known to oxidize nitrite (Koch
Supplement. The supplement related to this article is available on-
et al., 2015), was identified as a responder for N1 and RS.
line at: https://doi.org/10.5194/bg-17-1181-2020-supplement.
The reduction of nitrate has been shown for Mesorhizo-
bium sp. (Okada et al., 2005) and Rhizobium sp. (Daniel
et al., 1982). Although only in low abundance, we found Author contributions. PSR, RW, and KD designed the experiments
these species predominantly in N2 samples. Species belong- and PSR carried them out. BP and DS carried out microbial analy-
ing to the genus Agromyces (Actinobacteria), which was af- ses and sequence processing and provided figures. JP, RW, and KD
filiated with the core microbiomes, are also known to reduce contributed to interpretation of results. PSR prepared the manuscript
nitrate (Zgurskaya et al., 2008). In addition, species capa- with contributions from all co-authors.
ble of denitrification under anaerobic, O2 -limited, and aero-
bic conditions can be found in the genera Bacillus and Mi-
cromonospora, as well as Pseudomonas and Rhodococcus Competing interests. The authors declare that they have no conflict
(Verbaendert et al., 2011) that were affiliated with the core of interest.
microbiome but were more abundant in N2 samples. The
genus Opitutus was identified as a responder to Cn and com-
prises the bacterium Opitutus terrae that was only found in Acknowledgements. The authors thank Jakob Streuber, Si-
anoxic habitats in soils (Chin et al., 2001). mone Urstadt, and Finn Malinowski for gas sampling and
laboratory analyses, as well as Alexander Silbersdorff (ZfS Statis-
Altogether, the higher relative abundances of C-cycling
tical Consulting) and Oliver Caré for advice on data handling and
and N-reducing bacteria in N2 samples and their affiliation
statistical analysis.
with the core microbiomes reflect the tendency of increased
N2 O emissions with increasing N level and further supports
our hypothesis that C and N availability from plant litter were Financial support. This research has been supported by the
the main drivers of N2 O emissions in our study. Deutsche Forschungsgemeinschaft through the research unit
DFG-FOR 2337: Denitrification in Agricultural Soils: Integrated
Control and Modelling at Various Scales (DASIM).
5 Conclusions
This open-access publication was funded
We examined CO2 and N2 O emissions after simulated post- by the University of Göttingen.
harvest incorporation of maize root or root-plus-shoot lit-
ter in a laboratory incubation study. High bioavailability
Biogeosciences, 17, 1181–1198, 2020 www.biogeosciences.net/17/1181/2020/P. S. Rummel et al.: Maize root and shoot litter quality controls short-term CO2 and N2 O emissions 1195
Review statement. This paper was edited by Michael Bahn and re- Birouste, M., Kazakou, E., Blanchard, A., and Roumet, C.:
viewed by two anonymous referees. Plant traits and decomposition: Are the relationships for roots
comparable to those for leaves?, Ann. Bot., 109, 463–472,
https://doi.org/10.1093/aob/mcr297, 2012.
Burford, J. R. and Bremner, J. M.: Relationships between the deni-
trification capacities of soils and total, water-soluble and readily
References decomposable soil organic matter, Soil Biol. Biochem., 7, 389–
394, https://doi.org/10.1016/0038-0717(75)90055-3, 1975.
Albuquerque, L., França, L., Rainey, F. A., Schumann, P., Nobre, Butterbach-Bahl, K., Baggs, E. M., Dannenmann, M., Kiese,
M. F., and Da Costa, M. S.: Gaiella occulta gen. nov., sp. nov., R., and Zechmeister-Boltenstern, S.: Nitrous oxide emis-
a novel representative of a deep branching phylogenetic lineage sions from soils?: how well do we understand the pro-
within the class Actinobacteria and proposal of Gaiellaceae fam. cesses and their controls?, Philos. T. R. Soc. B, 368, 1–13,
nov. and Gaiellales ord. nov., Syst. Appl. Microbiol., 34, 595– https://doi.org/10.1098/rstb.2013.0122, 2013.
599, https://doi.org/10.1016/j.syapm.2011.07.001, 2011. Cantera, J. J. L. and Stein, L. Y.: Molecular diversity of nitrite re-
Andersen, K. S., Kirkegaard, R. H., Karst, S. M., and Albertsen, ductase genes (nirK) in nitrifying bacteria, Environ. Microbiol.,
M.: ampvis2: an R package to analyse and visualise 16S rRNA 9, 765–776, https://doi.org/10.1111/j.1462-2920.2006.01198.x,
amplicon data, bioRxiv 299537, https://doi.org/10.1101/299537, 2007.
2018. Carlson, C. A. and Ingraham, J. L.: Comparison of denitrification
Anderson, I. C., Poth, M., Homstead, J., and Burdige, D.: A compar- by Pseudomonas stutzeri, Pseudomonas aeruginosa, and Para-
ison of NO and N2 O production by the autotrophic nitrifier Ni- coccus denitrificans, Appl. Environ. Microbiol., 45, 1247–1253,
trosomonas europaea and the heterotrophic nitrifier Alcaligenes 1983.
faecalis, Appl. Environ. Microbiol., 59, 3525–3533, 1993. Carro, L., Nouioui, I., Sangal, V., Meier-Kolthoff, J. P., Trujillo,
Aulakh, M. S., Doran, J. W., Walters, D. T., and Power, J. F.: M. E., Montero-Calasanz, M. D. C., Sahin, N., Smith, D. L.,
Legume residue and soil water effects on denitrification in Kim, K. E., Peluso, P., Deshpande, S., Woyke, T., Shapiro, N.,
soils of different textures, Soil. Biol. Biochem., 23, 1161–1167, Kyrpides, N. C., Klenk, H. P., Göker, M., and Goodfellow, M.:
https://doi.org/10.1016/0038-0717(91)90029-J, 1991. Genome-based classification of micromonosporae with a focus
Aulakh, M. S., Khera, T. S., Doran, J. W., and Bronson, on their biotechnological and ecological potential, Sci. Rep., 8,
K. F.: Denitrification, N2 O and CO2 fluxes in rice-wheat 1–23, https://doi.org/10.1038/s41598-017-17392-0, 2018.
cropping system as affected by crop residues, fertilizer N Chantigny, M. H., Angers, D. A., Kaiser, K., and Kalbitz, K.: Ex-
and legume green manure, Biol. Fert. Soils, 34, 375–389, traction and Characterization of Dissolved Organic Matter, in:
https://doi.org/10.1007/s003740100420, 2001. Soil Sampling and Methods of Analysis, 2nd Edn., edited by:
Azam, F., Müller, C., Weiske, A., Benckiser, G., and Ottow, J. C. G.: Carter, M. R. and Gregorich, E. G., Taylor & Francis Group,
Nitrification and denitrification as sources of atmospheric nitrous International Standard Book Number-13: 978-0-8493-3586-0
oxide – Role of oxidizable carbon and applied nitrogen, Biol. (Hardcover), 2007.
Fert. Soils, 35, 54–61, https://doi.org/10.1007/s00374-001-0441- Chen, H., Li, X., Hu, F., and Shi, W.: Soil nitrous oxide emissions
5, 2002. following crop residue addition: a meta-analysis, Glob. Change
Baggs, E. M.: A review of stable isotope techniques for N2 O source Biol., 19, 2956–2964, https://doi.org/10.1111/gcb.12274, 2013.
partitioning in soils: Recent progress, remaining challenges and Chen, S., Zhou, Y., Chen, Y., and Gu, J.: Fastp: An ultra-fast
future considerations, Rapid Commun. Mass Sp., 22, 1664– all-in-one FASTQ preprocessor, Bioinformatics, 34, i884–i890,
1672, https://doi.org/10.1002/rcm.3456, 2008. https://doi.org/10.1093/bioinformatics/bty560, 2018.
Baggs, E. M., Rees, R. M., Smith, K. A., and Vinten, A. J. A.: Ni- Chin, K.-J., Liesack, W., and Janssen, P. H.: Opitutus terrae gen.
trous oxide emission from soils after incorporating crop residues, nov., sp. nov., to accommodate novel strains of the division “Ver-
Soil Use Manage., 16, 82–87, https://doi.org/10.1111/j.1475- rucomicrobia” isolated from rice paddy soil, Int. J. Syst. Evol.
2743.2000.tb00179.x, 2000. Microbiol., 51, 1965–1968, https://doi.org/10.1099/00207713-
Baral, K. R., Arthur, E., Olesen, J. E., and Petersen, S. P.: Predicting 51-6-1965, 2001.
nitrous oxide emissions from manure properties and soil mois- Ciais, P., Sabine, C., Bala, G., Bopp, L., Brovkin, V., Canadell, J.,
ture: An incubation experiment, Soil. Biol. Biochem., 97, 112– Chhabra, A., DeFries, R., Galloway, J., Heimann, M., Jones, C.,
120, https://doi.org/10.1016/j.soilbio.2016.03.005, 2016. Le Quéré, C., Myneni, R. B., Piao, S., and Thornton, P.: Carbon
Barton, K.: MuMIn: Multi-Model Inference, R package version and Other Biogeochemical Cycles, in Climate Change 2013: The
1.43.6, available at: https://cran.r-project.org/package=MuMIn, Physical Science Basis. Contribution of Working Group I to the
2018. Fifth Assessment Report of the Intergovernmental Panel on Cli-
Bateman, E. J. and Baggs, E. M.: Contributions of nitrifica- mate Change, 465–570, 2013.
tion and denitrification to N2 O emissions from soils at dif- Daniel, R. M., Limmer, A. W., Stelle, K. W., and Smith, I.
ferent water-filled pore space, Biol. Fert. Soils, 41, 379–388, M.: Anaerobic Growth, Nitrate Reduction and Denitrification
https://doi.org/10.1007/s00374-005-0858-3, 2005. in 46 Rhizobium Strains, J. Gen. Microbiol. 128, 1811–1815,
Bending, G. D. and Turner, M. K.: Interaction of biochem- https://doi.org/10.1099/00221287-128-8-1811, 1982.
ical quality and particle size of crop residues and its ef- de Menezes, A. B., McDonald, J. E., Allison, H. E., and McCarthy,
fect on the microbial biomass and nitrogen dynamics follow- A. J.: Importance of Micromonospora spp. as colonizers of cellu-
ing incorporation into soil, Biol. Fert. Soils, 29, 319–327, lose in freshwater lakes as demonstrated by quantitative reverse
https://doi.org/10.1007/s003740050559, 1999.
www.biogeosciences.net/17/1181/2020/ Biogeosciences, 17, 1181–1198, 2020You can also read