Upward transport into and within the Asian monsoon anticyclone as inferred from StratoClim trace gas observations - Recent
←
→
Page content transcription
If your browser does not render page correctly, please read the page content below
Atmos. Chem. Phys., 21, 1267–1285, 2021
https://doi.org/10.5194/acp-21-1267-2021
© Author(s) 2021. This work is distributed under
the Creative Commons Attribution 4.0 License.

Upward transport into and within the Asian monsoon anticyclone as
inferred from StratoClim trace gas observations
Marc von Hobe1 , Felix Ploeger1,5 , Paul Konopka1 , Corinna Kloss1,2 , Alexey Ulanowski3 , Vladimir Yushkov3 ,
Fabrizio Ravegnani4 , C. Michael Volk5 , Laura L. Pan6 , Shawn B. Honomichl6 , Simone Tilmes6 , Douglas E. Kinnison6 ,
Rolando R. Garcia6 , and Jonathon S. Wright7
1 Institute for Energy and Climate Research (IEK-7), Forschungszentrum Jülich GmbH, 52425 Jülich, Germany
2 Laboratoire   de Physique et Chimie de l’Environnement et de l’Espace (LPC2E), Université d’Orléans,
CNRS, Orléans, France
3 Central Aerological Observatory, Dolgoprudnyi, Moscow Region, Russia
4 National Research Council – Institute for Atmospheric Sciences and Climate (ISAC-CNR), 40129 Bologna, Italy
5 Institute for Atmospheric and Environmental Research, University of Wuppertal, Wuppertal, Germany
6 National Center for Atmospheric Research (NCAR), Boulder, CO 80307, USA
7 Department of Earth System Science, Tsinghua University, Beijing 100084, China

Correspondence: Marc von Hobe (m.von.hobe@fz-juelich.de)

Received: 25 August 2020 – Discussion started: 1 September 2020
Revised: 15 December 2020 – Accepted: 17 December 2020 – Published: 29 January 2021

Abstract. Every year during the Asian summer monsoon             a significant contribution of stratospheric air is only visi-
season from about mid-June to early September, a stable          ble above this level. Based on our observations, we draw
anticyclonic circulation system forms over the Himalayas.        the following picture of vertical transport and confinement
This Asian summer monsoon (ASM) anticyclone has been             in the ASM anticyclone: rapid convective uplift transports
shown to promote transport of air into the stratosphere from     air to near 16 km in altitude, corresponding to potential tem-
the Asian troposphere, which contains large amounts of an-       peratures up to about 370 K. Although this main convec-
thropogenic pollutants. Essential details of Asian monsoon       tive outflow layer extends above the level of zero radiative
transport, such as the exact timescales of vertical transport,   heating (LZRH), our observations of CO concentration show
the role of convection in cross-tropopause exchange, and the     little to no evidence of convection actually penetrating the
main location and level of export from the confined anticy-      tropopause. Rather, further ascent occurs more slowly, con-
clone to the stratosphere are still not fully resolved. Recent   sistent with isentropic vertical velocities of 0.7–1.5 K d−1 .
airborne observations from campaigns near the ASM anticy-        For the key tracers (CO, O3 , and N2 O) in our study, none
clone edge and centre in 2016 and 2017, respectively, show       of which are subject to microphysical processes, neither the
a steady decrease in carbon monoxide (CO) and increase in        lapse rate tropopause (LRT) around 380 K nor the cold point
ozone (O3 ) with height starting from tropospheric values of     tropopause (CPT) around 390 K marks a strong discontinuity
around 100 ppb CO and 30–50 ppb O3 at about 365 K poten-         in their profiles. Up to about 20 to 35 K above the LRT, iso-
tial temperature. CO mixing ratios reach stratospheric back-     lation of air inside the ASM anticyclone prevents significant
ground values below ∼ 25 ppb at about 420 K and do not           in-mixing of stratospheric air (throughout this text, the term
show a significant vertical gradient at higher levels, while     in-mixing refers specifically to mixing processes that intro-
ozone continues to increase throughout the altitude range of     duce stratospheric air into the predominantly tropospheric in-
the aircraft measurements. Nitrous oxide (N2 O) remains at       ner anticyclone). The observed changes in CO and O3 likely
or only marginally below its 2017 tropospheric mixing ra-        result from in situ chemical processing. Above about 420 K,
tio of 333 ppb up to about 400 K, which is above the local       mixing processes become more significant and the air inside
tropopause. A decline in N2 O mixing ratios that indicates

Published by Copernicus Publications on behalf of the European Geosciences Union.
1268                                M. von Hobe et al.: Upward transport into and within the Asian monsoon anticyclone

the anticyclone is exported vertically and horizontally into         I. Although the chemical signature of uplifted tropo-
the surrounding stratosphere.                                           spheric species fills the entire anticyclone in the
                                                                        seasonal-average view, deep vertical transport to the an-
                                                                        ticyclone level occurs primarily in a region in the south-
                                                                        eastern quadrant of the anticyclone (consistent with the
                                                                        linearized model for off-equatorial convective forcing
1   Introduction                                                        of tropical waves presented by Gill (1980), centred near
                                                                        the southern flank of the Tibetan Plateau and including
The Asian summer monsoon (ASM) anticyclone is the                       the southern slope of the Himalayas, north-east India
dominant large-scale circulation system in the Northern                 and Nepal, and the northern portion of the Bay of Ben-
Hemisphere (NH) summertime upper troposphere and lower                  gal).
stratosphere (UTLS) (e.g. Hoskins and Rodwell, 1995).
Deep ASM convection drives vertical transport of bound-             II. In this preferred uplift region, transport from the
ary layer air to the UTLS, where the confinement of anti-               boundary layer to the tropopause level behaves like a
cyclonic flow facilitates a persistent chemical signature that          “chimney”, dominated by rapid ascent.
has been detected by multiple satellite sensors (Filipiak et       III. This behaviour changes at the upper troposphere (UT)
al., 2005; Park et al., 2008, 2007; Randel and Park, 2006;              level, where sub-seasonal dynamics drive east–west os-
Randel et al., 2010; Santee et al., 2017; Thomason and                  cillations of the anticyclone. These 10 to 20 d oscil-
Vernier, 2013; Vernier et al., 2011). Randel et al. (2010) il-          lations mix the uplifted boundary layer air within the
lustrated this troposphere-to-stratosphere transport using hy-          large-scale anticyclone and contribute to mixing of anti-
drogen cyanide (HCN), a tracer of anthropogenic pollution               cyclone air with the background, thus providing a path-
and biomass burning measured by ACE-FTS (Atmospheric                    way for this air to enter the global stratosphere.
Chemistry Experiment Fourier Transform Spectrometer, in-
stalled on the Canadian satellite SCISAT), and described the          The transport behaviour described in point II has been sup-
ASM anticyclone as a gateway for boundary layer air from           ported by an analysis using Modern-Era Retrospective anal-
one of the most polluted areas on Earth to enter the global        ysis for Research and Applications, Version 2 (MERRA-2)
stratosphere while bypassing the tropical tropopause.              assimilated trace gases and aerosols (Lau et al., 2018), where
   These satellite observations, although effective in demon-      the peak monsoon-season aerosol transport is described as a
strating the seasonal-average signature, do not have sufficient    “double-stem-chimney cloud” structure that extends from the
spatio-temporal resolution to clarify some of the key char-        boundary layer to around 16 km, near the tropopause level.
acteristics of this transport pathway. There are a number of       The “double-stem” rapid convective lofting is identified over
outstanding questions regarding the role of ASM transport in       two localized areas: the Himalayas–Gangetic Plain and the
connecting Asian boundary layer emissions and regional pol-        Sichuan Basin in southwestern China.
lution to global tropospheric and stratospheric chemistry and         This rapid uplift is of special interest for ASM research,
to the ensuing perturbations in regional and global climate.       because the relatively short transport timescale makes this
These questions include the most efficient vertical transport      pathway an effective route for very-short-lived (VSL) ozone-
locations and timescales; the dynamical processes driving          depleting substances (ODSs) to reach the stratosphere. The
these transport patterns; the respective roles of deep convec-     level at which convectively driven transport transitions to
tion and large-scale radiatively balanced ascent; the domi-        wave-driven slow ascent is among the outstanding issues that
nant source regions for air masses that feed into the anticy-      must be addressed to further characterize this transport path-
clone; the extent of dynamical confinement within the anti-        way and its effective timescale. Earlier studies often put this
cyclone; the vertical and horizontal transport pathways of air     level at approximately 360 K potential temperature (e.g. Park
masses exiting the anticyclone; and the quantitative impact of     et al., 2009) based on average tropical conditions. New satel-
the ASM on stratospheric water vapour, ozone, and aerosols.        lite observations over the last decade indicate that the ASM
These questions have been the focus of a large number of           region contains significantly deeper convection, indicated by
studies using chemical transport models, Lagrangian trajec-        higher frequencies of convective cloud tops above 380 K po-
tory models, reanalysis products and observational data (e.g.      tential temperature (Ueyama et al., 2018).
Bergman et al., 2013; Fu et al., 2006; Lau et al., 2018; Li et        Verification of the chimney-like behaviour suggested by
al., 2005, 2020; Pan et al., 2016; Park et al., 2009; Ploeger et   model results requires detailed analysis of high-resolution
al., 2015, 2017; Vogel et al., 2015, 2019; Yan et al., 2019; Yu    airborne measurements. The StratoClim (Stratospheric and
et al., 2017; Nützel et al., 2019).                                upper tropospheric processes for better climate predictions;
   Of particular interest to this study is a characteristic de-    http://www.stratoclim.org, last access: 21 January 2021)
scription of the ASM transport structure that has emerged          campaign using the stratospheric research aircraft M55 Geo-
from recent modelling studies (Bergman et al., 2013; Pan et        physica is the first airborne campaign to provide data suitable
al., 2016):                                                        for such verification. Based out of Kathmandu, Nepal, Stra-

Atmos. Chem. Phys., 21, 1267–1285, 2021                                             https://doi.org/10.5194/acp-21-1267-2021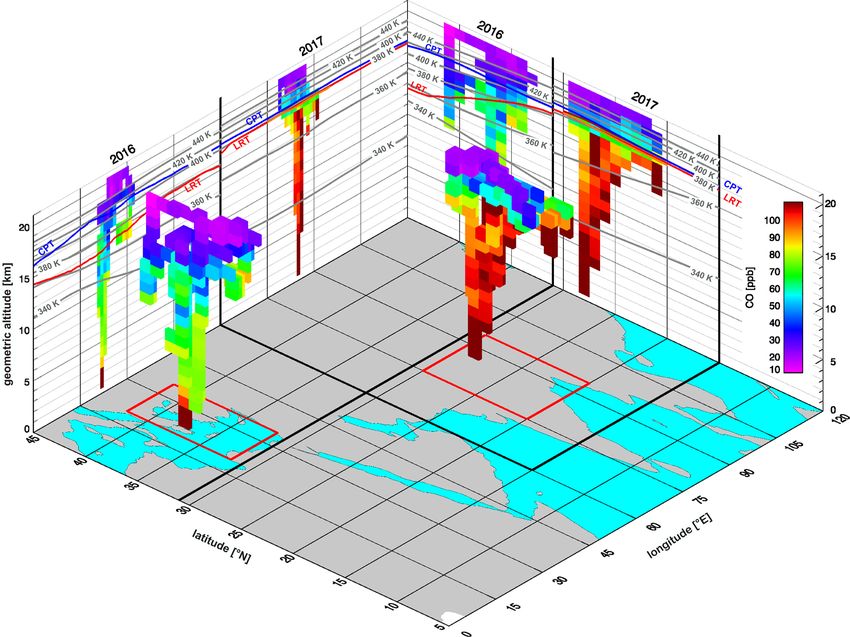
M. von Hobe et al.: Upward transport into and within the Asian monsoon anticyclone                                          1269

toClim conducted eight research flights in the central region      2     Methods
of the ASM anticyclone in summer 2017.
   In this work, we use airborne in situ measurements of car-      2.1     Field campaigns
bon monoxide (CO), ozone (O3 ) and nitrous oxide (N2 O)
collected both outside and inside the ASM anticyclone, and         Two airborne field campaigns utilizing the high-altitude air-
here particularly in the vicinity of the chimney regions. We       craft M55 Geophysica were carried out under the umbrella
focus on these three trace gases because they provide com-         of the EU project StratoClim. Three flights were conducted
plementary information on transport, mixing and processing.        from Kalamata, Greece, between 30 August and 6 Septem-
CO is a tropospheric tracer that is enhanced in polluted air       ber 2016, and eight flights were conducted from Kathmandu,
and experiences photochemical removal in the UTLS with             Nepal, between 27 July and 10 August 2017. Our study
a lifetime of around 2 to 3 months, and it is thus a suitable      mainly adopts a statistical approach to analyse the entire
tracer to investigate the vertical reach of deep convection.       observational data set comprising measurements from all
O3 is photochemically produced in the UTLS and above at            flights. Figure 1 shows all flight tracks and their positions
rates as high as a few parts per billion (ppb) per day. Con-       relative to the typical ASM anticyclone area for the two re-
centrations of O3 can reach parts per million (ppm) levels         spective years determined using the criterion defined below
in the stratosphere but do not typically exceed a few tens of      in Sect. 2.3.2. The Kalamata base in 2016 was located out-
ppb in the troposphere, making it useful for examining the         side the ASM anticyclone, and air inside or exported from the
transition from tropospheric air to stratospheric air. N2 O is a   ASM anticyclone was only probed sporadically. The Kath-
tropospheric tracer with a significantly longer photochemical      mandu base in 2017 was located inside the ASM anticyclone
lifetime than CO, so the two tracers can be used together to       region, and according to the criterion used (Sect. 2.3.2.), the
infer transport timescales. N2 O is removed only after sub-        bulk of the observations were made within the ASM anticy-
stantial residence time within the stratosphere. Significant       clone. A comprehensive campaign overview and descriptions
reductions in N2 O mixing ratios thus indicate in-mixing of        of the purpose and specific meteorological situation for each
aged stratospheric air.                                            flight are given by Stroh et al. (2021).
   Using these three trace gases together with dynamical vari-
ables, we address the following questions:                         2.2     Measurements, dynamical coordinates and analysis
                                                                           tools
  – Q1. Does the vertical distribution of CO and O3 support
    the occurrence of rapid convective transport up to the         2.2.1    Carbon monoxide (CO)
    tropopause level?
  – Q2. At what potential temperature level does the               Carbon monoxide was measured by the new AMICA (Air-
    timescale of transport change based on observed ver-           borne Mid Infrared Cavity enhanced Absorption spectrom-
    tical gradients in the trace gas profiles?                     eter) instrument deployed for the first time during Strato-
                                                                   Clim. AMICA consists of a power module and a pressurized
  – Q3. Where is this transition region located relative to        enclosure containing all major optical components and data
    the tropopause?                                                acquisition hardware. The instrument is placed underneath
                                                                   a dome-shaped structure on top of the Geophysica aircraft,
  – Q4. At what level do we begin to see significant signa-        drawing air from a rear-facing inlet through a 2 m length
    tures of mixing with stratospheric air?                        of SilcoNert® -coated stainless-steel tubing. It employs the
   The flights and measurements are described in Sect. 2,          ICOS (integrated cavity output spectroscopy; O’Keefe et al.,
which also introduces model tools and specific dynamical           1999) technique to measure the trace gases carbonyl sulfide
coordinates used in the analysis. Statistical analysis of the      (OCS), carbon dioxide (CO2 ), water vapour (H2 O) and CO
observations in terms of different horizontal and vertical co-     in the wavenumber range 2050.25–2051.1 cm−1 . Full instru-
ordinates and a comparison of observed and simulated O3 vs.        mental details will be given in a forthcoming paper (Kloss et
CO tracer correlations are presented in Sect. 3, followed by       al., 2021).
detailed discussion of the results in the context of the four         CO mixing ratios were retrieved from observed infrared
questions listed above in Sect. 4. In the concluding Sect. 5,      (IR) spectra using a transition at 2050.90 cm−1 with line pa-
we draw a summary picture of vertical transport and confine-       rameters taken from the HITRAN 2012 database (Rothman
ment inside the ASM anticyclone and compare this to other          et al., 2013) and no further calibration parameters. The ac-
recent studies.                                                    curacy was cross-checked for a range of mixing ratios (30–
                                                                   5000 ppb) prepared from a 5 ± 0.05 ppm CO standard (Air-
                                                                   Products) by dilution with nitrogen or argon (argon was used
                                                                   at the lowest mixing ratios, because the nitrogen gas bottle
                                                                   contained a CO impurity at a concentration of ∼ 30 ppb).
                                                                   Taking into account uncertainty in the standard and uncer-

https://doi.org/10.5194/acp-21-1267-2021                                            Atmos. Chem. Phys., 21, 1267–1285, 2021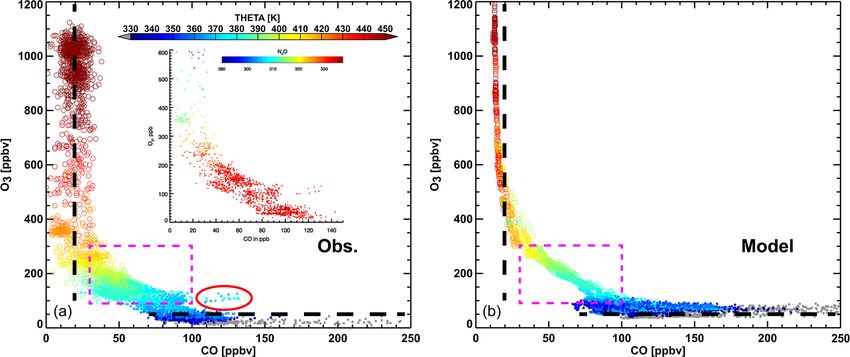
1270 M. von Hobe et al.: Upward transport into and within the Asian monsoon anticyclone
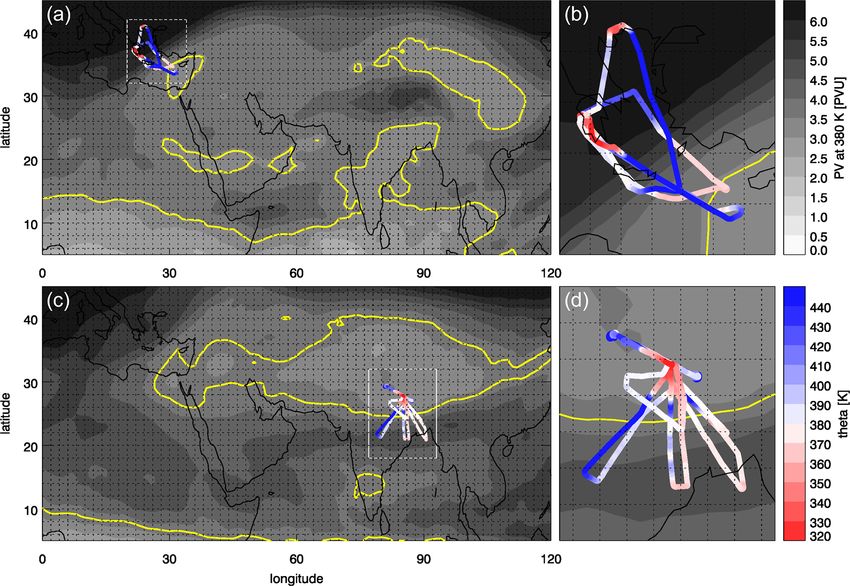
Figure 1. Maps showing tracks of all Geophysica flights conducted during the StratoClim campaign phases in 2016 (a, b) and 2017 (c,
d) for the larger ASM area (a, c) and zoomed in to the respective campaign area (b, d). Potential vorticity (PV) contours (grey shadings),
averaged between 29 August and 7 September 2016 and between 26 July and 11 August 2017, respectively, are shown for the 380 K potential
temperature level, on which the Ploeger et al. (2015) criterion is applied to determine the average ASM anticyclone boundaries for the two
campaign periods (yellow lines; PV thresholds were determined to be 3.5 PVU (potential vorticity unit) for 2016 and 3.7 PVU for 2017;
maps of the average ASM anticyclone position for the full monsoon season, i.e. 1 July–31 August, are shown in the Supplement Fig. S4).
tainties in the mass flow controller (MFC) flows used to di- accuracy better than 10 ppb in the observations. The mea-
lute it, the overall accuracy is estimated to be better than 5 %. sured concentration range is 10–500 µg m−3 , operating tem-
For our analysis, we use AMICA CO data at 10 s time resolu- perature range is −95 to +40 ◦ C, and the operating pres-
tion. These data have a 1σ precision of ∼ 20 ppb, determined sure range is 1100–30 mbar (about 0–22 km). The instrument
mainly by electrical noise in the observed spectra. Individual was calibrated at the ground before and after each flight by
CO profiles from all flights are provided in Figure S1 in the means of an ozone generator and reference ultraviolet (UV)-
Supplement. absorption O3 monitor (Dasibi 1008-PC).
Ozone data are available from two of the three Kalamata
2.2.2 Ozone (O3 ) flights in 2016 and from six of the eight Kathmandu flights
in 2017. Individual O3 profiles from all flights are provided
in Figure S2 in the Supplement.
O3 was measured with 8 % precision at 1 Hz time resolution
by the FOZAN-II (Fast OZone ANalyzer) instrument devel-
oped and operated by the Central Aerological Observatory, 2.2.3 Nitrous oxide (N2 O)
Russia, and the Institute of Atmospheric Science and Cli-
mate, Italy (Ulanovsky et al., 2001; Yushkov et al., 1999). N2 O was measured at 90 s time resolution with an aver-
FOZAN-II is a two-channel solid-state chemiluminescent in- age precision of 0.5 % and average accuracy of about 0.6 %
strument featuring a sensor based on Coumarin 307 dye on by the High Altitude Gas AnalyzeR (HAGAR). The instru-
a cellulose acetate-based substrate, and is equipped with a ment, operated by the University of Wuppertal, comprises a
high-accuracy ozone generator for periodic calibration of two-channel gas chromatograph with an electron capture de-
each channel every 15 min during the flight, ensuring an tector (ECD) measuring a suite of long-lived tracers (N2 O,
Atmos. Chem. Phys., 21, 1267–1285, 2021 https://doi.org/10.5194/acp-21-1267-2021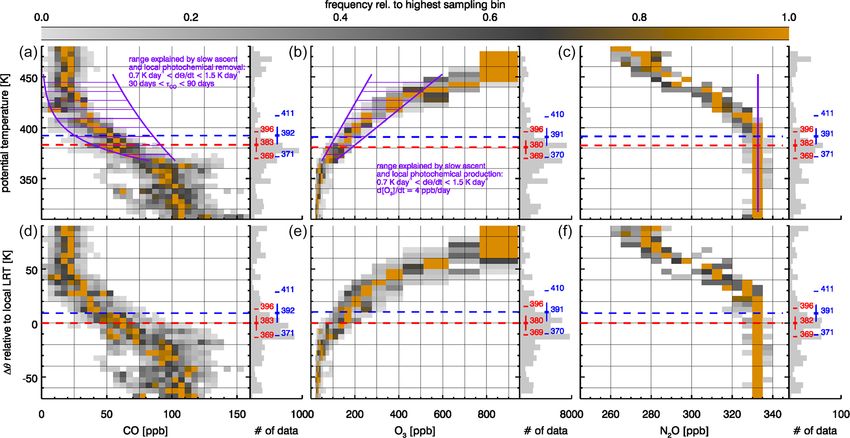
M. von Hobe et al.: Upward transport into and within the Asian monsoon anticyclone                                            1271

CFC-11, CFC-12, Halon-1211, CH4 , SF6 , H2 ) and a non-            profile (note that the tropopause is sometimes also defined in
dispersive IR absorption sensor for fast CO2 measurements          terms of other parameters such as PV or chemical tracers),
(Homan et al., 2010). The instrument is calibrated every           the tropopause in the ASM region can be defined either as
7.5 min during flight with either of two standard gases, which     the CPT, i.e. the altitude of the coldest temperature, or as the
are inter-calibrated in the laboratory with standards provided     LRT, i.e. “the lowest level at which the lapse rate decreases
by NOAA GML (National Oceanic and Atmospheric Admin-               to 2 K/km or less, provided also that the average lapse rate
istration Global Monitoring Laboratory). N2 O data are avail-      between this level and all higher levels within 2 km does not
able for all flights of the campaign (note that the first flight   exceed 2 K/km” (WMO, 1957). LRT and CPT were linearly
on 30 August 2016 in Kalamata suffers from a comparatively         interpolated to each point along a given flight track from
poor N2 O precision of ∼ 2 %).                                     the surrounding reanalysis grid points. Under tropical condi-
   N2 O is fairly well mixed in the troposphere with a global      tions, in the majority of the cases the LRT and CPT are found
mean surface mole fraction in 2017 of 329.8 ppb; its tropo-        at the same level; i.e. the LRT is also CPT. When they are
spheric distribution exhibits a steady growth of 0.9 ppb a−1 ,     not co-located, by definition the CPT is always higher than
as well as seasonal variation, interhemispheric differences        the LRT, and their separation typically increases with latitude
and other geographic variations (of the order of 1 ppb) due to     (Munchak and Pan, 2014; see also Fig. S3 in the Supplement,
surface sources (Dlugokencky et al., 2018; https://www.esrl.       which shows the LRT–CPT separation along the StratoClim
noaa.gov/gmd/hats/combined/N2O.html, last access: 25 Jan-          flight tracks as a function of latitude).
uary 2021). N2 O is destroyed in the mid stratosphere mainly          Because both the LRT and the CPT can vary substantially
above 25 km by UV light and reaction with O(1 D), with slow        in altitude, potential temperature and PV, we determine the
vertical transport to this sink region resulting in a long atmo-   respective difference in potential temperature units for our
spheric lifetime of 123 (104–152) years (SPARC, 2013). For         observations and introduce this difference as a new vertical
an air parcel in the lower stratosphere, an N2 O mixing ratio      coordinate (e.g. Hoor et al., 2004; Ploeger et al., 2017). Pan et
below the tropospheric value thus indicates the presence of a      al. (2018) have shown that the LRT better identifies the tran-
fraction of photochemically aged air that has passed the sink      sition from the troposphere to the stratosphere in the tropics,
region above.                                                      and relative coordinates with respect to the LRT are used in
                                                                   the main figures and discussions below. Corresponding fig-
2.2.4    Geolocation and meteorological data                       ures with respect to the CPT are provided in the Supplement
                                                                   to facilitate comparison with studies having a stronger focus
Temperature was measured at 10 Hz resolution with an ac-           on the CPT. For example, Brunamonti et al. (2018) used the
curacy of 0.5 K and a precision of 0.1 K by the commer-            CPT to mark the top of an “Asian tropopause transition layer
cial Rosemount probe instrument Thermodynamic Complex              (ATTL)”.
(TDC). Pressure and geolocation data were obtained at 1 Hz
resolution from Geophysica’s avionic system. Potential tem-        2.3.2   Monsoon equivalent latitude
perature along the flight track was calculated from these
data. Physical properties on larger scales were derived from       Different meteorological variables have been proposed in the
ECMWF ERA-Interim data (Dee et al., 2011), including               literature to identify the core of the ASM circulation, includ-
wind speed and direction, potential vorticity (PV), vertical       ing geopotential height (e.g. Bergman et al., 2013; Randel
velocities and radiative heating, and local temperature pro-       and Park, 2006), Montgomery stream function (e.g. Santee
files to determine the heights of the lapse rate tropopause        et al., 2017) and potential vorticity (PV; e.g. Garny and Ran-
(LRT) and cold point tropopause (CPT).                             del, 2013; Ploeger et al., 2015). All of these approaches give
   The vertical resolution of ERA-Interim data in the              meaningful (and similar) results when applied to monthly-
tropopause region is about 1 km, with relevant levels at           mean fields. Here, we follow the approach of Ploeger et
132.76, 113.42, 95.98, 80.40 and 66.62 hPa (corresponding          al. (2015) based on the maximum PV gradient on an isen-
to about 14.23, 15.33, 16.50, 17.74 and 19.05 km). Related         tropic surface with respect to a monsoon-centred equivalent
to this vertical resolution is an uncertainty in the determina-    latitude (see below). As PV is an approximately conserved
tion of the tropopause level. The spatio-temporal variability      quantity, it correlates better with tracer distributions that in-
of the tropopause over the campaign region and period will         volve small-scale structures, which is an advantageous qual-
be assessed from its standard deviation in the following.          ity when applied to high-resolution in situ measurements.
                                                                      Monsoon equivalent latitude (MeqLat) was introduced by
2.3     Dynamical coordinates                                      Ploeger et al. (2015; please refer to this reference for a com-
                                                                   prehensive description of the MeqLat concept and its deriva-
2.3.1    Potential temperature relative to the tropopause          tion) as a means of describing the position of an air mass
                                                                   relative to the centre of the ASM anticyclone. On the 380 K
Key question Q3 (Sect. 1) addresses how the ASM vertical           potential temperature surface, the location of the absolute PV
transport relates to the tropopause. Based on the temperature      minimum is defined as the ASM centre corresponding to 90◦

https://doi.org/10.5194/acp-21-1267-2021                                            Atmos. Chem. Phys., 21, 1267–1285, 2021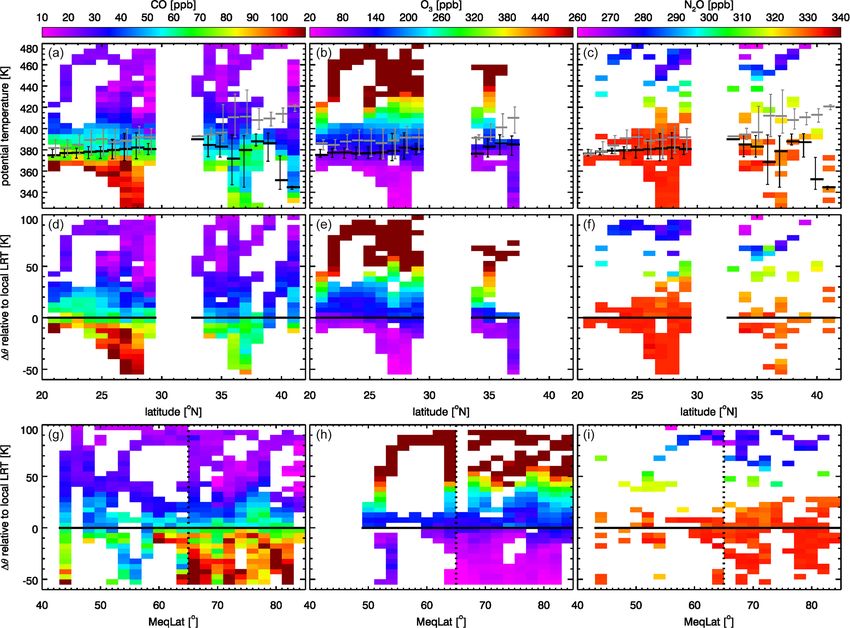
1272                                M. von Hobe et al.: Upward transport into and within the Asian monsoon anticyclone

MeqLat. As one moves away from this “ASM pole”, MeqLat            Fire emissions are based on the FINN inventory Version 1.5
decreases as PV increases. The area enclosed by a given PV        (Wiedinmyer et al., 2011).
contour determines the corresponding MeqLat value, anal-             The WACCM6 simulation used in this study has been per-
ogous to the decrease in latitude when moving away from           formed with observed sea-surface temperature and sea-ice
the Earth’s north or south pole in the definition of equivalent   conditions. Atmospheric winds and temperatures are nudged
latitude as proposed by Nash et al. (1996). The anticyclone       towards NASA GMAO GEOS5.12 meteorological analysis
border (i.e. the transport barrier separating air masses inside   with a Newtonian relaxation of 50 h below 50 km using a
and outside) is characterized by a maximum of the PV gra-         smooth transition to no nudging at higher model levels from
dient with respect to MeqLat and typically lies around 65◦        50 to 60 km. The main effect of nudging is to provide meteo-
MeqLat, so MeqLat >65◦ can be considered an indicator of          rological conditions that are consistent with analysed winds
air inside the ASM anticyclone (Ploeger et al., 2015). This       and temperature, allowing comparisons between WACCM6
boundary identification based on the PV gradient only works       and observed chemical distributions.
well in a shallow layer around 380 K. Therefore, we use the          As the first application of this 110-level configuration in
380 K MeqLat value at the horizontal location of each mea-        observational studies, we find that the representation of the
surement to determine whether it was made inside or outside       UTLS dynamical structure of the ASM anticyclone and the
the ASM anticyclone. By definition, this criterion is exact       region of active convective uplifting are both qualitatively
only for observations at 380 K and becomes increasingly un-       consistent with the result of the previous 88-level configu-
certain with vertical distance above or below this level be-      ration, which was extensively analysed in Pan et al. (2016).
cause the anticyclone varies in size at different levels, and     The representation of enhanced CO in the anticyclone is
it often tilts northward with altitude. However, it is the best   also found to be qualitatively consistent with the MLS (Mi-
we can do based on PV. This uncertainty in the correct iden-      crowave Limb Sounder) satellite data. There is a clear im-
tification of ASM anticyclone air masses has probably little      provement in this run compared to the previous 88-level
effect on our analyses of observations around the tropopause      configuration in a much better representation of the verti-
level (i.e. around 380 K), but the impact could be more sig-      cal chemical gradient in the UTLS (see Fig. 5 in Sect. 3.3).
nificant at higher levels where more observations unrelated       The overall performance of this run in representing vari-
to the ASM may potentially be included in our analyses. Fig-      ous processes is still under evaluation, especially the possi-
ure S4 in the Supplement shows maps of ASM anticyclone            ble weaker convective uplifting introduced by the change in
frequency for 2016 and 2017 analogous to that shown for           nudging.
2011 by Ploeger et al. (2015).

2.4    Whole Atmosphere Community Climate Model                   3     Observations
       (WACCM)
                                                                  3.1    General overview
The Whole Atmosphere Community Climate Model, ver-
sion 6 (WACCM6; Gettelman et al., 2019) is used in this           Figure 2 gives a full three-dimensional view of the AMICA
study to provide large-scale dynamical and chemical back-         CO observations made during both StratoClim campaigns.
ground for the StratoClim campaign period. WACCM6 is              The data have been averaged into 1◦ × 1◦ × 1 km longitude–
the atmospheric component of the Community Earth System           latitude–altitude grid cells, and then meridional and zonal
Model Version 2 (CESM2; Danabasoglu et al., 2020; Em-             averages have been projected onto longitude–altitude and
mons et al., 2020). The WACCM6 domain extends from the            latitude–altitude space. In the Kalamata region, CO mixing
Earth’s surface to the lower thermosphere. For the simulation     ratios in the free troposphere were typically between 50 and
used in this study, the model uses a 0.9◦ × 1.2◦ longitude–       80 ppb and only reached 100 ppb in the lowermost 3 km, with
latitude grid, with 110 vertical levels on a hybrid-pressure      the latter likely due to upward mixing of local boundary layer
vertical grid with a top at about 150 km (Garcia and Richter,     air. By contrast, measurements in the free troposphere over
2019). For pressures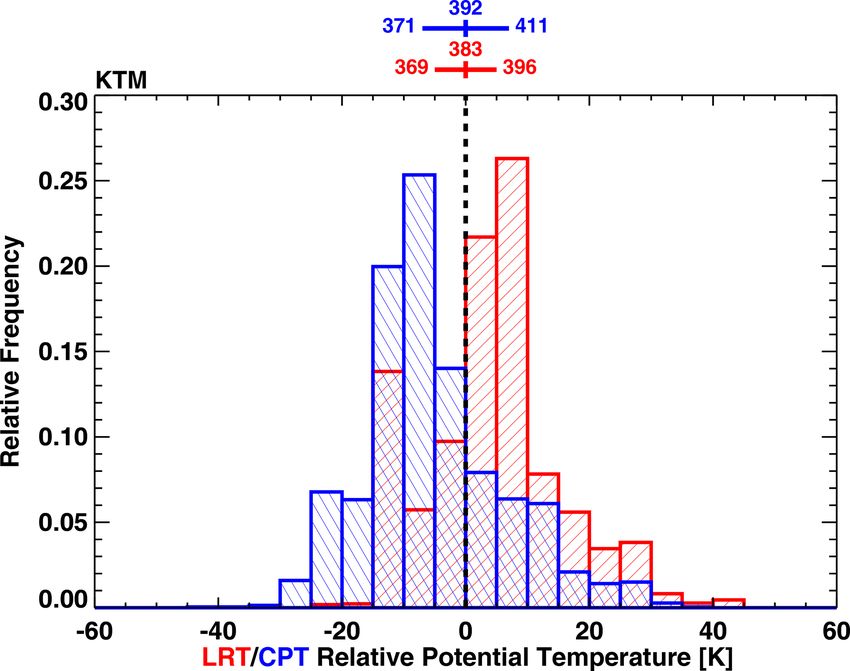
M. von Hobe et al.: Upward transport into and within the Asian monsoon anticyclone                                           1273

references therein). For a large-scale perspective of the ASM         To further investigate the vertical structure inside the ASM
region during the Kathmandu 2017 campaign, animations of           anticyclone, layer-normalized frequency distributions of the
WACCM-simulated CO distributions are provided as a video           three trace gases for all observations collected inside the an-
supplement (https://doi.org/10.5446/48163).                        ticyclone (i.e. with MeqLat >65◦ ) are shown in Fig. 4 for the
   ERA-Interim reanalysis data show that, at the time of the       vertical coordinates θ (top panels) and 1θ relative to the LRT
2016 campaign, Kalamata was located almost exactly at the          (bottom panels; a version with potential temperature relative
border between the tropics and extra-tropics, defined here as      to the CPT is provided in the Supplement Fig. S7). Tropo-
the latitude where the LRT drops sharply from 16–18 km in          spheric CO mixing ratios of around 100 ppb, a clear signa-
the tropics to 10–13 km at higher latitudes (this also shows       ture of polluted air, stretch upward from the polluted bound-
itself by the sharp PV gradient on the 380 K isentrope in the      ary layer through the lower troposphere up to about 370 K
campaign area displayed in the top panel of Fig. 1 and in          potential temperature, corresponding to about 10–20 K be-
the strong increase in potential temperature difference be-        low the LRT. The mean LRT during the campaign period is
tween LRT and cold point displayed in Fig. S3). As a con-          located at about 380 K, with maximum values up to 396 K
sequence, air masses in the tropical UTLS and in the extra-        and minimum values down to 369 K (see Fig. 4). The mean
tropical stratosphere were probed in the same altitude range       CPT level is located about 10 K higher. Note that potential
(15–20 km), often during the same flight. Air masses sam-          temperature is highly perturbed in this active convective re-
pled in the extratropical stratosphere show a clear signature      gion and that there is a particularly sharp vertical gradient in
of aged stratospheric air, with small CO mixing ratios in the      θ around the LRT, with a 10 K difference in θ corresponding
10 to 25 ppb range. Such air masses were not sampled in the        to only a few hundred metres in altitude. Above the LRT, CO
Kathmandu area, where the LRT was always located above             mixing ratios >100 ppb were not observed in these measure-
16 km altitude and 369 K potential temperature.                    ments. Above the 360–370 K level, CO gradually decreases
                                                                   with altitude until reaching stratospheric equilibrium values
3.2   Trace gas distributions                                      of 25 ppb or lower between 420 and 435 K. The observed CO
                                                                   decrease with increasing θ is consistent with the expected
In Fig. 3, campaign-averaged CO, O3 and N2 O mixing ra-            local photochemical removal during slow ascent: almost all
tios are shown against different horizontal and vertical co-       observations fall into the purple shaded region in the top left
ordinates. In the top row, where data are shown in latitude–       panel of Fig. 4, which marks realistic combinations of ascent
potential-temperature space, average LRT and CPT levels are        rate and CO lifetime. Isentropic ascent rates between 1.0 and
also shown for different latitudes. Both levels are highly vari-   1.5 K d−1 are consistent with ERA-Interim-based analyses
able, especially in the (higher latitude) Kalamata region. To      in recent studies (e.g. Garny and Randel, 2016; Legras and
account for this variability when separating mixing ratio data     Bucci, 2020; Vogel et al., 2019). The reduction of the lower
into tropospheric and stratospheric regimes, the middle row        limit to 0.7 K d−1 is based on the assumption that ERA-
of Fig. 3 adopts θ units relative to the LRT as the new vertical   Interim ascent rates in the monsoon region could be similarly
coordinate (defined in Sect. 2.3.1). A similar figure using the    biased high as has been suggested for the tropical tropopause
difference in θ relative to the CPT is provided in the Supple-     layer (TTL; e.g. Ploeger et al., 2012; Schoeberl et al., 2012).
ment (Fig. S6). The clear separation between the Kalamata          The range of 30–90 d for the CO photochemical lifetime is
and Kathmandu flights in latitude space becomes less pro-          conservatively chosen to encompass a wide range of mainly
nounced in the bottom row, where the latitude coordinate is        tropospheric lifetime estimates (e.g. Holloway et al., 2000;
replaced by MeqLat (see Sect. 2.3.2) to better represent mea-      Xiao et al., 2007; Duncan et al., 2007) and account for the
surement locations relative to the ASM (with MeqLat = 90◦          fact that OH concentration decreases with altitude. Note that
being, by definition, at the centre of the ASM anticyclone).       the WACCM simulation (Sect. 2.4) predicts CO lifetimes of
Nevertheless, observations obtained during the Kathmandu           ∼ 1 month at 150 hPa and 1–2 months at 100 hPa.
flights represent most of the data at larger MeqLat values.           Ozone, as a stratospheric tracer, behaves opposite to CO.
   Based on Ploeger et al. (2015), we use 65◦ MeqLat as the        Below about 365 K, O3 mixing ratios mostly fall into the 30–
boundary between inside the ASM anticyclone and outside            50 ppb range and never exceed 100 ppb, consistent with ex-
the ASM anticyclone. This must be regarded as an approxi-          pectations for tropospheric air. A significant increase in O3
mation, because this boundary is not always sharp and read-        with increasing altitude was observed above this level. As
ily located and can also vary over time (Ploeger et al., 2015).    with the decrease in CO, this increase in O3 is largely con-
Moreover, defining the boundary on the 380 K isentropic sur-       sistent with local photochemical production during slow as-
face introduces ambiguities for measurements collected at          cent. The purple shaded region in the top middle panel of
significantly higher or lower levels (see Sect. 2.3.2). An il-     Fig. 4 is based on the same vertical ascent rates described for
lustration of this problem is the cluster of samples with 40–      CO above O3 production rates of about 4 ppb d−1 based on
70 ppb CO just below 350 K in Fig. 4 that were observed in         Fig. 8 in Gottschaldt et al. (2017). Above about 420 K, ob-
the free troposphere over the Mediterranean during the Kala-       served O3 is higher, probably due to significant in-mixing of
mata campaign (cf. Fig. S1).

https://doi.org/10.5194/acp-21-1267-2021                                            Atmos. Chem. Phys., 21, 1267–1285, 2021
1274 M. von Hobe et al.: Upward transport into and within the Asian monsoon anticyclone Figure 2. A 3D map of averaged CO mixing ratios observed during all StratoClim flights (raw CO profiles for all individual flights are shown in the Supplement Fig. S1). Values in 3D space represent averages in 1◦ × 1◦ × 1 km longitude–latitude–altitude bins. Longitude–altitude averages over all latitudes and latitude–altitude averages over all longitudes are projected onto the x–z and y–z planes, respectively. Grey contour lines in the x–z and y–z planes show potential temperature levels averaged meridionally and zonally over the areas marked on the map by the thick black lines; red and blue lines show LRT and CPT heights averaged over the same areas (based on ERA-Interim reanalysis products during the respective campaign phases). stratospheric air above this level, consistent with significant only above about 395 K potential temperature and for 1θ reductions in N2 O mixing ratios (see below). more than 15 K above the mean LRT. Between 400 and A noteworthy feature in Fig. 4 is that the gradual decrease 410 K, these reductions become more substantial and a clear in CO and the gradual increase in O3 show no obvious dis- decline with increasing potential temperature is visible above continuities, on average, at the LRT or CPT. However, during this level. From the N2 O measurements, we can estimate the StratoClim campaign the LRT marked the vertical limit the fraction of aged extratropical air entrained into the an- above which even individual occurrences of CO >100 ppb ticyclone at 400 K, following the approach of Homan et were not observed (Fig. 4, bottom left panel). al. (2010; there estimating the extratropical fraction of TTL N2 O measurements are used to assess the role of in-mixing air). Defining “aged” here as residing in the stratosphere of stratospheric air at different levels. The local tropospheric longer than the lifetime of CO, we select as aged parcels N2 O mixing ratio is determined by averaging all observations those with CO
M. von Hobe et al.: Upward transport into and within the Asian monsoon anticyclone                                                  1275

Figure 3. Panels (a–c) show CO (a), O3 (b) and N2 O (c) mixing ratios averaged from both deployments into 1◦ latitude × 5 K potential
temperature bins. Black and grey bars show average and minimum/maximum LRT and CPT heights, respectively, for all measurements
made in each 1◦ latitude bin. Note that the bins with valid data for CO, O3 and N2 O do not exactly match due to different data coverage
for the AMICA, FOZAN and HAGAR instruments. Panels (d–f) show the same data with potential temperature relative to the LRT (see
Sect. 2.3.1) as the vertical coordinate. In panels (g–i), the horizontal coordinate is transformed to MeqLat with the vertical dotted line
marking the 65◦ ASM anticyclone boundary (see Sect. 2.3.2). The number of samples and standard deviation in each bin are given in Fig. S5
in the Supplement.

and 2017, we estimate N2 Oaged
1276                                   M. von Hobe et al.: Upward transport into and within the Asian monsoon anticyclone

Figure 4. Layer-normalized relative frequency distributions of CO (a, d), O3 (b, e) and N2 O (c, f) inside the ASM anticyclone (MeqLat >65◦ )
for vertical coordinates of potential temperature (a–c) and potential temperature difference relative to the local LRT (d–f). The number of
observations on each vertical level is plotted as the grey histogram along the right side of each panel (scaling from 0 to the number at
the right end of the axis). The mean (with standard deviation), minimum and maximum LRT and CPT levels are also shown in red and
blue, respectively (values vary slightly between the columns, because as explained in the Fig. 3 caption, the bins with valid measurements
are different for each instrument). Areas marked in purple in the CO and O3 panels indicate the range of concentrations consistent with
photochemical removal or production during slow ascent (see text for the rationale behind the chosen ranges). In the N2 O panel, the purple
line denotes the average HAGAR N2 O in the troposphere (below 360 K potential temperature) during the 2017 campaign.

locations closest to the observations in both time and space).           shows that the lower tropospheric end of the transition layer
Observed CO–O3 correlations do not show an ideal L shape                 is clearly located below the LRT, and the higher stratospheric
nor distinct mixing lines between the tropospheric and strato-           end is located above the LRT. A more detailed analysis of
spheric branches. Rather, there is a smooth curved transi-               LRT and CPT locations within the transition layer is given
tion from the tropospheric CO branch to the stratospheric O3             in Fig. 7. Observed CO–O3 pairs with transition layer char-
branch with increasing θ , consistent with a transition layer            acteristics are found mainly between 15 K below and 35 K
in which the ascending air undergoes photochemical pro-                  above the local LRT (a few very rare outliers are even found
cessing. This interpretation is supported by quasi-coincident            up to 45 K above the LRT), with roughly one-third of the
N2 O observations largely showing near-tropospheric values               pairs found below and two-thirds above the LRT. Transition
in the transition zone between the high-CO tropospheric                  layer CO–O3 pairs are observed mainly between 30 K below
branch and the high-O3 stratospheric branch (Fig. 5 inset).              and 30 K above the CPT, with roughly two-thirds below and
The points circled in red in Fig. 5 (observed during both as-            one-third above the CPT.
cent and descent near Kathmandu during a flight on 31 July)                 Compact CO–O3 correlations were also observed dur-
are speculatively associated with fresh convective outflow,              ing the START08 (Stratosphere–Troposphere Analyses of
for which O3 mixing ratios are somewhat elevated due to                  Regional Transport, 2008; https://www.acom.ucar.edu/start/,
lightning NOx .                                                          last access: 21 January 2021) campaign, during which air
   The spatial distribution of the CO–O3 pairs in the transi-            masses originating from the TTL were sampled in the extra-
tion layer (dashed magenta rectangle in Fig. 5) is shown in              tropical UTLS region (Vogel et al., 2011, their Fig. 3). Sim-
Fig. 6 by using altitude, pressure and potential temperature             ilar to our observations within the anticyclone, photochem-
as the vertical coordinate (from left to right, respectively).           ical processing within the observed air masses outweighed
From these distributions, we deduce a vertical extent of the             mixing effects. They attributed this result to the long transit
transition layer (Fig. 6) with respect to these coordinates of           times associated with air mass transport from tropical con-
∼ 16–19 km, ∼ 70–115 hPa and ∼ 365–415 K. Figure 5 also                  vective outflow to the upper part of the TTL, well above the

Atmos. Chem. Phys., 21, 1267–1285, 2021                                                     https://doi.org/10.5194/acp-21-1267-2021
M. von Hobe et al.: Upward transport into and within the Asian monsoon anticyclone                                                      1277

Figure 5. O3 vs. CO relationships in tracer–tracer space based on observations (a) and WACCM simulations (b) for the 2017 Kathmandu
flights. The data points are coloured according to their potential temperature level (with grey indicating θ
1278 M. von Hobe et al.: Upward transport into and within the Asian monsoon anticyclone
cal composition in the 370–400 K region cannot be explained
by very deep convection mixing with aged stratospheric air.
Rather, overshoots penetrating the tropopause mix into the
tropospheric air slowly rising out of the 360–370 K main
convective outflow layer. Our observations provide clear evi-
dence that this slow upwelling (discussed in Sect. 4.2) and
not overshooting convection is the major pathway for air
crossing the tropopause in the ASM anticyclone and that the
fast chimney-like transport related to convection does indeed
stop below the tropopause as suggested by Pan et al. (2016),
at least on a synoptic scale. It should be noted that this result
does not contradict the significance of overshooting convec-
tion for species such as H2 O that are subject to microphys-
ical removal at the CPT (e.g. Ueyama et al., 2018) and that
evidence for overshooting convection occurring in the Stra-
toClim year has been shown (Legras and Bucci, 2020).
Although our observations support the hypothesis of sig-
Figure 7. Transition layer in tropopause-relative potential temper-
nificant input into the anticyclone from a chimney region
ature coordinates. Histograms show normalized relative frequency
distributions of transition layer measurements as defined in the text. centred near the southern flank of the Tibetan Plateau, the
The distribution relative to the LRT (CPT) is shown in red (blue). campaign did not cover a wide enough region to characterize
The mean and the range of the LRT and CPT in potential tempera- the relative contributions of convection from other sources
ture coordinates (as shown in Fig. 4) are given in matching colours based solely on the observations. Recent studies have demon-
above the zero line. strated horizontal transport of convective outflow from loca-
tions over China into the ASM anticyclone (Lee et al., 2019;
Yuan et al., 2019) as well as injections into the ASM anti-
4 Discussion cyclone from tropical typhoons (Li et al., 2017, 2020). Evi-
dence for such import into the air masses probed in 2017 has
We now address questions Q1–Q4 formulated in Sect. 1 been shown in trajectory studies (Bucci et al., 2020; Lee et
based on the results presented in Sect. 3. In each subsec- al., 2020).
tion below, we discuss one question individually. A refined
overall picture of vertical transport in the ASM anticyclone 4.2 Transition to slow upwelling
region near the tropopause is then given in Sect. 5.
From our observations, we constrain the top of the main con-
4.1 Rapid convective transport vective outflow layer to about 16 km altitude or 370 K po-
tential temperature, although a few occurrences of convec-
Our results provide clear evidence of chimney-like vertical tive signatures are observed up to 380 K. Above this level,
transport from the boundary layer to the tropopause over the gradual decline in CO and gradual increase in O3 sug-
Nepal and northern India, where almost the entire tropo- gest continued slow ascent on timescales comparable to those
sphere shows CO mixing ratios similar to those in the pol- on which CO is photochemically destroyed and O3 is photo-
luted boundary layer. Such high CO mixing ratios are con- chemically produced (Fig. 4). This dynamically driven slow
sistently observed up to 360 K, often up to 370 K and oc- upwelling is radiatively balanced and is less geographically
casionally up to 380 K. The absence of observed CO mix- confined than the convective uplift. Pure trajectory mod-
ing ratios close to or above 100 ppb at levels above 380 K els show an “upward spiralling motion of air” extending
indicates that we did not observe any occurrences of con- over large parts of the ASM anticyclone (Vogel et al., 2019;
vective outflow above the tropopause immediately prior to Legras and Bucci, 2020).
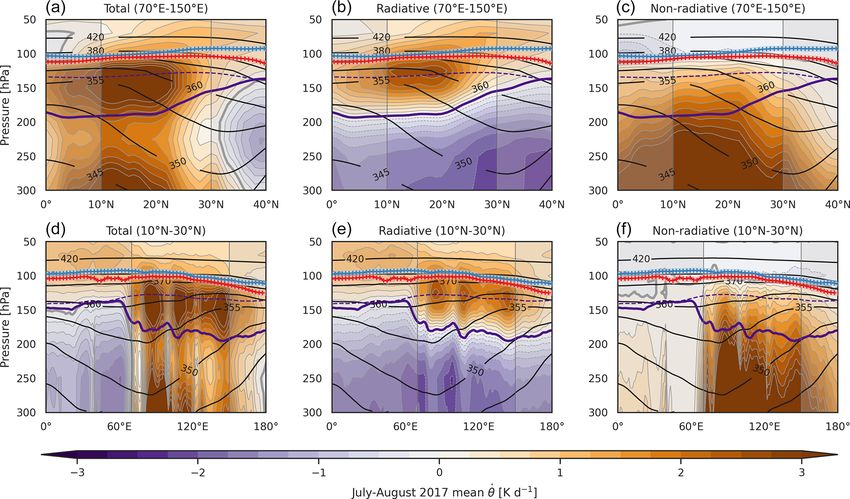
the measurement time. However, after mixing with the lo- This picture is consistent with mean diabatic heating rates
cal background following transport to this level, signatures from the ERA-Interim reanalysis in July and August (Fig. 8).
of deep convection in CO and O3 are expected to be small Relatively strong total diabatic tendencies exceeding 1 K d−1
and may therefore not be apparent, so we cannot exclude the extend upward into the upper troposphere in the tropical part
occurrence of rapid convective uplift reaching up to or even of the monsoon region, south of ∼ 30◦ N and east of ∼ 70◦ E.
above the tropopause based on our observations. Neverthe- This diabatic chimney results from frequent deep convec-
less, the absence of significant N2 O reductions below 400 K tive activity up to around 370 K, although single convec-
(Sect. 3.2) and the shape of the CO–O3 correlations, with tive events may reach higher. Legras and Bucci (2020) show
little indication for direct mixing between the tropospheric high clouds in 2017 to be mostly distributed between 340
and stratospheric branches (Sect. 3.3), reveal that the chemi- and 370 K, with some rare convective events reaching up to
Atmos. Chem. Phys., 21, 1267–1285, 2021 https://doi.org/10.5194/acp-21-1267-2021M. von Hobe et al.: Upward transport into and within the Asian monsoon anticyclone 1279
400 K. This is very similar to the cloud top height distribution 2007). Therefore, the higher-than-stratospheric-background
over the ASM region that was shown for 2007 by Ueyama et CO values in the transition layer indicate that vertical cross-
al. (2018). tropopause transport occurred within the ASM region. This
It can be seen in the right panels in Fig. 8 that the con- type of evidence of vertical transport has also been seen from
vective activity extends clearly above the level of zero radia- previous in situ measurements of water vapour (Bian et al.,
tive heating (LZRH). Thus, radiatively balanced upwelling 2012) and particle profiles (Yu et al., 2017) over the Ti-
(Fig. 8, middle panels) leads to continued upward motion betan Plateau. As shown by the CO–O3 correlations (Fig. 5),
of the air masses. In ERA-Interim, positive isentropic ver- WACCM reproduces the smooth transition from tropospheric
tical velocities up to 1.5 K d−1 (comparable with upwelling to stratospheric character over a potential temperature range
in the “shallow branch” of the Brewer–Dobson circulation in comparable to the observations, encompassing the range of
the tropics, e.g. Wright and Fueglistaler, 2013) are present LRT and CPT.
well above the 380 K level. These rates are consistent with
the range used for the purple shading in Fig. 4 and thus with 4.4 In-mixing of stratospheric air
the observed CO decline and O3 production with increasing
potential temperature (Fig. 4). Note that this is not quantita- Taking N2 O mixing ratios significantly below the current
tively conclusive, because the respective photochemical pro- tropospheric value as an indicator for the contribution of
cessing rates are only rough estimates. In addition, precise stratospheric air (Sect. 3.2), mixing of the rising ASM air
conclusions on upwelling rates may be affected by uncer- with older stratospheric air starts to become clearly visi-
tainties associated with using PV at 380 K to identify inside- ble at about 400 K potential temperature. A further indica-
anticyclone points (cf. Sect. 2.3.2). It should also be noted tion of stratospheric in-mixing is O3 mixing ratios exceed-
that other reanalysis data sets may yield quantitatively dif- ing the range explained by local photochemical production
ferent results (e.g. Wright and Fueglistaler, 2013; Tao et al., above 420 K (Fig. 4). CO mixing ratios at 415 K and above
2019). largely match the stratospheric background value (Fig. 4 and
Sect. 3.3), indicating that the tropospheric character of the
4.3 Relationship between the transition region and the ASM anticyclone ceases at or below this level. Individual
tropopause observations of slightly elevated CO are found up to 435 K
where, based on the radiative upwelling rates and CO life-
As stated in Sect. 4.1, our observations show no evidence of times discussed in Sect. 3.2, CO photochemical decay to
convection crossing the tropopause. At respective mean po- equilibrium values is expected to be complete. A contribu-
tential temperature levels of 380 K (minimum: 369 K, maxi- tion of ASM anticyclone air at potential temperature levels
mum: 396 K) and 390 K (min: 370 K, max: 411 K), both the up to 460 K had been demonstrated by Vogel et al. (2019)
LRT and the CPT are located within the radiative upwelling using a longer-lived tracer than CO. The significant isolation
regime described in Sect. 4.2. CO mixing ratios in the ASM of the ASM anticyclone air up to 400 K and the rapid weak-
anticyclone do not drop any more sharply at the LRT or CPT ening of this isolation in the range between 400 and 435 K
than in the regions immediately above or below these levels, shown by our observations is roughly consistent with previ-
and they remain greater than stratospheric background con- ous analyses of ASM confinement using trajectory analyses
centrations up to about 40 K above the LRT and 30 K above (Randel and Park, 2006; Brunamonti et al., 2018; Legras and
the CPT. The absence of any sharp transition implies that nei- Bucci, 2020).
ther the LRT nor the CPT represents a vertical transport bar-
rier for these species (neglecting, for the present discussion,
5 Conclusions
microphysical processes and constituents affected by them),
consistent with earlier studies (e.g. Vogel et al., 2019). The In situ observations of CO, O3 and N2 O were collected dur-
fact that the LRT and CPT are located well below the level ing two aircraft campaigns near the edge and near the centre
of significant stratospheric in-mixing (see Sect. 4.4) implies of the ASM anticyclone. CO and N2 O are tropospheric trac-
that these levels do not represent separation between the tro- ers with short and long photochemical lifetimes, respectively,
posphere and the stratosphere in the ASM anticyclone in ei- while O3 is a mainly stratospheric tracer. Analysis of these
ther a dynamical or chemical sense. Thus the “tropospheric observations helps us to further fill in the emerging picture
bubble” (Pan et al., 2016) not only extends to an exception- of vertical transport in the ASM anticyclone, confirming and
ally high tropopause but also above that tropopause. extending earlier studies:
In the transition layer (∼ 365–415 K), the air appears to be
largely isolated within the ASM anticyclone, which is visible – A “fast convective chimney” lifts polluted boundary
in the N2 O observations in this study (Sect. 3.2). The isola- layer air to the ASM upper troposphere, with the main
tion of air has also been reported in other StratoClim studies outflow below 370 K. Evidence of this chimney occa-
(e.g. Brunamonti et al., 2018; Legras and Bucci, 2020) and in sionally reaches up to the local LRT around 380 K but
previous publications (e.g. Randel and Park, 2006; Park et al., was not observed above this level (Figs. 2, 3, 4 and 6).
https://doi.org/10.5194/acp-21-1267-2021 Atmos. Chem. Phys., 21, 1267–1285, 20211280 M. von Hobe et al.: Upward transport into and within the Asian monsoon anticyclone
Figure 8. Zonally (a–c) and meridionally (d–f) averaged total (a, d), radiative (b, e) and non-radiative (c, f) diabatic potential temperature
tendencies (dθ/dt)diab based on the ERA-Interim reanalysis for July–August 2017. As demarcated by the vertical grey lines and bolder
colours on the respective panels, zonal averages are calculated over 70–150◦ E and meridional averages over 10–30◦ N with area weights
applied. Black contours show potential temperature. Purple contours show the vertical location of the LZRH based on the zero contour
in time-mean radiative heating rates under all-sky (solid) and clear-sky (dashed) conditions. LRT and CPT are shown in red and blue,
respectively. Averaging ranges for θ contours, LZRH, LRT and CPT are the same as those for (dθ/dt)diab .
– Inside the ASM anticyclone, above the level of main to weaken at 400 K, and the degree of mixing with sur-
convective outflow, upward transport of air continues at rounding stratospheric air smoothly increases towards
slower rates roughly consistent with vertical velocities higher levels (decreasing N2 O in Fig. 4), consistent with
and heating rates from reanalysis data and on timescales what was shown by Vogel et al. (2019). Clear signatures
largely consistent with photochemical removal and pro- of tropospheric air undergoing slow chemical process-
duction of CO and O3 , respectively (Figs. 4 and 5). Our ing are retained up to at least 415 K (Figs. 4 and 6).
results are consistent with the idea of air “spiralling” up-
ward inside the ASM anticyclone, as recently described This picture corresponds well to that proposed in a study
by Vogel et al. (2019). by Ploeger et al. (2017), who postulated that vertical cross-
tropopause transport dominates inside the ASM anticy-
– Air crosses the tropopause vertically during this radia- clone, followed by quasi-horizontal transport along isen-
tively balanced ascent, with neither the LRT nor the tropes above the tropopause into the tropics and into the
CPT marking sharp discontinuities for gases not af- NH extratropical stratosphere. It should be noted, however,
fected by microphysics; the “tropospheric bubble” (Pan that while our observations clearly show cross-tropopause
et al., 2016) extends above the tropopause (Figs. 4 transport within the ASM anticyclone, they do not necessar-
and 7). ily contradict horizontal export of air at lower levels, which
– Below about 400 K, air is to a large extent horizontally has, in fact, been shown to occur by others (e.g. Legras and
isolated within the ASM anticyclone and in-mixing of Bucci, 2020; Vogel et al., 2019; Yan et al., 2019). The sug-
stratospheric air from outside is not a dominant factor gested “two-stage” vertical transport regime with fast con-
(N2 O in Fig. 4). vective uplift followed by slow radiative upwelling is consis-
tent with recent trajectory analyses presented by Legras and
– There is no evidence for a sharp vertical boundary mark- Bucci (2020) and Vogel et al. (2019), who both show that this
ing the top of the ASM anticyclone. The isolation starts upwelling is not localized but rather follows a broad spiral
Atmos. Chem. Phys., 21, 1267–1285, 2021 https://doi.org/10.5194/acp-21-1267-2021You can also read