The climate impact of aerosols on the lightning flash rate: is it detectable from long-term measurements?
←
→
Page content transcription
If your browser does not render page correctly, please read the page content below
Atmos. Chem. Phys., 18, 12797–12816, 2018
https://doi.org/10.5194/acp-18-12797-2018
© Author(s) 2018. This work is distributed under
the Creative Commons Attribution 4.0 License.

The climate impact of aerosols on the lightning flash rate: is it
detectable from long-term measurements?
Qianqian Wang1 , Zhanqing Li1,2 , Jianping Guo3 , Chuanfeng Zhao1 , and Maureen Cribb2
1 State Laboratory of Earth Surface Process and Resource Ecology, College of Global Change and Earth System Science,
Beijing Normal University, Beijing, China
2 Department of Atmospheric and Oceanic Science, Earth System Science Interdisciplinary Center, University of Maryland,

College Park, MD, USA
3 State Key Laboratory of Severe Weather, Chinese Academy of Meteorological Sciences, Beijing, China

Correspondence: Zhanqing Li (zli@atmos.umd.edu) and Jianping Guo (jpguocams@gmail.com)

Received: 11 March 2018 – Discussion started: 4 April 2018
Revised: 26 July 2018 – Accepted: 6 August 2018 – Published: 6 September 2018

Abstract. The effect of aerosols on lightning has been           the aerosol microphysical effect more likely invigorates deep
noted in many case studies, but much less is known about         convection. This may gradually yield to the suppression ef-
the long-term impact, relative importance of dynamics–           fect as AOD increases, leading to more and smaller cloud
thermodynamics versus aerosol, and any difference by dif-        droplets that are highly susceptible to evaporation under the
ferent types of aerosols. Attempts are made to tackle all        dry conditions of northern Africa. For smoke aerosols in
these factors, whose distinct roles are discovered by analyz-    moist central Africa, the aerosol invigoration effect can be
ing 11-year datasets of lightning, aerosol loading and compo-    sustained across the entire range of AOD by the high hu-
sition, and dynamic–thermodynamic data from satellite and        midity and CAPE. This, plus a potential heating effect of the
model reanalysis. Variations in the lightning rate are ana-      smoke layer, jointly offsets the suppression of convection due
lyzed with respect to changes in dynamic–thermodynamic           to the radiative cooling at the surface by smoke aerosols. Var-
variables and indices such as the convective available po-       ious analyses were done that tend to support this hypothesis.
tential energy (CAPE) and vertical wind shear. In general,
lightning has strong diurnal and seasonal variations, peaking
in the afternoon and during the summer. The lightning flash
rate is much higher in moist central Africa than in dry north-   1   Introduction
ern Africa presumably because of the combined influences of
surface heating, CAPE, relative humidity (RH), and aerosol       Lightning can be considered a key indicator of strong atmo-
type. In both regions, the lightning flash rate changes with     spheric convection (Betz et al., 2009). Lightning activity has
aerosol optical depth (AOD) in a boomerang shape: first in-      been linked to two major factors: dynamics–thermodynamics
creasing with AOD, tailing off around AOD = 0.3, and then        and aerosols (e.g., Lucas et al., 1994; Michalon et al., 1999;
behaving differently, i.e., decreasing for dust and flattening   Boccippio et al., 2000; Orville et al., 2001; Williams and
for smoke aerosols. The deviation is arguably caused by the      Stanfill, 2002; Christian et al., 2003; Williams et al., 2004,
tangled influences of different thermodynamics (in particu-      2005; Bell et al., 2008, 2009; Guo et al., 2016).
lar humidity and CAPE) and aerosol type between the two             Since the pioneering work by Westcott (1995), who at-
regions. In northern Africa, the two branches of the oppo-       tempted to link summertime cloud-to-ground lightning ac-
site trends seem to echo the different dominant influences       tivity to anthropogenic activities, the roles of aerosols in
of the aerosol microphysical effect and the aerosol radiative    lightning have been increasingly recognized, as comprehen-
effect that are more pronounced under low and high aerosol       sively reviewed on the topic associated with aerosol–cloud–
loading conditions, respectively. Under low-AOD conditions,      precipitation interactions (e.g., Tao et al., 2012; Fan et al.,
                                                                 2016; Li et al., 2016, 2017a). The aerosol effect encom-

Published by Copernicus Publications on behalf of the European Geosciences Union.
12798                                               Q. Wang et al.: The climate impact of aerosols on the lightning flash rate

passes both radiative and microphysical effects (Boucher et         Wall et al., 2014), cloud base height (Williams et al., 2005),
al., 2013; Li et al., 2017b). The radiative effect suggests that    updraft velocity (Zipser and Lutz, 1994; Williams et al.,
aerosols can heat the atmospheric layer and cool the sur-           2005), and warm cloud depth (Stolz et al., 2015, 2017).
face by absorbing and scattering solar radiation, thereby re-          Depending on aerosol properties and atmospheric condi-
ducing the latent heat flux and stabilizing the atmosphere          tions, aerosols may enhance (Khain et al., 2005, 2008; Fan
(Kaufman et al., 2002; Koren et al., 2004, 2008; Li et al.,         et al., 2007) or suppress convection (Rosenfeld et al., 2001;
2017a). Convection and electrical activities are thus likely        Khain et al., 2004; Zhao et al., 2006). In general, aerosols
inhibited (Koren et al., 2004). By acting as cloud condensa-        tend to suppress convection for isolated clouds forming in
tion nuclei (CCN) with fixed liquid water content, increasing       relatively dry conditions but invigorate convection in convec-
the aerosol loading tends to reduce the mean size of cloud          tive systems within a moist environment (Fan et al., 2009).
droplets, suppress coalescence, and delay the onset of warm-        Under conditions of strong vertical wind shear, aerosols tend
rain processes (Rosenfeld and Lensky, 1998). This permits           to reduce the strength of single deep convective clouds due to
more liquid water to ascend higher into the mixed-phase re-         higher detrainment and larger evaporation of cloud hydrom-
gion of the atmosphere where it fuels lightning. A conspicu-        eteors (Richardson et al., 2007; Fan et al., 2009). The in-
ous enhancement of lightning activity was found to be tightly       crease in evaporation and cooling intensifies downdrafts and
connected to volcanic ash over the western Pacific Ocean            fosters the formation of secondary clouds, cloud ensembles,
(Yuan et al., 2011). More than a 150 % increase in lightning        and squall lines (Altaratz et al., 2010). Apart from the invig-
flashes accompanied a ∼ 60 % increase in aerosol loading.           oration effect induced by aerosols, lightning activity is en-
Aerosol emissions from ships enhanced the lightning density         hanced by increases in NCAPE, cloud base height, and ver-
by a factor of ∼ 2 along two of the world’s main shipping           tical wind shear, but inhibited by the increasing cloud base
lanes in the equatorial Indian Ocean (Thornton et al., 2017).       height (Williams and Satori, 2004; Williams, 2005), mid-
In terms of the response of clouds to aerosols, an optimal          tropospheric relative humidity, and warm cloud depth (Stolz
aerosol concentration was found to exist based on observa-          et al., 2015).
tional analyses (Koren et al., 2008; Wang et al., 2015) and            Most previous studies were based on short-term data.
a theoretical calculation (Rosenfeld et al., 2008). Biomass-        Here, we investigate and quantify the relative roles of
burning activities, anthropogenic emissions, and desert dust        aerosols and dynamics–thermodynamics on the lightning
are the three major atmospheric aerosol sources (Rosenfeld          flash rate using long-term (11 years) lightning, AOD,
et al., 2001; Fan et al., 2018) that have different climate ef-     and dynamic–thermodynamic data. Section 2 describes the
fects. The increased rainfall in southern China and drought         datasets and method used in this study; Sect. 3 shows the
in northern China are thought to be related to an increase in       regions of interest (ROIs); and Sect. 4 examines (1) the cli-
black carbon aerosols (Menon et al., 2002). The effect of dust      matological behavior of the lightning flash rate and AOD,
on cloud properties tends to decrease precipitation through a       (2) the response of the lightning flash rate to dynamics and
feedback loop (Rosenfeld et al., 2001; Huang et al., 2014a,         thermodynamics, (3) the contrast in the response of the light-
b) especially for drizzle and light rain.                           ning flash rate to dust and smoke, (4) the environmental de-
   Most studies on aerosol–convection interactions account          pendence of the aerosol effect, and (5) the relative roles of
for the aerosol burden (i.e., aerosol optical depth, AOD;           dynamics, thermodynamics, and AOD on the lightning flash
the number concentration of aerosols; particulate matter that       rate. A summary of key findings is given in Sect. 5.
have a diameter less than 2.5 µm; or CCN) rather than aerosol
size or species. It was not until recently that ultrafine aerosol
particles were found to intensify convective strength by being      2     Data and method
activated into cloud droplets under excess supersaturation en-
vironmental conditions (Fan et al., 2018). Regarding aerosol        2.1     Data
species, recent studies have underscored the urgent need to
consider the effect of different aerosol species in modulating      2.1.1    Lightning data
lightning activity (e.g., Stolz et al., 2015, 2017), prompting
us to perform more detailed analyses in this study.                 We use lightning data from the Lightning Imaging Sen-
   Lightning and convection strength are controlled by vari-        sor (LIS) onboard the Tropical Rainfall Measuring Mission
ous dynamic–thermodynamic variables and indices such as             (TRMM) satellite which was designed to acquire and inves-
air temperature (Price, 1993; Williams, 1994, 1999; Mark-           tigate the distribution and variability of total lightning (i.e.,
son, 2007), convective available potential energy (CAPE)            intra-cloud and cloud-to-ground) on a global basis and spans
and its vertical distribution (normalized CAPE, NCAPE)              all longitudes between 38◦ N and 38◦ S during the day and
(Stolz et al., 2015; Bang and Zipser, 2016), vertical wind          night (Boccippio, 2002; Christian et al., 2003). The LIS on
shear (Khain et al., 2008; Fan et al., 2009, 2013; Igel and         TRMM monitors individual storms and storm systems at a
Heever, 2015; Bang and Zipser, 2016), relative humidity             nadir field of view exceeding 580 km × 580 km with a de-
(RH) in the lower and middle troposphere (Fan et al., 2007;         tection efficiency of 69 % to 90 %. Also used are the low-

Atmos. Chem. Phys., 18, 12797–12816, 2018                                           www.atmos-chem-phys.net/18/12797/2018/
Q. Wang et al.: The climate impact of aerosols on the lightning flash rate                                                   12799

resolution monthly time series (LRMTS) from 2003 to 2013,          strength and width of updrafts (Williams et al., 2005). How-
which is a gridded lightning climatology dataset that pro-         ever, reliable updraft measurements that would illuminate
vides the flash rate per month at a 2.5◦ × 2.5◦ spatial res-       this role in the present study are lacking.
olution and is recorded in coordinated universal time. The            Sea level pressure. Atmospheric pressure is a key dynamic
low-resolution diurnal climatology provides the mean diur-         factor affecting weather because it defines basic weather
nal cycle in local solar time (LT) with the same spatial reso-     regimes. Low-pressure systems are usually associated with
lution (Cecil et al., 2001, 2006, 2014).                           strong winds, warm air, and atmospheric lifting and normally
                                                                   produce clouds, precipitation, and strong convective distur-
2.1.2   Aerosol data                                               bances such as storms and cyclones. An examination of sum-
                                                                   mertime sea level pressure anomalies in the tropical Atlantic
Aerosol loading is characterized by AOD which is ob-               region shows an inverse relationship between sea level pres-
tained from observations collected by the Moderate Res-            sure and tropical cyclones (Knaff, 1997).
olution Imaging Spectroradiometer (MODIS) onboard the                 Potential temperature. Many researchers have studied
Aqua satellite that crosses the Equator at ∼ 13:30 LT. Here,       the role of temperature in influencing lightning activity
the monthly level 3 global product (MYD08_M3) on a                 (Williams, 1992, 1994, 1999; Williams et al., 2005; Markson,
1◦ × 1◦ grid from 2003 to 2013 is used. The AOD at 0.55 µm         2003, 2007). However, the direct comparison of air tempera-
is retrieved using the dark-target–deep-blue combined algo-        tures for different regions is problematic because air temper-
rithm which is particularly suitable over desert regions (Levy     ature systematically declines with altitude. We choose poten-
et al., 2013; Hubanks et al., 2015). The Modern-Era Retro-         tial temperature instead, which corrects for the altitude de-
spective Analysis for Research and Application (MERRA) is          pendence and provides a more meaningful comparison. Tak-
a NASA meteorological reanalysis that takes advantage of           ing into account that the linkage between lightning activity
satellite data from 1979 to the present using the Goddard          and thermodynamics involves moist processes, some others
Earth Observing System Data Assimilation System version            use wet-bulb temperature or wet-bulb potential temperature,
5 (GEOS-5). The assimilation of AOD in the GEOS-5 in-              which includes both temperature and moisture (Williams,
volves very careful cloud screening and data homogenization        1992; Reeve and Toumi, 1999; Jayaratne and Kuleshov,
by means of a neural net scheme that translates MODIS radi-        2006). It has been demonstrated that CAPE increases linearly
ances into Aerosol Robotic Network (AERONET)-calibrated            with wet-bulb potential temperature (Williams et al., 1992).
AODs. The MERRA Aerosol Reanalysis (MERRAero) pro-                 In this study, we would like to examine the relative roles of
vides dust, black carbon (BC), organic carbon (OC), and total      several parameters and their total contribution to lightning
extinction AODs, and the total Ångström exponent at a spa-         activity. In order to select more independent variables and
tial resolution of 0.625◦ × 0.5◦ (da Silva et al., 2015). These    reduce the duplication of temperature and humidity informa-
data characterize aerosol species and particle size.               tion, potential temperature is selected. Although it does not
                                                                   reflect moist processes directly, when the moisture level is
2.1.3   Dynamic–thermodynamic data                                 suitable, places with higher temperatures are more favorable
                                                                   for convection. Here, potential temperature (θ ; in units of K)
Dynamic–thermodynamic data used are from the European              is calculated from 2 m air temperature (T ; in units of K) and
Centre for Medium-Range Weather Forecasts (ECMWF)                  pressure (p; in units of hPa):
ERA-Interim reanalysis product (Dee et al., 2011). Of in-
                                                                                    0.286
terest to this study are the surface upward sensible heat                     1000
flux, the surface upward latent heat flux, sea level pressure      θ =T                       .                                 (1)
                                                                               p
(SLP), 2 m temperature, CAPE, relative humidity at 700 and
500 hPa, the wind fields at 925 and 500 hPa, and divergence        Mid-level relative humidity. Moderately wet underlying sur-
at 200 hPa, all with a spatial resolution of 1◦ × 1◦ . With ref-   faces are an important factor in facilitating deep convection
erence to the findings from previous studies, we choose the        due to the compromise between instability energy (when
following factors to characterize the dynamics and thermo-         temperature is fixed, the atmosphere is wetter and CAPE
dynamics.                                                          is larger) and the transformation efficiency from instability
   CAPE. CAPE is a thermodynamic parameter commonly                energy to kinetic energy (when the boundary layer is wet-
used in strong convection analysis and forecasting. It de-         ter, the cloud base height is lower and updrafts are weaker).
scribes the potential buoyancy available to idealized rising       Higher surface relative humidity results in more lightning ac-
air parcels and thus denotes the instability of the atmosphere     tivities in dry regions and fewer lightning activities in wet re-
(Riemann-Campe et al., 2009; Williams, 1992). The stronger         gions with the watershed of surface relative humidity values
CAPE is, the more unstable the atmosphere is and the more          at ∼ 72 % to 74 % (Xiong et al., 2006). However, for mid-
likely strong vertical air motion is. Lightning activity in-       level humidity, only shallow convection occurs in the driest
creases with CAPE (Williams et al., 2002). The conversion          case while strong deep convection occurs in more moist cases
efficiency of CAPE to updraft kinetic energy depends on the        (Derbyshire et al., 2004). Strong positive relations are found

www.atmos-chem-phys.net/18/12797/2018/                                               Atmos. Chem. Phys., 18, 12797–12816, 2018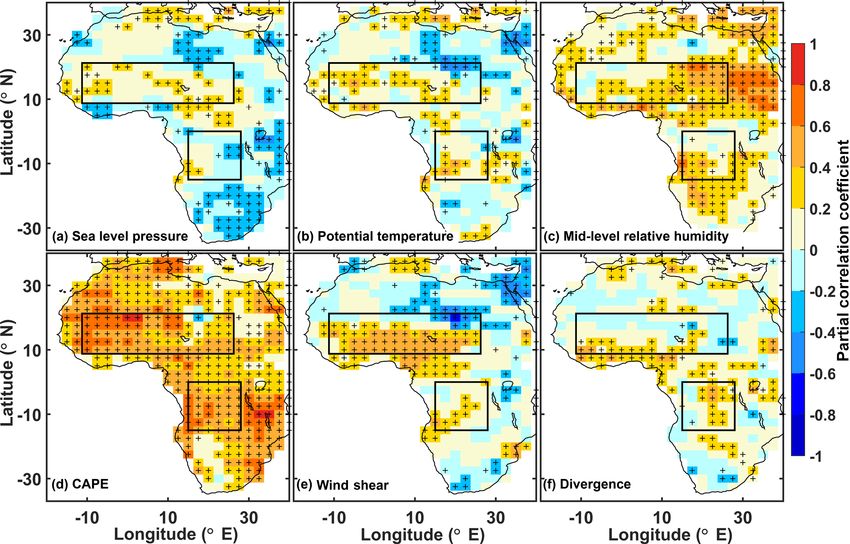
12800                                              Q. Wang et al.: The climate impact of aerosols on the lightning flash rate

between mean humidity (between 2 and 6 km) and convec-             lack of water to evaporate creates large Bowen ratios. The
tive cloud top heights (Redelsperger et al., 2002). Anoma-         Bowen ratio is calculated as
lously high humidity in the free troposphere (between 850
                                                                                   surface upward sensible heat flux
and 400 hPa), which tends to increase plume buoyancy, is           Bowen ratio =                                     .        (3)
observed prior to a shallow-to-deep convection transition                           surface upward latent heat flux
(Chakraborty et al., 2018). Different from surface moisture
                                                                   2.2     Methodology
as a cause of deep convection, mid- to upper-tropospheric
moisture (between 200 and 600 hPa) is more likely to be an         2.2.1    Data collocation
effect of convection (Sobel et al., 2003). In addition, moist-
ening the mid-tropospheric environment can also reduce the         A roughly 3-month running mean filter is used to smooth
dilution effect on CAPE, which depends strongly on the de-         lightning data (i.e., the LRMTS dataset), allowing the LIS to
gree of subsaturation of the entrained air: the wetter the en-     progress twice through the diurnal cycle at a given location
trained air, the smaller the effect (Zhang, 2009) which tends      (Cecil et al., 2014) and to show the normal annual variation in
to facilitate ensuing deep convection. Therefore, there may        lightning activity due to the seasonal meridional migration of
be no turning point regarding the response of lightning to         the Intertropical Convergence Zone (ITCZ; Waliser and Gau-
mid-level relative humidity. Even if there is, the 3-month-        tier, 1993; Thornton et al., 2017). A 3-month running mean is
moving-average mid-level relative humidity (less than 1 %          also applied to all AOD and dynamic–thermodynamic data,
and 9 % of the total in the dust- and smoke-dominant re-           which are then resampled onto 2.5◦ × 2.5◦ resolution grids in
gions, respectively, surpass relative humidity = 73 %) is less     the climatological analysis. To make the comparison within
than the surface relative humidity (12 % and 63 % of the to-       the same AOD range and to increase the number of data sam-
tal in the dust- and smoke-dominant regions surpass relative       ples, climatological features of lightning, AOD, dynamics,
humidity = 73 %) in the long term. Mean relative humidity          and thermodynamics under polluted and clean conditions are
values at 700 and 500 hPa levels are used in this study.           limited to cases with AOD < 1.0 over the regions of interest.
   Wind shear. The vertical shear of horizontal wind, here-        Since there are large differences in aerosol loading in dif-
after simply referred to as wind shear, not only affects dy-       ferent seasons and under different dynamic–thermodynamic
namical flow structures around and within a deep convec-           conditions, we cannot use a specific set of values to dis-
tive cloud (Rotunno et al., 1988; Weisman and Rotunno,             tinguish between clean and polluted cases applicable to all
2004; Coniglio et al., 2006), but also qualitatively determines    months and all dynamic–thermodynamic conditions. So for
whether aerosols suppress or enhance convective strength           each month and under each fixed dynamic–thermodynamic
(Fan et al., 2009). Bang and Zipser (2016) found no signif-        condition, all data are sorted according to AOD and divided
icant visible differences in wind shear (the lowest 200 hPa)       into three equal sample subsets where the top third of the
between flashing and non-flashing radar precipitation fea-         AOD range is labeled as polluted, and the bottom third is la-
tures in the central Pacific. Others have suggested that ver-      beled as clean. To avoid a higher probability of misclassifica-
tical wind shear can suppress cloud vertical development for       tion of clouds and aerosols in high-AOD regimes (Platnick et
isolated convection (Richardson et al., 2007) but is critical in   al., 2003), to minimize the influence of hygroscopic growth
organizing mesoscale convection systems (Takemi, 2007). In         in a humid environment (Feingold and Morley, 2003), and
this paper, wind shear (SHEAR; in units of Pa s−1 ) is calcu-      to retain enough samples especially in the lightning-deficient
lated from daily wind fields ((U , V ); in units of Pa s−1 ) at    region, the AOD range in this study is set between 0 and 1,
925 and 500 hPa as follows:                                        following the work of Kaufman et al. (2005, AOD < 0.6), Ko-
             p                                                     ren et al. (2008, AOD < 0.8; 2012, AOD < 0.3) and Altaratz
SHEAR = (U500 − U925 )2 + (V500 − V925 )2 .                 (2)    et al. (2017, AOD < 0.4). In addition, MODIS AOD is evalu-
                                                                   ated using daily AERONET AOD data (see Figs. S1 and S1-
Divergence. Air divergence is especially useful because it         1, 2, 3 in the Supplement). Analyses are performed between
can be linked to adiabatic heating processes, of which the         clean and polluted subsets only to create sufficient contrast
nonuniformity gives rise to atmospheric motion (Mapes and          between the groups while retaining good sampling statistics
Houze Jr., 1995; Homeyer et al., 2014). Fully developed            (Koren et al., 2012).
clouds are usually accompanied by upper-level divergence,
especially in raining regions (Mapes and Houze Jr., 1993).         2.2.2    Statistical analysis method
A pronounced divergence maximum exists between 300 and
150 hPa due to deep convective outflow (Mitovski et al.,           Correlation coefficients are used to measure the strength of
2010).                                                             the relationship between the lightning flash rate and indi-
   The surface property which determines the contribution of       vidual predictors (sea level pressure, potential temperature,
latent heat versus sensible heat is described by the Bowen         mid-level relative humidity, CAPE, wind shear, divergence,
ratio. In warm and wet climates, the large potential for evap-     AOD). The Pearson correlation (Pearson, 1896) is commonly
otranspiration creates small Bowen ratios. In dry regions, a       used to measure linear correlation. A partial correlation is

Atmos. Chem. Phys., 18, 12797–12816, 2018                                          www.atmos-chem-phys.net/18/12797/2018/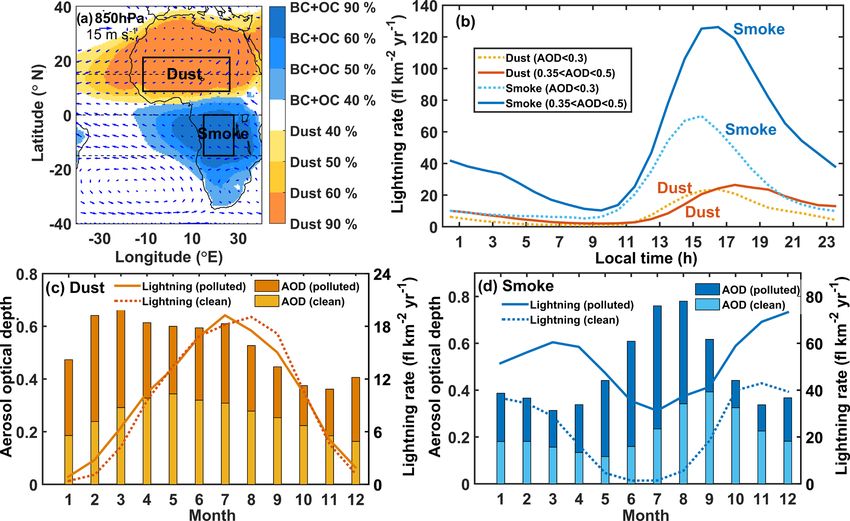
Q. Wang et al.: The climate impact of aerosols on the lightning flash rate                                                           12801

Figure 1. Spatial distributions of (a) aerosol optical depth (AOD) at 550 nm derived from the MODIS at a spatial resolution of 1◦ × 1◦
and (b) the total aerosol Ångström parameter (470–870 nm) from the MERRA dataset on a 0.625◦ × 0.5◦ grid for the period 2003–2013
including all seasons. The red rectangle outlines the region of interest. (c) The ratio of dust AOD to total AOD over the region of interest
and (d) the ratio of carbonaceous aerosol (black carbon and organic carbon: BC + OC) AOD to total AOD over the region of interest derived
from the MERRAero dataset (da Silva et al., 2015). Also shown is the 850 hPa mean wind field from the ERA-Interim reanalysis with a
spatial resolution of 1◦ × 1◦ in panels (c) and (d).

done to control the other predictors and to study the effect of         Here, y and xi are standardized variables derived from the
each predictor separately. The correlation is significant when          raw variables Y and Xi by subtracting the sample means (Y ,
it passes the significance test at the 0.05 level.                      XI ) and dividing by the sample standard deviations (δY , δi ):
   To explore the relative roles of dynamic–thermodynamic
                                                                              Y −Y        Xi − Xi
variables and AOD on lightning activity, we use a multiple-             y=         , xi =         , i = 1, . . ., 7.                     (5)
linear regression method following previous studies (e.g.,                      δY           δi
Igel and van den Heever, 2015; Stolz et al., 2017). Since               The sample mean of N valid samples is calculated as
there is an optimal value of aerosol loading in terms of the                  N               N
response of the lightning flash rate to aerosols (Koren et al.,
                                                                              P               P
                                                                                   Yj              Xj i
2008; Rosenfeld et al., 2008), we establish standardized re-            Y=
                                                                               1
                                                                                 , Xi =
                                                                                               1
                                                                                               , i = 1, . . ., 7; j = 1, . . ., N.      (6)
gression equations for AOD greater than and less than the                     N            N
turning point value. This is done to reduce the nonlinear ef-           The sample standard deviation is
fect of AOD. Note that all data used here are processed by                   v                               v
averaging 10 samples sorted by AOD from small to large                                 N                                 N
                                                                             u                               u
                                                                             u 1 X                           u 1 X
                                                                                                   2
to mitigate data uncertainties. The standardized regression             δY = t           (Yj − Y ) , δi = t                   (Xj i − Xi )2 ,
                                                                               N −1 1                           N −1 1
equation with seven predictor variables x1 , x2 ,. . . , x7 (sea
level pressure, potential temperature, mid-level relative hu-              i = 1, . . ., 7; j = 1, . . ., N.                             (7)
midity, CAPE, wind shear, divergence, AOD) and the re-
sponse y (lightning flash rate) can be written as                       Standardized regression coefficients ignore the independent
                                                                        variables’ scale of units, which makes the slope estimates
                                                                        comparable and shows the relative weights to the changes in
y = β0 + β1 x1 + β2 x2 + . . . + βixi, i=1,...,7 .             (4)      lightning flash rate.

www.atmos-chem-phys.net/18/12797/2018/                                                   Atmos. Chem. Phys., 18, 12797–12816, 2018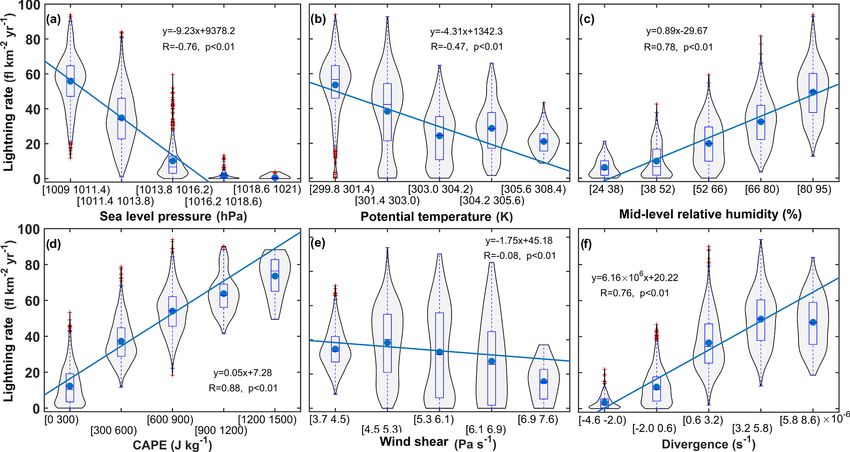
12802                                              Q. Wang et al.: The climate impact of aerosols on the lightning flash rate

3     Regions of interest (ROIs)                                   AOD and lightning flash rate (Fig. 2c, d) calculated under
                                                                   relatively clean and polluted (dusty/smoky) conditions over
High loadings of dust and smoke aerosols are found in north-       the dust-dominant region and the smoke-dominant region.
ern and southern Africa, respectively, as seen in Fig. 1.          The same afternoon peaks in lightning activity are seen in
Northern Africa is the world’s largest source of mineral dust      Fig. 2b, suggesting strong convection in the afternoon over
(Lemaître et al., 2010) with the most widespread, persistent       land (Williams et al., 2000; Nesbitt and Zipser, 2003). Peaks
dust aerosol plumes and the densest particulate contribution       in lightning activity over both the dust- and smoke-dominant
found on Earth (Prospero et al., 2002). About 2–4 billion tons     regions under polluted (dusty/smoky) conditions occur 1 h
of blown dust is estimated to be removed from the Sahara           later than those under clean conditions. This is consistent
desert annually (Goudie and Middleton, 2001). Dust parti-          with the finding of an aerosol-induced delay in precipitation
cles of relevance to atmospheric processes are minerals with       and lightning activity revealed from observations (Guo et al.,
particle sizes up to 70 µm that can be readily suspended by        2016) and model simulations (Lee et al., 2016) in south-
the wind (Shao, 2008). Africa is also the single largest source    ern China. Numerous studies have noted that aerosols mod-
of smoke emissions due to widespread biomass burning, ac-          ulate convection and lightning activity through both radia-
counting for roughly 30 % to 50 % of the total amount of           tive and microphysical processes, as reviewed extensively in
vegetation burned globally each year (Andreae, 1991; van           Asia (Li et al., 2016) and around the world (Li et al., 2017b).
der Werf et al., 2003, 2006; Roberts et al., 2009). In central     Monthly variations in dust loading change little throughout
and southern Africa, biomass burning due to wildfires and          the year (Fig. 2c), while smoke shows a pronounced sea-
human-set fires has strong diurnal and seasonal variabilities      sonal variation with a large contrast between dry and wet
(Roberts et al., 2009; Ichoku et al., 2016).                       seasons (Fig. 2d). Lightning activity in both regions is most
   Figure 1a shows the global distribution of mean AOD from        active in summer and rarely occurs in winter, which is con-
the MODIS onboard the Aqua satellite from 2003 to 2013.            sistent with the seasonal feature of CAPE (especially for the
Figure 1b shows the Ångström exponent obtained from the            smoke-dominant region; see Fig. 3), implying that the sea-
MERRAero at a spatial resolution of 0.625◦ × 0.5◦ used for         sonal variation in lightning activity is mainly controlled by
the analysis of contributions from different aerosol species,      thermodynamic conditions. Figure 2 also shows an apparent
chiefly dust, black carbon, and organic carbon, and total ex-      enhancement in lightning activity under smoky conditions
tinction AODs. Note that satellite retrievals of the Ångström      superimposed on both the diurnal (Fig. 2b) and seasonal cy-
exponent have excessive uncertainties over land so they            cles (Fig. 2d). Under dusty conditions, however, the impact
are not included in the MODIS Collection 6 product. The            is much weaker than under smoky conditions. Apart from
African continent stands out with very large AOD in two            different aerosol effects, different climate conditions that ex-
regions: the Sahara desert covered by dust (Fig. 1c) and           ist between the dust- and smoke-dominant regions, as well
central to southern Africa dominated by smoke (Fig. 1d),           as between (i) heavy and (ii) light loading seasons and con-
characterized by small and large values of the Ångström            ditions for the same type of aerosol, may also contribute. A
exponent, respectively (Fig. 1b). Due to their distinct dif-       key factor is moisture, which is much lower over the dust-
ferences in aerosol species, the dust- and smoke-dominant          dominant region (Bowen ratio > 10, see Fig. S2 in the Sup-
regions (Fig. 1c, d) are selected as the study regions for         plement) than over the smoke-dominant region covered with
dust and smoke. The ratios of dust (dust-dominant region)          rainforests (Bowen ratio < 0.4, see Fig. S2 in the Supple-
or (BC + OC) (smoke-dominant region) extinction AOD to             ment). The significantly higher probabilities of high relative
total extinction AOD are greater than 50 % averaged over           humidity over the smoke-dominant region than over the dust-
the period 2003–2013, which enables us to study multiple           dominant region for both middle troposphere and surface are
aerosol effects on lightning activity. Also shown in Fig. 1c       shown in Fig. 4. The mean mid-level relative humidity for the
and d are mean wind vectors at 850 hPa over Africa and its         dust-dominant region is ∼ 36 % and for the smoke-dominant
neighboring oceans (the area outlined in red in the left panel),   region it is ∼ 74 %. High values of relative humidity favor
which represent the prevailing wind direction.                     the invigoration effect (Fan et al., 2008, 2009; Khain et al.,
                                                                   2008; Khain, 2009; Thornton et al., 2017), which is likely a
                                                                   major cause of the intense lightning activity in the smoke-
4     Results and discussion                                       dominant region. The dust-dominant region is located in the
                                                                   vicinity of the African easterly jet (Burpee, 1972) and the
4.1    Climatological behavior of the lightning flash rate         smoke-dominant region is located in the ITCZ (Waliser and
       and AOD                                                     Gautier, 1993). Differences in wind shear and instability thus
                                                                   arise between the two regions.
The seasonal and diurnal cycles of the lightning flash rate and
AOD are first examined over the dust- and smoke-dominant
regions (Fig. 2a). Figure 2 also shows the diurnal cycle
(Fig. 2b) and monthly variations in the MODIS-retrieved

Atmos. Chem. Phys., 18, 12797–12816, 2018                                          www.atmos-chem-phys.net/18/12797/2018/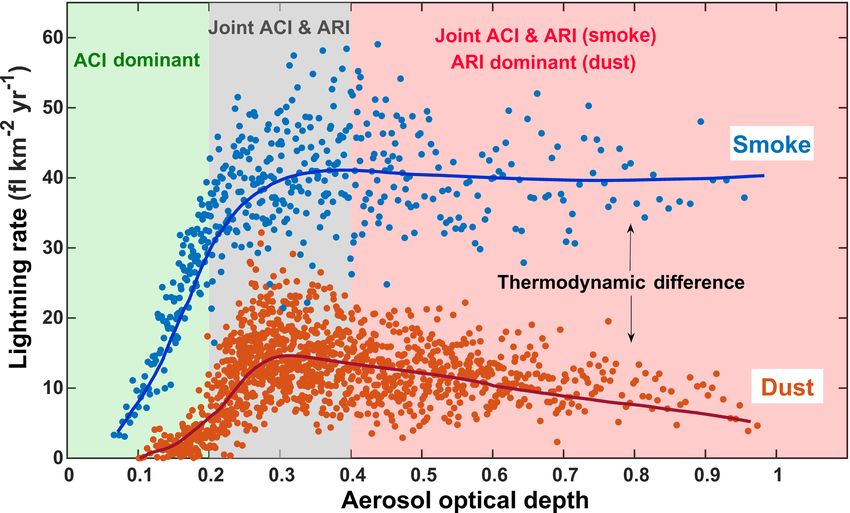
Q. Wang et al.: The climate impact of aerosols on the lightning flash rate                                                            12803

Figure 2. (a) The 850 hPa mean wind field from the ERA-Interim reanalysis with a spatial resolution of 1◦ × 1◦ showing the prevailing wind
direction over Africa and the neighboring ocean over the region of interest defined in Fig. 1. The dust- and smoke-dominant regions (outlined
by black rectangles) are defined as areas where the ratio of dust or carbonaceous aerosol (black carbon and organic carbon: BC + OC)
extinction aerosol optical depth (AOD) to total extinction AOD is greater than 50 % averaged over the period from 2003 to 2013, which
enables us to better understand the potential effect of dust or smoke aerosols on lightning. Also shown are the (b) diurnal cycle and monthly
variations in mean AOD and lightning flash rate calculated under relatively clean and polluted (dusty/smoky) conditions in the (c) dust-
dominant region and the (d) smoke-dominant region. Unless otherwise noted, the AOD used in this study is derived from the MODIS, and
the lowest (highest) third of the AOD range (AOD ∈ (0, 1)) is labeled as clean (polluted). Lightning flash rates come from the low-resolution
monthly time series and the low-resolution diurnal climatology products on a 2.5◦ × 2.5◦ grid (Cecil et al., 2001, 2006, 2014). Data from all
seasons are included.

4.2   Response of lightning to dynamics and                              be the best choice. However, the importance of these factors
      thermodynamics                                                     still needs to be assessed. Since cloud base height and warm
                                                                         cloud depth can be derived from temperature and humidity, to
Diurnal and seasonal variations in lightning activity de-                reduce the duplication of information about temperature and
pend on dynamic–thermodynamic conditions. We first look                  humidity, we choose to use only the fundamental variables
at the response of the lightning flash rate to dynamic–                  relative humidity and potential temperature. The violin plot
thermodynamic conditions which are characterized by six                  is an effective way to visualize the distribution of data and
variables (sea level pressure, potential temperature, CAPE,              the shape of distributions that allows the quick and insight-
mid-level relative humidity, wind shear, and divergence). The            ful comparison of multiple distributions across several levels
cloud base height and warm cloud depth are also both phys-               of categorical variables. It synergistically combines the box
ically relevant to lightning activity (Williams and Satori,              plot and the density trace into a single display (Hintze and
2004; Venevsky, 2014; Stolz et al., 2017). However, as statis-           Nelson, 1998).
tical theory indicates, more factors will introduce more ran-               Figure 5 shows linear correlations between the light-
dom noise and thus undermine the stability of the regression             ning flash rate and the six dynamic–thermodynamic vari-
equation. When the sample size is fixed, the contribution                ables for the dust-dominant region. CAPE, mid-level rela-
of factors to the multiple regression equation changes little            tive humidity, and divergence are the top three dynamic–
between 5 and 10 factors (Klein and Walsh, 1983; see Ta-                 thermodynamic variables strongly and positively correlated
bles S1-1 and S1-2 in the Supplement), so 5–6 factors should             with lightning flash rate (R > 0.7). This suggests that high

www.atmos-chem-phys.net/18/12797/2018/                                                  Atmos. Chem. Phys., 18, 12797–12816, 2018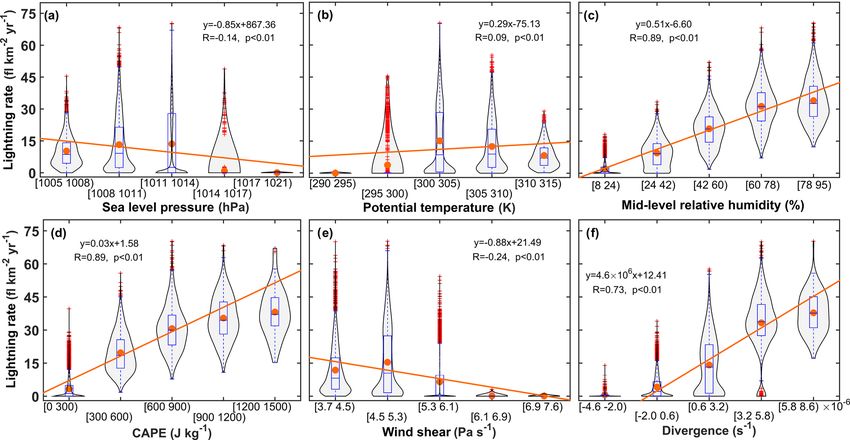
12804 Q. Wang et al.: The climate impact of aerosols on the lightning flash rate
strong upward movement closely associated with lightning
activity. Inverse correlations between the lightning flash rate
and sea level pressure and between the lightning flash rate
and wind shear are seen in Fig. 5a and e. Figure 5b shows
a weak, positive correlation between the lightning flash rate
and potential temperature. The small correlation coefficients
of the regressions between the lightning flash rate and sea
level pressure, wind shear, and potential temperature suggest
little correlation between these variables and the lightning
flash rate.
Figure 6 shows the linear correlations between the light-
ning flash rate and the six dynamic–thermodynamic variables
associated with strong convection for the smoke-dominant
region. Mid-level relative humidity, CAPE, and divergence
are positively correlated with the occurrence of lightning
Figure 3. Seasonal variations in CAPE under relatively clean and
as opposed to sea level pressure, potential temperature, and
polluted conditions in the dust- and smoke-dominant regions. Clean
(polluted) cases are defined as those CAPE values corresponding to wind shear, which are negatively correlated with the light-
the lowest (highest) third of the aerosol optical depth (AOD) range ning flash rate. In particular, Fig. 6a, c, d, and f show
(AOD ∈ (0, 1)). that CAPE, mid-level relative humidity, divergence, and sea
level pressure are significantly correlated with the light-
ning flash rate (|R| > 0.75, p < 0.05; in order of the corre-
lation strength), suggesting that these four variables may
be the major factors modulating changes in the lightning
flash rate. By comparison, a moderate linear relationship
exists between the lightning flash rate and potential tem-
perature (R = −0.47), which is also the case for the rela-
tionship between the lightning flash rate and wind shear
(R = −0.08), suggesting their minor effects on the lightning
flash rate (Fig. 6b and e). Simulations done by Weisman
and Klemp (1982) show that weak, moderate, and high wind
shear produces short-lived single cells, secondary develop-
ment, and split storms, respectively. The coarse time resolu-
tion may be why no significant correlation is found between
shear and the lightning flash rate. Note that the correlation
coefficients obtained here can only describe the possible de-
pendencies between the lightning flash rate and dynamic–
thermodynamic variables and cannot imply causal relation-
ships.
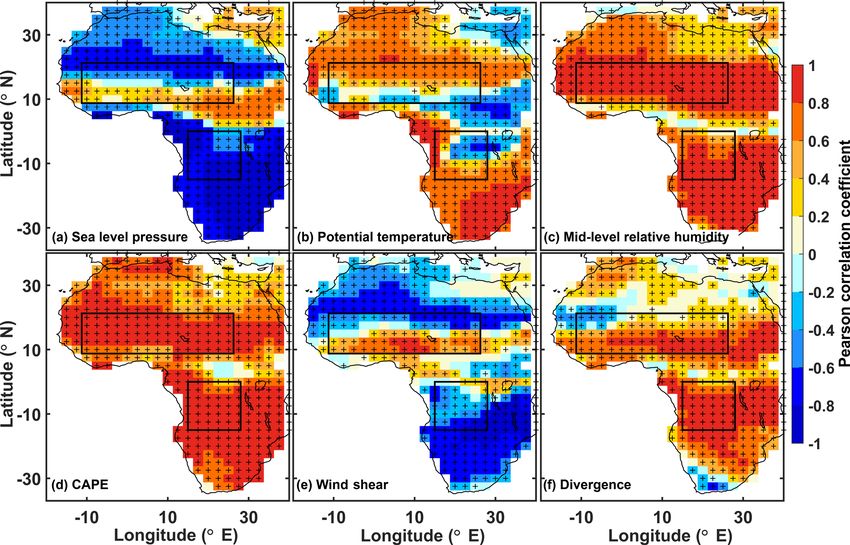
To provide a visual comparison of the dust- and smoke-
dominant regions, we show the spatial distributions of the
correlation coefficients of the regressions between the light-
ning flash rate and dynamic–thermodynamic variables. Fig-
Figure 4. The probability density function (PDF) of (a) surface and ure 7 shows that lightning flash rates are well correlated with
(b) mid-level relative humidity in the dust- and smoke-dominant mid-level relative humidity, CAPE, and divergence through-
regions. out both the dust- and smoke-dominant regions (most parts
R > 0.6), while for other variables, the correlations vary from
region to region. In particular, the correlations between the
mid-level relative humidity and CAPE are conducive to the lightning flash rate and sea level pressure (positive), poten-
development of intense convection and that the lightning oc- tial temperature (negative), and wind shear (positive) near
currence is associated with high-level divergence. One thing the Earth’s Equator are distinctly different from those over
to notice is the shape of the density traces in Fig. 5f. The bi- other regions. We infer that this is because the hot and hu-
modal distribution indicates that small to moderate high-level mid environment year-round favors deep convection. Wind
divergence may be due to clear-sky or in-cloud atmospheric shear helps organize mesoscale convection in moist deep
movement with a small updraft velocity that does not pro- convection which produces more lightning. Regarding po-
duce lightning. Large divergence usually characterizes the tential temperature, rich precipitation helps cool the sur-
Atmos. Chem. Phys., 18, 12797–12816, 2018 www.atmos-chem-phys.net/18/12797/2018/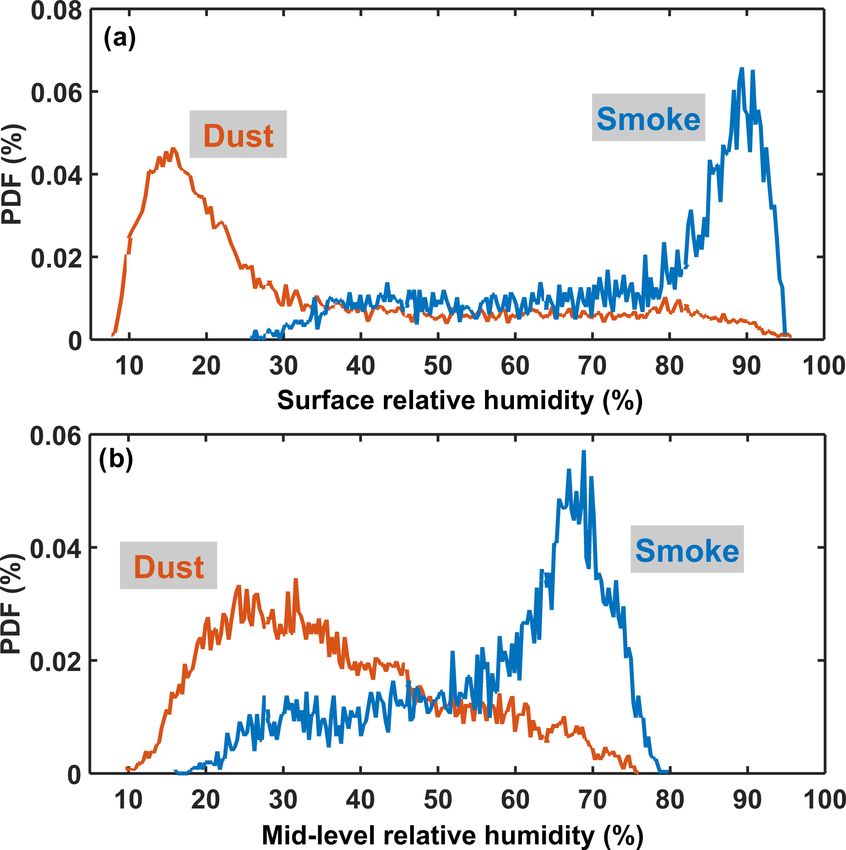
Q. Wang et al.: The climate impact of aerosols on the lightning flash rate                                                              12805

Figure 5. Violin plots of lightning dispersion showing the relationship between the lightning flash rate and six dynamic–thermodynamic
variables: (a) sea level pressure, (b) potential temperature, (c) mid-level relative humidity, (d) convective available potential energy (CAPE),
(e) vertical wind shear, and (f) 200 hPa divergence in the dust-dominant region. The five bins are equally spaced. Box plots represent the
interquartile range (the distance between the bottom and the top of the box), the median (the band inside the box), the 95 % confidence
interval (whiskers above and below the box), the maximum (the end of the whisker above), the minimum (the end of the whisker below),
and the mean (orange dot) in each bin. The plus signs represent outliers. On each side of the black line is the kernel estimation showing the
distribution shape of the data. The estimate is based on a normal kernel function and is evaluated at 100 equally spaced points. Wider sections
of the violin plot represent a high probability that members of the population will take on the given value; the skinnier sections represent a
lower probability. The equations describe the linear correlations between the lightning flash rate and the dynamic–thermodynamic variables.
Pearson correlation coefficients (R), p values, and the linear regression lines (in orange) are also shown. Data used here are from every grid
square (2.5◦ × 2.5◦ ) through the whole year from 2003 to 2013. Dynamic–thermodynamic variables are processed using 3-month running
mean filters to match with lightning data.

face, which causes the negative correlation between the light-            are presented in Fig. 9. The scatterplot and two curves (100-
ning flash rate and potential temperature. Different from the             point and 50-point running means are applied thrice to the
frontal system-dominant strong convection in the midlati-                 mean values of lightning flash rate in each 30-sample bin for
tudes, thermal convection more likely occurs in the trop-                 the dust-dominant region and the smoke-dominant region, re-
ics with a much smaller air pressure change. The frequent                 spectively) show that lightning activity is much more intense
precipitation may also help create low- and high-pressure                 in the smoke-dominant region located in the ITCZ where the
centers on the ground. These two points may lead to the                   air is hot and humid regardless of aerosol loading. By con-
positive correlation between the lightning flash rate and sea             trast, the dust-dominant region is much drier, making it dif-
level pressure. However, partial correlation analyses show                ficult to produce intense convection and lightning. The re-
that only CAPE and mid-level relative humidity are the top                sponse of the lightning flash rate to AOD is shaped like a
two factors affecting lightning activity (Fig. 8).                        boomerang (Koren et al., 2008) with a turning point around
                                                                          AOD = 0.3, and the turning point in the dust-dominant re-
4.3   Contrast in the response of the lightning flash rate                gion is slightly ahead of that in the smoke-dominant region.
      to dust and smoke aerosols                                          This is mainly because fewer aerosols are needed to produce
                                                                          small droplets likely to evaporate in the drier dust-dominant
Aerosols can modulate lightning activity by participating in              region so the optimal AOD will be lower. We deduce that
radiative and microphysical processes. Besides the finding                the CCN concentration is more closely allied with the cloud
that the peak time for lightning under polluted conditions                microphysics pertaining to lightning based on the equation
is delayed by about 1 h or so (see Fig. 2), more informative              fitted by Andreae (2009). The turning point of the CCN con-
and revealing features of the impact of aerosols on lightning             centration at a supersaturation of 0.4 % is ∼ 1600 cm−3 (see

www.atmos-chem-phys.net/18/12797/2018/                                                    Atmos. Chem. Phys., 18, 12797–12816, 2018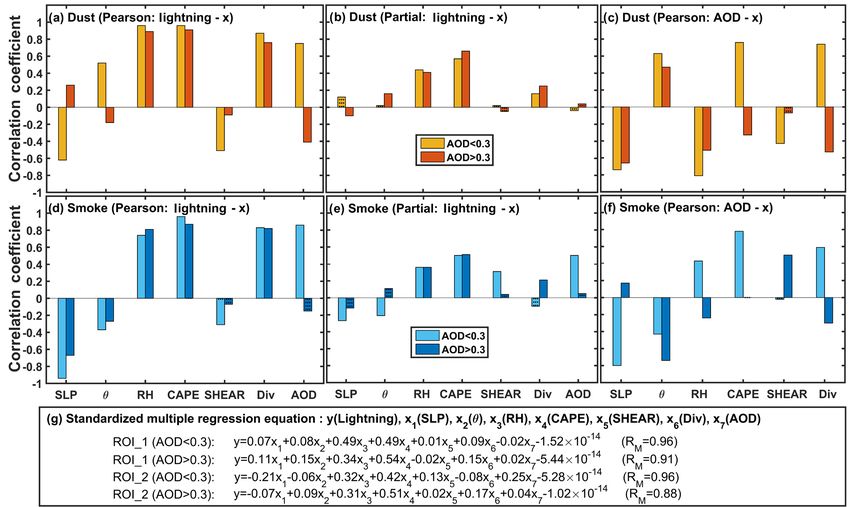
12806                                                 Q. Wang et al.: The climate impact of aerosols on the lightning flash rate

Figure 6. Same as in Fig. 5, but for the smoke-dominant region. Mean values are represented by blue dots, and linear regression lines are
shown in blue.

Figure 7. Maps of Pearson correlation coefficients between the lightning flash rate and (a) sea level pressure, (b) potential temperature,
(c) mid-level relative humidity, (d) mean convective available potential energy (CAPE), (e) vertical wind shear, and (f) 200 hPa divergence
over Africa at a spatial resolution of 2.5◦ × 2.5◦ from 2003 to 2013 (including all seasons). In each grid, 132 samples are used to calculate
the correlation coefficient. For each sample, variables are processed using 3-month smoothing averages. The black rectangles outline the
dust- and smoke-dominant regions (see Fig. 2, left panel). Plus signs denote those grids that pass the significance test of 0.05.

Atmos. Chem. Phys., 18, 12797–12816, 2018                                                 www.atmos-chem-phys.net/18/12797/2018/
Q. Wang et al.: The climate impact of aerosols on the lightning flash rate 12807
Figure 8. Same as in Fig. 7, but for the partial correlation coefficients.
Fig. S3 in the Supplement), which falls within the range of smaller under heavily polluted conditions. The aerosol-
1000–2000 cm−3 (Mansell and Ziegler, 2013) and is close microphysical-effect-induced evaporation tends to sup-
to 1200 cm−3 (Rosenfeld et al., 2008). Figure 9 is sepa- press the development of clouds and inhibits lightning
rated into three zones (green, grey, red) to show the domi- activity in combination with the aerosol radiative effect
nant roles of the aerosol microphysical effect and the aerosol which causes surface cooling and leads to an increase in
radiative effect. In the green zone, the lightning flash rate atmosphere stability. Together, the two factors are com-
increases sharply with increasing aerosol loading in both pounded, leading to a sharp decline in the lightning rate
the dust- and smoke-dominant regions. Data are clustered under heavy dusty conditions in the dust-dominant re-
around the regression lines tightly, and the lightning flash gion.
rate is strongly and positively correlated with AOD, implying
that aerosol–cloud interactions (ACI) play a dominant role 2. However, clouds in the moister region of central Africa
in lightning activity. However, as AOD approaches the turn- are less susceptible to evaporation and suppression. The
ing point (the grey zone), data become more scattered and strongly absorbing smoke aerosols also heat up the
the trend is reversed likely because of the joint impact of the aerosol layers (usually below deep convective clouds
aerosol microphysical effect and the aerosol radiative effect that produce lightning), destabilizing the atmosphere
that have opposite signs of compatible magnitude (Koren et above and thus dampening the suppression effect of the
al., 2008; Rosenfeld et al., 2008). However, other dynamic– aerosol–radiation interactions (ARI). The development
thermodynamic effects cannot be ruled out. In the red zone, of convection and associated lightning is thus sustained.
the response of the lightning flash rate to aerosol loading
is different between dust and smoke aerosols. The lightning 4.4 Environmental dependence of the aerosol effect
flash rate seems to be saturated in the smoke-dominant region
but is strongly suppressed in the dust-dominant region. This To further clarify the joint influences of dynamics, thermo-
is likely associated with the differences in both aerosol prop- dynamics, and aerosols on lightning activity, the distribu-
erties and dynamics–thermodynamics which are coupled to tion of the lightning flash rate with AOD and the top two
jointly affect lightning. The different dynamic and thermo- influential thermodynamic variables, i.e., mid-level relative
dynamic conditions between the two regions may play im- humidity and CAPE (based on the results in Figs. 5–8),
portant roles: are examined in Fig. 10. Lightning flash rates are classi-
fied into 100 discrete cells by 10 decile bins of a horizon-
1. The drier the mid-level atmosphere, the more likely tal axis variable and 10 decile bins of a vertical axis vari-
that there is evaporation of cloud droplets that are able (AOD–CAPE, AOD–mid-level relative humidity, and
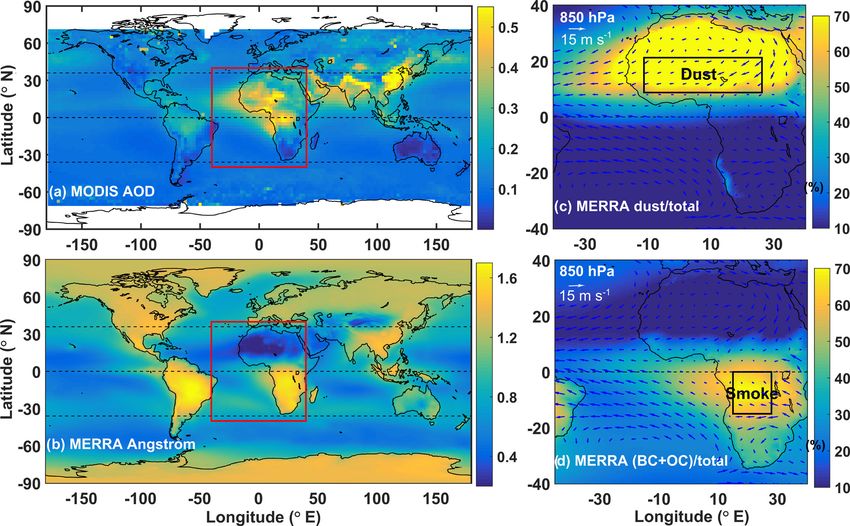
www.atmos-chem-phys.net/18/12797/2018/ Atmos. Chem. Phys., 18, 12797–12816, 201812808 Q. Wang et al.: The climate impact of aerosols on the lightning flash rate Figure 9. Lightning flash rate as a function of aerosol optical depth (AOD) in the dust- (orange points) and smoke-dominant regions (blue points). Note that all data pairs (i.e., a 3-month mean lightning rate and a 3-month mean AOD) are first ordered by AOD from small to large. Mean values of both AOD and lightning flash rate in each 10-sample bin are then calculated to reduce the uncertainty caused by the large dispersion of data. The two curves are created by applying a 100-point moving average (50-point) thrice to the mean values of lightning flash rate in each 30-sample bin for the dust-dominant (smoke-dominant) region. Note that data used here are for the entire AOD range but only shown for the range AOD ∈ (0, 1). Turning points in the boomerang shapes are around AOD = 0.3. Aerosol–cloud interactions (ACI) play a dominant role in lightning activity under relatively clean conditions (green zone). As AOD exceeds 0.3, both ACI and aerosol–radiation interaction (ARI) effects come into play with different magnitudes. For dust aerosols, ACI and ARI have the same effect of suppressing convection in the dry environment favorable for evaporating cloud droplets. The moist environment of central Africa strengthens aerosol invigoration that offsets the suppression due to ARI, leading to a nearly flat line in the grey and red zones. CAPE–mid-level relative humidity), which ensures approx- monotonically as mid-level relative humidity increases for imately equal sample sizes among the cells. The mean val- all AOD, but changes little as AOD increases in each rela- ues are calculated in each cell. Looking at the CAPE bins, tive humidity bin. This suggests that, apart from CAPE, rel- the lightning flash rate generally increases with increasing ative humidity is another restraint on lightning activity in the AOD under relatively clean conditions but decreases after the dust-dominant region. In the smoke-dominant region, large turning point near AOD = 0.3 in both regions (Fig. 10a and lightning flash rates appear in the environment of moderate d). When AOD is fixed, the lightning flash rate monotoni- mid-level relative humidity and high aerosol loading. When cally increases with CAPE. Irrespective of aerosol loading relative humidity is fixed, the response of the lightning flash and region, lightning rarely occurs when CAPE is less than rate to AOD also shows a turning point in AOD around AOD 100 J kg−1 . Half of the CAPE data in the dust-dominant re- = 0.3. Beyond this value, the lightning flash rate remains gion falls below this value. Systematically higher CAPE in high. When looking into the common roles of relative hu- the smoke-dominant region plays an important role in induc- midity and CAPE on lightning, the data distribution along ing more intense lightning activity than in the dust-dominant the diagonal shows that mid-level relative humidity is highly region. However, the lightning flash rates in the dust- and correlated with CAPE and that they affect lightning activity smoke-dominant regions respond to mid-level relative hu- in the same direction. In general, intense lightning activity midity in different ways when AOD is fixed (Fig. 10b and e). occurs under high mid-level relative humidity (> 40 %) and In the dust-dominant region, the lightning flash rate increases high CAPE (> 100 J kg−1 ) conditions in the dust-dominant Atmos. Chem. Phys., 18, 12797–12816, 2018 www.atmos-chem-phys.net/18/12797/2018/
Q. Wang et al.: The climate impact of aerosols on the lightning flash rate                                                            12809

Figure 10. Joint dependence of the lightning flash rate on CAPE, mid-level relative humidity, and aerosol optical depth in the dust- (a–c) and
smoke-dominant (d–f) regions. The bold number in each cell indicates the number of samples in the cell. The color bar denotes the number
of lightning flash rates averaged in each cell.

region. In the smoke-dominant region, high CAPE and high                 the lightning flash rate (polluted minus clean datasets) be-
mid-level relative humidity are still conducive to lightning             come larger. This suggests that under conductive conditions
production, but the data variance is larger, suggesting that the         (such as a thermal depression which is likely the main syn-
correlation involving mid-level relative humidity and CAPE               optic system introducing lightning activity in this region),
is not as high as in the dust-dominant region, and the depen-            aerosols are more likely to participate in cloud microphysics
dence on relative humidity is reduced.                                   and convective development, thus modulating lightning ac-
   As shown in Figs. 2, 9, and 10, differences in the lightning          tivity.
response to aerosols in the dust- and smoke-dominant regions
may also be attributed to different dynamic–thermodynamic                4.5    Relative roles of dynamics–thermodynamics and
conditions. To isolate the signal attributed to aerosol load-                   AOD on the lightning flash rate
ing from that attributed to environmental forcing, light-
ning flash rates are categorized according to six dynamic–
                                                                         The response of the lightning flash rate to changes in AOD
thermodynamic variables (sea level pressure, potential tem-
                                                                         may indicate an aerosol effect on lightning activity, but it can
perature, mid-level relative humidity, CAPE, wind shear,
                                                                         also be the result of dynamics or thermodynamics impacting
and divergence). Figure 11 shows the differences in light-
                                                                         aerosol loadings and the cloud microphysical process that is
ning flash rate between polluted and clean conditions (pol-
                                                                         closely associated with lightning production. To further ex-
luted minus clean datasets) as a function of these six vari-
                                                                         plore this complex process, the correlations between aerosol–
ables. In general, lightning flash rates are greater for all
                                                                         lightning rate, dynamic–thermodynamic variables–lightning
these dynamic–thermodynamic variables under polluted con-
                                                                         rate, and aerosol–dynamic–thermodynamic variables were
ditions compared with clean conditions in both the dust- and
                                                                         examined before and after the turning point (AOD = 0.3, see
smoke-dominant regions. Lightning enhancement under pol-
                                                                         Fig. 9). Results are shown in Fig. 12 (correlation coefficients
luted conditions is highly significant (> 99 %) based on the
                                                                         are listed in Table S2 in the Supplement).
Student’s t test. The differences in lightning flash rates be-
                                                                            Under clean conditions (AOD < 0.3) in the dust-dominant
tween polluted and clean conditions are smaller in the dust-
                                                                         region, all dynamic–thermodynamic variables and AOD
dominant region than in the smoke-dominant region. Note
                                                                         show good correlations with the lightning flash rate
that in the dust-dominant region, when sea level pressure de-
                                                                         (|R| > 0.5). Considering the interaction between aerosols and
creases and potential temperature increases, differences in
                                                                         dynamics–thermodynamics, the correlation coefficients be-

www.atmos-chem-phys.net/18/12797/2018/                                                   Atmos. Chem. Phys., 18, 12797–12816, 2018
12810 Q. Wang et al.: The climate impact of aerosols on the lightning flash rate Figure 11. Differences (polluted minus clean subsets of data) in lightning flash rate as a function of (a) sea level pressure, (b) potential temperature, (c) mid-level relative humidity, (d) convective available potential energy (CAPE), (e) vertical wind shear, and (f) 200 hPa divergence in the dust- (in orange) and smoke-dominant regions (in blue). Note that the top third of aerosol optical depth (AOD) values (AOD ∈ (0, 1)) is labeled as polluted, and the bottom third is labeled as clean. Vertical error bars represent 1 standard deviation. tween AOD and the six dynamic–thermodynamic variables the clean smoke-dominant region, analyses show strong pos- were calculated. Results show strong, positive correlations itive correlations between the lightning flash rate and CAPE, between AOD and mid-level relative humidity, CAPE, di- AOD, and divergence (|R| > 0.7); a strong negative corre- vergence, and potential temperature (R > 0.6) and a negative lation between the lightning flash rate and sea level pres- correlation between AOD and sea level pressure and wind sure (R = −0.94); and weak negative correlations between shear (in order of correlation strength). To investigate the the lightning flash rate and potential temperature and wind relative roles of these variables (AOD and the six dynamic– shear (|R| < 0.4). The main interplay is between AOD and sea thermodynamic variables), we carry out partial correlation level pressure and CAPE (|R| > 0.75). The partial correlation analyses between the lightning flash rate and any of its in- coefficients and the coefficients of the standardized multi- fluential factors while constraining all the others. We then ple regression equations reveal the top three factors: CAPE, establish standardized multiple regression equations where AOD, and mid-level relative humidity (R > 0.35). Different the coefficients of these equations represent the relative im- from relative humidity as the top restraint factor in the dust- portance of each factor. After the common effects are con- dominant region, here it plays a smaller role in the humid strained, the partial correlation coefficients are much smaller environment. AOD also becomes more important in this re- than the Pearson correlation coefficients, and the correlations gion. In both regions, aerosols correlate well with CAPE between the lightning flash rate and sea level pressure, po- (R > 0.75) under clean conditions (AOD < 0.3), which sug- tential temperature, and AOD are no longer significant. The gests that aerosols might participate in cloud microphysi- weak partial correlation of the AOD–lightning-flash-rate re- cal processes: more aerosols acting as CCN leads to a nar- lationship, the high Pearson correlation of the AOD–CAPE rower cloud droplet size spectrum, delays the warm-rain pro- relationship, and the high partial correlation of the CAPE– cess, and allows more liquid water to ascend higher into the lightning-flash-rate relationship all suggest that the lightning mixed-phase cloud, thus releasing more latent heat, modulat- flash rate does not respond much to dust aerosols directly, ing environmental variables (such as increasing temperature, but dust can affect convection and lightning activity through updrafts, and CAPE in and above clouds), and producing a modulation of the thermodynamic variables involved in ACI. more unstable atmosphere conducive to convective develop- From these analyses, the top three factors are found to be ment. The aerosol invigoration effect may play the key role mid-level relative humidity, CAPE, and divergence for the during this stage (AOD < 0.3). The same directions of the im- dust-dominant region under relatively clean conditions. For pacts of aerosols and thermodynamics such as CAPE on the Atmos. Chem. Phys., 18, 12797–12816, 2018 www.atmos-chem-phys.net/18/12797/2018/
You can also read