NARBreakthroughArticle A pan-cancer atlas of somatic mutations in miRNA biogenesis genes
←
→
Page content transcription
If your browser does not render page correctly, please read the page content below
Published online 6 January 2021                                                       Nucleic Acids Research, 2021, Vol. 49, No. 2 601–620
                                                                                                                 doi: 10.1093/nar/gkaa1223

NAR Breakthrough Article
A pan-cancer atlas of somatic mutations in miRNA
biogenesis genes
Paulina Galka-Marciniak, Martyna Olga Urbanek-Trzeciak, Paulina Maria Nawrocka and
Piotr Kozlowski *

Institute of Bioorganic Chemistry, Polish Academy of Sciences, Poznan, Poland

                                                                                                                                                              Downloaded from https://academic.oup.com/nar/article/49/2/601/6066635 by guest on 20 March 2021
Received July 31, 2020; Revised October 28, 2020; Editorial Decision November 30, 2020; Accepted December 04, 2020

ABSTRACT                                                                        human diseases, including cancers (summarized in (2)). It
                                                                                was suggested that miRNAs are globally downregulated in
It is a well-known and intensively studied phe-                                 cancer (3) and that upregulation or downregulation of cer-
nomenon that the levels of many miRNAs are differ-                              tain miRNAs acting either as oncogenes or tumor suppres-
entiated in cancer. miRNA biogenesis and functional                             sors may contribute to cancer development and progression
expression are complex processes orchestrated by                                (4,5). Numerous miRNA profiling studies have led to the
many proteins cumulatively called miRNA biogene-                                identification of many miRNAs specifically altered in dif-
sis proteins. To characterize cancer somatic muta-                              ferent types or subtypes of cancer. Many of these miRNAs
tions in the miRNA biogenesis genes and investigate                             play an important role in carcinogenesis and the regulation
their potential impact on the levels of miRNAs, we                              of different cancer-related processes, such as cell growth and
analyzed whole-exome sequencing datasets of over                                differentiation, cell migration, apoptosis, and epithelial-to-
10 000 cancer/normal sample pairs deposited within                              mesenchymal transition (MET). Additionally, many miR-
                                                                                NAs have been implicated as diagnostic and prognostic
the TCGA repository. We identified and characterized
                                                                                biomarkers and/or as potential therapeutic targets in can-
over 3600 somatic mutations in 29 miRNA biogenesis                              cer [e.g. (6–9)].
genes and showed that some of the genes are over-                                  miRNAs are generated through a multistage process of
mutated in specific cancers and/or have recurrent                               miRNA biogenesis tightly controlled by various proteins
hotspot mutations (e.g. SMAD4 in PAAD, COAD and                                 consecutively nursing primary miRNA transcripts (pri-
READ; DICER1 in UCEC; PRKRA in OV and LIN28B                                    miRNAs) from their transcription to their cellular function
in SKCM). We identified a list of miRNAs whose level                            within the miRNA-induced silencing complex (miRISC)
is affected by particular types of mutations in either                          (10–13). The major steps of canonical miRNA biogenesis
SMAD4, SMAD2 or DICER1 and showed that hotspot                                  include nuclear pri-miRNA processing by the microproces-
mutations in the RNase domains in DICER1 not only                               sor complex, whose core is formed by RNase DROSHA
decrease the level of 5p-miRNAs but also increase                               acting together with DGCR8 dimer and several other regu-
                                                                                latory proteins, including P68 (DDX5) and P72 (DDX17),
the level of 3p-miRNAs, including many well-known
                                                                                to release from the pri-miRNA hairpin-shaped secondary
cancer-related miRNAs. We also showed an associ-                                precursor (pre-miRNA). Next, pre-miRNA is exported to
ation of the mutations with patient survival. Eventu-                           the cytoplasm by the Exportin-5(XPO5):Ran-GTP(RAN)
ally, we created an atlas/compendium of miRNA bio-                              complex, where it is intercepted by the multiprotein miRISC
genesis alterations providing a useful resource for                             loading complex (RLC) containing the RNase DICER1,
different aspects of biomedical research.                                       which cuts off the pre-miRNA apical loop to release an
                                                                                ∼22-bp-long miRNA duplex in assistance of partner pro-
INTRODUCTION                                                                    teins such as PRKRA (PACT) or TARBP1 (TRBP). Within
                                                                                the miRISC, the miRNA duplex is unwound (supported
Since the first reports of microRNA (miRNA) contribu-                           by, i.a., GEMIN4 and MOV10) to select a miRNA guide
tions to B-cell chronic lymphocytic leukemia (1), we have                       strand (mature miRNA) that recognizes mRNA targets by
observed a substantial increase in reports describing the                       complementary interaction and silences them with the as-
role of these small regulatory RNA molecules in different

* To   whom correspondence should be addressed. Tel: +48 61 8528503; Fax: +48 61 8520532; Email: kozlowp@ibch.poznan.pl


C The Author(s) 2021. Published by Oxford University Press on behalf of Nucleic Acids Research.
This is an Open Access article distributed under the terms of the Creative Commons Attribution License (http://creativecommons.org/licenses/by/4.0/), which
permits unrestricted reuse, distribution, and reproduction in any medium, provided the original work is properly cited.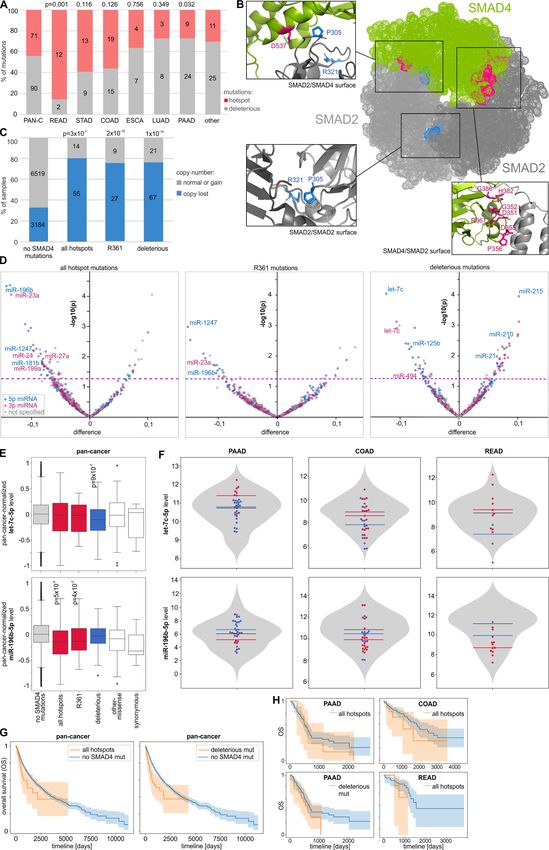
602 Nucleic Acids Research, 2021, Vol. 49, No. 2

sistance of AGO and TNRC6A (GW182) proteins by trans-            (56), as reviewed in (54,63,64). Very recently, it was also
lation repression and/or RNA deadenylation and degrada-          shown that the recurring mutation in the RNase IIIa do-
tion. Each step of this process may be further regulated by      main (RIIIa) of DICER1 occurring predominantly in uter-
additional mechanisms/proteins that either increase or de-       ine carcinoma may cause the same effect as the mutations
crease the miRNA biogenesis rate (11,14,15). For example,        in RIIIb (65). Interestingly, the occurrence of DROSHA
LIN28A/B binds to the apical loop of specific pre-miRNAs,        mutations in Wilms’ tumor coincides with the occurrence
including pre-let-7, and upon its uridylation by ZCCHC11         of mutations in SIX1 and SIX2, transcription factor genes
or ZCCHC6 TUTases leads to pre-miRNA degradation                 that are also frequently mutated in the tumor (66). An-
by DIS3L2 exonuclease (16,17). It should also be noted           other hotspot mutation commonly occurring in Wilms’ tu-
that there are alternative pathways of miRNA biogenesis,         mor is E518K in the double-stranded RNA-binding do-
such as the generation of miRNAs (mirtrons) from specific        main (dsRBD) of DGCR8 (57,58,66). It was also shown
short introns (DROSHA-independent) (18) or DICER1-               that in cancers with a high rate of microsatellite instability
independent processing of miR-451a by AGO2 (19,20).              (MSI), such as colon, gastric, and endometrial tumors, spe-
   There are currently >2600 human miRNAs deposited in           cific indel hotspots occur in TRBP and C-terminal positions

                                                                                                                                   Downloaded from https://academic.oup.com/nar/article/49/2/601/6066635 by guest on 20 March 2021
miRBase (21,22). It is speculated that miRNAs regulate the       of XPO5 (67,68); however, these mutations were not further
expression of most protein-coding genes (23,24). miRNA           analyzed in other studies. Knowledge of the germline and
levels and consequently levels of controlled genes may be af-    somatic variation in miRNA biogenesis genes is summa-
fected by various factors and processes. First, the expression   rized in (64). Additionally, SMAD4, encoding the SMAD4
of miRNA genes, such as the expression of protein-coding         transcription factor activating many genes in response to
genes, is regulated by various transcription factors, such as    transforming growth factor beta (TGFB)/bone morpho-
MYC, TP53 or SMAD4 (25–28). It was shown that many               genetic protein (BMP) signaling (69,70), is a well-known
miRNA genes are located in copy number-variable (CNV)            tumor suppressor gene that is highly mutated in many can-
regions and are frequently amplified or deleted in cancer        cers, including pancreatic and colorectal cancers (71). Al-
(29–31). miRNA genes may also be affected by aberrant            though SMAD4 was also implicated in the transcription
DNA methylation and histone acetylation, leading to the          of miRNA genes (25,72–74), the effect of SMAD4 muta-
silencing of the miRNA genes (32–38). Additionally, methy-       tions has never been tested in the context of the activation of
lation of miRNA precursors may facilitate their processing       miRNA genes. Furthermore, it was shown that some SNPs
(39) as well as impair the ability of miRNAs to downregu-        in miRNA biogenesis genes are associated with the risk of
late their targets (40). It was also shown that the occurrence   various cancers. Examples include (i) the rs3742330 (A>C)
of single nucleotide polymorphisms (SNPs) (41–44) and            SNP located in the 3 UTR of DICER1 that affects DICER1
germline or somatic mutations (45–49) may affect miRNA           mRNA stability and is associated with susceptibility and
processing (level) and the ability of miRNAs to recognize        malignancy in gastric cancer (75,76), increased survival of
their targets. Mature miRNAs may be captured and inacti-         T-cell lymphoma patients (77) and lower prostate cancer
vated by cellular miRNA sponges such as lncRNAs, circR-          aggressiveness (78); (ii) the rs78393591 SNP in DROSHA
NAs, or pseudogenes (50,51). Finally, the deficiency or im-      and rs114101502 SNP in ZCCHC11 (TUTase responsible
pairment of the components of miRNA gene transcription           for pre-miRNA uridylation and subsequent DICER1 cleav-
activators, miRNA processing machinery and the miRISC            age inhibition) associated with the risk of breast cancer
complex (for simplicity, cumulatively called miRNA bio-          (79) and (iii) the rs11786030 and rs2292779 SNPs in AGO2,
genesis genes/proteins) described in the previous paragraph      rs9606250 SNP in DGCR8, and rs1057035 SNP in DICER1
may affect miRNA levels and the effectiveness of miRNA           associated with the survival of breast cancer patients (80).
gene silencing, respectively (52,53).                            Additionally, the SNPs rs2740348 C>G and rs7813 C>T
   A body of evidence has indicated that deleterious             in GEMIN4, a gene involved in miRISC formation and
germline mutations in the DICER1 gene are responsible            miRNA-duplex unwinding, were implicated in the risk of
for DICER1 syndrome, an inherited disorder characterized         several cancers, although the results were not conclusive
by an increased frequency of various types of malignant          (81–85).
and benign tumors that occur predominantly in infants and           In this study, we took advantage of the data generated
young children, the most common and most characteris-            within The Cancer Genome Atlas (TCGA) project to an-
tic of which is pleuropulmonary blastoma (54,55). It was         alyze the somatic mutations in miRNA biogenesis genes.
shown that in cancers associated with DICER1 syndrome            As a result, in a wide panel of 33 cancer types consisting
as well as other early childhood cancers (e.g. Wilms’ tu-        of over 10 000 samples, we identified hundreds of muta-
mor), a specific pattern of somatic DICER1 second-hit mis-       tions and many recurrently mutated hotspot positions and
sense mutations occurs. All these mutations are located in       showed that some of the genes are specifically overmutated
or adjacent to metal-ion-binding residues (hotspots; pre-        in particular cancer types. We also confirmed the common
dominantly D1709 and E1813) of the RNase IIIb domain             occurrence of deleterious mutations in SMAD4 and further
(RIIIb) (54). Later, in similar types of childhood cancers,      characterized the specific hotspot mutations in SMAD4,
a similar pattern of somatic mutations was also identified       SMAD2 and DICER1, the last group of which were previ-
in the corresponding residues (E1147, D1151) of the RIIIb        ously reported mostly in childhood cancers. We followed up
in DROSHA (56–59). Functional analyses revealed that the         on the consequences of some of the mutations and showed
mutations in DICER1 lead to less effective generation of         characteristic changes in miRNA profiles resulting from
5p-miRNAs (60–62), whereas mutations in DROSHA af-               specific mutation types in DICER1, SMAD4 and SMAD2.
fect the generation of miRNAs from both pre-miRNA arms           We also showed the associations of the mutations with can-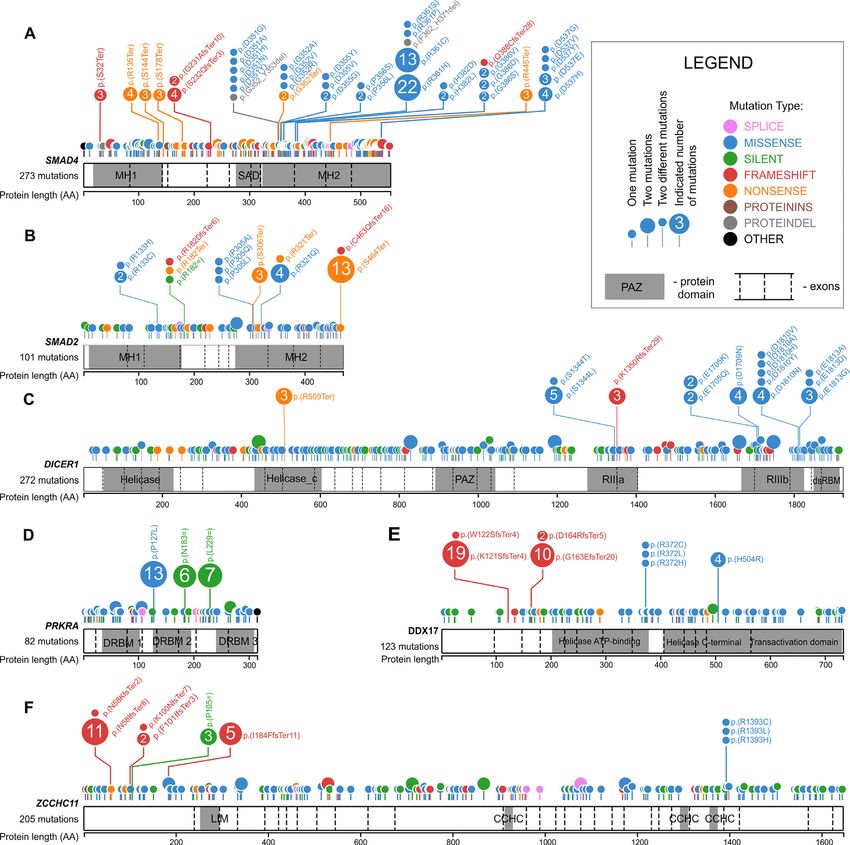
Nucleic Acids Research, 2021, Vol. 49, No. 2 603

cer characteristics and patient survival. Additionally, the       miRNA expression analysis
specific hotspot mutations in DROSHA and DGCR8 com-
                                                                  We obtained miRNA expression data via Xena UCSC
monly observed in Wilms’ tumor and other childhood can-
                                                                  as batch-effects normalized data for TCGA Pan-Cancer
cers were absent in adult cancers.
                                                                  data (note that due to normalization, some miRNA levels
                                                                  were below 0). Expression data from the set of ∼700
MATERIALS AND METHODS                                             miRNAs (annotated in miRBase) were filtered to exclude
Data resources                                                    miRNAs with undetectable signals (level = 0) in more
                                                                  than 30% of pan-cancer samples (or 10% when the analysis
We used molecular and clinical data (Level 2) for 33 can-         was performed for specific cancers). As high-confidence
cer types generated and deposited in the TCGA repository          miRNAs, we considered those deposited in MirGeneDB
(http://cancergenome.nih.gov). These data included the re-        v2.0 which were defined based on criteria that include
sults of somatic mutation calls in whole-exome sequencing         careful annotation of the mature versus passenger miRNA
(WES) datasets of 10 369 samples (later limited to 10 255)        strands and evaluation of evolutionary hierarchy (90,91).
analyzed against matched normal (noncancer) samples with

                                                                                                                                   Downloaded from https://academic.oup.com/nar/article/49/2/601/6066635 by guest on 20 March 2021
                                                                  Next, to enable pan-cancer comparisons, we normalized
the use of the standard TCGA pipeline. Hypermutated sam-          the variation (range of −1 to 1) and median (median
ples were defined as samples with >10 000 mutations in            = 0) of miRNA levels to be equal in each cancer type.
the whole exome. As in general, the TCGA datasets include         The normalized miRNA level changes (in pan-cancer)
only one sample from each cancer specimen, in the analy-          were calculated/expressed as differences, and the changes
sis, we did not consider cancer stromal heterogeneity. Copy       in raw (non-pan-cancer-normalized) miRNA levels (in
number data were obtained via Xena UCSC as a ‘gene-level          individual cancers) were calculated/expressed as log2 fold
copy number (gistic2 thresholded)’ dataset of the TCGA            changes. For the differential analysis of miRNA levels,
Pan-Cancer (PANCAN) cohort. The crystal structure of              normalized against the level of miR-451a (see Results) in
the phosphorylated SMAD2/SMAD4 heterotrimeric com-                UCEC, we additionally used miRNA level data expressed
plex (PDB code: 1U7V) (86) was visualized with the use of         only as reads per million miRNA mapped (RPM) values
PyMOL (Schrödinger, LLC, New York, NY, USA).                     (non-batch effects normalized), downloaded from Fire-
                                                                  Browse     (illuminahiseq mirnaseq-miR gene expression).
Data processing                                                   The analysis of isomiRs was performed with the use of
                                                                  the miRNA isoform dataset (illuminahiseq mirnaseq-
We analyzed somatic mutations in 29 miRNA biogenesis
                                                                  miR isoform expression) from FireBrowse.
genes (coding exons were extended by 2 nt on each side
to enable identification of definitive splicing mutations).
The genomic coordinates of the analyzed genes/regions are         Statistics
shown in Supplementary Table S1. From the WES data gen-
                                                                  Unless stated otherwise, all statistical analyses were per-
erated with the use of four different algorithms (MuSE,
                                                                  formed with statistical functions in the Python module
MuTect2, VarScan2 and SomaticSniper), we extracted so-
                                                                  scipy.stats. Particular statistical tests are indicated in the
matic mutation calls with PASS annotation. The extraction
                                                                  text, and if not stated otherwise, P < 0.05 was considered
was performed as described in (45) with a set of in-house
                                                                  significant. If necessary, P-values were corrected for multi-
Python scripts available at (https://github.com/martynaut/
                                                                  ple tests. Mutation density was calculated as the number of
mirnaome somatic mutations). Briefly, the lists of somatic
                                                                  detected mutations divided by the length of analyzed genes
mutations detected by different algorithms were merged
                                                                  (total length of all coding exons). For patient survival anal-
such that variants detected by more than one algorithm
                                                                  yses, we used a log-rank test (from the lifelines v0.24.8 li-
were not multiplicated. To further increase the reliability
                                                                  brary (Davidson-Pilon C et al., https://zenodo.org/record/
of the identified somatic mutations (and avoid the identi-
                                                                  3833188#.X8fbMs1KhPY)). To determine the direction of
fication of uncertain mutations), we additionally removed
                                                                  mutation effects on survival, we used Cox’s proportional
those that did not fulfill the following criteria: (i) at least
                                                                  hazard model. Survival plots were created using Kaplan-
two alternative allele-supporting reads in a tumor sample
                                                                  MeierFitter from the lifelines library. A comparison of the
(if no alternative allele-supporting read was detected in the
                                                                  occurrence of mutations in miRNA biogenesis genes among
corresponding normal sample); (ii) at least a 5× higher fre-
                                                                  cancer stages (with correction for cancer type) was per-
quency of alternative allele-supporting reads in the tumor
                                                                  formed with the Cochran–Mantel–Haenszel test for pan-
sample than in the corresponding normal sample; (iii) a so-
                                                                  cancer and Fisher’s exact test for specific cancers.
matic score parameter (SSC) > 30 (for VarScan2 and So-
maticSniper) and (iv) a base quality (BQ) parameter for al-
ternative allele-supporting reads in the tumor sample >20         RESULTS
(for MuSE and MuTect2). All mutations were designated
                                                                  Distribution of somatic mutations in miRNA biogenesis genes
according to HGVS nomenclature at the transcript and pro-
                                                                  across different cancer types
tein levels, and the effects of mutations were predicted us-
ing the Ensembl Variant Effect Predictor (VEP) tool (87).         For analysis, we selected 29 miRNA biogenesis genes en-
For visualization of mutations on the gene maps, we used          coding proteins playing roles in (i) the transcription of pri-
ProteinPaint from St. Jude Children’s Research Hospital –         mary miRNA precursors (pri-miRNAs), (ii) pri-miRNA to
PeCan Data Portal (88). The protein domains visualized on         pre-miRNA processing in the nucleus, (iii) the export of pre-
gene maps were positioned according to UniProt (89)               miRNA from the nucleus to the cytoplasm, (iv) pre-miRNA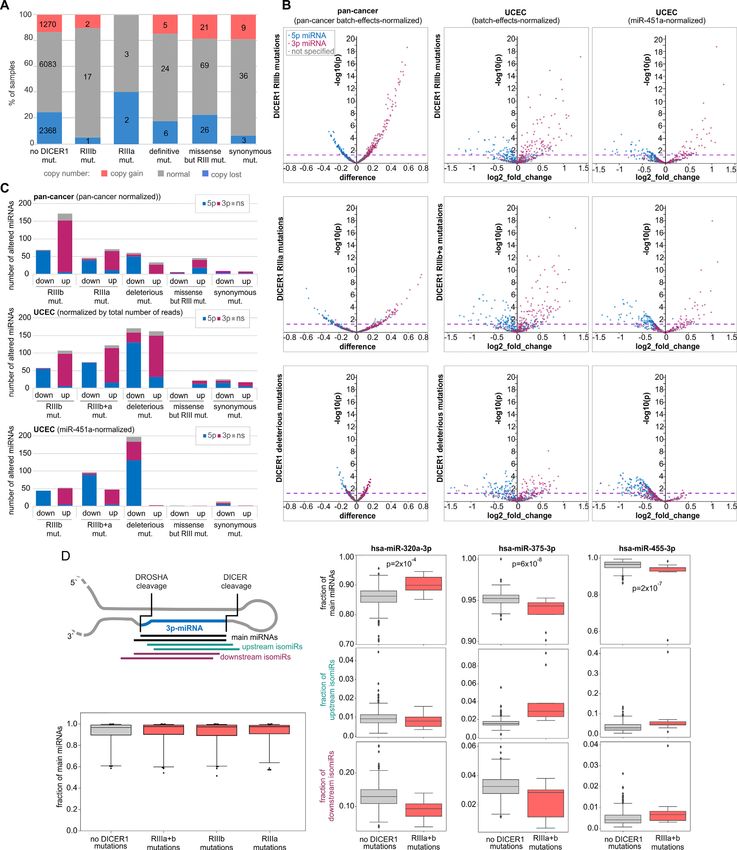
604 Nucleic Acids Research, 2021, Vol. 49, No. 2

Table 1. List and characteristics of the selected miRNA biogenesis genes
Gene/protein ID (alias)                                                                    miRNA-related function
Nuclear steps of miRNA biogenesis
SMAD4                                                  Activates miRNA precursor transcription upon TGFB/BMP activation (74,132,136)
FUS                                                    Facilitates cotranscriptional DROSHA recruitment to pri-miRNAs; shown to bind a terminal
                                                       loop of specific neuronal pri-miRNAs and to enhance their processing (141)
SRSF3 (SRP20)                                          Enhances mammalian pri-miRNA processing upon binding to the CNNC motif in the 3p
                                                       flanking sequence (142)
DROSHA                                                 RNase III; catalyzes pri-miRNA to pre-miRNA for processing/cleavage (11,143,144)
DGCR8                                                  Cofactor of DROSHA; coordinates the recognition of pri-miRNA at the dsRNA-ssRNA
                                                       junction; functions as a molecular anchor and direct DROSHA to cleave pri-miRNA ∼11 bp
                                                       before the junction (11,145)

                                                                                                                                                      Downloaded from https://academic.oup.com/nar/article/49/2/601/6066635 by guest on 20 March 2021
DDX5 (P68)                                             Plays a role in recognition/binding of pri-miRNAs by the DROSHA complex; recruits
                                                       DROSHA/DGCR8 to pri-miRNA (146,147)
DDX17 (P72)                                            Plays a role in recognition/binding of pri-miRNAs by the DROSHA complex (146,148)
GSK3B                                                  Facilitates pri-miRNA binding by DROSHA and enhances DROSHA association with
                                                       cofactors DGCR8 and P72 (149); DROSHA phosphorylation/stabilization (150)
SMAD2                                                  Accelerates pri-miRNA processing by DROSHA; in complex with SMAD4 activates miRNA
                                                       precursor transcription upon TGFB/BMP signaling (72,136,137)
Export to cytoplasm
XPO5 (EXP5)                                            Plays a role in the nuclear export of pre-miRNA to the cytoplasm (151,152); facilitates the
                                                       nuclear cleavage of clustered pri-miRNAs (153)
RAN                                                    Interacts with XPO5; plays a role in the export of pre-miRNA to the cytoplasm (151)
Cytoplasmic steps of miRNA biogenesis
DICER1 (DICER)                                         RNase III; catalyzes pre-miRNA to miRNA-duplex processing by cutting off the pre-miRNA
                                                       terminal loop (11,154–156)
TARBP2 (TRBP)                                          Coordinates pre-miRNA recognition by DICER1 and the precision of DICER1 cleavage
                                                       (157,158)
PRKRA (PACT)                                           Coordinates pre-miRNA cleavage by DICER1 and assures the precision of the cleavage; plays a
                                                       role in miRISC assembly and thus participates in miRNA stabilization and accumulation in the
                                                       cell (158,159)
ADAR                                                   Double-stranded RNA-specific adenosine deaminase; plays a role in pri- and pre-miRNA stem
                                                       editing (A to I), which makes miRNA precursors resistant to DICER1 cleavage (160)
KHSRP (FUBP2, KSRP)                                    Binds to the terminal loop sequence of a subset of miRNA precursors, promoting their
                                                       maturation (161)
LIN28A and LIN28B                                      Bind to the terminal loops of specific pre-miRNAs (including pre-let-7 and pre-miR-9) and,
                                                       upon recruitment of ZCCHC11 or ZCCHC6 that induces pre-miRNA uridylation, inhibit
                                                       DICER1 processing (17,162,163)
ZCCHC11 (TUT4) and                                     Play a role in pre-miRNA uridylation and thus inhibit DICER1 processing (17,164)
ZCCHC6 (TUT7)
DIS3L2                                                 Exoribonuclease; targets the uridylated let-7 precursors (16)
miRNA functioning
AGO1, AGO2, AGO3, and                                  Play a role in miRISC formation/loading (summarized in (165,166)); catalytically active AGO2
AGO4                                                   functions as an endonuclease upon complementary mRNA:miRNA interaction (167)
GEMIN4                                                 Binds to the miRNA guide strand and facilitates the formation of a miRISC by unwinding the
                                                       miRNA duplex (83,168)
MOV10                                                  Upon interaction with the miRNA-loaded AGO-protein complexes, plays a role in mRNA
                                                       degradation; present in P-bodies (169,170)
FMR1                                                   Interacts with DICER1 and AGO1 during mRNA degradation (171); controls DROSHA
                                                       expression (172)
TNRC6A (GW182)                                         Component of P-bodies; plays a role in mRNA degradation upon interaction with Argonaute
                                                       proteins (173,174)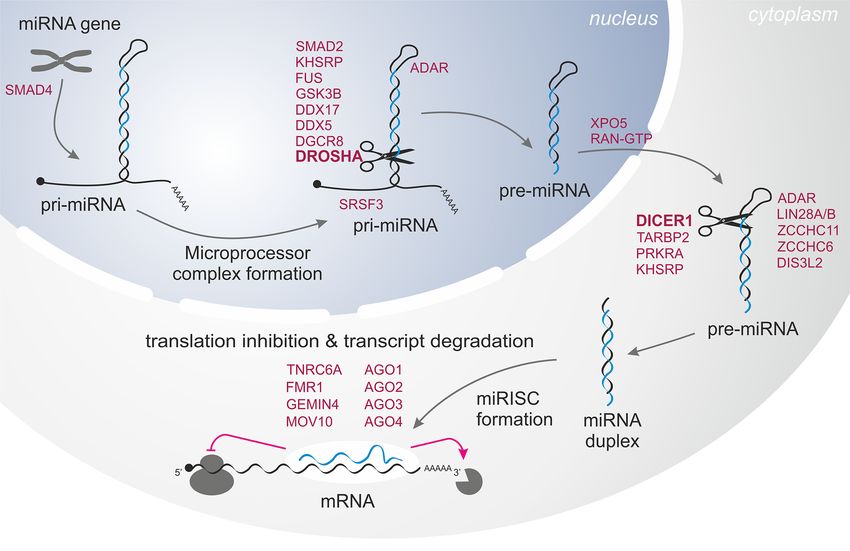
Nucleic Acids Research, 2021, Vol. 49, No. 2 605
processing and miRNA maturation in the cytoplasm and observations that over- and undermutated regions generally
(v) miRNA:target recognition/interaction and regulation overlap between different cancer types (92) and suggests the
of downstream silencing effects (Table 1 and Figure 1). nonrandom occurrence and potentially functional nature of
To identify somatic mutations in the miRNA biogene- the overmutations. To identify overmutated genes, we sta-
sis genes, we took advantage of WES datasets of 10 369 tistically compared the frequency of mutations (overmuta-
paired tumor/normal samples generated within the TCGA tion) in particular genes (versus all other genes) in partic-
project. The collected samples cover 33 different cancer ular cancers with corresponding frequencies in pan-cancer
types (analyzed together as a pan-cancer cohort) (Supple- (Figure 2C, Supplementary Table S4). The most striking
mentary Table S2). The list of all cancer types (full names example of an overmutated gene is SMAD4 overmutated
and abbreviations) is shown in Figure 2 (to avoid confu- in PAAD (22% of samples), READ (16%), COAD (14%),
sion, we will use the abbreviations for the TCGA sample STAD (9%) and ESCA (8%). Other interesting examples in-
sets but not generally for particular types of cancer; in the cluded AGO4, LIN28A and SMAD2 overmutated in BLCA
latter case, we will use full cancer-type names). Applying the (an otherwise extremely low-mutation cancer with no mu-
rigorous criteria described in the Materials and Methods, tations in other genes); LIN28B overmutated in SKCM;
Downloaded from https://academic.oup.com/nar/article/49/2/601/6066635 by guest on 20 March 2021
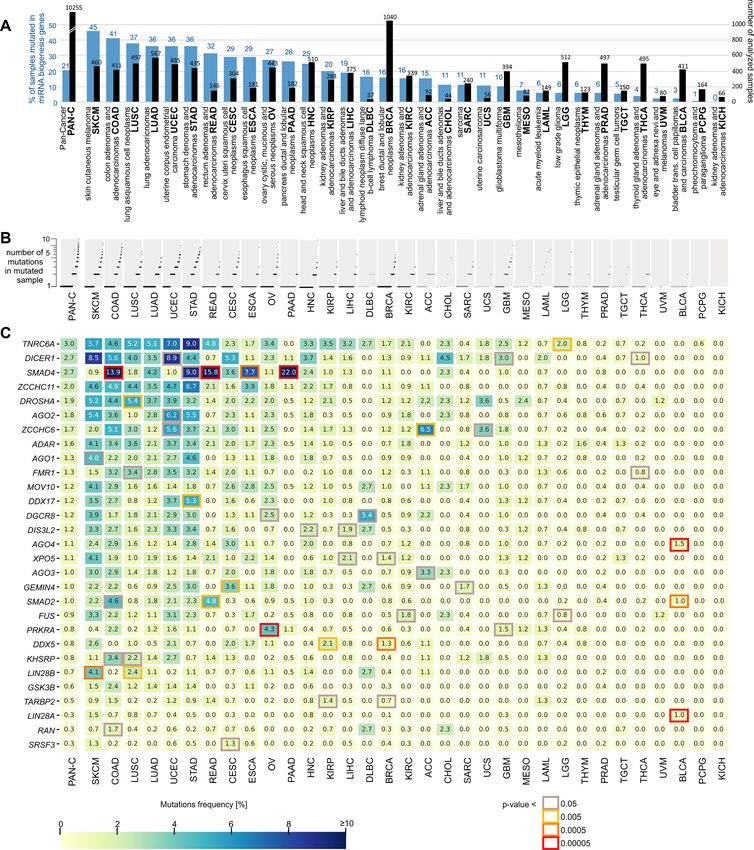
we identified a total of 5483 mutations in the pan-cancer PRKRA overmutated in OV; and DDX5 overmutated in
cohort. However, a substantial fraction (n = 1834, ∼30%) BRCA and KIRP. There are also other genes with increased
of the mutations were identified in a relatively small num- mutation frequency, e.g. TNRC6A in STAD and DICER1
ber (n = 114, ∼1%) of hypermutated samples. As shown in in SKCM and UCEC (nominal P > 0.005), but these over-
Supplementary Figure S1, the number of mutations in hy- mutations are only nominally significant. Consistent with
permutated samples strongly depends on the general bur- the above findings, the overmutated genes are outliers in
den of mutations in these samples, implying enrichment terms of the correlation of mutation frequencies in particu-
of random, most likely passenger mutations in the hyper- lar genes between particular cancer types and the remaining
mutated samples. Therefore, to reduce the proportion of pan-cancer (Supplementary Figure S2).
confounding mutations, we removed hypermutated sam-
ples from subsequent analyses. The removed, hypermutated
Distribution of mutations in the miRNA biogenesis
samples originated mostly from SKCM, UCEC and COAD
genes––identification of hotspot mutations
(Supplementary Figure S1).
After removing the hypermutated samples, we continued To illustrate the mutation distribution along the protein se-
analysis on 10 255 samples with 3649 mutations, including quences, all the mutations were visualized in lollipop plots
2196 (60%) missense mutations, 774 (21%) synonymous mu- (Figure 3 and Supplementary Figure S3). As shown in
tations and 625 (17%) definitive deleterious mutations, con- the plots, although most of the mutations are quite evenly
sisting of 341 frameshift, 222 nonsense and 62 splice-site distributed along the genes, there are also some hotspot
mutations (Supplementary Table S3). Other types of mu- regions/mutations suggesting the functional nature of these
tations, such as start or stop codon mutations or complex changes. The most striking example is a cluster of eight
mutations, were also present in small fractions. At least one hotspots of recurrently mutated amino acid (AA) residues
mutation was detected in 2104 (21%) samples, including nu- (i.e. D351, G352, D355, P356, R361, H382, G386 and
merous samples with more than one mutation (Figure 2A D537) occurring in the MH2 domain of SMAD4 (Fig-
and B). The frequency of mutated samples differed substan- ure 3A). The most prominent hotspot position is R361,
tially among cancer types, ranging from 45% (SKCM) to 0% which by itself acquired 37 missense mutations, account-
(KICH) (Figure 2A, Supplementary Table S3), and roughly ing for 23% of all SMAD4 missense mutations. There are
corresponded to the mutational burden in particular cancer also two recurrently mutated AA residues (i.e. P305 and
types. R321) in the MH2 domain of SMAD2 (Figure 3B). The
hotspot mutations in the MH2 domains (both in SMAD4
and SMAD2) likely affect SMAD4:SMAD2 heterotrimer
Frequency of somatic mutations in miRNA biogenesis genes
formation. Additionally, there are two recurrent protein-
across 33 cancers
truncating nonsense mutations in the MH2 domain of
As shown in Figure 2C, TNRC6A, DICER1 and SMAD4 SMAD2, i.e. p.S306Ter and p.S464Ter, the latter of which
are among the most highly mutated genes (∼3% of sam- occurs 13 times is localized in the last exon of SMAD2 and
ples in pan-cancer), and the least mutated genes (∼0.3%) are likely truncates the last five AAs of the protein just before
LIN28A, RAN and SRSF3. Although there is some corre- two phosphorylation sites (S465 and S467) critical for acti-
lation between the frequency of mutations in the particular vation of SMAD2 upon TGFB/BMP signaling (93).
genes and the length of their protein-coding sequences (R2 Two other clusters of missense hotspot mutations are lo-
= 0.62), the overall mutation frequency cannot be simply cated in metal ion-binding residues of the RIIIa (S1344)
explained by the length of the genes. Additionally, none of and RIIIb (E1705, D1709, D1810 and E1813) domains of
the genes are well-known highly mutated genes or are lo- DICER1 (Figure 3C). These hotspots were previously de-
cated in late-replicating regions known to be overmutated tected and functionally characterized in various pediatric
in cancer (92). cancers (54,64), thyroid adenomas (94), and the TCGA co-
Although there is a general correlation of mutation fre- hort, mostly in UCEC samples (65).
quency in particular genes between cancers, there are also It is also worth noting the hotspot missense mutation,
apparent striking exceptions of genes specifically overmu- i.e. p.P127L in the DRBM 2 domain of PRKRA (Figure
tated in particular cancers (Figure 2C). This contrasts with 3D), occurring 13 times in OV, COAD, GBM and LUAD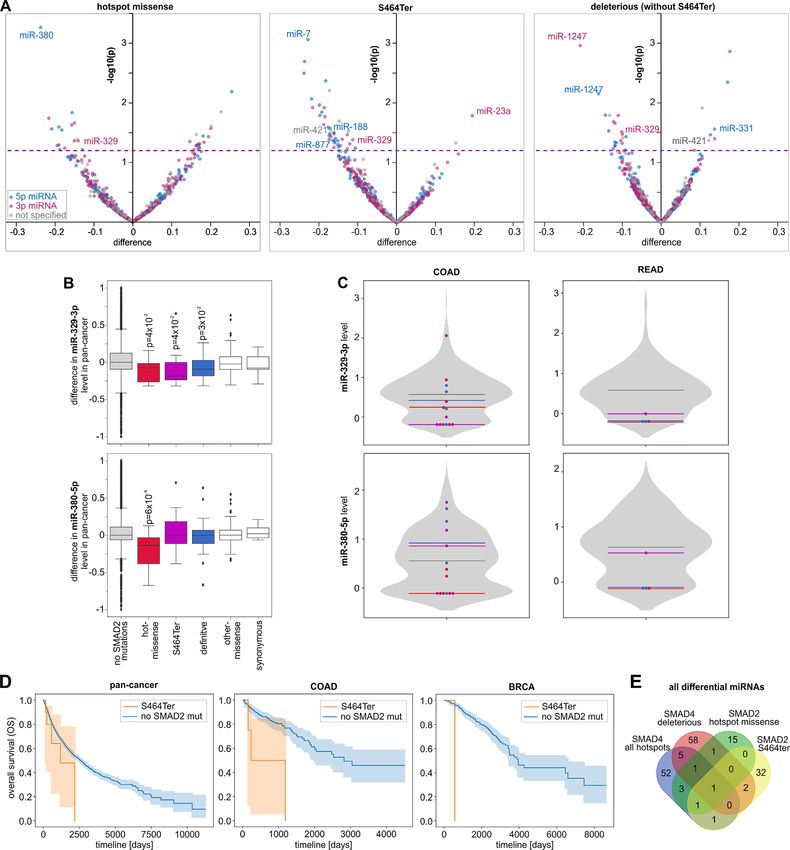
606 Nucleic Acids Research, 2021, Vol. 49, No. 2

                                                                                                                                                    Downloaded from https://academic.oup.com/nar/article/49/2/601/6066635 by guest on 20 March 2021
Figure 1. Schematic depiction of miRNA biogenesis and functions of the miRNA biogenesis proteins/genes involved in the subsequent steps indicated
and described in Table 1.

(6, 3, 3 and 1 mutations, respectively). As the DRBM 2 do-                    In the next step, we looked for hotspot mutations previ-
main plays a role in interaction with other proteins (e.g. pro-            ously observed in the miRNA biogenesis genes, i.e. (i) E969
tein kinase R, PKR), the mutation may affect the interac-                  and E993 in RIIIa and E1147, D1151, Q1187 and E1222 in
tions. Consistently with the frequent occurrence of the mu-                RIIIb in DROSHA, (ii) p.E518K in the dsRDB1 domain in
tation in OV, the changes in the PRKRA level were recently                 DGCR8 and (iii) p.R440Ter in XPO5 observed in different
linked with the resistance of mucinous ovarian cancer to the               pediatric cancers, especially in Wilms’ tumor (56,57,59). Of
miR-515-3p dependent platinum-based (oxaliplatin) treat-                   these mutations, we found p.E518K in DGCR8 occurring in
ment (95). Although the mutation overlaps with the SNP                     two of 495 (0.4%) cases of THCA, p.R440Ter in XPO5 in
(rs75862065), the fact that it occurs predominantly in OV,                 one case of UCEC and one case of SKCM, and p.D1151E
which is otherwise a moderately mutated cancer, combined                   in DROSHA in one case of COAD (Supplementary Figure
with the overall overmutation in PRKRA, argues against                     S3). Of the indel hotspots in XPO5 and TARBP2 detected
the accidental occurrences of the mutation as artifacts of the             previously in colon, gastric, and endometrial tumors with
mutation calling process. There are also two hotspot syn-                  MSI (67,68), we detected only two cases of the C insertion
onymous mutations in FUS (p.G222= and p.G227=) (Sup-                       in the poly-C track (p.M145HfsTer13) in TARBP2: one in
plementary Figure S3). A role of such hotspots cannot be                   UCEC and one in STAD (both cancers often characterized
excluded (96); however, we did not investigate them further                by MSI).
in this study. Similarly, recurring missense mutations in the
other genes may be important for specific cancers; however,
they occur much less frequently.                                           Functional consequences of SMAD4 and SMAD2 mutations
   There are also some hotspot indel mutations, e.g.,                      From the visual investigation (Figure 2C and Figure 3A),
p.N58IfsTer8 in ZCCHC11, p.Y948MfsTer16 in                                 it is apparent that SMAD4 is the gene with the highest
ZCCHC6, p.K121SfsTer8 and p.G163EfsTer20 in DDX17,                         density of mutations (273 mutations, 160 mut/kbp) and
p.W804GfsTer99 and p.R1183GfsTer7 in TNRC6A,                               the largest proportion of deleterious mutations (33%). As
p.L17CfsTer99 in AGO1, and pA603RfsTer71 in AGO2                           mentioned in the previous paragraph, there are also eight
(Figure 3 and Supplementary Figure S3). However, it must                   hotspots of missense mutations, seven of which are lo-
be noted that the exact position of indel hotspot mutations                cated in a relatively small region (D351 to G386) of the
may not be necessarily driven by cancer advantage but by                   MH2 domain, playing a role in heterotrimer formation with
sequence properties (e.g., the presence of short tandem                    other receptor-dependent SMAD proteins (R-SMADs, e.g.
repeat motifs). In fact, many indel mutations and some of                  SMAD2) to mediate the TGFB/BMP transcriptional re-
the indel hotspots occur at sequence motifs often mutated                  sponse (97,98). The collection of a relatively large number
as a result of MSI. Additionally, as most indels in coding                 of mutations associated with different cancer types reveals
sequences result in frameshifts and premature termination                  that the proportion of hotspot and deleterious mutations [in
of translation, triggering nonsense-mediated mRNA decay                    pan-cancer, 71 (44%) versus 91 (56%), respectively] differs
(NMD) and leading to the complete loss of mRNA,                            substantially between cancers (Figure 4A) and is the high-
the exact position of indel hotspots may not be that                       est in READ (86% versus 14%; P = 0.001) and the lowest
important.                                                                 in PAAD (27% versus 73%; P = 0.032). This may suggest a
Nucleic Acids Research, 2021, Vol. 49, No. 2 607
Downloaded from https://academic.oup.com/nar/article/49/2/601/6066635 by guest on 20 March 2021
Figure 2. Mutation frequency in miRNA biogenesis genes across the analyzed cancer types. (A) The total number of samples (black bars) and percentage
of samples with mutations (blue bars) in the panel of miRNA biogenesis genes. (B) The proportion of samples with different numbers of mutations.
Each sample is shown as a dot (only samples with at least one mutation are shown). Due to the large number of samples with a particular number of
mutations, dots overlap with each other. (C) Heatmap showing the frequency [%] of mutations within each of the miRNA biogenesis genes (y-axis) in
different cancer types (x-axis). The genes are ordered by the frequency of mutations in pan-cancer (first column). The genes significantly overmutated in
particular cancer types are marked with a color frame indicating the nominal P-value (Fisher’s exact test; the P-value scale is indicated under the heatmap).
A P-value608 Nucleic Acids Research, 2021, Vol. 49, No. 2
Downloaded from https://academic.oup.com/nar/article/49/2/601/6066635 by guest on 20 March 2021
Figure 3. Distribution of the identified mutations in the miRNA biogenesis genes. (A–F) depict SMAD4, SMAD2, DICER1, PRKRA, DOX17 and ZC-
CHC11, respectively. The remaining miRNA biogenesis genes are shown in Supplementary Figure S3. Mutations are visualized in the form of lollipop plots
along the gene coding sequences, with the exon structure and protein functional domains indicated. The size of a mutation symbol (circle) is proportional
to the number of mutations, and the color indicates the type of mutation (as shown in the legend). All mutations were annotated according to HGVS
nomenclature, and the effect of the mutations at the protein level was denoted with the VEP tool (Ensembl).
different role of SMAD4 in different cancers and different are located on the surfaces of the SMAD4:SMAD2 inter-
effects of these two types of mutations. Most of the hotspots action, which is consistent with the notion that hotspot
(five of eight hotspots, 83% of all hotspot mutations) coin- mutations prevent SMAD complex formation and thus
cide with charged (basic or acidic) AAs, affecting the elec- avert transcription of SMAD-controlled genes in response
trostatic properties of MH2 important for interaction with to TGFB/BMP signaling. As in SMAD4, the SMAD2
R-SMADs (86). To visualize the location of the hotspot AA hotspot residues localize at the SMAD4:SMAD2 interac-
residues, we marked them on a crystal structure of the het- tion surfaces (Figure 4B and Supplementary S4).
erotrimeric SMAD4:(SMAD2)2 complex (86). As shown The copy number analysis of SMAD4 showed that
in Figure 4B and Supplementary S4, all hotspot residues SMAD4 deletions are significantly more frequent in sam-Nucleic Acids Research, 2021, Vol. 49, No. 2 609
Downloaded from https://academic.oup.com/nar/article/49/2/601/6066635 by guest on 20 March 2021
Figure 4. Characteristics of SMAD4 mutations. (A) The proportions of hotspot and deleterious mutations (y-axis) in different cancer types (x-axis). (B)
Localization of hotspot AA residues in the SMAD4:(SMAD2)2 heterotrimeric complex in SMAD2/SMAD4, SMAD4/SMAD2 and SMAD2/SMAD2610 Nucleic Acids Research, 2021, Vol. 49, No. 2
ples with SMAD4 mutations than in samples without such tent and have to be interpreted with caution. Nonetheless,
mutations, indicating frequent loss of the second allele among the miRNAs downregulated by either hotspot or
[loss of heterozygosity (LOH) effect] in samples with both deleterious SMAD4 mutations are many miRNAs demon-
hotspot and deleterious mutations (Figure 4C). SMAD4 strated before to be activated by TGFB/SMAD signaling.
mutations were previously shown to affect the expres- It includes miR-23a-3p, miR-27a and miR-24 constituting
sion of many genes. Although it was proposed that the a miRNA cluster that is the first and most well-studied
TGFB/SMAD pathway also controls the expression of group of miRNAs regulated by SMAD4 (74), miR-181b-
miRNAs (25,27,28,73,99,100), the effect of the mutations 5p (106), 199a-3p (73) and miR-494-3p (107). To iden-
on miRNA levels has never been tested. To do so at the tify pathways/processes enriched in the genes regulated by
pan-cancer scale, we took into account only 522 miRNAs the downregulated miRNAs, we performed KEGG path-
whose level was >0 in at least 70% of tested TCGA samples. way enrichment analysis with miRPath v3.0. The analysis
We normalized miRNA levels to make the median (equal to showed that miRNAs downregulated both by the hotspot
0) and variance of these levels comparable between cancers. and deleterious SMAD4 mutations are associated (adjusted
As shown in Figure 4D, there is an excess of downregulated P < 0.01) with similar cancer-related processes, including
Downloaded from https://academic.oup.com/nar/article/49/2/601/6066635 by guest on 20 March 2021
miRNAs in samples with hotspot mutations (e.g. at the level ‘Pathways in cancer’, ‘ErbB signaling pathway’, ‘Glioma’,
of P-value < 0.05, 78% and 22% of miRNAs are downreg- and ‘Proteoglycans in cancer’ (Supplementary Table S6). It
ulated and upregulated, respectively), which is consistent is worth noting that among the enriched pathways is also
with the expected impairment of SMAD complex forma- the ‘TGF-beta signaling pathway’ regulated by 32 of the 49
tion and transcription factor activity. A similar effect was (65%, P = 0.0002) and 20 of the 29 (69%; P = 0.00005) miR-
observed when the analysis was performed only for R361, NAs downregulated by the hotspot and deleterious muta-
the most frequently mutated hotspot residue (Figure 4D), tions, respectively.
and when the analysis was limited to the high-confidence A comparison of SMAD4 mutations with clinical can-
miRNAs (annotated in MirGeneDB; Supplementary Fig- cer data did not show an association of mutations with tu-
ure S5A), which further strengthens the reliability of the mor staging but showed an association with decreased over-
observation. Among the downregulated miRNAs (Supple- all survival (OS) at the pan-cancer level (log-rank test: P =
mentary Table S5), there are many miRNAs with well- 0.049 and P = 0.0006 for hotspot and deleterious mutations,
documented cancer-related functions, for example, the re- respectively) (Figure 4G). As the analyses performed at the
cently discovered suppressormiRs miR-23a-3p (reviewed pan-cancer level may be affected by the unequal distribution
in (101)), miR-196b-5p (102,103), and miR-1247-5p (104). of mutations among cancer types, we repeated the survival
Noteworthy, such an effect of excessive miRNA downreg- analysis with the most frequently mutated individual can-
ulation is not visible for deleterious mutations (Figure 4D cers. Although the analyses of individual cancer types were
and Supplementary Figure S5A). Among the most signif- of very limited statistical power because of a low number of
icantly downregulated or upregulated miRNAs in samples mutations, some cancer types also showed trends toward de-
with deleterious mutations are let-7c-5p and miR-125b-5p creased survival of patients with the mutations, i.e. COAD
or miR-215-5p, miR-21-5p and miR-210-5p, respectively, and READ (Figure 4H).
all well-known cancer-related miRNAs (e.g. (105)). The fre- Although SMAD2, with a total of 101 mutations, in-
quent observation of pairs of 5p and 3p-miRNAs (e.g. let- cluding 35 deleterious mutations, is much less densely mu-
7c-5p and let-7c-3p) and groups of miRNAs generated from tated (70 mut/kb) than SMAD4 (Figure 3B), it also con-
miRNA clusters (e.g. miR-99a/let-7c or miR-1/133a clus- tains recurrently mutated hotspot AA residues in the MH2
ter) among the consistently altered miRNAs in samples domain. The hotspots include two AA residues, i.e. P305
with both hotspot and deleterious mutations indicates that and R321 mutated 3 and 4 times, respectively, and the non-
at least some of the miRNA alterations result from aberra- sense mutation p.S464Ter truncating the protein by five
tions at the transcriptional level. As shown in Figure 4E and AAs, which is the most common SMAD2 mutation (13 oc-
F, the levels of let-7c-5p and miR-196-5p, which are exam- currences in cancers such as COAD, STAD, and BRCA).
ples of miRNAs most significantly altered in pan-cancer, of- As in SMAD4, the SMAD2 hotspot residues localize at the
ten show similar alterations in the most commonly mutated SMAD4:SMAD2 interaction surfaces (Figure 4B and Sup-
cancers, i.e. PAAD, COAD and READ, although it must plementary Figure S4).
be noted that due to the very limited number of mutations, We separately analyzed miRNA level profiles in samples
the results in individual cancers are not perfectly consis- with hotspot missense mutations (N = 7), the p.S464Ter
←−−−−−−−−−−−−−−−−−−−−−−−−−−−−−−−−−−−−−−−−−−−−−−−−−−−−−−−−−−−−−−−−−−−−−−−−−−−−−−−−−−−−−−−−−−−
surfaces (as indicated in the figure). Mutated positions in SMAD4 are indicated in pink, whereas SMAD2 mutations are indicated in blue. (C) The pro-
portion of copy number alterations of SMAD4 (y-axis) in samples with different types of SMAD4 mutations. (D) Volcano plots depicting miRNA level
alterations in samples with different types of SMAD4 mutations (indicated above the graphs) compared to samples without any SMAD4 mutations. Pos-
itive and negative values on the x-axis indicate increased and decreased miRNA levels in mutated samples, respectively. The y-axis indicates the P-value
on a log10 scale, and the P = 0.05 threshold is indicated by a pink dashed line. The y-axis indicates the log10 P-values. Blue, pink, and gray dots indicate
5p-miRNAs, 3p-miRNAs and miRNAs whose arm was not specified, respectively. The IDs of selected miRNAs are indicated on the graphs. (E) Boxplots
showing the distribution of the selected miRNA levels (y-axes) in samples with different types of mutations versus samples without any SMAD4 mutations
(x-axes). The P-valuesNucleic Acids Research, 2021, Vol. 49, No. 2 611
mutation (N = 13), and deleterious mutations (not in- transcriptional regulation of miRNA precursors. Addition-
cluding p.S464Ter; N = 22). As in samples with SMAD4 ally, secondary regulatory processes may also play a role.
mutations, samples with p.S464Ter and deleterious muta-
tions showed a substantial excess of downregulated miR-
Functional consequences of DICER1 mutations
NAs [95% (34 of 36 altered miRNAs at P < 0.05) and
70% (16 of 23), respectively]) (Figure 5A and Supplemen- Another highly mutated gene with several characteristic
tary Table S5). A similar effect was also observed in the hotspots is DICER1, with a total of 272 mutations (46
group of high-confidence miRNAs (Supplementary Figure mut/kb), including 38 deleterious mutations and 27 mis-
S5B). The excess of downregulations is not visible for the sense mutations located in the aforementioned hotspots in
hotspot missense mutations; however, it must be noted that the RIIIa (N = 6) and RIIIb (N = 21) domains (Figure 3C).
due to a very low number of hotspot mutations, the analy- As shown in Figure 6A, the occurrence of DICER1 muta-
sis of miRNA levels for this type of mutation is of very low tions does not correlate with gene copy number alterations,
statistical power. Nonetheless, we observed one miRNA, and only a small fraction of the DICER1 mutations coincide
miR-329-3p, playing a role in different cancers (108–111)), with gene deletion or amplification. The miRNA expression
Downloaded from https://academic.oup.com/nar/article/49/2/601/6066635 by guest on 20 March 2021
which was consequently downregulated in all three mu- analysis at the pan-cancer level showed that the hotspot mu-
tational groups. Other downregulated miRNAs playing a tations in both the RIIIa and RIIIb domains were associ-
role in cancer include (i) miR-1247-5p and miR-1247-3p (in ated with the global downregulation of 5p-miRNAs with si-
samples with p.S464Ter), recently identified as tumor sup- multaneous upregulation of 3p-miRNAs (Figure 6B). This
pressor miRNAs (104), and observed as highly expressed in effect of 5p-miRNA downregulation was observed before
embryonic/placenta cells which may indicate their role in and was explained by the fact that the hotspot mutations
quickly dividing cells (112); (ii) miR-7-5p (in samples with in RIIIb but also in RIIIa (65) affect the activity of the
deleterious mutations), a well-recognized suppressormiR, RIIIb domain, preventing cleavage of miRNA precursors
playing a role in downregulation of the growth, metasta- at the 5p arm and the release of 5p-miRNAs. The increase
sis, and prognosis of various tumors (reviewed in (113)); in 3p-miRNAs was considered an artifact, i.e. an apparent
and (iii) miR-380-5p (in samples with hotspot missense mu- effect counterbalancing the global decrease in 5-miRNAs,
tations), downregulating TP53 to control cellular survival resulting from the standard miRNA level normalization
(114). As shown in Figure 5B and C, the examples of miR- procedure that standardized the amount of each miRNA
329-3p and miR-380-5p (both members of the MIR-154 against the total number of miRNA reads. Surprisingly, we
family playing a role in pulmonary fibrosis and being a tar- observed a similar effect of decreased 5p-miRNAs and in-
get of TGFB signaling (115)) illustrate that miRNA level creased 3p-miRNAs in samples with deleterious mutations
changes identified in the pan-cancer analysis are also re- that do not affect RIIIb but are assumed to lead to com-
flected in the most frequently mutated cancers, i.e. COAD plete loss of DICER1 (Figure 6 B and C; for comparison,
and READ. SMAD2, similar to other R-SMADs, may also please see the effect of SMAD4 mutations in which 5p- and
posttranscriptionally increase the level of a specific group of 3p-miRNAs are more or less equally distributed between
miRNAs, facilitating the processing of their pri-miRNAs by the decreased and increased miRNAs). The effect of the
DROSHA (72). Among the 44 miRNAs shown to be up- asymmetrical distribution of altered miRNAs was not ob-
regulated by R-SMADs or containing specific R-SMAD- served for other nonhotspot missense mutations outside the
interacting sequence motifs (23 of them tested in this study), RNase domains and synonymous mutations for which, as
miR-421 (a member of the MIR-95 family) (P = 0.01), miR- expected, miRNA level changes were very low (Figure 6C).
188-5p (P = 0.03), and miR-877-5p (P = 0.04) were down- To avoid potential biases associated with pan-cancer nor-
regulated in samples with the p.S464Ter mutation. A com- malization, we performed expression analysis separately for
parison of the SMAD2 mutations with clinical character- UCEC, which is the cancer type with the most frequent mu-
istics of cancers did not reveal an association of mutations tations in DICER1 (∼9%), with 2 mutations in RIIIa, 10
with cancer stages, but p.S464Ter showed a trend toward mutations in RIIIb and 9 deleterious mutations. Although
decreased OS of patients with the mutations (Figure 5D) in of lower statistical power, the UCEC analysis showed a sim-
pan-cancer and in the individual cancers with >1 p.S464Ter ilar effect of the hotspot and deleterious mutations on glob-
occurrence in informative samples. ally decreased levels of 5p-miRNAs and increased levels of
As shown in Figure 5E, although there is some overlap 3p-miRNAs (Figure 6B). To directly check whether the in-
between miRNAs altered by the hotspot missense muta- crease in 3p-miRNAs in samples with the DICER1 muta-
tions in SMAD2 and SMAD4, generally the overlaps be- tions is an effect of normalization against the total number
tween the effects of different mutation types are small. The of miRNA-specific reads, we normalized the miRNA lev-
small overlap, may mainly result from the low statistical els against the level of miR-451a used as a reference gene.
power of the analysis and the fact that different muta- miR-451a is a miRNA whose biogenesis is not dependent
tions predominate in different cancer types (with different on DICER1 processing (116); therefore, its level should not
miRNA profiles), but it may also result from various in- be affected by DICER1 mutations. As shown in Figure 6C,
volvement of the proteins in distinct regulatory processes, normalization against miR-451a in samples with hotspot
i.e. (i) SMAD4 plays a role in the activation of miRNA mutations abolished the effects of neither 5p-miRNA de-
transcription and in this process it may interact with differ- creases nor 3p-miRNA increases. A consistent effect was
ent R-SMADs (not only SMAD2; different mutations may observed when the analysis was performed on RPM (non-
differentially affect interactions with different R-SMADs) batch-effects normalized) miRNA levels and when the anal-
whereas (ii) SMAD2 (but not SMAD4) plays a role in post- ysis was narrowed down to the high-confidence miRNAs612 Nucleic Acids Research, 2021, Vol. 49, No. 2
Downloaded from https://academic.oup.com/nar/article/49/2/601/6066635 by guest on 20 March 2021
Figure 5. Characteristics of SMAD2 mutations. (A) Volcano plots depicting miRNA level alterations in samples with the particular types of SMAD2
mutations (indicated above the graphs) compared to samples without any SMAD2 mutations (graph scheme as in Figure 4D). (B) Boxplots showing the
distribution of the selected miRNA levels (x-axes) in samples with different types of SMAD2 mutations vs. samples without SMAD2 mutations. (C) Violin
plots showing the distribution of non-pan-cancer-normalized levels (y-axis) of the miRNAs shown in B in samples without SMAD2 mutations and specific
samples with different types of SMAD2 mutations (graph scheme as in Figure 4F). (D) Kaplan–Meier plots showing the OS of patients with p.S464Ter
and without any SMAD2 mutations in pan-cancer, COAD and BRCA. (E) Venn diagram showing the overlap between miRNAs altered by the indicated
types of SMAD2 and SMAD4 mutations.Nucleic Acids Research, 2021, Vol. 49, No. 2 613
Downloaded from https://academic.oup.com/nar/article/49/2/601/6066635 by guest on 20 March 2021
Figure 6. Functional consequences of DICER1 mutations. (A) The proportion of copy number alterations of DICER1 (y-axis) in samples with different
types of DICER1 mutations. (B) Volcano plots depicting miRNA level alterations in pan-cancer (first column) and UCEC before and after normalization
against the miR-451a level (second and third columns, respectively) in samples with different types of DICER1 mutations (indicated on the left). Blue,
pink, and gray dots indicate 5p-miRNAs, 3p-miRNAs, and miRNAs whose arm was not specified, respectively. Other graph details as in Figure 4D. (C)
Each graph shows the proportions of 3p- and 5p-miRNAs (y-axis) among the miRNAs downregulated and upregulated in samples with specified types of
DICER1 mutations (x-axis; at P < 0.05). The graphs (from the top) show the alterations in pan-cancer, and UCEC before and after normalization against
the miR-451a level. (D) Above; a schematic representation of the analyzed isomiR fractions. Below; a box plot showing distributions of the main miRNA
fractions of 49 3p-miRNAs highly expressed in UCEC (y-axis) in samples with the RIIIa and RIIIb mutations vs. samples with no DICER1 mutations
(x-axis). On the right; examples of miRNAs whose main fraction was altered in samples with the DICER1 mutations, against changes in the levels of
upstream and downstream isomiRs (please note the different scale in the graphs).614 Nucleic Acids Research, 2021, Vol. 49, No. 2
(Supplementary Table S5 and Supplementary Figure S5C deleterious mutations. Overall, ∼21% of the samples had
and D, respectively). This indicates that hotspot mutations, at least one mutation, but the percentage differed substan-
as reported previously (60–62,65,94), decrease 5p-miRNA tially between the cancer types, reaching >40% in SKCM or
levels, but contrary to previous reports, they also increase COAD. The most frequently mutated genes were TNRC6A,
the levels of numerous 3p-miRNAs. KEGG pathway en- DICER1, SMAD4 and ZCCHC11, with mutations in 2–3%
richment analysis (Supplementary Table S6) showed that of pan-cancer samples. The frequency of mutations in the
upregulated 3p-miRNAs, among others, are strongly asso- miRNA biogenesis genes is similar to that in cancer-specific
ciated with various cancer-related processes, such as ‘TGF- drivers, such as MYC, ALK, CACNA1A, POLE, BCL2,
beta signaling pathway’, ‘Pathways in cancer’, ‘ErbB signal- NOTCH2, MET, HRAS, FGFR and PIK3R1, with pan-
ing pathway’ and ‘Hippo signaling pathway’, which were cancer mutation frequencies up to ∼3% (122). Consistent
found among the top ten most significant associations (ad- with the potential cancer-specific role of the genes, some of
justed P 0.95. However, of SMAD4 deficiency. With the large collection of muta-
in some of the individual miRNAs, the level of major miR- tions, we have identified 8 hotspot residues in the MH2 do-
NAs is significantly altered (mostly decreased) in samples main, including some not reported before, and revealed that
with the DICER1 hotspot mutations (Supplementary Table the proportions of hotspot and deleterious SMAD4 muta-
S8 and Figure 6D (right panel)). Although there is striking tions differ substantially between cancers, with the fraction
concordance between the effects of the mutations in RIIIa of hotspot mutations significantly enriched in READ (86%)
and RIIIb (Supplementary Table S8) the overall changes and the lowest in PAAD (27%). This may suggest differ-
in fractions of the main miRNAs are very small. It is un- ent mechanisms and effects of SMAD4 inactivation in dif-
likely that such small changes in fractions of main miRNAs ferent cancer types. We showed that most of the hotspots
may cause any meaningful biological effect, however that localize in residues of charged AAs, which may affect the
may result in more substantial changes in some of the mi- electrostatic interactions of the MH2 domain with corre-
nor isomiRs (Figure 6D (right panel)). sponding domains in R-SMADs (e.g. SMAD2) critical for
The lists of miRNAs differentiated in pan-cancer and SMAD complex formation (86). Such an effect of both loss-
UCEC with different types of DICER1 mutations are of-charge and gain-of-charge SMAD4 mutations was com-
shown in Supplementary Table S5, it includes a substan- putationally predicted in a previous study (127). Consis-
tial number of the high-confidence miRNAs. Among the tently, we showed that all the SMAD4 hotspots as well as
altered miRNAs are many miRNAs whose function is well much less frequently mutated hotspot residues in the cor-
recognized in cancer and many upregulated 3p-miRNAs are responding MH2 domain in SMAD2 localize at surfaces
passengers of such miRNAs, examples of which are listed of the SMAD4:SMAD2 interaction, confirming the role
in Supplementary Table S7. A comparison of the DICER1 of hotspot mutations in destabilizing the SMAD complex
mutations with clinical characteristics of cancers did not re- and hence revealing an inhibitory role of these mutations in
veal any significant associations. downstream TGFB/BMP signaling. We showed that both
the deleterious and hotspot SMAD4 mutations frequently
(∼80%) coincide with gene deletions, which indicates inac-
DISCUSSION
tivation of the second allele and is consistent with previous
In this study, we provide a comprehensive pan-cancer anal- observations of frequent LOH in the region (128–131). Al-
ysis of somatic mutagenesis in a panel of 29 miRNA bio- though it was shown that SMAD4 plays a role in the activa-
genesis genes in 33 adult-onset cancers. In total, we identi- tion of miRNA gene transcription (summarized in (132)),
fied 3,649 mutations, composed of 60% missense and 17% the effect of SMAD4 mutations on miRNA expressionNucleic Acids Research, 2021, Vol. 49, No. 2 615
has never been tested. We identified numerous miRNAs study showed a global decrease in 5p-miRNAs and a global
(predominantly high-confidence miRNAs) differentially ex- increase in 3p-miRNAs in samples with both hotspot and
pressed in samples with SMAD4 mutations and showed dif- deleterious DICER1 mutations. A similar effect has been
ferent patterns of miRNA level changes induced by hotspot observed before (61,62,65,94,138,139). The global decrease
and deleterious mutations. While hotspot mutations pre- in 5p-miRNAs has been interpreted as the result of ineffi-
dominantly downregulate miRNAs, deleterious mutations cient 5-miRNA processing, but the increase in 3p-miRNAs
both increase and decrease miRNA levels. This finding is was considered an artifact of miRNA level normalization
consistent with the results obtained for SMAD4 knock- (against the total number of miRNA reads) that, as a re-
down by RNAi in hepatic stellate cells (73) and again shows flection of the global 5p-miRNA deficit, resulted in a rel-
a different effect of deleterious mutations that, as a result ative increase in unaffected 3p-miRNAs (65). To eliminate
of NMD, most likely leads to complete loss of SMAD4 this potential bias, we normalized the miRNA levels against
and hotspot mutations that modify SMAD4 structure, af- the level of miR-451a, which is a DICER1-independent
fecting its interactions with R-SMADs and other proteins. miRNA whose level is not affected by DICER1 deficiency
Therefore, the effect of hotspot mutations may result not (116). However, normalization against the miR-451a level
Downloaded from https://academic.oup.com/nar/article/49/2/601/6066635 by guest on 20 March 2021
only from impeded R-SMADs:SMAD4 complex formation did not eliminate the asymmetrical effect of the hotspot mu-
but also from a shifted balance in the binding of competing tations also visible in the high-confidence miRNAs, show-
coactivators and corepressors (such as p300/CBP and Ski ing that both the 5p-miRNA decreases and 3p-miRNA in-
or SnoN, respectively), whose contribution determines the creases are real. We have additionally shown that the in-
outcome of signaling events (reviewed in (125,133)). creased 3p-miRNAs strongly associate with cancer-related
Similar effects of predominant downregulation of terms/pathways and include many miRNAs well recog-
miRNA levels were observed for p.S464Ter, the most fre- nized in cancer (Supplementary Table S6). The increase in
quent SMAD2 hotspot mutation, as well as for deleterious 3p-miRNAs may result from a lack of competition with 5p-
SMAD2 mutations. The p.S464Ter mutation is localized miRNAs during transfer to and loading onto the RISC, ob-
in the last exon of SMAD2 and truncates the last 5 AAs served as 5p/3p arm shifting or switching (140). However,
of the protein but most likely does not activate NMD. As this would require some alternative mechanism of releas-
the truncated fragment is important for efficient SMAD2 ing 3p-miRNAs from partially processed (nicked only at
phosphorylation and includes two serine residues (S465 3p-arms) pre-miRNAs and transferring them to the RISC,
and S467) whose phosphorylation upon TGFB signaling bypassing the miRNA duplex stage. Although it was pre-
is critical for SMAD4(SMAD2)2 complex formation viously speculated that AGO2 may play some role in such
(93,134,135), the mutation precludes the SMAD complex a process (19,20), in our opinion, this step warrants fur-
formation and TGFB/BMP signaling (123). We showed ther investigation. Unlike the hotspot mutations, the dele-
that the mutation is associated with decreased survival terious mutations (after normalization against miR-451a)
of cancer patients. Of note, two BRCA patients with the almost exclusively decrease miRNA levels, which confirms
mutations showed a strikingly short OS. Regardless of their loss-of-function nature. Although the effect of delete-
its role in complexes with SMAD4, SMAD2 (along with rious mutations is more profound for 5p-miRNAs, the mu-
other R-SMADs) may directly interact with a specific set tations also affect 3p-miRNAs (∼30%).
of miRNA precursors, accelerating their processing by With exception of hotspot mutations found in DICER1,
DROSHA (72,136). This posttranscriptional regulation we found only a few mutations in other miRNA biogenesis
of miRNA processing may also be affected by SMAD2 genes, i.e. DROSHA, DGCR8 and XPO5, which have been
mutations, as the MH2 domain of R-SMADs was shown recently observed in different childhood cancers associated
to interact with the P68 RNA helicase participating in the with DICER1 syndrome and in Wilms’ tumor (56–59,66).
recruitment of DROSHA and DGCR8 to pri-miRNAs This may indicate specific functions of the mutations/genes
(137). characteristic of childhood cancers but not playing a role
Another gene with characteristic hotspot mutations is in adult-onset cancers. We also excluded the frequent oc-
DICER1. We found 21 hotspot mutations affecting 4 metal- currence of specific indel hotspots in TRBP and XPO5 pre-
ion-binding AA residues in the RIIIb domain (E1705, viously reported at high frequencies in cancers associated
D1709, D1810 and E1813) and 6 hotspot mutations in one with MSI (67,68).
AA residue (S1344) in RIIIa. These hotspots were previ- In summary, in this study, we present a comprehensive
ously detected and functionally characterized in various pe- pan-cancer analysis of somatic mutations accumulated in
diatric cancers, including cancers associated with DICER1 genes involved in miRNA biogenesis and function. We
syndrome (e.g. pleuropulmonary blastoma) and Wilms’ tu- showed that some of these genes are specifically mutated
mor, as summarized in (54,64). More recently, they were in particular cancers. We identified many hotspot muta-
also investigated in thyroid adenomas (94) and the TCGA tions, including some recurring in specific cancer types. We
cohort, mostly in UCEC samples (65). It was shown that extended knowledge about the types and distribution of
RIIIb hotspot mutations affect the RIIIb cleavage of the SMAD4 mutations and showed their effect on the expres-
5p-arm of pre-miRNAs, resulting in inefficient production sion of miRNA genes. We also showed that all hotspot mu-
of 5p-miRNAs (60–62,94). In a very recent study, it was also tations in SMAD4 and SMAD2 affect AA residues located
shown that the hotspot mutations of the S1344 residue, al- at the surface of the SMAD4:SMAD2 interaction. More-
though located in RIIIa, spatially interfere with RIIIb, re- over, we distinguished and further characterized the effects
sulting in the same effect as that observed for the muta- of deleterious and hotspot missense mutations in DICER1,
tions in RIIIb (65). The miRNA profiling performed in our among others, showing that hotspot mutations in the RI-You can also read