Current Status and Future Prospects of Clinically Exploiting Cancer-specific Metabolism-Why Is Tumor Metabolism Not More Extensively Translated ...
←
→
Page content transcription
If your browser does not render page correctly, please read the page content below
International Journal of
           Molecular Sciences

Review
Current Status and Future Prospects of Clinically
Exploiting Cancer-specific Metabolism—Why Is
Tumor Metabolism Not More Extensively Translated
into Clinical Targets and Biomarkers?
Magesh Muthu and Anders Nordström *
 Department of Molecular Biology, Umeå University, SE-90187 Umeå, Sweden; magesh.muthu@umu.se
 * Correspondence: anders.nordstrom@umu.se

 Received: 31 January 2019; Accepted: 15 March 2019; Published: 19 March 2019

 Abstract: Tumor cells exhibit a specialized metabolism supporting their superior ability for rapid
 proliferation, migration, and apoptotic evasion. It is reasonable to assume that the specific metabolic
 needs of the tumor cells can offer an array of therapeutic windows as pharmacological disturbance
 may derail the biochemical mechanisms necessary for maintaining the tumor characteristics,
 while being less important for normally proliferating cells. In addition, the specialized metabolism
 may leave a unique metabolic signature which could be used clinically for diagnostic or prognostic
 purposes. Quantitative global metabolic profiling (metabolomics) has evolved over the last
 two decades. However, despite the technology’s present ability to measure 1000s of endogenous
 metabolites in various clinical or biological specimens, there are essentially no examples of
 metabolomics investigations being translated into actual utility in the cancer clinic. This review
 investigates the current efforts of using metabolomics as a tool for translation of tumor metabolism
 into the clinic and further seeks to outline paths for increasing the momentum of using tumor
 metabolism as a biomarker and drug target opportunity.

 Keywords: translational medicine; metabolomics; metabolism; cancer; tumor; biomarker;
 drug discovery; metabolic homeostasis

1. Metabolic Homeostasis and Implications for Studying Quantitative Metabolic Profiles in
Tumor Biology
     Homeostasis is the organism’s ability to maintain a certain steady internal condition of
physiological aspects, such as blood glucose, body core temperature, or blood gases. The human
body typically uses more than half of the daily energy consumption for maintaining this homeostasis
through the sleeping metabolic rate [1], whereas actual physical activity accounts only for 10 to 30% [2].
These numbers are a good illustration of that cells not are in an equilibrium, in which all influences are
balanced, but rather in a constant flow of energy and matter—a steady state. On a metabolic level,
the homeostasis serves to deliver metabolic precursors, metabolic intermediates, and metabolic end
products just in time [3] to where they are required for cellular function. The homeostasis mechanism
also serves to avoid scenarios of accumulation or depletion of metabolic intermediates as this can be
toxic both for individual cells and multicellular organisms. Examples of toxicity are accumulation of
phenylalanine [4], 5-oxoproline [5], and lipid intermediates [6–8].
     The energy currency of the cellular machinery—ATP—is regulated with extreme homeostatic
precision. Certain cells and tissues, such as skeletal and cardiac muscle, maintains ATP concentration
constant even in scenarios where the demand for ATP turnover differs by two orders of
magnitude [9,10]. Deviations from the ATP set point will quickly have pathological consequences,

Int. J. Mol. Sci. 2019, 20, 1385; doi:10.3390/ijms20061385                      www.mdpi.com/journal/ijms
Int. J. Mol. Sci. 2019, 20, 1385 2 of 18
for example, chemical manipulation of ATP levels in mouse proximal tubular (MPT) cells to 25%
of the ATP base level induced necrotic cell death in 50% of the cells within 12 h [11]. Conversely,
exogenously added ATP has also been shown to induce dose dependent apoptosis in HL-60 and
F-36P cells [12]. In fact, the intracellular ATP level has also been proposed to be a determinant
of apoptotic/necrotic cell death fate [13]. On a global scale we do not have a complete picture of
how the maintenance of ATP homeostasis draws and interacts with other parts of known metabolic
pathway schemes. However, we do know that ATP synthesis is strongly connected with oxidative
phosphorylation, which in turn depends to a large extent on the tricarboxylic acid cycle (TCA) for
NADH production [14]. The TCA has several points for anaplerotic/cataplerotic reactions [15,16] and
is thus a focal point for mediating the further metabolic processes required for sustaining the ATP
homeostasis: for example, glycolysis (acetyl-CoA), fatty acid synthesis (citrate), fatty acid oxidation
(acetyl-CoA), and glutaminolysis (α-ketoglutarate). This links ATP synthesis to the TCA, which in turn
draws and interacts at multiple points in the metabolism. Thus, maintaining the ATP homeostasis will
rapidly affect more distant metabolism causing metabolic ripple effects depending on nutrient status,
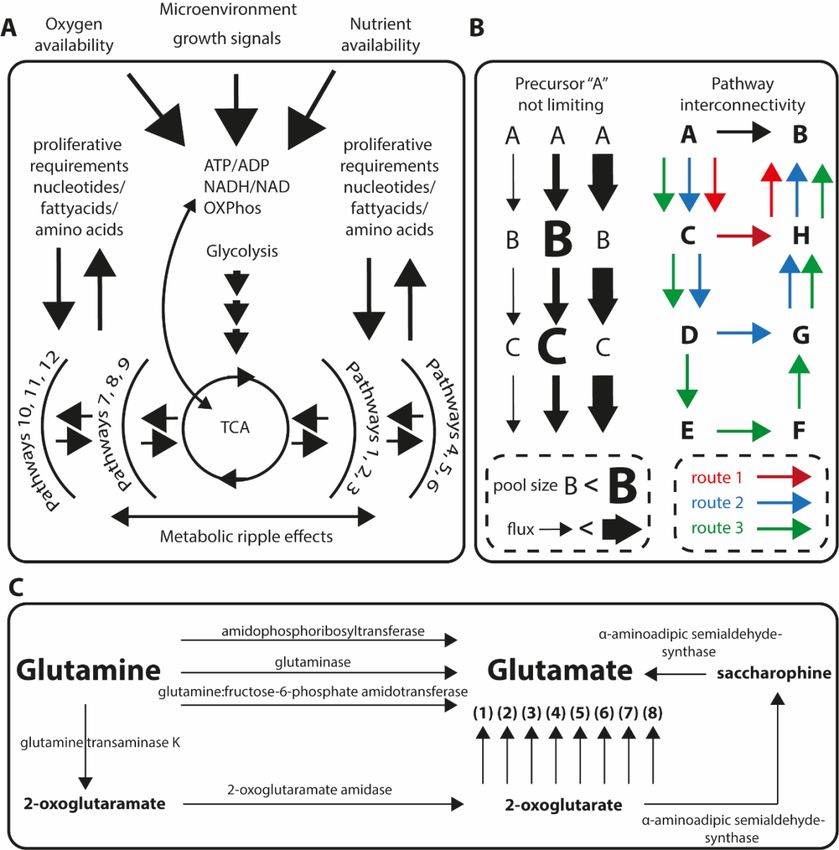
oxygen, and microenvironment and growth signals illustrated in Figure 1a.
A hallmark of cancer cells is their unlimited ability for replication. This implies frequent cell
divisions during which all material in the cell essentially doubles. Any cell division will clearly impact
requirement for ATP available for protein, lipid, and RNA/DNA synthesis, and should trigger large
ripple effects in the global metabolism [17]. Using synchronized cells and pulse chase stable isotope
tracer experiment Shlomi and coworkers recently deciphered changes in metabolic fluxes through the
TCA during cell division [18]. For example, they showed that oxidation of glucose derived flux peaked
the in late G1 phase, while oxidative and reductive glutamine metabolism dominated the S phase [18].
A basic assumption is that the homeostatic mechanisms will manifest differently in cancer
cells simply because their fundamentally altered metabolism that supports rapid and continuous
proliferation in a competitive microenvironment where nutrient usage must be flexible [19,20] and
oxygen often is limiting. At the same time a basic assumption is that the cancer cells for their
survival needs to maintain their ATP homeostasis as normal cells must. Identification of specific
mechanisms sustaining the global metabolic homeostasis, driven and balanced between by the cancer
cells continuous proliferation and their need for maintaining ATP homeostasis, would lead to the
identification of therapeutic or biomarker opportunities.
Measuring quantitative metabolic profiles with the intention to associate them with physiological
or pathological conditions have been ongoing for over 50 years [21–23]. This was coined
“metabolomics” in the literature 1998 to 2001 [24–26]. Gas and liquid chromatography (GC/LC)
coupled with mass spectrometry is the most sensitive approach, typically with an ability to relatively
compare concentration wise well over 500 annotated metabolites in a biological sample [27]. Over the
last 10–15 years developments in the analytical pipeline, including high resolution benchtop mass
spectrometers [28] and raw data alignment [29] software [30] and databases [31,32], to aid interpretation
and data integration. Assuming that there actually is an immense difference in metabolism and
metabolic homeostatic mechanisms between normal and cancer cells, it is reasonable to ask why
modern day metabolomics not yet have identified additional new and specific differences to lead
tumor biologists in novel metabolic avenues. There is still a lot of metabolic focus and new revival
on metabolic alterations that have been known long before the arrival of metabolic profiling such as
the “Warburg effect” [33], glutaminolysis [34–36], and the complex role of acetate both for fatty acid
synthesis and oxidation [37,38]. First, one difficulty lies in the fact the homeostatic mechanisms works
towards keeping concentration levels of metabolic intermediates constant avoiding toxicity [4–8].
Secondly, if the concentration does not differ more than ±20%, the analytical method and processing
pipeline might struggle to identify the difference as significant [39]. Thirdly, from a data evaluation
perspective, and ultimately from a biological perspective, a major question exists: How to value
amplitude of a given difference in relation to another difference with a smaller/larger amplitude?
That is, is a metabolite displaying a large fold change more important for understanding the systemInt. J. Mol. Sci. 2019, 20, 1385 3 of 18
than a metabolite showing a smaller fold change? Consider for example oral glucose test used for
probing insulin resistance, prediabetes or gestational diabetes in pregnant women. In this test 75 g of
glucose in the form of a sweet juice (237 mL) is administered. After 2 h blood glucose level for a healthy
individual should be below 7.8 mmol/L; between 7.8 and 11 mmol/L the person is considered to have
impaired glucose tolerance and should be further diagnosed; and above 11 mmol/L the person is
considered to be diabetic [40]. This means that a fold change of 1.4 makes a clear cut clinical diagnosis.
In a study where the oral glucose tolerance test was administered to healthy individuals the blood
glucose level varied between 5.8 and 8.1 mmol/L after two hours (1.4-fold), at the same time several
fatty acids and acyl-carnitines had changed between 2- and 4-fold [41]. Diabetes is far from a fully
understood disease, but if no disease mechanisms were known, would the higher blood fold change
of palmitate lead us in the direction to believe that diabetes mechanistically is a disease of impaired
lipid
Int. metabolism?
J. Mol. Sci. 2019, 20, x FOR PEER REVIEW 3 of 18
Figure1.1. (A)
Figure (A) Maintaining
MaintainingATPATP is performed
is performedwithwith
extreme precision.
extreme This causes
precision. This metabolic ripple
causes metabolic
effects
ripple throughout
effects the metabolism.
throughout Glycolysis
the metabolism. and tricarboxylic
Glycolysis acid (TCA)
and tricarboxylic cycle
acid are central
(TCA) nodes
cycle are in
central
this. (B)
nodes in Metabolic
this. (B) homeostasis can be maintained
Metabolic homeostasis can primarily by the mechanics
be maintained primarily ofby
regulation of fluxes of
the mechanics
(left) and of
regulation alternative pathways
fluxes (left) and oralternative
shunts for diversion
pathwaysof ormetabolic
shuntsflow. (C) Conversion
for diversion of glutamine
of metabolic flow.
to glutamate is most often associated with the enzyme glutaminase (GLS). There are,
(C) Conversion of glutamine to glutamate is most often associated with the enzyme glutaminase however, at least
(GLS).
11 other paths between these metabolites with experimental evidence. (1) glutamate dehydrogenase
There are, however, at least 11 other paths between these metabolites with experimental evidence.
1 (GLUD1), (2) phosphoserine aminotransferase (PSAT1), (3) tyrosine aminotransferase (TAT), (4)
(1) glutamate dehydrogenase 1 (GLUD1), (2) phosphoserine aminotransferase (PSAT1), (3) tyrosine
aspartate aminotransferase 1 (GOT1), (5) alanine aminotransferase 1 (GPT), (6) 4-aminobutyrate
aminotransferase (TAT), (4) aspartate aminotransferase 1 (GOT1), (5) alanine aminotransferase 1 (GPT),
aminotransferase, mitochondrial (ABAT), (7) kynurenine/alpha-aminoadipate aminotransferase
(6) 4-aminobutyrate aminotransferase, mitochondrial (ABAT), (7) kynurenine/alpha-aminoadipate
(AADAT), and (8) ornithine aminotransferase (OAT).
aminotransferase (AADAT), and (8) ornithine aminotransferase (OAT).
Measuring quantitative metabolic profiles with the intention to associate them with
physiological or pathological conditions have been ongoing for over 50 years [21–23]. This was coined
“metabolomics” in the literature 1998 to 2001 [24–26]. Gas and liquid chromatography (GC/LC)
coupled with mass spectrometry is the most sensitive approach, typically with an ability to relatively
compare concentration wise well over 500 annotated metabolites in a biological sample [27]. Over theInt. J. Mol. Sci. 2019, 20, 1385 4 of 18
To decipher primary metabolic effects from secondary or tertiary is critical for understanding
of mechanisms. The main cellular options to compensate or regulate accumulation or depletion of
metabolic intermediates will result in secondary or tertiary effects and they are (1) to modulate activity
or amount of available metabolic enzyme thus altering the metabolic flux and (2) to upregulate
alternative synthetic routes, thus opening up metabolic pathway redundancy or interconnectivity.
These two scenarios are illustrated in Figure 1b,c.
An increased metabolic flux through a specific set of reactions can lead to a measurable
concentration increase in intermediates. But, depending on reaction kinetics, a dramatically increased
flux can be completely masked in a concentration sense by matching of downstream pathway activity
increase (Figure 1b). Metabolic fluxes are readily measured using stable isotope tracers [42,43], and can
also, in defined pathways, be quantitatively determined [44]. However, these approaches are not
as easily applied to untargeted discovery of flux alterations. Alternative biosynthetic routes are
conceptually even more difficult to account for. When interpreting metabolomics data, a common
approach is to map metabolites onto known metabolic pathways. There are two problems with this.
(1) Metabolic pathway schemes can create the illusion of certain metabolites are far from, or close to
each other spatially, when in fact our collection of two-dimensional pathway schemes are completely
constructed. (2) Which reaction should a given metabolite be mapped onto? All road leads to Rome,
but there are many roads to choose from. For example, using the function “metabolic route search” in
the Humancyc database [31] to find metabolic routes between glutamine and glutamate, generates
essentially as many routes as the inquiry limits allows. In the case glutamine to glutamate, at least
12 different routes with experimental evidence in Homo sapiens. These aspects, increased flux vs.
metabolite concentrations, and the metabolic redundancy are illustrated in Figure 1b,c. Further, this
also complicates multiomics overlays as each metabolite can be associated with different reactions and
thus with different genes, mRNA, or proteins.
2. Cancer-Specific Metabolism as a Drug Target Opportunity at Present and What We Can Learn
from Historical Tumor Metabolic Drug Target Discovery?
While the first FDA approved pharmacological treatment for cancer was the DNA alkylating
chemical agent mustard gas [45], the second (leucovorin) and third (methotrexate) drugs approved
target metabolism [45]. The importance of vitamins for normal growth was studied intensely between
~1850 and 1950, and it was discovered that many symptoms, conditions, and illnesses previously
associated with infections or toxins actually was result of vitamin deficiency [46]. This led researchers
to explore the role of these substances for tumor growth. The vitamin B relative, inositol (nonessential),
was found to have some anti-tumor effect [47] and further studies using what was thought to be
folic acid (vitamin B9), then called L. casei fermentation product and ultimately later shown to be
pteroyltriglutamic acid, a folic acid conjugate, showed inhibiting effect on tumor growth [48,49].
Further studies using conjugates of folic acid and pteroyldiglutamic, and pteroyltriglutamic acids, in
patients with terminal cancer of various kind [50] showed that cancer cells in bone marrow biopsies
from patients with acute leukemia displayed accelerated growth. This made researchers hypothesize
that the tumor depended more heavily on folic acid supply and that antifolate (antimetabolite)
potentially could derail this dependency. Although, at this point there was no understanding of
the details of folic acids role for purine biosynthesis, Sidney Farber through collaborations obtained
aminopterin, and could, in a landmark 1948 paper, show that this substance induced remission in
children with leukemia [51]. Aminoptrein was early on replaced by a derivative, methotrexate, and
even though it was amongst the very first substances available to treat cancer pharmacologically, it is
still a major player in therapeutic regimens of not only leukemia therapy, but also breast cancer [52].
In addition it has become a first-line treatment for rheumatoid arthritis [53], and is listed the World
Health Organization’s (WHO) list of essential medicines. Asparaginase, which is also listed on WHO
list of essential medicines, is a drug used to treat acute lymphoblastic leukemia (ALL), acute myeloid
leukemia (AML), and non-Hodgkin’s lymphoma, and was discovered more or less by coincidence.Int. J. Mol. Sci. 2019, 20, 1385 5 of 18
Because of “ . . . experiments undertaken for other purposes . . . ” it was found that transplanted
lymphomas in a mice model underwent complete regression when the tumor bearing mice received
subcutaneous injections of normal guinea pig serum [54]. It could subsequently be demonstrated
that the serum contained the enzyme asparaginase which converts asparagine to aspartic acid [55,56].
The pharmacological effect is achieved as the lymphoblastic leukemia cancer cells cannot synthesize
adequate amounts of the amino acid asparagine for protein synthesis and are thus dependent on
extracellular asparagine. When asparaginase is administered, the extracellular pool of asparagine is
depleted, which subsequently will impact proliferation and viability of the cancer cells.
These two examples serves to illustrate that finding basal metabolic differences in extracellular
requirements (asparagine) or internal fluxes (folate) between normal cells and cancer cells is a viable
route for new drug target discovery. Other well-known metabolic differences have, maybe to some
surprise, not been targeted until very recently. Some of these are outlined in Figure 2. High level of
glucose utilization is already exploited extensively in clinic for positron emission tomography (PET).
Pharmacological direct inhibition of glycolysis has not been as successful, at least not as a single therapy.
The most well studied glycolysis inhibitor is 2-deoxyglucose (2-DG). After cellular uptake of 2-DG and
phosphorylation by the hexokinase, the 2-DG-P cannot be further metabolized by glucose-6-phosphate
isomerase, and gets trapped and thus will 2-DG acts as a competitive inhibitor of the glycolytic
pathway. However, separation of glycolysis and the pentose phosphate pathway (PPP) in yeast made
cells resistant to 2-DG suggesting that blocking of glucose catabolism may not be the sole mechanism
for the growth inhibitory effect of 2-DG [57]. Clinical trials using single high doses up to 300 mg/kg
as adjuvant to radiation therapy for glioblastoma patients was tolerated [58,59], but for longer term
adjuvant treatment, only lower doses up to 63 mg/kg is tolerated [60], which may be too low dose to
achieve efficacy. The increased aerobic glycolysis in cancer cells results in increased lactate formation
which needs to be removed from the cell. Inhibition of lactate transporters is therefore a rational target
for disruption of cancer cell homeostasis. Phase I studies of the compound AZD-3965 is underway,
with preclinical pharmacological data already reported [61]. Inhibition of glutaminolysis, which is
another pathway that appears to be more critical for cancer cells, is yet another strategy for hitting
tumor specific metabolism. Clinical trials using the glutaminase inhibitor CB-839 are also under way.
Metabolic drug targets approved and in clinical testing are summarized in Tables 1 and 2, respectively.
Int. J. Mol. Sci. 2019, 20, x FOR PEER REVIEW 6 of 18
Figure 2. Schematic illustration of how drugs or drug targets are involved in cancer metabolic pathways.
Figure 2. Schematic illustration of how drugs or drug targets are involved in cancer metabolic pathways.
Table 1. Approved drugs targeting specific metabolic aspects of the cancer metabolism.
FDA Status in
Target Drug
Cancer
Methotrexate
Dihydrofolate reductase (DHFR) Approved
Pemetrexed
5-phosphoribosyl-1-pyrophosphatase (PRPP) 6-mercaptopurine (6-MP) 6-thioguanine
Approved
amidotransferase (6-TG)Int. J. Mol. Sci. 2019, 20, 1385 6 of 18
Table 1. Approved drugs targeting specific metabolic aspects of the cancer metabolism.
Target Drug FDA Status in Cancer
Methotrexate
Dihydrofolate reductase (DHFR) Approved
Pemetrexed
5-phosphoribosyl-1-pyrophosphatase (PRPP) 6-mercaptopurine (6-MP)
Approved
amidotransferase 6-thioguanine (6-TG)
Thymidylate synthase (TS) 5-fluorouracil (5-FU) Capecitabine Approved
Gemcitabine
DNA polymerase/ribonucleotide reductase (RnR) Approved
Cytarabine
Circulating asparagine L-Asparaginase Approved
mutant Isocitrate dehydrogenase 2 (IDH2) Enasidenib (AG-221) Approved
Table 2. Drugs targeting cancer metabolism currently in clinical trials.
Clinical
Target Drug Cancer Type
Status
Dihydroorotate
Leflunomide Phase II/III Prostate Cancer
dehydrogenase (DHODH)
S6K, 4E-BP1, AMPK Metformin Phase II Breast Cancer
AG-120
Mutant Isocitrate Hematologic malignancies and Solid
IDH305 Phase I/II
dehydrogenase 2 (IDH2) tumors
AG-881
Renal Cell Carcinoma (RCC), Melanoma,
Glutaminase 1 CB-839 Phase I/II
Non-Small Cell Lung Cancer (NSCLC)
Monocarboxylate transporter 1 Advanced Solid Tumors, Diffuse large B
AZD3965 Phase I/II
(MCT1) cell lymphoma and Burkitt’s Lymphoma
Advanced HER2 positive Breast Cancer,
Fatty Acid Synthase (FASN) TVB-2640 Phase II
Colon Cancer, Astrocytoma
Hepatocellular Carcinoma [62], Acute
Phase
Arginine Deiminase ADI-PEG 20 myeloid leukemia (AML) [63], advanced
I/II/III
pancreatic adenocarcinoma [64]
α-Ketoglutarate
CPI-613 Phase II Advanced and/or metastatic solid tumors
dehydrogenase complex
Two of the very first pharmacological substances for cancer treatment are still a mainstay of cancer
therapy for several different types of cancers. These targets continue to attract research, which might
further enhance their values as metabolic points of therapeutic intervention [65,66]. Interestingly,
they are both targeting metabolic weak spots/weaknesses of cancer that was more or less discovered
by chance. The rewired metabolism of cancer cells most likely forces them to interact biochemically
differently with their surroundings which can manifest like increased dependence of extracellular
asparagine or sensitivity to disruption of the folate cycle. What strategies are available today for
identifying potential weak spots more systematically? Broadly, these strategies could be conceptually
dived into, computational, cell-based, and in vivo approaches.
Several computational or modeling-based approaches for finding metabolic vulnerabilities have
been developed. These include PRIME [67], which correlates gene expression data with a phenotypical,
measurable output, such as growth and biomass for individual cell lines. When models for cancer cell
are compared to those of normal cells, prediction of potential drug targets can be made. Constraint
based models of metabolic networks integrates different types of mathematical and biophysical
constraints, enabling prediction of metabolic phenotypes and, importantly, genes essential for
sustaining growth. These models are typically applied to individual pathways [68,69]. A global
reconstruction model of human metabolism is publically available—Recon 2 [70]—this model can beInt. J. Mol. Sci. 2019, 20, 1385 7 of 18
combined with public clinical and experimental gene transcriptome data in order to identify potential
metabolic characteristics and thus weaknesses of specific cancer types [71].
Both methotrexate and asparaginase were based on discoveries made directly on human biopsies
and in vivo studies after intervention. However, systematic studies imply large biochemical spaces
to be investigated. For reasons of cost and throughput, cellular models are preferred, even if we
know that these are potentially poor representations of in vivo conditions. There are however several
recent examples of development that could advance cellular models systems for cancer drug target
discovery. Modification of growth media to better represent human plasma resulted discovery of de
novo pyrimidine biosynthesis inhibition [72]. This could be traced to an inhibitory effect of uric acid on
UMP synthase. Interestingly, uric acid has ~10-fold higher concentration in humans compared to mice.
Stable isotope tracing and metabolomics assisted in deciphering that the mitochondrial glutamate
transporter is crucial in KRAS mutation colon cancer cells ability to sustain aspartate derived amino
acid and polyamine synthesis [73]. Evaluating effect of nutrient availability over prolonged periods of
times can be studied using a Nutrostat for competitive proliferation assays across multiple cell lines [74].
Development of 3-D culturing methods to better represent epithelial cell growth through a cell sheet
system was recently employed to screen sensitivity towards chemotherapeutics [75]. Models like this
could be useful for systematic investigation of cancer cell communication with extracellular matrix
to identify dependencies that are essential for the cancer cells. Interestingly, from a metabolomics
perspective, the scaling factor of the cell system under investigation does not appear to be limiting for
the number of metabolites possible to measure in cell lysates [76].
Studying tumor growth for the identification of metabolic limiting factors in vivo poses the
largest challenge both technically and in terms of experimental design possible to achieve for cost and
ethical reasons. There are however a growing number of reports where metabolic aspects of cancer
progression has been examined in animal models. Plasma metabolome changes were followed over
time during breast tumor growth and metastasis in mice revealing changes in arginine metabolism
as well as changes in structural and signaling lipids that correlated with metastatic phase [77].
Metabolomics measurement of tumors with different inclination for metastasis formation unveiled
sialic metabolism as upregulated in highly metastatic tumors [78]. Genetic knockdown inhibiting
biosynthesis of activated sialic acid resulted in less metastasis forming in vivo [78]. Pharmacological
inhibition of mTORC can suppress cancer cell proliferation because of its role in controlling glycolysis.
Direct perfusion with stable isotope-labeled glutamine into mouse tumor and measurement of
glutamine derived aspartate as well as tumor glutamine uptake suggested glutaminolysis mechanisms
compensating for suppressed glycolysis, which in turn could be restricted using an inhibitor of
glutaminase [79]. An in vivo screening approach using patient derived tumor cells in to which lentiviral
shRNA targeting 12 different surface transporters were introduced [80]. These cells were pooled and
introduced into mice with tumors being harvested at different time points. By measuring the frequency
of these shRNA over time it was deduced which ones that prevented tumor growth and, carbonic
anhydrase IX could be identified together with others as essential for tumor formation [80]
3. Does Cancer Cell Metabolism Leave a Disease Specific Metabolic Imprint That Can Be
Used as a Biomarker?
Arguably, biomarker discovery, is the area of altered cancer metabolism that has attracted most
research with >1500 publications returned through https://pubmed.gov search on “cancer” and
“metabolomics” and “biomarker”. Most of these are published since 2008. Finding biomarkers is
not only interesting from a diagnostic perspective. Biomarkers often arise from a pathology specific
biochemistry, and may thus lead to new drug targets as well. There is a clear rationale for assuming that
tumor elements can reach the blood stream through for example mechanisms of direct export, necrosis,
apoptosis, microvesicle budding, or phagocytosis. It is therefore conceivable that direct biochemical
evidence of tumor presence is possible to measure in the blood. With an altered metabolism in cancer
cells, there is a possibility that this altered metabolism will be reflected in the blood and potentiallyInt. J. Mol. Sci. 2019, 20, 1385 8 of 18
used as biomarker. However, there is general problem with metabolic biomarkers, the “metabolites”
are generic, and that is there is no tumor unique metabolite. All metabolites are potentially present
in all cells as energy, signaling, or structural elements. Also, the altered tumor metabolism shifts the
fluxes through individual metabolite pools and potentially skews the relative proportion of specific
metabolite pairs. This is further complicated by the following. (1) Since the tumor in most cases is
very small in relation to the rest of the body, there is a fair chance that a tumor specific metabolic
profile leaking out from tumor cells is diluted and disappears in the blood volume where a large
contribution to the blood metabolic profile comes from metabolic active muscle cells which constitute
approximately 40% of human body weight. (2) The tumor triggers innate immune responses such as
inflammatory responses, which, in turn, create much larger alterations to the blood metabolic profile
than the primary changes leaked out from the tumor cells. This has been observed when comparing
the blood metabolic profiles of nonrelated diseases where a majority of metabolic differences were
found not to be disease specific [81]. (3) The blood metabolic profile will reflect what we eat and our
life style which further convolutes the cancer-specific metabolites leaking out from the tumor. Because
of (1), (2), and (3), blood metabolic biomarkers can be more complicated to assign than for example
cancer-specific DNA methylations which can achieves specificities in clinical cohorts close to 100% [82].
In fact, a recent study where a multi panel of levels of certain proteins and mutations of free circulating
DNA was applied to different tumors in different organs, reported not only 99% specificity but also
showed that it was possible to assign the organ in which the tumor was localized for 83% of the
patients [83]. This has raised the question of the potential of universal cancer screening, as opposed to
organ based cancer screening for diagnostic purposes [84].
Despite the massive amount of metabolomics literature reports proposing tentative biomarkers
for various cancers, no single metabolite or metabolite panel have found clinical utility over the last
10 years. A recent review compiled various biomarkers, with some sort of validation for several
different pathologies including cancer, obtained through metabolomics [85]. Many of these validations
included running comparable cohorts at a separate point in time, i.e., comparing cancer cohort 1 with
healthy control cohort 1 and, subsequently, validating metabolic differences by comparing cancer
cohort 2 with healthy control cohort 2. One possible reason to that none of these “validated” biomarkers
have reached to the clinic yet is that there is no mechanistic explanation for their presence and this
lack of biochemical understanding makes the “clinic” reluctant to perform further costly validations,
clinical trials and implementation. If the number of studies or “validations” supporting an association
between a biomarker and a specific type of cancer was then sole driver for clinical implementation,
metabolites frequently associated with that cancer should attract clinical interest. We tested this
hypothesis by querying (https://pubmed.gov) using the words “breast cancer”, “biomarker”, and
“metabolomics”. We found 69 studies using metabolomics that were associating annotated metabolites
with breast cancer in some sense in either clinical patient material or cellular models. We subsequently
grouped the resulting table by the number of reports a specific metabolite is associated with breast
cancer. The result for all metabolites reported at least twice is shown in Table 3. The amino acid
glutamate comes out at the top with 13 reports. Is glutamate a good biomarker candidate for diagnosis
of breast cancer? Most likely not. Altered biofluid glutamate levels is also associated with seizures
in Wilson’s disease [86], cardiopulmonary bypass in infants [87], probable Alzheimer’s disease and
depression [88], the relationship between lung cancer and chronic obstructive pulmonary disease [89],
and multiple sclerosis [90], to mention just a very small subset of reports on glutamate association
with various pathology. Mechanistically, glutamate could be associated with cancers in terms of
increased glutaminolysis (cancer cells dependency of extracellular glutamine) which through the
action of glutaminase enzyme, converting glutamine to glutamate (Figure 1c). But, since glutamate
clearly is associated with many other pathologies, the observations of altered glutamate levels in cancer
patients is most likely mechanistically not directly linked to the cancer itself, but rather to secondary
biochemical events such as inflammatory responses and thus not interesting to pursuit for further
clinical validation of its role in the cancer context.Int. J. Mol. Sci. 2019, 20, 1385 9 of 18
Table 3. Query https://pubmed.gov using keywords “metabolomics”, “breast cancer”, and “biomarker”.
Sorting metabolites reported by frequency.
Number of
Metabolites (Deregulated) Sample Type References
Reports
Glutamate 13 Plasma, Serum, Tissue, Cells [91–103]
Lactate 12 Plasma, Serum, Tissue, Cells [91,94,98,104–111]
Phosphatidylcholines (PCs) 12 Saliva, Blood, Plasma, Tissue, Cells [97,105,108,112–120]
Plasma, Serum, Blood, Tissue, Pleural
Alanine 9 [94,95,97,103,106,121–124]
and Peritoneal effusions, Cells
Taurine 9 Saliva, Serum, Plasma, Tissue, Cells [93,95,97,105,108,112,125–127]
Phenylalanine 7 Serum, Urine [94,96,98,101,128–130]
Histidine 7 Plasma, Serum, Whole blood [91,96,98,103,106,130,131]
Choline 6 Serum, Tissue, Cells [91,94,97,108,118,132]
Lysophosphatidylcholine
6 Saliva, Serum, Plasma [117,120,122,133–135]
(LPCs)
Creatine 6 Serum, Urine, Tissue, Cells [94,97,108,109,118,136]
Serum, Plasma, Tissue, Pleural and
Glucose 6 [100,101,112,124,129,131]
Peritoneal effusions
Glycerophosphocholine (GPC) 6 Serum, Ductal fluid, Tissue, Cells [108,116,118,133,137,138]
Proline 6 Serum, Plasma, Cells [91,94,103,122,129,136]
Glycine 5 Serum, Tissue [94,98,104,108,112]
Threonine 5 Serum, Plasma, Cells [97,102,106,130,139]
Tyrosine 5 Serum, Urine, Cells [91,94,98,128,136]
Isoleucine 4 Serum, Cells [94,98,106,139]
Lysine 4 Saliva, Serum, Plasma, Blood, Tissue [100,123,126,129]
Tryptophan 4 Serum, Plasma, Urine [102,128,133,140]
Acetate 3 Serum, Urine, Cells [94,97,109]
Arginine 3 Serum, Plasma, Cells [77,141,142]
Caproic acid 3 Blood, Plasma, Urine [125,143,144]
Glutamine 3 Serum, Cells [97,136,139]
Guanidinoacetate 3 Tissue, Cells [97,105,145]
Sarcosine 3 Plasma, Tissue, Cells [103,136,146]
Succinate 3 Tissue, Urine [109,121,147]
Valine 3 Plasma, Cells [98,106,122]
β-hydroxybutyrate 2 Serum [91,94]
Aspartate 2 Serum, Plasma [95,148]
Carnitine 2 Ductal fluid, Cells [136,137]
Citrate 2 Serum, Cells [94,138]
Cysteine 2 Serum, Cells [133,136]
Formate 2 Serum [91,94]
Leucine 2 Serum [94,98]
Myo-inositol 2 Tissue, Cells [97,108]
Serum, Pleural and Peritoneal
Pyruvate 2 [96,124]
effusions
Serine 2 Serum, Cells [133,136]
Spermidine 2 Serum, Cells [140,149]
Based on Table 3, it seems as if a significant number of deregulated metabolites in cancer samples
were reported extensively, yet none have translated to the clinic and assuming their biochemical
specificity towards tumor development is most likely an oversimplification for several reasons:Int. J. Mol. Sci. 2019, 20, 1385 10 of 18
(i) flawed understanding in differentiating tumor versus normal metabolites/metabolite levels and (ii)
unavailability of multidisciplinary approach to understand the cancer metabolism that can directly or
indirectly relate to the root of the pathological gene regulation.
4. Future Prospects for Exploiting the Altered Cancer Metabolism as Drug Target and Biomarker
The altered cancer metabolism offers obvious drug targets and is a potential source of biomarkers.
It is a bit strange that cancer cells addiction to glutamine (known since 1956) and necessity for exporting
lactate (known since Warburg’s discovery 1923) has not been subject to clinical trials until 2018 with
CB- 839 and AZD-3965, respectively. Clearly, there is still a lot of drug discovery to be made in the
well-known areas of unique cancer metabolism.
Life cannot sustain too large deviations from an ideal metabolism. Homeostatic mechanisms
maintain this ideal metabolism during cell division and under conditions of changes in nutrient and
oxygen supply. The differences that we can expect to find when comparing cancer cells and normal
cells is how this homeostasis is maintained through altered fluxes and alternative metabolic routes.
Identifying differences further away from central aspects such as aerobic glycolysis and glutamine
addiction may provide better therapeutic windows. The homeostatic mechanisms complicate discovery
as quantitative differences may not be apparent and, to address this, global flux probing methods are
being developed [42,43,150–152]. From a basic understanding of cancer cell nutrient requirements,
it could be worth revisiting classical experiments [34,36] investigating cellular needs with more
powerful metabolomics and flux techniques available today.
The quest for metabolic biomarkers of cancer has been intense over the last decade. One possible
explanation to the lack of metabolic biomarker panels being evaluated in clinical trials so far is that
many of the proposed biomarkers lack clear and proven mechanistic link to the cancer metabolism.
Identification of metabolic blood biomarkers directly in patient samples is apparently difficult. This can
be rationalized by considering that tumors are small relative to the rest of the body and that a unique
cancer metabolic profile leaking out into the blood easily can get masked by the same metabolites
leaking out from normal cells of slightly different proportions. The unique tumor profile will become
diluted in the blood. It is also conceivable that innate immune responses further masks tumor specificity.
However, if we look how metabolic biomarkers for other diseases were developed, it appears as if
the biomarker and its detection were developed from known pathological biochemistry. For example,
the discovery of Helicobacter pylori expressing urease [153] and the subsequent exploitation of urease
activity for developing a stable isotope labeled urea test and for detecting the labeled CO2 arising from
the urease activity [154]. With the powerful analytical technology available today, cancer biologists
should join with analytical chemists to explore strategies for employing well characterized cancer
biochemistry for diagnosis. It would be unfortunate to have a scenario like for phenylketonuria (PKU)
diagnosis for which 30 years passed between discovery of the pathological biochemistry and a reliable
diagnostic test [155,156].
Funding: The Kempe Foundation is acknowledged for financial support (JCK-1621).
Conflicts of Interest: The authors declare no conflict of interest.
References
1. Westerterp, K.R.; Verboeket-van de Venne, W.P.; Bouten, C.V.; de Graaf, C.; van het Hof, K.H.; Weststrate, J.A.
Energy expenditure and physical activity in subjects consuming full-or reduced-fat products as part of their
normal diet. Br. J. Nutr. 1996, 76, 785–795. [CrossRef] [PubMed]
2. Westerterp, K.R. Physical activity and physical activity induced energy expenditure in humans:
Measurement, determinants, and effects. Front. Physiol. 2013, 4, 90. [CrossRef] [PubMed]
3. Zaslaver, A.; Mayo, A.E.; Rosenberg, R.; Bashkin, P.; Sberro, H.; Tsalyuk, M.; Surette, M.G.; Alon, U.
Just-in-time transcription program in metabolic pathways. Nat. Genet. 2004, 36, 486–491. [CrossRef]
4. Cederbaum, S. Phenylketonuria: An update. Curr. Opin. Pediatr. 2002, 14, 702–706. [CrossRef]Int. J. Mol. Sci. 2019, 20, 1385 11 of 18
5. Emmett, M. Acetaminophen toxicity and 5-oxoproline (pyroglutamic acid): A tale of two cycles, one an
ATP-depleting futile cycle and the other a useful cycle. Clin. J. Am. Soc. Nephrol. 2014, 9, 191–200. [CrossRef]
6. Papazyan, R.; Sun, Z.; Kim, Y.H.; Titchenell, P.M.; Hill, D.A.; Lu, W.; Damle, M.; Wan, M.; Zhang, Y.;
Briggs, E.R.; et al. Physiological Suppression of Lipotoxic Liver Damage by Complementary Actions of
HDAC3 and SCAP/SREBP. Cell Metab. 2016, 24, 863–874. [CrossRef]
7. Staubert, C.; Broom, O.J.; Nordstrom, A. Hydroxycarboxylic acid receptors are essential for breast cancer
cells to control their lipid/fatty acid metabolism. Oncotarget 2015, 6, 19706–19720. [CrossRef] [PubMed]
8. Garbarino, J.; Sturley, S.L. Saturated with fat: New perspectives on lipotoxicity. Curr. Opin. Clin. Nutr. Metab.
Care 2009, 12, 110–116. [CrossRef] [PubMed]
9. Wilson, D.F. Regulation of cellular metabolism: Programming and maintaining metabolic homeostasis.
J. Appl. Physiol. (1985) 2013, 115, 1583–1588. [CrossRef]
10. Hochachka, P.W.; McClelland, G.B. Cellular metabolic homeostasis during large-scale change in ATP turnover
rates in muscles. J. Exp. Biol. 1997, 200 Pt 2, 381–386.
11. Lieberthal, W.; Menza, S.A.; Levine, J.S. Graded ATP depletion can cause necrosis or apoptosis of cultured
mouse proximal tubular cells. Am. J. Physiol. 1998, 274 Pt 2, F315–F327. [CrossRef]
12. Yoon, M.J.; Lee, H.J.; Kim, J.H.; Kim, D.K. Extracellular ATP induces apoptotic signaling in human monocyte
leukemic cells, HL-60 and F-36P. Arch. Pharm. Res. 2006, 29, 1032–1041. [CrossRef]
13. Eguchi, Y.; Shimizu, S.; Tsujimoto, Y. Intracellular ATP levels determine cell death fate by apoptosis or
necrosis. Cancer Res. 1997, 57, 1835–1840.
14. Wilson, D.F.; Stubbs, M.; Veech, R.L.; Erecinska, M.; Krebs, H.A. Equilibrium relations between the
oxidation-reduction reactions and the adenosine triphosphate synthesis in suspensions of isolated liver cells.
Biochem. J. 1974, 140, 57–64. [CrossRef] [PubMed]
15. Owen, O.E.; Kalhan, S.C.; Hanson, R.W. The key role of anaplerosis and cataplerosis for citric acid cycle
function. J. Biol. Chem. 2002, 277, 30409–30412. [CrossRef]
16. Gibala, M.J.; Young, M.E.; Taegtmeyer, H. Anaplerosis of the citric acid cycle: Role in energy metabolism of
heart and skeletal muscle. Acta Physiol. Scand. 2000, 168, 657–665. [CrossRef]
17. Schwartz, L.; Supuran, C.T.; Alfarouk, K.O. The Warburg Effect and the Hallmarks of Cancer. Anticancer
Agents Med. Chem. 2017, 17, 164–170. [CrossRef] [PubMed]
18. Ahn, E.; Kumar, P.; Mukha, D.; Tzur, A.; Shlomi, T. Temporal fluxomics reveals oscillations in TCA cycle flux
throughout the mammalian cell cycle. Mol. Syst. Biol. 2017, 13, 953. [CrossRef]
19. Reina-Campos, M.; Moscat, J.; Diaz-Meco, M. Metabolism shapes the tumor microenvironment. Curr. Opin.
Cell Biol. 2017, 48, 47–53. [CrossRef]
20. Kimmelman, A.C.; White, E. Autophagy and Tumor Metabolism. Cell Metab. 2017, 25, 1037–1043. [CrossRef]
21. Dalgliesh, C.E.; Horning, E.C.; Horning, M.G.; Knox, K.L.; Yarger, K. A gas-liquid-chromatographic
procedure for separating a wide range of metabolites occuring in urine or tissue extracts. Biochem. J. 1966,
101, 792–810. [CrossRef] [PubMed]
22. Horning, E.C.; Horning, M.G. Metabolic profiles: Gas-phase methods for analysis of metabolites. Clin. Chem.
1971, 17, 802–809. [PubMed]
23. Pauling, L.; Robinson, A.B.; Teranishi, R.; Cary, P. Quantitative analysis of urine vapor and breath by
gas-liquid partition chromatography. Proc. Natl. Acad. Sci. USA 1971, 68, 2374–2376. [CrossRef] [PubMed]
24. Oliver, S.G.; Winson, M.K.; Kell, D.B.; Baganz, F. Systematic functional analysis of the yeast genome. Trends
Biotechnol. 1998, 16, 373–378. [CrossRef]
25. Fiehn, O.; Kopka, J.; Dormann, P.; Altmann, T.; Trethewey, R.N.; Willmitzer, L. Metabolite profiling for plant
functional genomics. Nat. Biotechnol. 2000, 18, 1157–1161. [CrossRef] [PubMed]
26. Raamsdonk, L.M.; Teusink, B.; Broadhurst, D.; Zhang, N.; Hayes, A.; Walsh, M.C.; Berden, J.A.; Brindle, K.M.;
Kell, D.B.; Rowland, J.J.; et al. A functional genomics strategy that uses metabolome data to reveal the
phenotype of silent mutations. Nature biotechnology 2001, 19, 45–50. [CrossRef] [PubMed]
27. Hakimi, A.A.; Reznik, E.; Lee, C.H.; Creighton, C.J.; Brannon, A.R.; Luna, A.; Aksoy, B.A.; Liu, E.M.; Shen, R.;
Lee, W.; et al. An Integrated Metabolic Atlas of Clear Cell Renal Cell Carcinoma. Cancer Cell 2016, 29, 104–116.
[CrossRef] [PubMed]
28. Makarov, A.; Denisov, E.; Kholomeev, A.; Balschun, W.; Lange, O.; Strupat, K.; Horning, S. Performance
evaluation of a hybrid linear ion trap/orbitrap mass spectrometer. Anal. Chem. 2006, 78, 2113–2120. [CrossRef]Int. J. Mol. Sci. 2019, 20, 1385 12 of 18
29. Smith, C.A.; Want, E.J.; O’Maille, G.; Abagyan, R.; Siuzdak, G. XCMS: Processing mass spectrometry data for
metabolite profiling using nonlinear peak alignment, matching, and identification. Anal. Chem. 2006, 78,
779–787. [CrossRef]
30. Chong, J.; Soufan, O.; Li, C.; Caraus, I.; Li, S.; Bourque, G.; Wishart, D.S.; Xia, J. MetaboAnalyst 4.0: Towards
more transparent and integrative metabolomics analysis. Nucleic Acids Res. 2018, 46, W486–W494. [CrossRef]
31. Karp, P.D.; Billington, R.; Caspi, R.; Fulcher, C.A.; Latendresse, M.; Kothari, A.; Keseler, I.M.; Krummenacker, M.;
Midford, P.E.; Ong, Q.; et al. The BioCyc collection of microbial genomes and metabolic pathways.
Brief Bioinform. 2017. [CrossRef]
32. Guijas, C.; Montenegro-Burke, J.R.; Domingo-Almenara, X.; Palermo, A.; Warth, B.; Hermann, G.;
Koellensperger, G.; Huan, T.; Uritboonthai, W.; Aisporna, A.E.; et al. METLIN: A Technology Platform for
Identifying Knowns and Unknowns. Anal. Chem. 2018, 90, 3156–3164. [CrossRef]
33. Otto, A.M. Warburg effect(s)-a biographical sketch of Otto Warburg and his impacts on tumor metabolism.
Cancer Metab. 2016, 4, 5. [CrossRef] [PubMed]
34. Eagle, H. The minimum vitamin requirements of the L and HeLa cells in tissue culture, the production of
specific vitamin deficiencies, and their cure. J. Exp. Med. 1955, 102, 595–600. [CrossRef]
35. Yang, L.; Venneti, S.; Nagrath, D. Glutaminolysis: A Hallmark of Cancer Metabolism. Annu. Rev. Biomed. Eng.
2017, 19, 163–194. [CrossRef] [PubMed]
36. Eagle, H.; Oyama, V.I.; Levy, M.; Horton, C.L.; Fleischman, R. The growth response of mammalian cells in
tissue culture to L-glutamine and L-glutamic acid. J. Biol. Chem. 1956, 218, 607–616. [PubMed]
37. Medes, G.; Friedmann, B.; Weinhouse, S. Fatty acid metabolism. VIII. Acetate metabolism in vitro during
hepatocarcinogenesis by p-dimethylaminoazobenzene. Cancer Res. 1956, 16, 57–62.
38. Schug, Z.T.; Vande Voorde, J.; Gottlieb, E. The metabolic fate of acetate in cancer. Nat. Rev. Cancer 2016, 16,
708–717. [CrossRef]
39. Li, K.; Naviaux, J.C.; Bright, A.T.; Wang, L.; Naviaux, R.K. A robust, single-injection method for targeted,
broad-spectrum plasma metabolomics. Metabolomics 2017, 13, 122. [CrossRef] [PubMed]
40. Yip, W.C.Y.; Sequeira, I.R.; Plank, L.D.; Poppitt, S.D. Prevalence of Pre-Diabetes across Ethnicities: A Review
of Impaired Fasting Glucose (IFG) and Impaired Glucose Tolerance (IGT) for Classification of Dysglycaemia.
Nutrients 2017, 9, 1273. [CrossRef] [PubMed]
41. Zhao, X.; Peter, A.; Fritsche, J.; Elcnerova, M.; Fritsche, A.; Haring, H.U.; Schleicher, E.D.; Xu, G.; Lehmann, R.
Changes of the plasma metabolome during an oral glucose tolerance test: Is there more than glucose to look
at? Am. J. Physiol. Endocrinol. Metab. 2009, 296, E384–E393. [CrossRef]
42. Buescher, J.M.; Antoniewicz, M.R.; Boros, L.G.; Burgess, S.C.; Brunengraber, H.; Clish, C.B.; DeBerardinis, R.J.;
Feron, O.; Frezza, C.; Ghesquiere, B.; et al. A roadmap for interpreting (13)C metabolite labeling patterns
from cells. Curr. Opin. Biotechnol. 2015, 34, 189–201. [CrossRef]
43. Jang, C.; Chen, L.; Rabinowitz, J.D. Metabolomics and Isotope Tracing. Cell 2018, 173, 822–837. [CrossRef]
44. Wiechert, W. 13C metabolic flux analysis. Metab. Eng. 2001, 3, 195–206. [CrossRef]
45. Sun, J.; Wei, Q.; Zhou, Y.; Wang, J.; Liu, Q.; Xu, H. A systematic analysis of FDA-approved anticancer drugs.
BMC Syst. Biol. 2017, 11 (Suppl. 5), 87. [CrossRef]
46. Semba, R.D. The discovery of the vitamins. Int. J. Vitam. Nutr. Res. 2012, 82, 310–315. [CrossRef]
47. Laszlo, D.; Leuchtenberger, C. Inositol a Tumor Growth Inhibitor. Science 1943, 97, 515. [CrossRef]
48. Leuchtenberger, C.; Lewisohn, R.; Laszlo, D.; Leuchtenberger, R. “Folic Acid” a Tumor Growth Inhibitor.
Exp. Biol. Med. 1944, 55, 204–205. [CrossRef]
49. Leuchtenberger, R.; Leuchtenberger, C.; Laszlo, D.; Lewisohn, R. The Influence of “Folic Acid” on
Spontaneous Breast Cancers in Mice. Science 1945, 101, 46. [CrossRef]
50. Farber, S.; Cutler, E.C.; Hawkins, J.W.; Harrison, J.H.; Peirce, E.C., 2nd; Lenz, G.G. The Action of
Pteroylglutamic Conjugates on Man. Science 1947, 106, 619–621. [CrossRef]
51. Farber, S.; Diamond, L.K. Temporary remissions in acute leukemia in children produced by folic acid
antagonist, 4-aminopteroyl-glutamic acid. N. Engl. J. Med. 1948, 238, 787–793. [CrossRef]
52. Bonadonna, G.; Brusamolino, E.; Valagussa, P.; Rossi, A.; Brugnatelli, L.; Brambilla, C.; De Lena, M.;
Tancini, G.; Bajetta, E.; Musumeci, R.; et al. Combination chemotherapy as an adjuvant treatment in operable
breast cancer. N. Engl. J. Med. 1976, 294, 405–410. [CrossRef]Int. J. Mol. Sci. 2019, 20, 1385 13 of 18
53. Smolen, J.S.; Landewe, R.; Bijlsma, J.; Burmester, G.; Chatzidionysiou, K.; Dougados, M.; Nam, J.; Ramiro, S.;
Voshaar, M.; van Vollenhoven, R.; et al. EULAR recommendations for the management of rheumatoid
arthritis with synthetic and biological disease-modifying antirheumatic drugs: 2016 update. Ann. Rheum. Dis.
2017, 76, 960–977. [CrossRef]
54. Kidd, J.G. Regression of transplanted lymphomas induced in vivo by means of normal guinea pig serum. I.
Course of transplanted cancers of various kinds in mice and rats given guinea pig serum, horse serum, or
rabbit serum. J. Exp. Med. 1953, 98, 565–582. [CrossRef]
55. Broome, J.D. Evidence that the L-asparaginase of guinea pig serum is responsible for its antilymphoma
effects. I. Properties of the L-asparaginase of guinea pig serum in relation to those of the antilymphoma
substance. J. Exp. Med. 1963, 118, 99–120. [CrossRef]
56. Broome, J.D. Evidence that the L-asparaginase of guinea pig serum is responsible for its antilymphoma
effects. II. Lymphoma 6C3HED cells cultured in a medium devoid of L-asparagine lose their susceptibility to
the effects of guinea pig serum in vivo. J. Exp. Med. 1963, 118, 121–148. [CrossRef]
57. Ralser, M.; Wamelink, M.M.; Struys, E.A.; Joppich, C.; Krobitsch, S.; Jakobs, C.; Lehrach, H. A catabolic block
does not sufficiently explain how 2-deoxy-D-glucose inhibits cell growth. Proc. Natl. Acad. Sci. USA 2008,
105, 17807–17811. [CrossRef]
58. Mohanti, B.K.; Rath, G.K.; Anantha, N.; Kannan, V.; Das, B.S.; Chandramouli, B.A.; Banerjee, A.K.; Das, S.;
Jena, A.; Ravichandran, R.; et al. Improving cancer radiotherapy with 2-deoxy-D-glucose: Phase I/II clinical
trials on human cerebral gliomas. Int. J. Radiat. Oncol. Biol. Phys. 1996, 35, 103–111. [CrossRef]
59. Singh, D.; Banerji, A.K.; Dwarakanath, B.S.; Tripathi, R.P.; Gupta, J.P.; Mathew, T.L.; Ravindranath, T.;
Jain, V. Optimizing cancer radiotherapy with 2-deoxy-d-glucose dose escalation studies in patients with
glioblastoma multiforme. Strahlenther. Onkol. 2005, 181, 507–514. [CrossRef]
60. Raez, L.E.; Papadopoulos, K.; Ricart, A.D.; Chiorean, E.G.; Dipaola, R.S.; Stein, M.N.; Rocha Lima, C.M.;
Schlesselman, J.J.; Tolba, K.; Langmuir, V.K.; et al. A phase I dose-escalation trial of 2-deoxy-D-glucose alone
or combined with docetaxel in patients with advanced solid tumors. Cancer Chemother. Pharmacol. 2013, 71,
523–530. [CrossRef]
61. Curtis, N.J.; Mooney, L.; Hopcroft, L.; Michopoulos, F.; Whalley, N.; Zhong, H.; Murray, C.; Logie, A.;
Revill, M.; Byth, K.F.; et al. Pre-clinical pharmacology of AZD3965, a selective inhibitor of MCT1: DLBCL,
NHL and Burkitt’s lymphoma anti-tumor activity. Oncotarget 2017, 8, 69219–69236. [CrossRef]
62. Abou-Alfa, G.K.; Qin, S.; Ryoo, B.Y.; Lu, S.N.; Yen, C.J.; Feng, Y.H.; Lim, H.Y.; Izzo, F.; Colombo, M.;
Sarker, D.; et al. Phase III randomized study of second line ADI-PEG 20 plus best supportive care versus
placebo plus best supportive care in patients with advanced hepatocellular carcinoma. Ann. Oncol. 2018, 29,
1402–1408. [CrossRef]
63. Tsai, H.J.; Jiang, S.S.; Hung, W.C.; Borthakur, G.; Lin, S.F.; Pemmaraju, N.; Jabbour, E.; Bomalaski, J.S.;
Chen, Y.P.; Hsiao, H.H.; et al. A Phase II Study of Arginine Deiminase (ADI-PEG20) in Relapsed/Refractory
or Poor-Risk Acute Myeloid Leukemia Patients. Sci. Rep. 2017, 7, 11253. [CrossRef]
64. Lowery, M.A.; Yu, K.H.; Kelsen, D.P.; Harding, J.J.; Bomalaski, J.S.; Glassman, D.C.; Covington, C.M.;
Brenner, R.; Hollywood, E.; Barba, A.; et al. A phase 1/1B trial of ADI-PEG 20 plus nab-paclitaxel and
gemcitabine in patients with advanced pancreatic adenocarcinoma. Cancer 2017, 123, 4556–4565. [CrossRef]
65. Lee, D.; Xu, I.M.; Chiu, D.K.; Lai, R.K.; Tse, A.P.; Lee, L.L.; Law, C.T.; Tsang, F.H.; Wei, L.L.; Chan, C.Y.; et al.
Folate cycle enzyme MTHFD1L confers metabolic advantages in hepatocellular carcinoma. J. Clin. Investig.
2017, 127, 1856–1872. [CrossRef]
66. Touzart, A.; Lengline, E.; Latiri, M.; Belhocine, M.; Smith, C.; Thomas, X.; Spicuglia, S.; Puthier, D.; Pflumio, F.;
Leguay, T.; et al. Epigenetic silencing affects L-asparaginase sensitivity and predicts outcome in T-ALL.
Clin. Cancer. Res. 2019. [CrossRef]
67. Yizhak, K.; Gaude, E.; Le Devedec, S.; Waldman, Y.Y.; Stein, G.Y.; van de Water, B.; Frezza, C.; Ruppin, E.
Phenotype-based cell-specific metabolic modeling reveals metabolic liabilities of cancer. Elife 2014, 3.
[CrossRef]
68. Apaolaza, I.; San Jose-Eneriz, E.; Tobalina, L.; Miranda, E.; Garate, L.; Agirre, X.; Prosper, F.; Planes, F.J.
An in-silico approach to predict and exploit synthetic lethality in cancer metabolism. Nat. Commun. 2017, 8,
459. [CrossRef]Int. J. Mol. Sci. 2019, 20, 1385 14 of 18
69. Pey, J.; San Jose-Eneriz, E.; Ochoa, M.C.; Apaolaza, I.; de Atauri, P.; Rubio, A.; Cendoya, X.; Miranda, E.;
Garate, L.; Cascante, M.; et al. In-silico gene essentiality analysis of polyamine biosynthesis reveals APRT as
a potential target in cancer. Sci. Rep. 2017, 7, 14358. [CrossRef]
70. Thiele, I.; Swainston, N.; Fleming, R.M.; Hoppe, A.; Sahoo, S.; Aurich, M.K.; Haraldsdottir, H.; Mo, M.L.;
Rolfsson, O.; Stobbe, M.D.; et al. A community-driven global reconstruction of human metabolism.
Nat. Biotechnol. 2013, 31, 419–425. [CrossRef]
71. Lv, W.W.; Liu, D.; Liu, X.C.; Feng, T.N.; Li, L.; Qian, B.Y.; Li, W.X. Effects of PKM2 on global metabolic
changes and prognosis in hepatocellular carcinoma: From gene expression to drug discovery. BMC Cancer
2018, 18, 1150. [CrossRef]
72. Cantor, J.R.; Abu-Remaileh, M.; Kanarek, N.; Freinkman, E.; Gao, X.; Louissaint, A., Jr.; Lewis, C.A.;
Sabatini, D.M. Physiologic Medium Rewires Cellular Metabolism and Reveals Uric Acid as an Endogenous
Inhibitor of UMP Synthase. Cell 2017, 169, 258–272.e17. [CrossRef]
73. Li, X.; Chung, A.C.K.; Li, S.; Wu, L.; Xu, J.; Yu, J.; Wong, C.; Cai, Z. LC-MS-based metabolomics revealed
SLC25A22 as an essential regulator of aspartate-derived amino acids and polyamines in KRAS-mutant
colorectal cancer. Oncotarget 2017, 8, 101333–101344. [CrossRef]
74. Birsoy, K.; Possemato, R.; Lorbeer, F.K.; Bayraktar, E.C.; Thiru, P.; Yucel, B.; Wang, T.; Chen, W.W.; Clish, C.B.;
Sabatini, D.M. Metabolic determinants of cancer cell sensitivity to glucose limitation and biguanides. Nature
2014, 508, 108–112. [CrossRef]
75. Lee, J.; Shin, D.; Roh, J.L. Development of an in vitro cell-sheet cancer model for chemotherapeutic screening.
Theranostics 2018, 8, 3964–3973. [CrossRef] [PubMed]
76. Gunda, V.; Yu, F.; Singh, P.K. Validation of Metabolic Alterations in Microscale Cell Culture Lysates Using
Hydrophilic Interaction Liquid Chromatography (HILIC)-Tandem Mass Spectrometry-Based Metabolomics.
PLoS ONE 2016, 11, e0154416. [CrossRef]
77. Kus, K.; Kij, A.; Zakrzewska, A.; Jasztal, A.; Stojak, M.; Walczak, M.; Chlopicki, S. Alterations in arginine and
energy metabolism, structural and signalling lipids in metastatic breast cancer in mice detected in plasma by
targeted metabolomics and lipidomics. Breast Cancer Res. 2018, 20, 148. [CrossRef]
78. Teoh, S.T.; Ogrodzinski, M.P.; Ross, C.; Hunter, K.W.; Lunt, S.Y. Sialic Acid Metabolism: A Key Player in
Breast Cancer Metastasis Revealed by Metabolomics. Front. Oncol. 2018, 8, 174. [CrossRef]
79. Momcilovic, M.; Bailey, S.T.; Lee, J.T.; Fishbein, M.C.; Braas, D.; Go, J.; Graeber, T.G.; Parlati, F.; Demo, S.;
Li, R.; et al. The GSK3 Signaling Axis Regulates Adaptive Glutamine Metabolism in Lung Squamous Cell
Carcinoma. Cancer Cell 2018, 33, 905–921.e5. [CrossRef]
80. Pore, N.; Jalla, S.; Liu, Z.; Higgs, B.; Sorio, C.; Scarpa, A.; Hollingsworth, R.; Tice, D.A.; Michelotti, E. In Vivo
Loss of Function Screening Reveals Carbonic Anhydrase IX as a Key Modulator of Tumor Initiating Potential
in Primary Pancreatic Tumors. Neoplasia 2015, 17, 473–480. [CrossRef]
81. Lindahl, A.; Forshed, J.; Nordstrom, A. Overlap in serum metabolic profiles between non-related diseases:
Implications for LC-MS metabolomics biomarker discovery. Biochem. Biophys. Res. Commun. 2016, 478,
1472–1477. [CrossRef]
82. Anderson, B.W.; Suh, Y.S.; Choi, B.; Lee, H.J.; Yab, T.C.; Taylor, W.R.; Dukek, B.A.; Berger, C.K.; Cao, X.;
Foote, P.H.; et al. Detection of Gastric Cancer with Novel Methylated DNA Markers: Discovery, Tissue
Validation, and Pilot Testing in Plasma. Clin. Cancer. Res. 2018, 24, 5724–5734. [CrossRef] [PubMed]
83. Cohen, J.D.; Li, L.; Wang, Y.; Thoburn, C.; Afsari, B.; Danilova, L.; Douville, C.; Javed, A.A.; Wong, F.;
Mattox, A.; et al. Detection and localization of surgically resectable cancers with a multi-analyte blood test.
Science 2018, 359, 926–930. [CrossRef] [PubMed]
84. Ahlquist, D.A. Universal cancer screening: Revolutionary, rational, and realizable. NPJ Precis. Oncol. 2018, 2,
23. [CrossRef]
85. Lopez-Lopez, A.; Lopez-Gonzalvez, A.; Barker-Tejeda, T.C.; Barbas, C. A review of validated biomarkers
obtained through metabolomics. Expert Rev. Mol. Diagn. 2018, 18, 557–575. [CrossRef] [PubMed]
86. Kalita, J.; Misra, U.K.; Kumar, V.; Parashar, V. Predictors of seizure in Wilson disease: A clinico-radiological
and biomarkers study. Neurotoxicology 2018, 71, 87–92. [CrossRef]
87. Davidson, J.A.; Pfeifer, Z.; Frank, B.; Tong, S.; Urban, T.T.; Wischmeyer, P.A.; Mourani, P.; Landeck, B.;
Christians, U.; Klawitter, J. Metabolomic Fingerprinting of Infants Undergoing Cardiopulmonary Bypass:
Changes in Metabolic Pathways and Association With Mortality and Cardiac Intensive Care Unit Length
of Stay. J. Am. Heart Assoc. 2018, 7, e010711. [CrossRef] [PubMed]You can also read