Membrane Stresses Induced by Overproduction of Free Fatty Acids - CORE
←
→
Page content transcription
If your browser does not render page correctly, please read the page content below
APPLIED AND ENVIRONMENTAL MICROBIOLOGY, Nov. 2011, p. 8114–8128 Vol. 77, No. 22
0099-2240/11/$12.00 doi:10.1128/AEM.05421-11
Copyright © 2011, American Society for Microbiology. All Rights Reserved.
Membrane Stresses Induced by Overproduction of Free Fatty Acids
in Escherichia coli䌤†
Rebecca M. Lennen,1,2 Max A. Kruziki,1 Kritika Kumar,1 Robert A. Zinkel,2,3 Kristin E. Burnum,2,4
Mary S. Lipton,2,4 Spencer W. Hoover,2 Don R. Ranatunga,2 Tyler M. Wittkopp,2
Wesley D. Marner II,2 and Brian F. Pfleger1,2*
Department of Chemical and Biological Engineering; University of Wisconsin—Madison, 1415 Engineering Drive, Madison,
Wisconsin 537061; U.S. Department of Energy Great Lakes Bioenergy Research Center, University of Wisconsin—Madison,
1550 Linden Drive, Madison, Wisconsin 537062; University of Wisconsin Biotechnology Center, 425 Henry Mall,
Madison, Wisconsin 537063; and Biological Sciences Division, Pacific Northwest
Downloaded from http://aem.asm.org/ on November 7, 2020 by guest
National Laboratory, Richland, Washington 993534
Received 9 May 2011/Accepted 15 September 2011
Microbially produced fatty acids are potential precursors to high-energy-density biofuels, including alkanes
and alkyl ethyl esters, by either catalytic conversion of free fatty acids (FFAs) or enzymatic conversion of
acyl-acyl carrier protein or acyl-coenzyme A intermediates. Metabolic engineering efforts aimed at overpro-
ducing FFAs in Escherichia coli have achieved less than 30% of the maximum theoretical yield on the supplied
carbon source. In this work, the viability, morphology, transcript levels, and protein levels of a strain of E. coli
that overproduces medium-chain-length FFAs was compared to an engineered control strain. By early sta-
tionary phase, an 85% reduction in viable cell counts and exacerbated loss of inner membrane integrity were
observed in the FFA-overproducing strain. These effects were enhanced in strains endogenously producing
FFAs compared to strains exposed to exogenously fed FFAs. Under two sets of cultivation conditions, long-
chain unsaturated fatty acid content greatly increased, and the expression of genes and proteins required for
unsaturated fatty acid biosynthesis were significantly decreased. Membrane stresses were further implicated
by increased expression of genes and proteins of the phage shock response, the MarA/Rob/SoxS regulon, and
the nuo and cyo operons of aerobic respiration. Gene deletion studies confirmed the importance of the phage
shock proteins and Rob for maintaining cell viability; however, little to no change in FFA titer was observed
after 24 h of cultivation. The results of this study serve as a baseline for future targeted attempts to improve
FFA yields and titers in E. coli.
Microbially derived free fatty acids (FFAs) are attractive acyl-acyl carrier protein (ACP) thioesterases and deletion of
intermediates for producing a wide range of high-energy-den- fadD, or both fadD and fadE, which encode an acyl-coenzyme
sity biofuels from sustainable carbon sources, such as biomass A (CoA) synthetase and acyl-CoA dehydrogenase, respec-
(34). FFAs can be extracted from culture medium and catalyt- tively. Overexpression of an acyl-ACP thioesterase depletes
ically converted to esters or alkanes (48, 55). Alternatively, the level of acyl-ACP intermediates, which inhibit via feedback
enzymatic pathways exist for intracellular conversion to esters enzymes of fatty acid biosynthesis (19, 36). Deletion of fadD
(42, 81), olefins (10, 59, 75), alkanes (78), or fatty aldehydes and/or fadE eliminates catabolism of fatty acids by the aerobic
and fatty alcohols (22, 81, 82). These pathways can either be -oxidation pathway (43, 65). The additional overexpression of
exploited in their native host or heterologously expressed in a the native E. coli acetyl-CoA carboxylase (ACC) has been
genetically pliable microorganism (3). The physical and chem- shown to improve fatty acid yields in some metabolically en-
ical properties of the resulting products are dependent on gineered strains (19, 52) but to have little impact in others (48).
chain length and hydrophobicity; however, medium-chain- Reported yields (percentage [wt/wt] of FA from a supplied
length (8- to 14-carbon) methyl esters, olefins, and alkanes carbon source) in the literature from FFA-overproducing E.
exhibit many properties analogous to those of diesel and jet coli are 4.8% in a fed-batch fermentation with glycerol as the
fuel and are therefore potential drop-in replacements (44, 61). sole carbon source (52) and 6% in shake flasks with glucose as
Several studies have demonstrated FFA overproduction in a sole carbon source (81), representing less than 20% of the
Escherichia coli (19, 48, 52, 81, 83). In each, the key strain maximum theoretical yield of FFAs from either glucose or
modifications included overexpression of one or more cytosolic glycerol. In comparison, strains of E. coli have been engineered
to produce ethanol at over 88% of the maximum theoreti-
cal yield (64) and isobutanol at 86% of the maximum theoret-
* Corresponding author. Mailing address: University of Wisconsin— ical yield (8) from glucose. The limitations to achieving higher
Madison, Department of Chemical and Biological Engineering, 3629 yields of FFAs in engineered strains are currently unknown.
Engineering Hall, 1415 Engineering Drive, Madison, WI 53706-1691. Potential metabolic bottlenecks have been identified in in vitro
Phone: (608) 890-1940. Fax: (608) 262-5434. E-mail: pfleger@engr studies by using cell extracts supplemented with additional
.wisc.edu.
† Supplemental material for this article may be found at http://aem
substrates, cofactors, or enzymes involved in FFA biosynthesis
.asm.org/. (50). It is not yet known whether the observed findings, such as
䌤
Published ahead of print on 23 September 2011. a potential limitation in malonyl-CoA levels, translate to
8114VOL. 77, 2011 MEMBRANE STRESS FROM E. COLI FATTY ACID OVERPRODUCTION 8115
TABLE 1. Bacterial strains and plasmids used in this study
Strain or plasmid Relevant genotype or propertya Source or reference
E. coli strains
RL08 K-12 MG1655 ⌬fadD ⌬araBAD 47
DH10B F⫺ mcrA ⌬(mrr-hsdRMS-mcrBC) 80lacZ⌬M15 ⌬lacX74 recA1 endA1 araD139 Invitrogen
⌬(ara leu)7697 galU galK ⫺ rpsL nupG
JW5249-1 F⫺ ⌬(araD-araB)567 ⌬lacZ4787(::rrnB-3) ⫺ ⌬marA752::kan rph-1 ⌬(rhaD-rhaB)568 hsdR514 9
JW4359-1 F⫺ ⌬(araD-araB)567 ⌬lacZ4787(::rrnB-3) ⫺ rph-1 ⌬(rhaD-rhaB)568 hsdR514 ⌬rob-721::kan 9
JW4023-5 F⫺ ⌬(araD-araB)567 ⌬lacZ4787(::rrnB-3) ⫺ rph-1 ⌬(rhaD-rhaB)568 ⌬soxS756::kan hsdR514 9
JW1296-5 F⫺ ⌬(araD-araB)567 ⌬lacZ4787(::rrnB-3) ⫺ ⌬pspF739::kan rph-1 ⌬(rhaD-rhaB)568 hsdR514 9
RL09 K-12 MG1655 ⌬fadD ⌬araBAD marA::kan This study
RL10 K-12 MG1655 ⌬fadD ⌬araBAD rob::kan This study
RL11 K-12 MG1655 ⌬fadD ⌬araBAD soxS::kan This study
RL12 K-12 MG1655 ⌬fadD ⌬araBAD pspF::kan This study
K-12 MG1655 ⌬fadD ⌬araBAD ⌬pspF
Downloaded from http://aem.asm.org/ on November 7, 2020 by guest
RL13 This study
Plasmids
pBAD33 PBAD promoter, pACYC origin, Cmr 32
pBAD33-BTE pBAD33 carrying BTE under PBAD control, Cmr 47
pBAD33-BTE-H204A pBAD33 carring BTE-H204A under PBAD control, Cmr 47
pBAD33-ACC pRL2 carrying accDABC under PBAD control, Cmr 47
pBAD35 PBAD promoter, pBBR-1MCS origin, Kanr 47
pBAD35-BTE pBAD35 carrying BTE under PBAD control, Kanr 47
pBAD35-BTE-H204A pBAD35 carrying BTE-H204A under PBAD control, Kanr 47
pTrc99A Ptrc promoter, pBR322 origin, Ampr 4
pTrc99A-BTE pTrc99a carrying BTE under Ptrc control, Ampr 38
pTrc99A-BTE-H204A pTrc99a carrying BTE-H204A under Ptrc control, Ampr 38
pCP20 Carries yeast FLP recombinase under constitutive promoter, pSC101 origin, cI857⫹, pR 16
Rep(Ts), Ampr Cmr
a
Abbreviations: Amp, ampicillin; Cm, chloramphenicol; Kan, kanamycin; R, resistance; Ts, temperature sensitive.
whole-cell biocatalysts, as we have observed little or no im- oleic acid (C18:1⌬9) (33). Exposure to endogenously produced
provement in FFA titers in acyl-ACP thioesterase-expressing FFAs is anticipated to result in a more severe cellular impact
strains that simultaneously overexpress native E. coli ACC than exogenously added FFAs, as excretion would require first
(48). In addition to metabolic bottlenecks, limitations to pro- traversing the inner membrane and subsequently the periplasm
duction can stem from product inhibition, toxicity, and other with its peptidoglycan network and the outer membrane.
indirect effects (62). In order to understand the mechanisms underlying the ob-
In a previous study, we observed a copy number-dependent served phenotypes, we performed a comparative systems biol-
variation in FFA titers and maximum cell densities by express- ogy study that identified key differences in transcript, protein,
ing an acyl-ACP thioesterase from Umbellularia californica and lipid profiles between an FFA-overproducing strain and a
(84) in a series of plasmids with identical inducible promoters control strain. This study, consisting of a DNA microarray
(48). We postulated that growth inhibition was due either to a analysis coupled to a global liquid chromatography/mass spec-
depletion of acyl-ACPs that reduced the ability of cells to trometry (LC/MS) analysis of cellular peptides and determina-
synthesize phospholipids necessary for growth or was due to tion of the fatty acid profile by gas chromatography/MS (GC/
alteration of membrane integrity as a result of accumulation of MS) as a function of time, represents the first investigation of
FFAs in the cell envelope. In this study, further characteriza- changes in gene expression in E. coli resulting from either
tion was performed on the cellular impacts of endogenous exogenous or endogenous exposure to medium-chain-length
FFA overproduction, including viable cell counts, staining with FFAs. Genes identified in two sets of parallel experiments
the membrane-impermeable SYTOX green nucleic acid dye focused attention on transcriptional responses that were spe-
and forward scatter flow cytometry. Significant losses in cell cific to FFA overproduction. These filtered data sets demon-
viability were observed, beginning in the transition between log strated differential expression of stress regulons and suggested
phase and stationary phase, and were accompanied by in- targets for improving physiology and strain performance.
creased permeability to SYTOX green and drastic changes in
cell morphology. The direct cause of these observations was MATERIALS AND METHODS
not obvious and prevented implementation of directed meta-
Strains, plasmids, enzymes, media, and bacterial cultivation. Strains and
bolic engineering strategies to alleviate toxicity and increase plasmids are listed in Table 1 (see also Table S1 in the supplemental material).
FFA titer and yield. While prior studies have examined the All enzymes used for PCR and cloning were purchased from New England
impact of hydrophobic compounds such as hexane (35) and BioLabs (Ipswich, MA) unless otherwise specified. Oligonucleotides used for
n-butanol (77) on E. coli gene expression, the only previous PCR, cloning, quantitative PCR (qPCR), and verification are listed in Table S2
in the supplemental material. The primary strain used in this work (RL08) was
systems biology study to investigate exposure to FFAs was a E. coli K-12 MG1655 ⌬fadD ⌬araBAD (48). These deletions eliminate aerobic
differential proteomics analysis that identified several proteins -oxidation (⌬fadD) and prevent catabolism of L-arabinose (⌬araBAD), which
with increased expression in the presence of exogenously fed was used as an inducing agent. FFA-overproducing strains were constructed by8116 LENNEN ET AL. APPL. ENVIRON. MICROBIOL.
transforming RL08 with plasmids harboring a codon-optimized acyl-ACP thio- croarray analysis (RMA) background correction, quantile normalization to ad-
esterase from Umbellularia californica (BTE) (84) as described previously (48). just the probe intensity distributions to be the same across all cross-compared
Plasmid pTrc99A-BTE places BTE under the control of the isopropyl--D- arrays, and RMA median polish summarization to generate gene-level signal
thiogalactopyranoside (IPTG)-inducible Ptrc promoter (38). Plasmids pBAD35- values from the normalized probe intensities (12). Mean intensities were deter-
BTE and pBAD33-BTE place BTE under the control of an arabinose-inducible mined across all array and sample technical replicates and then across biological
PBAD promoter (48). A set of control strains was constructed by transforming replicates to yield the final expression values. Linear changes in expression values
RL08 with plasmids harboring a mutated gene encoding a nonfunctional thio- are reported, with P values calculated across biological replicates based on a
esterase (BTE-H204A) as previously described (48). The nonfunctional thioes- moderated t test (79) using the ArrayStar software. Ratios with a change greater
terase was expressed at levels equal to BTE (see Fig. S1 in the supplemental than or equal to ⱍ2-foldⱍ and with P values less than or equal to 0.05 were
material), providing protein overexpression stress to both experimental and considered significant. To generate a filtered list of significantly regulated genes
control strains. Plasmids were introduced by established electroporation proto- found in both the glucose-supplemented and glycerol-supplemented cultures,
cols or by a chemical transformation method (17). significance criteria were relaxed such that the fold change was greater than or
Two sets of functional genomics experiments were conducted under different equal to ⱍ1.8ⱍ and the P value was less than or equal to 0.1 for the glycerol-
cultivation conditions. First, biological triplicate cultures of strain RL08 harbor- supplemented cultures, or 0.05 for the glucose-supplemented cultures.
ing pTrc99A-BTE or pTrc99A-BTE-H204A were grown at 37°C with 250 rpm Quantitative RT-PCR. The cDNA was diluted 10-fold in water, and 5.0 l was
shaking in 2-liter shake flasks containing 500 ml of EZ rich defined medium amplified using the Maxima SYBR green/fluorescein qPCR master mix (Fer-
Downloaded from http://aem.asm.org/ on November 7, 2020 by guest
(Teknova, Hollister, CA) supplemented with 0.2% glucose, 0.01 mM biotin, and mentas, Glen Burnie, MD). For the selected housekeeping gene rrs (encoding
100 g ml⫺1 ampicillin. Cultures were induced at an optical density at 600 nm 16S rRNA), 5.0 l of 100-fold diluted cDNA was used as a template, due to its
(OD600) of 0.2 with a final concentration of 50 M IPTG. Additional experi- high abundance. SYBR green fluorescence was monitored with a Bio-Rad (Her-
ments were conducted in biological duplicates with strain RL08 harboring cules, CA) CFX96 optical reaction module. Threshold cycle (CT) values were
pBAD35-BTE and pBAD33, pBAD35-BTE and pBAD33-ACC, or pBAD35- calculated by using Bio-Rad CFX Manager software, and fold changes were
BTE-H204A and pBAD33, in a single-wall baffled fermentor vessel (Applikon calculated as 2⫺⌬⌬CT with inner normalization to the rrs housekeeping gene (51).
Biotechnology, Schiedam, Netherlands) with a 12-liter working volume contain- Standard deviations of ⌬CT values for three biological triplicates were propa-
ing 4 liters of EZ rich defined medium supplemented with 0.4% glycerol, 0.01 gated to obtain standard errors for each fold change value.
mM biotin, 34 g ml⫺1 chloramphenicol, and 25 g ml⫺1 kanamycin. A tem- Protein sample preparation. For protein isolation, approximately 20 OD600
perature of 37°C, pH 7.0 ⫾ 0.2, and 700 rpm agitation were maintained with an units 䡠 ml of culture was centrifuged as described for RNA isolation. The
ez-Control unit (Applikon Biotechnology). A 5% solution of hydrochloric acid resulting cell pellets were flash-frozen in a dry ice-ethanol bath and stored at
and 2 N sodium hydroxide were utilized for maintaining pH, and a 1:1,000 ⫺80°C. Cells were resuspended in 100 mM ammonium bicarbonate, pH 8.0
dilution of antifoam 204 (Sigma, St. Louis, MO) in water was added as necessary buffer and lysed with a Barocycler NEP3229 using FT500 PULSE tubes (Pressure
to minimize overflow due to foaming. Air was sparged at a flow rate of 4 liters BioSciences Inc., South Easton, MA; 10 cycles; 35,000 lb/in2; 20-s/cycle). Protein
min⫺1. Cultures were induced with 0.2% L-arabinose at an OD600 of 0.2. concentrations of the lysates were determined using a Bradford assay, and 100 g
Cultures sampled for qPCR analysis, flow cytometry, CFU ml⫺1 counts, and of protein was denatured by the addition of 7 M urea and 5 mM dithiothreitol,
microscopy were grown in biological duplicates or triplicates in baffled shake followed by incubation at 60°C for 30 min. The samples were diluted 10-fold with
flasks with a 4⫻ headspace, as described for microarray experiments with RL08/ 100 mM ammonium carbonate, and calcium chloride was added to a final con-
pTrc99A-BTE. Exogenous addition of fatty acids was performed with strains centration of 1 mM. Samples were digested with trypsin (1:50 trypsin/protein
RL08 and RL08/pTrc99A, with 0.5 g liter⫺1 of lauric acid (from a 50-g liter⫺1 ratio) for 3 h at 37°C and desalted using 1-ml, 50-mg Discovery DSC-18 solid-
stock in ethanol) or an equivalent volume of ethanol as a negative control, added phase extraction (SPE) columns (Supelco, St. Louis, MO). Each SPE column was
at an OD600 of 0.1 to 0.2. conditioned using methanol and rinsed with 0.1% trifluoroacetic acid (TFA) in
RNA sample preparation. Samples for RNA isolation for microarray experi- water. Samples were introduced to the columns and washed with 95:5 water/
ments were collected by adding 10 OD600 䡠 ml of culture to a 1/8 volume of a acetonitrile containing 0.1% TFA. Excess liquid was removed from the columns
chilled solution of 5% saturated phenol in absolute ethanol. Deionized water was under vacuum, and samples were eluted using 80:20 acetonitrile/water and 0.1%
added such that the ratio of aqueous solution to phenol-ethanol was constant. TFA and concentrated in a Savant SpeedVac (Thermo Scientific) to a final
After centrifugation (5,000 ⫻ g, 4°C, 12 min), each supernatant was removed, volume of 50 to 100 l. Final peptide concentrations were determined using a
and the remaining cell pellets were flash-frozen in a dry ice-ethanol bath and bicinchoninic acid protein assay.
stored at ⫺80°C. Total RNA was purified from frozen cell pellets using the Peptide analysis by capillary liquid chromatography/mass spectrometry.
Qiagen (Valencia, CA) RNAprotect bacteria reagent kit with lysozyme treat- Identification and quantification of individual peptides was performed by LC-
ment and proteinase K digestion of cell lysates, and purification of total RNA tandem MS (LC-MS/MS). The high-performance liquid chromatography system
was performed with the Qiagen RNeasy minikit as described in the product and method used for capillary LC have been described in detail elsewhere (49).
handbook. MS/MS data acquisition on an LTQ Velos orbitrap mass spectrometer (Thermo
For quantitative reverse transcription-PCR (RT-PCR), 0.8 OD600 䡠 ml of Scientific) began 20 min after sample injection and continued for 100 min over
each culture was centrifuged (16,000 ⫻ g, 1 min), supernatants were removed, a mass (m/z) range of 400 to 2,000. For each cycle, using a dynamic exclusion time
and cell pellets were stored at ⫺80°C. RNA was extracted using the Qiagen of 60 s, the six most abundant ions from MS were selected for MS/MS, using a
RNeasy minikit according to the manufacturer’s instructions. Residual DNA was collision energy setting of 45%.
removed by DNase digestion (DNA-free kit; Ambion, Austin, TX). RNA sam- Proteomics data analysis. Quantitative analysis utilized the PNNL-developed
ples were quantified using a NanoDrop spectrophotometer (Thermo Scientific, accurate mass and time (AMT) tag approach (90) based on a previously estab-
Wilmington, DE), and RNA quality was assessed using an Agilent BioAnalyzer lished AMT tag peptide database for E. coli containing the characteristic accu-
(Agilent Technologies, Santa Clara, CA) using the Prokaryote Total RNA Nano rate mass and LC separation elution time. The end result was a usable list of
series II chip set. quantitative protein identifications for each sample. Tools used for quantitative
cDNA synthesis and hybridization. For microarray hybridization, 10 g of analysis were a visualization program, VIPER (60), to correlate LC/MS features
RNA was used to synthesize cDNA, and 1 g was labeled with Cy3 according to to the peptide identifications in the AMT tag database, and DAnTE software for
the NimbleGen arrays user guide (70). Cy3-labeled cDNA samples were hybrid- peptide peak intensity value determination, normalization, and protein roll-up
ized to Roche NimbleGen (Madison, WI) Escherichia coli K-12 (accession num- using Rrollup parameters (66). Only those proteins that were detected in two out
ber NC_000913) microarray slides containing 4 arrays per slide and 72,000 of two instrumental technical replicates, in two out of three sample technical
probes per array. The arrays were scanned on a GenePix 4000B scanner (Mo- replicates (fermentor samples only), and in all biological replicates were consid-
lecular Devices, Sunnyvale, CA) with a photomultiplier tube gain to achieve 1 ⫻ ered for further analysis. The rolled-up protein abundances or abundances of
10⫺5 normalized counts at saturated intensity level. The images were processed single peptides, when they represented the only peptide identified from a pro-
and .pair files were generated based on nonnormalized intensities. tein, were averaged, and fold changes in abundance between the BTE-expressing
For quantitative RT-PCR, cDNA was synthesized using the GoScript reverse cultures and BTE-H204A-expressing cultures were calculated at each sampling
transcription system (Promega, Madison, WI) with 1 g of template RNA, 2.5 point. A two-tailed t test assuming equal sample variance was performed using
mM MgCl2, and random hexamer primers. Extension was carried out for 1 h at Microsoft Excel (Redmond, WA) on the averaged biological replicate level data.
42°C. Only those proteins that had a greater than ⱍ2ⱍ-fold change in abundance and
Microarray data analysis. Scanned probe intensities were imported into the decrease in abundance and P value of ⱕ0.05 were considered significantly dif-
ArrayStar software (DNASTAR, Madison, WI) and processed with robust mi- ferentially expressed.VOL. 77, 2011 MEMBRANE STRESS FROM E. COLI FATTY ACID OVERPRODUCTION 8117
Fatty acid extraction and analysis. Fatty acids were extracted and methylated TABLE 2. Viable cell counts at specified times from induced
from cell cultures as previously described (48). GC/MS analysis and peak iden- cultures of RL08/pTrc99A-BTE-H204A and RL08/pTrc99A-BTE
tification and quantification were performed on a model 7890 Agilent GC with grown in shake flasks containing EZ rich defined medium
a model 5975 mass spectrometer as previously described (48). Technical dupli- supplemented with 0.2% glucose
cates from each independent culture were averaged, and the average fatty acid
concentrations from two (fermentors) or three (shake flasks) independent cul- Viable cell counts (CFU/ml)a
Sampling time
tures were determined. BTE-H204A BTE
Glucose analysis. Culture samples (0.5 ml) were incubated in centrifuge tubes
at 100°C for 15 min and filtered using 0.22-m centrifugal filters (16,000 ⫻ g, 10 Mid-log (2.44 ⫾ 0.29) ⫻ 108
(9.9 ⫾ 2.3) ⫻ 107
to 15 min). The flowthrough was stored at ⫺20°C prior to analysis. Samples were Transition (2.44 ⫾ 0.28) ⫻ 109 (4.1 ⫾ 0.1) ⫻ 108
diluted 5-fold in deionized water prior to injection of 2 l onto a Waters Acquity Early stationary (3.6 ⫾ 0.6) ⫻ 109 (5.3 ⫾ 1.9) ⫻ 108
UPLC system (Milford, MA) with an evaporative light scatter detector. Samples Mid-stationary (5.3 ⫾ 1.9) ⫻ 109 (9.7 ⫾ 1.3) ⫻ 108
were separated on a Waters Acquity UPLC BEH glycan 1.7-m column with
0.2-ml min⫺1 flow for the mobile phase (74.9% acetonitrile, 24.9% water, and
a
Means ⫾ standard deviations.
0.2% triethylamine; adjusted to pH 9.1 with glacial acetic acid). Quantification
was achieved by comparison of peak areas with a glucose standard curve.
Downloaded from http://aem.asm.org/ on November 7, 2020 by guest
Cell viability measurements from plate counts. Volumes of cell cultures were
RESULTS
serially diluted in phosphate-buffered saline (PBS; 137 mM NaCl, 27 mM KCl, 10
mM Na2HPO4, 2 mM KH2PO4; pH 7.4) and spread onto LB agar plates (con- Cell viability and morphology. In prior studies, the OD600 of
taining no antibiotics) at the indicated times. Individual colonies were counted
after overnight incubation at 37°C and an additional overnight incubation at
RL08 expressing BTE from high-copy-number plasmids was
room temperature, due to the wide range of colony sizes observed in BTE- significantly reduced following induction relative to RL08 ex-
expressing strains after overnight incubation. pressing nonfunctional BTE-H204A from the same plasmids
SYTOX flow cytometry assays. To assess cell permeability, cell pellets col- (48). Furthermore, an optimum FFA titer was achieved when
lected by centrifugation of 0.5- to 1-ml culture samples were resuspended in 1 ml
BTE was expressed on low-copy-number plasmids, strongly
of PBS, diluted 1,000- to 2,000-fold in 1 ml PBS, and stained by addition of 1 l
of 5 mM SYTOX green in dimethyl sulfoxide (Invitrogen). Staining proceeded supporting the presence of a toxic effect resulting from FFA
for 10 to 30 min prior to flow cytometric analysis using a Guava EasyCyte Plus overproduction that is independent of effects resulting from
flow cytometer (Millipore, Billerica, MA) with 488-nm excitation and simulta- protein overexpression (48). Additionally, induced shake flask
neous measurement of forward scatter and 525-nm (green) emission on loga- cultures of RL08/pTrc99A-BTE exhibit reductions in OD600
rithmic scale photodetectors. Forward scatter with no minimum threshold was
selected as the trigger for events, and 5,000 events were collected per sample.
during stationary phase (38) that may be indicative of cell lysis.
Green fluorescence histograms were constructed by binning logarithmic-scale To test the hypothesis that FFA overproduction is toxic, mea-
green fluorescence values between 0 and 1,000 in increments of 10 and averaging surement of CFU ml⫺1 was performed at four sampling times
the number of events per bin between three biological replicates. (mid-log phase at OD600 between 0.8 and 1.0, transition period
Additional strain engineering. Strains containing marA::kan, rob::kan,
after log-phase growth had ceased but prior to plateauing of
soxS::kan, and pspF::kan loci (Table 1) were obtained from the Keio Collection
(9). Gene deletions were transduced into strain RL08 by P1 phage as previously the OD600 at 4.5 h postinoculation, early stationary phase at
described (48) to generate strains RL09, RL10, RL11, and RL12, respectively, 5.8 h, and mid-stationary phase at 10 h) on LB agar plates for
which were verified by colony PCR and GoTaq Green master mix (Promega, cultures of RL08/pTrc99A-BTE-H204A and RL08/pTrc99A-
Madison, WI). The kan cassette was removed from strain RL12 by transforming BTE (Table 2). Cultures expressing BTE contained nearly
plasmid pCP20 (16), which encodes a FLP recombinase. The strain was cured of
pCP20 by repeated incubations at 43°C to generate strain RL13.
50% fewer CFU ml⫺1 in mid-log phase and approximately
The marA, rob, and soxS genes were amplified by PCR using E. coli K-12 85% fewer CFU ml⫺1 in early stationary phase than cultures
MG1655 genomic DNA as template. The forward primers introduced an artifi- expressing BTE-H204A at the same sampling times.
cial ribosome binding site (AGGAGG) and spacer sequence (ATTATAAA) An alternative measure of bacterial cell viability can be ob-
prior to the start codon of each gene. PCR products were cloned into pBAD18
tained by staining cells with SYTOX green nucleic acid dye,
(32) between the XbaI and HindIII sites to generate plasmids pBAD18-MarA,
pBAD18-Rob, and pBAD18-SoxS. The pspABCDE operon and the putative which is impermeable to cells when the inner membrane is
native ribosome binding site upstream of pspA was amplified by PCR. The PCR intact. Staining of intact cells produces a weak green fluores-
product was cloned into pBAD18 between the SacI and XmaI sites to generate cence that is associated with staining of the cell surface (73). In
plasmid pBAD18-Psp. contrast, stained cells with compromised inner membranes ex-
To test the impact of these additional gene deletions or overexpressed genes
hibit an intense green fluorescence associated with nucleic acid
on cell viability and fatty acid production, pBAD33-BTE or pBAD33-BTE-
H204A, and also pBAD18, pBAD18-MarA, pBAD18-Rob, pBAD18-SoxS, or binding by the dye (73). Samples of strains RL08/pTrc99A-
pBAD18-Psp, were transformed into strain RL08 or strain RL08 with additional BTE-H204A and RL08/pTrc99A-BTE were taken immedi-
gene deletions by a chemical method (16). Fresh transformants were grown in ately prior to induction at an OD600 0.2 (preinduction) and
biological triplicates overnight in LB medium supplemented with the appropriate after 4.3 h (transition), 6.3 h (early stationary phase), and 8.3 h
antibiotics (34 g ml⫺1 chloramphenicol and 50 g ml⫺1 ampicillin). Cultures
were inoculated to an initial OD600 of 0.01 in 50 ml LB medium supplemented
(mid-stationary phase) and stained with SYTOX green to ob-
with 0.4% glycerol and appropriate antibiotics in 250-ml shake flasks. Cultures tain a time course of measurements. Log-scale forward scatter
were induced with 0.2% arabinose at an OD600 of 0.2. After 8 h, cells were and green fluorescence measurements were collected by flow
dilution plated as described above for measuring CFU ml⫺1. After 24 h, 200 l cytometry. Forward scatter histograms (Fig. 1a) exhibited
of 1:10-diluted antifoam 204 (Sigma, St. Louis, MO) in ethanol was added to
nearly identical distributions between BTE-H204A- and BTE-
each culture, and samples with significant foam (all BTE-expressing cultures)
were heated with gently swirling in an 85°C water bath for 5 to 10 min to assist expressing cells before induction, with larger forward scatter
with foam collapse. Samples were taken in technical duplicates from each culture values typical of the relatively elongated cells of log-phase
for fatty acid analysis as described above. Technical duplicate fatty acid concen- growth (1). During the transition from log-phase growth and
trations were averaged prior to analyzing the means and standard deviations of continuing throughout stationary phase, histograms for BTE-
biological triplicate cultures.
Microarray data accession number. Complete data, including raw pair files
H204A-expressing cells shifted toward smaller forward scatter
and RMM background-corrected, quantile-normalized average log2 intensities, values. This is consistent with the contraction in size of wild-
are available as a GEO data set under accession number GSE29424. type E. coli cells as they deplete nutrients but continue dividing8118 LENNEN ET AL. APPL. ENVIRON. MICROBIOL.
Downloaded from http://aem.asm.org/ on November 7, 2020 by guest
FIG. 2. (a) OD600 of cultures expressing RL08/pTrc99A-BTE-
H204A (solid diamonds) or RL08/pTrc99A-BTE (empty diamonds)
grown at 37°C in EZ rich defined medium supplemented with 0.2%
FIG. 1. (a) Averaged log-scale forward scatter of cells taken from glucose in shake flasks. A decrease in the OD600 was observed, begin-
cultures of RL08/pTrc99A-BTE (gray) and RL08/pTrc99A-BTE- ning in early stationary phase for BTE-expressing cultures relative to
H204A (black) grown in EZ rich defined medium supplemented with BTE-H204A-expressing cultures. Glucose utilization is also indicated
0.2% glucose at the sampling times defined in the text. Control cells for BTE-H204A (solid squares) and BTE (empty squares) and pro-
expressing BTE-H204A demonstrated a shift from larger forward scat- ceeded at the same rate in all cultures. Sampling times for RNA and
ter values during log-phase growth (OD600, 0.2) to much smaller for- protein are indicated with dashed vertical lines. (b) Medium (8- to
ward scatter values during stationary phase. In contrast, cells 14-carbon)-chain-length fatty acid titers in cultures expressing BTE-
expressing BTE exhibited a broadened forward scatter distribution H204A (solid circles) or BTE (empty circles).
corresponding to a larger average but more heterogeneous range of
cell sizes. (b) Green fluorescence (485-nm excitation, 525-nm emis-
sion) histograms of SYTOX green-stained cells taken from cultures of
RL08/pTrc99A-BTE (gray) and RL08/pTrc99A-BTE-H204A (black) rial). The heterogeneous distribution of colony sizes observed
at the sampling times described in the text. Cells expressing BTE- in BTE-expressing cells was absent in both RL08 and RL08/
H204A yielded a homogeneous population exhibiting weak green flu- pTrc99A exposed to exogenous FFAs (see Fig. S2a and b in the
orescence. In contrast, cells expressing BTE exhibited a binary distri-
supplemental material). The colony size distribution of cells
bution with an increased population of cells exhibiting bright green
fluorescence beginning in early stationary phase. Increased fluores- exposed to lauric acid was also indistinguishable from control
cence is indicative of compromised inner membrane integrity. cells. Furthermore, SYTOX green staining indicated a signif-
icantly lower proportion of cells exhibiting bright green fluo-
rescence from cultures with exogenously added lauric acid
during early stationary phase (1). In contrast, BTE-expressing compared to cells that endogenously overproduce FFAs (see
cells exhibited a broader distribution of forward scatter values, Fig. S2c and d).
indicative of increased heterogeneity in cell size. Green fluo- Cultivation of E. coli for functional genomics study. To
rescence histograms of the BTE-expressing strain (Fig. 1b) determine a functional basis for the observed losses in viability
revealed an increasing population of cells having intense green and membrane integrity, global mRNA and protein levels were
fluorescence from mid-log phase into stationary phase, indi- measured from triplicate shake flask cultures of RL08/
cating compromised inner membrane integrity. In contrast, the pTrc99A-BTE-H204A and RL08/pTrc99A-BTE in a rich de-
BTE-H204A-expressing strain exhibited a single population of fined medium supplemented with glucose. RNA and protein
cells possessing weak green fluorescence. samples were isolated during mid-log phase (OD600 of 0.8; two
To determine whether the observed phenotypes were spe- doublings after induction), during early stationary phase (de-
cific to endogenous FFA overproduction or exacerbated by the fined as 1 h after the instantaneous growth rate dropped to
presence of ampicillin, cell viability and SYTOX staining were one-fourth of the log-phase growth rate), and during mid-
evaluated on RL08 and RL08/pTrc99A cells exposed to exog- stationary phase (defined as 4 h after the early-stationary-
enously added lauric acid (0.5 g liter⫺1) at an OD600 mimicking phase sampling point). In addition, culture samples were taken
the induction time of fatty acid-overproducing strains, in order periodically to monitor the OD600, glucose levels (Fig. 2a), and
to present a stringent comparison to endogenous production. fatty acid content (Fig. 2b and 3) from the same cultures. As
Little to no drop in viable cell counts was observed at 4.5 h and expected, expression of BTE resulted in production of elevated
10 h postinoculation (see Table S3 in the supplemental mate- levels of fatty acids, primarily with a carbon chain length be-VOL. 77, 2011 MEMBRANE STRESS FROM E. COLI FATTY ACID OVERPRODUCTION 8119
acid composition of FFA-overproducing and control strains
was conducted. In both functional genomics experiments, the
percentage of unsaturated long-chain (16 to 18 carbon chain
length) fatty acids was significantly increased in FFA-overpro-
ducing strains. In BTE-expressing shake flask cultures, the
percentage of long chain fatty acid unsaturation leveled off at
56% during stationary phase, from the earliest measured value
of 43% during mid-log phase. In BTE-H204A-expressing
shake flask cultures, the percentage was at a maximum value of
42% at 4 h, with a steady decrease to 30% unsaturation after
24 h. This increase in unsaturated fatty acid content was due
almost entirely to a decrease in palmitic acid (C16:0) content
(Fig. 3a) in the BTE-expressing strain rather than from an
Downloaded from http://aem.asm.org/ on November 7, 2020 by guest
increase in palmitoleic acid (C16:1) and vaccenic acid (C18:1)
content (Fig. 3c and d). A significant decrease in stearic acid
(C18:0) content from approximately 2.0% to 1.5% was also
detectable (Fig. 3b). A similar trend was previously observed
when BTE was expressed in E. coli K27, a fadD mutant strain,
with large increases in the percentage of C16:1 and C18:1 ob-
served in extracted phospholipids (83). It has been postulated
that this shift in phospholipid composition is due to the deple-
tion of the pool of saturated acyl-ACPs by BTE (83). BTE-
expressing cultures grown in fermentors exhibited similar in-
creases in unsaturated 16- to 18-carbon-chain-length fatty
acids (48% versus 22% in BTE-H204A-expressing cultures at
20 h) (see Fig. S4 in the supplemental material).
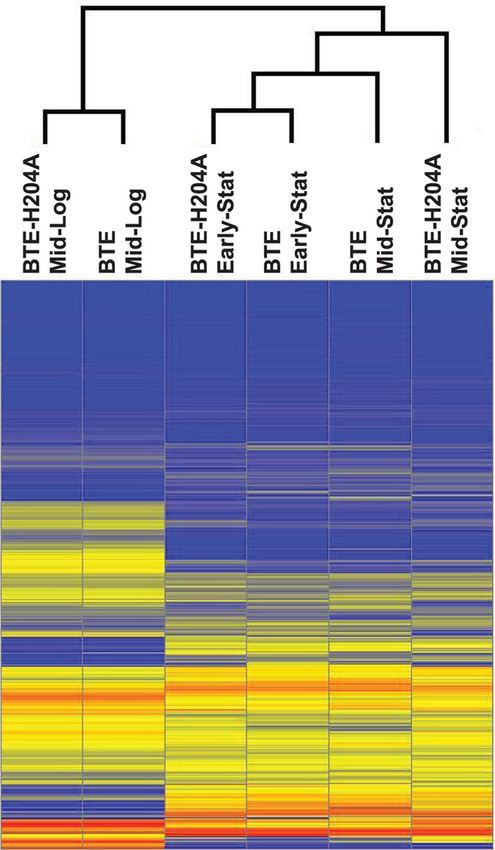
DNA microarray analysis. Transcript profiles of BTE-
H204A- and BTE-expressing strains were compared to identify
stress responses and transcriptional cascades linked to FFA
overproduction. During mid-log phase, only a small set of
genes was identified as being significantly differentially regu-
lated (fold change of ⱖⱍ2ⱍ and P ⱕ 0.05) in BTE-expressing
FIG. 3. Titers of individual long-chain fatty acids in cultures ex-
pressing BTE-H204A (solid) and BTE (empty) as a function of growth shake flask cultures relative to the corresponding BTE-H204A
time, including (a) palmitic acid (C16:0), (b) stearic acid (C18:0), (c) control. Out of the 4,240 genes analyzed on DNA microarrays,
palmitoleic acid (C16:1), and (d) vaccenic acid (C18:1). Decreases in 20 genes displayed increased expression levels and 3 genes
concentration of the saturated species (a and b) were observed, with displayed decreased expression levels compared to the control
little change in the concentration of unsaturated species (c and d).
strain. More dramatic changes were observed during stationary
phase, with 283 genes having increased expression levels and
tween 8 and 14 (and predominantly 12 carbons) relative to 350 genes having decreased expression levels in early station-
cultures expressing BTE-H204A (Fig. 2b). In a second set of ary phase. In mid-stationary phase, 477 genes were increased
experiments, RL08 harboring a combination of plasmids ex- and 564 genes were decreased in expression. The extents of
pressing either BTE or BTE-H204A (in pBAD35) and the four changes in mean gene expression values for each strain at the
subunits of ACC or an empty vector (pBAD33) were cultivated three sampling times are presented as a hierarchical clustering
in fermentors in a rich defined medium supplemented with analysis (Fig. 4).
glycerol. Samples for mRNA and protein quantification were Additional transcript profiles were obtained from strain
isolated during late log phase (OD600 of 2.0), early stationary RL08 grown in fermentors. Fewer statistically significant, dif-
phase (defined as for the shake flask cultures, mRNA only), ferentially expressed genes were identified in the fermentor
and mid-stationary phase (12 h). Growth curves are provided cultures, which were grown in biological duplicate. A cross-
in the Fig. S3 of the supplemental material. The shake flask comparison of significant differentially expressed genes present
cultures and fermentor cultures were grown in the presence of in both the shake flask and fermentor cultures across all sam-
different antibiotics (ampicillin and chloramphenicol/kanamy- pling times (defined here as a fold change of ⱖⱍ1.8ⱍ and P ⱕ
cin), carbon sources (glucose and glycerol), and utilized differ- 0.05 for shake flask cultures; P ⱕ 0.10 for fermentor cultures)
ent inducing agents (IPTG and arabinose). Genes and proteins identified a key set of 150 upregulated genes and 112 down-
that were differentially expressed in both the shake flask and regulated genes (see the supplemental material). To validate
fermentor experiments would be more specifically representa- results from the microarray data, three genes were selected for
tive of the perturbations resulting from fatty acid overproduc- qPCR analysis of cDNA derived from RNA extracted from
tion. independent cultures of RL08/pTrc99A-BTE or RL08/
Free fatty acid overproduction increases the long-chain un- pTrc99A-BTE-H204A cells grown in rich defined medium sup-
saturated fatty acid content. A GC/MS analysis of the fatty plemented with glucose. Fold changes in expression calculated8120 LENNEN ET AL. APPL. ENVIRON. MICROBIOL.
were detected in at least one technical replicate from at least
one sampling time (late log phase, mid-stationary phase) from
at least one peptide, and of these, 2,498 proteins were identi-
fied from at least two peptides. Filtering, averaging, and sta-
tistical tests were applied between technical and biological
replicates as described in Materials and Methods. This analysis
resulted in a total of 42 proteins (37 from more than one
peptide) in mid-log phase, 127 proteins (122 from more than
one peptide) in early stationary phase, and 110 proteins (104
from more than one peptide) in mid-stationary-phase shake
flask cultures identified as differentially expressed (P ⱕ 0.05),
with a much more select number of proteins exhibiting fold
changes greater than or equal to 2 with a P value of ⱕ0.05 (see
Downloaded from http://aem.asm.org/ on November 7, 2020 by guest
Table S4 in the supplemental material). Of the proteins with P
values of ⱕ0.05 and a greater-than-2-fold change in expression,
44% were identified as being differentially expressed in the
same direction at the transcript level from at least one sam-
pling time. Comparing differential expression between the
BTE-expressing strain and the BTE-H204A-expressing strains
grown in fermentors, 80 proteins (79 from more than one
peptide) in late log phase and 99 proteins (98 from more than
one peptide) in mid-stationary phase were differentially regu-
lated (P ⱕ 0.05), with only a few proteins exhibiting both a P
value of ⱕ0.05 and a greater-than-2-fold change in expression
(see Table S5 in the supplemental material). In each proteom-
ics data set, BTE and BTE-H204A were identified in the pro-
teomics data sets from dozens of individual peptides, with a
FIG. 4. Heat map of mean gene expression values at three sam-
pling times (mid-log phase; early stat, early stationary phase; mid stat, single peptide containing either the original (WNDLDVNQH
mid-stationary phase) for strain RL08/pTrc99A-BTE-H204A and VNNLK) or mutated histidine residue. As expected, the histi-
RL08/pTrc99a-BTE grown in EZ rich defined medium supplemented dine-containing peptide was present in all BTE-expressing
with 0.2% glucose in shake flasks. Hierarchical clustering was per- samples, and the alanine-containing peptide was present in all
formed with the ArrayStar software, with the closest pair clusters of
gene expression profiles for each strain and sampling time indicated at
BTE-H204A-expressing samples. Because of the low genome
the top. Mid-log-phase and early-stationary-phase profiles between the coverage and relatively small number of proteins identified as
two strains were the most similar to each other. The mid-stationary- significantly differentially expressed, the proteomics analysis
phase profile for BTE was more similar to the early-stationary-phase was used primarily for validation of trends in the microarray
profiles of either strains than to the mid-stationary-phase profile of
data sets in this study, and a complete analysis was not per-
BTE-H204A. All stationary-phase profiles were more similar to each
other than to the mid-log-phase profiles. formed here.
Induction of phage shock proteins. Among the most signif-
icantly upregulated genes beginning in stationary phase in both
from qPCR cycle threshold values showed similar trends to the the fermentor and shake flask cultures were those encoding the
microarray fold changes (Table 3). phage shock proteins (Table 4). PspA was also identified in
Differential proteomics analysis. In shake flask experiments, proteomics data as being significantly differentially expressed
a total of 2,214 proteins were detected in at least one technical in mid-stationary-phase shake flask cultures expressing BTE
replicate from at least one sampling time (mid-log phase, early and in BTE-expressing, ACC-overexpressing cultures grown in
stationary phase, or mid-stationary phase) from at least one fermentors (Table 5). Phage shock proteins are encoded in two
peptide, and of these, 1,424 proteins were identified from at operons (pspABCDE and pspG) and are induced under a va-
least two peptides. In fermentor experiments for three strains riety of conditions that induce cell envelope stress and affect
(BTE-H204A-expressing, BTE-expressing, and BTE-express- energy generation (39), including treatment with various or-
ing and ACC-overexpressing strains), a total of 3,270 proteins ganic solvents, such as hexane (45) and ethanol (14), and
TABLE 3. Changes in expression of selected genes in BTE-expressing strains versus BTE-H204A expressing strains as measured by qPCR
Fold changea (mean ⫾ SE) at phase
Locus Gene name
Mid-log Early stationary Mid-stationary
b0954 fabA ⫺1.12 ⫾ 0.58 (⫺1.28, 0.087) ⫺4.05 ⫾ 1.43 (⫺2.54, 0.004) ⫺8.15 ⫾ 2.92 (⫺4.80, 0.000)
b1307 pspD 1.14 ⫾ 0.62 (⫺1.03, 0.82) 38.8 ⫾ 11.9 (4.99, 0.002) 57.0 ⫾ 24.5 (9.60, 0.002)
b2237 inaA 1.08 ⫾ 0.71 (1.58, 0.001) 1.80 ⫾ 0.61 (7.72, 0.000) 2.76 ⫾ 0.89 (5.72, 0.000)
a
Sampling times were as defined in Materials and Methods. Standard errors are provided between biological triplicates. Values in parentheses below each qPCR
fold change value correspond to the measured fold change observed in the equivalent DNA microarray experiment, with the P value provided in italics.VOL. 77, 2011 MEMBRANE STRESS FROM E. COLI FATTY ACID OVERPRODUCTION 8121
TABLE 4. Transcript changes for BTE-expressing strains versus BTE-H204A-expressing strains cultured in EZ rich defined medium
supplemented with 0.2% glucose (EZ glucose) in shake flasks and in EZ rich defined medium
supplemented with 0.4% glycerol (EZ glycerol) in fermentorsa
Fold transcript changeb in the indicated medium at growth phase
Protein group and locus Gene name EZ glucose EZ glycerol
Mid-log Early stationary Mid-stationary Late log Early stationary Mid-stationary
Phage shock proteins
b1304 pspA 9.45 (0.000) 11.04 (0.001) 10.47 (0.000) 12.63 (0.000)
b1305 pspB 5.18 (0.001) 7.32 (0.001) 7.09 (0.000) 12.07 (0.000)
b1306 pspC 4.11 (0.002) 5.07 (0.000) 5.34 (0.000) 8.76 (0.001)
b1307 pspD 4.99 (0.002) 9.60 (0.002) 9.78 (0.004) 19.10 (0.000)
b1308 pspE 2.74 (0.000) 11.40 (0.008) 8.35 (0.005) 19.47 (0.001)
Downloaded from http://aem.asm.org/ on November 7, 2020 by guest
MarA/Rob/SoxS regulon
b0447 ybaO 1.73 (0.018) 4.64 (0.000)
b0463 acrA ⫺1.45 (0.005)
b0578 nfsB 1.37 (0.043) 1.53 (0.043)
b0683 fur 1.69 (0.031)
b0684 fldA 2.80 (0.001)
b0819 ybiS ⫺2.28 (0.000)
b0850 ybjC 1.36 (0.004) 2.65 (0.000) 1.73 (0.003) 5.32 (0.002)
b0851 nfsA 2.06 (0.020) 4.29 (0.000) 2.32 (0.007)
b0852 rimK 2.54 (0.005)
b0853 ybjN 1.85 (0.002) 2.06 (0.079)
b0871 poxB 1.76 (0.014)
b0950 pqiA 2.52 (0.003) 5.92 (0.000) 2.14 (0.100)
b0951 pqiB 2.94 (0.003)
b1014 putA 2.53 (0.018) 1.84 (0.085) 2.27 (0.046)
b1053 mdtG 1.83 (0.013) 2.20 (0.007) 2.09 (0.033)
b1101 ptsG ⫺2.61 (0.000) ⫺2.86 (0.014) 1.96 (0.060)
b1277 ribA ⫺1.42 (0.007) 1.37 (0.052)
b1530 marR 2.50 (0.037) 2.72 (0.004) 5.20 (0.000) 1.96 (0.031) 2.79 (0.013) 5.96 (0.007)
b1531 marA 1.73 (0.018) 5.21 (0.000) 6.25 (0.000) 2.91 (0.001) 6.10 (0.010)
b1532 marB ⫺1.36 (0.037)
b1611 fumC 4.39 (0.000) 8.51 (0.000) 2.15 (0.013)
b1852 zwf ⫺1.77 (0.001)
b1973 zinT 1.75 (0.001)
b2159 nfo 2.00 (0.032) 2.46 (0.004) 1.89 (0.044)
b2237 inaA 1.58 (0.001) 7.72 (0.000) 5.72 (0.000) 1.34 (0.073) 2.10 (0.001) 7.52 (0.005)
b3035 tolC ⫺1.03 (0.081)
b3037 ygiB 1.78 (0.006) 2.77 (0.003) 1.33 (0.058)
b3038 ygiC 1.61 (0.002) 5.53 (0.000)
b3506 slp 3.95 (0.000) 22.72 (0.000) ⫺1.66 (0.049)
b3507 dctR 1.38 (0.006) 1.69 (0.006)
b3508 yhiD 2.05 (0.025) 6.85 (0.020)
b3509 hdeB 3.94 (0.002) 67.71 (0.000) ⫺3.67 (0.018)
b3510 hdeA 3.11 (0.002) 36.27 (0.000) ⫺3.27 (0.017)
b3624 rfaZ 1.31 (0.043)
b3625 rfaY 1.35 (0.038)
b3800 aslB 1.47 (0.034) 1.65 (0.028)
b3908 sodA 1.47 (0.002) 2.29 (0.001) 1.49 (0.065)
b3924 fpr ⫺1.24 (0.028) 1.51 (0.006) 2.22 (0.014)
b4025 pgi 2.47 (0.020) ⫺1.58 (0.089)
b4062 soxS 2.56 (0.008) 4.52 (0.057)
b4177 purA ⫺1.78 (0.007) ⫺5.92 (0.000) 1.46 (0.087)
b4396 rob 2.85 (0.002)
b4637 uof 1.32 (0.042)
Energy metabolism
b0428 cyoE 1.47 (0.010) 3.65 (0.003) 1.81 (0.096) 1.98 (0.042)
b0429 cyoD 2.47 (0.007) 1.78 (0.057) 1.95 (0.046)
b0430 cyoC 2.00 (0.015) 2.05 (0.060)
b0431 cyoB 2.15 (0.001)
b0432 cyoA 1.28 (0.037) 2.24 (0.004) 1.67 (0.075)
b0972 hyaA 15.29 (0.000)
b0973 hyaB ⫺1.95 (0.016) 14.59 (0.000)
b0974 hyaC 19.18 (0.000)
b0975 hyaD 12.76 (0.000)
b0976 hyaE 5.47 (0.001)
Continued on following page8122 LENNEN ET AL. APPL. ENVIRON. MICROBIOL.
TABLE 4—Continued
Fold transcript changeb in the indicated medium at growth phase
Protein group and locus Gene name EZ glucose EZ glycerol
Mid-log Early stationary Mid-stationary Late log Early stationary Mid-stationary
b0977 hyaF 5.06 (0.005)
b0978 appC ⫺3.07 (0.001) ⫺1.52 (0.097) ⫺1.74 (0.014) ⫺2.95 (0.092)
b0979 appB ⫺2.26 (0.000) ⫺1.82 (0.016) ⫺2.76 (0.087)
b0980 appA ⫺2.06 (0.001) ⫺1.67 (0.074) ⫺1.98 (0.017)
b1974 yodB ⫺2.57 (0.000) ⫺2.40 (0.016)
b2276 nuoN 2.42 (0.015)
b2277 nuoM ⫺1.81 (0.000) 2.93 (0.006)
b2278 nuoL ⫺1.70 (0.001) 1.68 (0.019)
b2279 nuoK 1.76 (0.012)
Downloaded from http://aem.asm.org/ on November 7, 2020 by guest
b2280 nuoJ 1.82 (0.030)
b2281 nuoI 2.91 (0.008) 1.92 (0.054)
b2282 nuoH 3.27 (0.008) 1.83 (0.071)
b2410 yfeH 2.53 (0.038) 1.81 (0.053)
b2899 yqfA ⫺8.77 (0.006) ⫺14.66 (0.020) ⫺32.77 (0.000)
b2996 hybA 2.84 (0.001) 2.25 (0.015) ⫺1.26 (0.073)
b3892 fdoI 1.55 (0.042) 2.91 (0.000) 2.33 (0.070)
b3894 fdoG ⫺1.21 (0.022) 2.48 (0.017) 12.49 (0.000) 2.32 (0.072)
b4039 ubiC 1.95 (0.007) 2.60 (0.005) 2.80 (0.018)
b4040 ubiA 1.75 (0.001) 2.07 (0.014) 4.51 (0.001)
b4154 frdA 2.22 (0.001) 1.83 (0.094) 1.36 (0.024)
Unsaturated fatty acid biosynthesis
b0954 fabA ⫺2.54 (0.004) ⫺4.80 (0.000) ⫺2.94 (0.019) ⫺3.58 (0.004)
b2323 fabB ⫺1.87 (0.000) ⫺12.95 (0.001) ⫺10.28 (0.001) ⫺27.33 (0.000) ⫺2.35 (0.099)
Other genes
b0464 acrR 1.96 (0.000) 1.66 (0.018) 2.60 (0.017)
b0929 ompF ⫺7.72 (0.000) ⫺10.43 (0.002) ⫺6.93 (0.037)
b2684 mprA 1.37 (0.023) 2.10 (0.000) 6.11 (0.000) 2.12 (0.082) 3.44 (0.000) 10.39 (0.001)
a
Data shown are from sampling times specified in the text. Only those fold changes with P values greater than 0.05 (EZ glucose) or 0.10 (EZ glycerol) are shown.
b
Data are means, with P values for comparisons of BTE-expressing strains versus BTE-H204A-expressing strains shown in parentheses.
following exposure to octanoic acid (86) but not isobutanol Induction of the MarA/Rob/SoxS regulon. Under all tested
(15). Transcription from the promoters of both operons is 54 conditions, BTE-expressing strains exhibited increased expres-
dependent and is activated by the transcriptional dual regula- sion of many genes activated by the MarA/Rob/SoxS transcrip-
tor PspF (39). PspA is believed to play a physical role in tion factors (Table 4). MarA, Rob, and SoxS bind to a similar
stabilizing membranes (24, 80) and has been shown to suppress consensus sequence of DNA upstream of the promoters of
proton leakage of damaged liposomes composed of E. coli regulon members in a degenerate manner, with one, two, or all
phospholipids (46). three of the regulators activating transcription from a given
TABLE 5. Protein changes for BTE-expressing strains versus BTE-H204A-expressing strains cultured in EZ rich defined medium
supplemented with 0.2% glucose in shake flasks (EZ glucose) or in EZ rich defined
medium supplemented with 0.4% glycerol (EZ glycerol)a
Fold change between BTE-expressing strains vs BTE-H204A-expressing strains
EZ glycerol
Locus Protein EZ glucose, BTE⫹ ACC⫺
BTE⫹ ACC⫺ BTE⫹ ACC⫹
Early stationary Mid-stationary Late log Mid-stationary Late log Mid-stationary
PutA 2.10 2.20 ⫺4.32
b1304 PspA 5.52 2.28
b1493 GadB 4.63
b1611 FumC 3.53
b1743 Spy 5.24
b2323 FabB ⫺4.20 ⫺3.46 ⫺2.36 ⫺5.85 ⫺2.46 ⫺7.00
b3506 Slp 2.10 ⫺2.11
a
Cultures were grown in fermentors and sampled at the times specified in the text. P values for all fold changes shown were less than 0.05. No significant changes
in expression levels were measured at the mid-log phase sampling point for EZ glucose cultures.VOL. 77, 2011 MEMBRANE STRESS FROM E. COLI FATTY ACID OVERPRODUCTION 8123
promoter (57). The activities of the transcription factors are acrAB under general stress conditions, including exposure to
modulated by various mechanisms dependent on environmen- 4% ethanol, 0.5 M NaCl, and during stationary phase (52),
tal conditions. In the presence of salicylate and other aromatic which is consistent with the pattern of expression observed in
compounds, MarA activation occurs via inactivation of the this study.
DNA-binding repressor MarR (2). Similarly, SoxS activation Induction of other envelope stress responses and the acid
occurs via inactivation of the cognate repressor SoxR in the resistance response in batch cultures. Other regulons impli-
presence of superoxide (20). Rob has no known cognate re- cated in cell envelope stress include those of the alternative
pressor, and its activity is directly modulated by the presence of sigma factor E and the two-component systems CpxAR and
decanoate, bile salts, and dipyridyl (71, 72). As early as during BaeSR (74). Several genes in the E regulon, including opgG,
mid-log-phase growth in BTE-expressing shake flask cultures opgH, plsB, and lpxP, were strongly upregulated in early to
and at the late-log-phase sampling point in fermentors, up- mid-stationary phase in BTE-expressing shake flask cultures
regulation of marR was observed. Early-stationary-phase in- but not in fermentors. Significantly increased expression of
duction and a further-increased mid-stationary-phase induc- members of the CpxR regulon was also observed in mid-sta-
Downloaded from http://aem.asm.org/ on November 7, 2020 by guest
tion of many members of the regulon were observed in both tionary phase in shake flask cultures but not fermentors, in-
shake flasks and fermentors, including fumC (encoding an aer- cluding cpxP, degP, mdtD, and spy (mdtD and spy are also in the
obically active fumarase), marA, pqiA (encoding a paraquat- BaeR regulon). Spy was also identified as being significantly
inducible protein with no known function), inaA (encoding a differentially expressed in the shake flask proteomics data (Ta-
protein with unknown function), marR, ybjC (encoding a pro- ble 5), but the other proteins were either nonsignificantly
tein with unknown function), putA (encoding a FAD⫹-depen- changed or not detected. Other members of the E and CpxR
dent proline dehydrogenase), nfsA (encoding an NADPH-de- regulon were significantly downregulated in mid-stationary
pendent nitroreductase), and nfo (encoding a DNA phase in BTE-expressing shake flask cultures, including ompF,
endonuclease involved in repairing oxidative damage). Expres- csgDEFG, and hlpA-lpxD-fabZ-lpxA, an operon transcribed
sion of mdtG, a recently ascribed member of the MarA/Rob/ from a promoter upstream of hlpA.
SoxS regulon which putatively encodes an efflux pump and for A number of genes on a region of the genome referred to as
which overexpression increases resistance to fosfomycin and the acid fitness island (37), primarily involving glutamate-de-
deoxycholate (25), was also increased. MarA, Rob, and SoxS pendent acid resistance, were significantly increased in expres-
additionally activate transcription of MicF RNA, which acts as sion in stationary-phase shake flask cultures. These genes in-
an antisense repressor of transcription of ompF (encoding an cluded slp and hdeAB-yhiD, which are repressed by MarA
outer membrane porin) (5). Strongly decreased expression of during the transition to stationary phase (68, 76) but are also
ompF was observed in stationary phase in both shake flasks and affected by numerous other regulators. Increased expression of
fermentors (Table 4). PutA was identified as having increased these genes was also accompanied by dramatic increases in
mid-stationary-phase expression in BTE-expressing shake flask expression of gadA, gadB, gadC, gadE, and mdtEF, with more
cultures, in exponential-phase fermentor cultures expressing moderate increases in expression (⬍5-fold) of gadX and gadW
only BTE, and in mid-stationary-phase fermentor cultures ex- (see the supplemental material), strongly suggesting a relative
pressing BTE and overexpressing ACC (Table 5). FumC was lack of MarA involvement. Slp and GadB were also identified
also observed to have increased expression in shake flask pro- as having increased expression in shake flask proteomic data
teomics data in BTE-expressing cultures during mid-stationary (Table 5). There was no activation of genes on the acid fitness
phase (Table 5). island in fermentor cultures, but rather a reduction in expres-
Notably, no significant increase in expression of acrAB was sion of hdeAB in the BTE-expressing strain in mid-stationary
observed in BTE-expressing cultures (Table 4), which encodes phase.
an inner membrane multidrug efflux pump (AcrB) and a Changes in energy metabolism. Genes involved in energy
periplasmic linker protein (AcrA) to an outer membrane chan- metabolism were upregulated in BTE-expressing strains in
nel (TolC). It has been previously shown that acrAB transcrip- both shake flask and fermentor cultures (Table 4). These in-
tion can be induced by high concentrations (5 mM) of exoge- cluded many members of the nuo operon (nuoH, nuoI, nuoJ,
nously supplied decanoate via activation of Rob (54, 71). and nuoN), encoding subunits of NADH:ubiquinone oxi-
Decanoate is similar to the predominant overproduced fatty doreductase I, and the cyo operon (cyoC, cyoD, and cyoE),
acid laurate; however, the maximum titer of endogenously encoding subunits of the cytochrome bo terminal oxidase com-
produced free fatty acids (chain length, C12 to C14) in this study plex and heme O synthase. Other members of the operon were
was approximately 1.5 mM, which may be too low to observe upregulated in the mid-stationary-phase shake flask data set,
significant induction of acrAB. Transcription of the acrAB with either P values or fold changes not meeting the selected
operon is also modulated by two divergently transcribed re- significance criteria or not also being identified with the sig-
pressors, AcrR and MprA, which appear to serve as secondary nificance criteria in the fermentor data set, including nuoG,
attenuators of acrAB expression (31, 53). Expression of acrR nuoL, nuoK, cyoA, and cyoB. Similarly for fermentor data,
was moderately increased in BTE-expressing cultures in early additional genes identified in late log phase included nuoM,
stationary phase in shake flasks and in mid-stationary phase in nuoK, nuoG, nuoL, cyoA, and cyoB. These gene products form
fermentors (Table 4). Expression of mprA was moderately core components of the electron transport chain, with complex
increased in early stationary phase and strongly increased in regulation of transcription by a number of different transcrip-
mid-stationary phase in both shake flasks and fermentors (Ta- tion factors involved in sensing oxygen levels (ArcA, FNR, and
ble 4). It has been previously noted that transcription of acrR Fur) and nitrate levels (NarL) among others. Furthermore,
is increased approximately 4-fold more than transcription of expression of the nuo operon was also dependent on the pro-You can also read