Complete genome sequence of DSM 30083T, the type strain (U5/41T) of Escherichia coli, and a proposal for delineating subspecies in microbial taxonomy
←
→
Page content transcription
If your browser does not render page correctly, please read the page content below

Meier-Kolthoff et al. Standards in Genomic Sciences 2014, 9:2
http://www.standardsingenomics.com/content/9/1/2

 EXTENDED GENOME REPORT                                                                                                                       Open Access

Complete genome sequence of DSM 30083T, the
type strain (U5/41T) of Escherichia coli, and a
proposal for delineating subspecies in microbial
taxonomy
Jan P Meier-Kolthoff1, Richard L Hahnke1, Jörn Petersen1, Carmen Scheuner1, Victoria Michael1, Anne Fiebig1,
Christine Rohde1, Manfred Rohde2, Berthold Fartmann3, Lynne A Goodwin4, Olga Chertkov4, TBK Reddy4,
Amrita Pati4, Natalia N Ivanova4, Victor Markowitz4, Nikos C Kyrpides4,5, Tanja Woyke4, Markus Göker1*
and Hans-Peter Klenk1

  Abstract
  Although Escherichia coli is the most widely studied bacterial model organism and often considered to be the
  model bacterium per se, its type strain was until now forgotten from microbial genomics. As a part of the Genomic
  Encyclopedia of Bacteria and Archaea project, we here describe the features of E. coli DSM 30083T together with its
  genome sequence and annotation as well as novel aspects of its phenotype. The 5,038,133 bp containing genome
  sequence includes 4,762 protein-coding genes and 175 RNA genes as well as a single plasmid. Affiliation of a set of
  250 genome-sequenced E. coli strains, Shigella and outgroup strains to the type strain of E. coli was investigated
  using digital DNA:DNA-hybridization (dDDH) similarities and differences in genomic G+C content. As in the majority
  of previous studies, results show Shigella spp. embedded within E. coli and in most cases forming a single subgroup
  of it. Phylogenomic trees also recover the proposed E. coli phylotypes as monophyla with minor exceptions and
  place DSM 30083T in phylotype B2 with E. coli S88 as its closest neighbor. The widely used lab strain K-12 is not only
  genomically but also physiologically strongly different from the type strain. The phylotypes do not express a
  uniform level of character divergence as measured using dDDH, however, thus an alternative arrangement is
  proposed and discussed in the context of bacterial subspecies. Analyses of the genome sequences of a large
  number of E. coli strains and of strains from > 100 other bacterial genera indicate a value of 79-80% dDDH as the
  most promising threshold for delineating subspecies, which in turn suggests the presence of five subspecies within
  E. coli.
  Keywords: Phylogenomics, Phylotypes, GBDP, OPM, Phenotype, Clustering, Supermatrix, DNA:DNA hybridization,
  G+C content

* Correspondence: markus.goeker@dsmz.de
1
 Leibniz Institute DSMZ – German Collection of Microorganisms and Cell
Cultures, Inhoffenstraße 7B, 38124 Braunschweig, Germany
Full list of author information is available at the end of the article

                                       © 2014 Meier-Kolthoff et al.; licensee BioMed Central Ltd. This is an Open Access article distributed under the terms of the
                                       Creative Commons Attribution License (http://creativecommons.org/licenses/by/4.0), which permits unrestricted use,
                                       distribution, and reproduction in any medium, provided the original work is properly credited. The Creative Commons Public
                                       Domain Dedication waiver (http://creativecommons.org/publicdomain/zero/1.0/) applies to the data made available in this
                                       article, unless otherwise stated.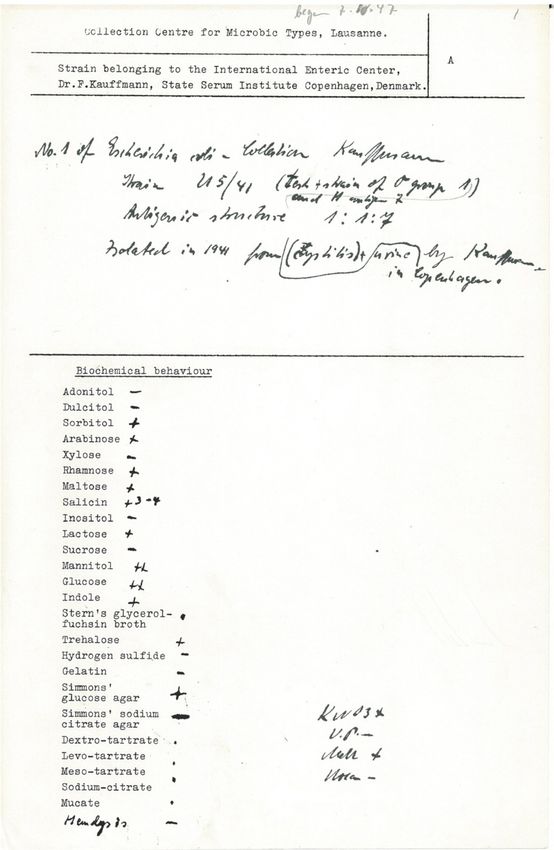
Meier-Kolthoff et al. Standards in Genomic Sciences 2014, 9:2                                                      Page 2 of 19
http://www.standardsingenomics.com/content/9/1/2

Introduction                                                      chemicals and biofuels [14,15], recombinant protein expres-
Despite more than 35,000 completed and ongoing bac-               sion [16], the process of binary fission [17], DNA replica-
terial genome-sequencing projects (including over 2,500           tion and segregation [18], small RNA regulators [19],
genomes from strains of the genus Escherichia) [1] and            genetics of the capsular machinery gene cluster [20], as well
the fundamental importance of type strains for microbial          as comparative genomics [21] and the current status and
taxonomy and nomenclature [2], the type strain of                 the progress in clinically relevant E. coli strains [22,23].
Escherichia coli, U5/41T, the most widely studied bacterial          In this study we analyzed the genome sequence of
model organism and model bacterium per se, was until              E. coli DSM 30083T. We present a description of the gen-
now neglected in microbial genomics; although strain              ome sequencing and annotation and a summary classifica-
K-12 substrain MG1665 was in 1997 the subject of one of           tion together with a set of features for strain DSM 30083T,
the first ever published complete genome sequences [3]. By        including novel aspects of its phenotype. Since only the
sequencing the genome of DSM 30083T, DSMZ’s culture of            availability of the type-strain genome allows for the ap-
U5/41T, in the context of the Genomic Encyclopedia of             plication of state-of-the-art genome-based taxonomic
Bacteria and Archaea [4], we filled this gap enabling not         methods, species affiliation of all strains with respect to
only the use of this strain as a taxonomic reference in gen-      the type strain was determined via digital DNA:DNA-
ome sequence-based studies, but also providing access to          hybridization (dDDH) similarities as computed by the
novel data of an exciting organism whose phenotypic               Genome-to-Genome Distance Calculator [24], version 2
features differ in many ways from those of the often used         [25], and by evaluating the differences in genomic G+C
E. coli lab strain K-12.                                          content [26]. Phylogenomic analyses [24,25] elucidate the
  The first report on strains of the genus Escherichia            evolutionary relationships between 250 E. coli strains,
(at that time termed “Bacterium coli commune”) were               Shigella spp. and outgroup strains as well as the grouping
published in 1886 by Theodor Escherich [5] in the                 within E. coli. The availability of the type-strain genome
context of his professorial dissertation at University of         allows not only for assessing whether published genome
Munich. Later in 1919, Castellani and Chalmers proposed           sequences are actually from strains of E. coli but also for a
the name Escherichia coli (E.sche.ri’chi.a, M.L. fem.n.,          potential division of E. coli into subspecies.
Escherichia, in honor of Theodor Escherich; co’li, Gr.n.
colon large intestine, colon, M.L. gen.n. coli of the colon) as   Organism features
the name for the type species of the genus Escherichia,           Classification and features
which was accepted by the Judical Commission of the ICSB          16S rRNA gene analysis
in 1958 [6] and included in the Approved Lists of Bacterial       The sequences of the seven 16S rRNA gene copies in
Names in 1980 [7].                                                the genome of DSM 30083T differ from each other by
  Despite its enormous importance for microbiology and            up to eleven nucleotides, and differ by up to ten nucleo-
mostly due to a lack of type culture collections until the        tides from the previously published 16S rRNA gene se-
early 1920s, the original type cultures of E. coli got lost       quence (X80725), which contains three ambiguous base
(just like those of the early isolates of other bacterial         calls. The phylogenetic neighborhood of E. coli in a 16S
species). Strain U5/41T (= DSM 30083T = ATCC 11775T =             rRNA gene-based tree inferred as previously described
WDCM 00090T) was isolated by Fritz Kauffmann at the               [27] is shown in Additional file 1.
State Serum Institute Copenhagen, Denmark in 1941                   The single genomic 16S rRNA gene sequence of E. coli
[8], from the urine of a patient with cystitis, and was           DSM 30083T was compared with the Greengenes database
accepted as neotype of E. coli in 1963 [9]. Figure 1 shows        for determining the weighted relative frequencies of taxa
the original record card issued by the Danish State Serum         and (truncated) keywords as previously described [27].
Institute in Copenhagen for the deposit of U5/41T. Since          The most frequently occurring genera were Escherichia
then, E. coli DSM 30083T was a reference strain for many          (87.0%) and Shigella (13.0%) (131 hits in total). Regarding
tests and applications, such as serotyping with the               the 109 hits to sequences from representatives of the
method of Ørskov and Ørskov [10], antimicrobial assays            species, the average identity within HSPs was 99.8%,
[11], ribotyping and multi-locus sequence typing [12],            whereas the average coverage by HSPs was 100.0%. Re-
and the PCR amplification of the β-D-glucuronidase gene           garding the five hits to sequences from other representa-
fragment (uidA) as tracer for fecal pollution in all kinds        tives of the genus, the average identity within HSPs
of waters [13]. As a model organism for genetics, bio-            was also 99.8%, whereas the average coverage by HSPs
chemistry, metabolic reconstruction and pathway infer-            was 100.0%. Among all other species, the one yielding
ence, genomics and metabolics of E. coli are well-studied         the highest score was Shigella flexneri (HQ407229),
topics, starting with the 1997 publication of the K-12            which corresponded to an identity of 99.9% and an
genome [3]. The reader is referred to studies of E. coli          HSP coverage of 100.0%. (Note that the Greengenes
such as metabolic engineering for the production of               database uses the INSDC (=EMBL/NCBI/DDBJ)
Meier-Kolthoff et al. Standards in Genomic Sciences 2014, 9:2                  Page 3 of 19
http://www.standardsingenomics.com/content/9/1/2

 Figure 1 Scan of the original record card issued for the deposit of U5/41T.
Meier-Kolthoff et al. Standards in Genomic Sciences 2014, 9:2                                                       Page 4 of 19
http://www.standardsingenomics.com/content/9/1/2

annotation, which is not an authoritative source for no-           arabinose, but does not grow on dulcitol, D-xylose, sucrose,
menclature or classification.) The highest-scoring environ-        adonitol, citric acid, inositol and gelatin and growth varies
mental sequence was EF603461 (Greengenes short name                on D-salicin. Strain DSM 30083T belongs to E. coli “var.
‘Salmonella typhimurium Exploits Inflammation Compete              communis” (representatives were mostly isolated from
Intestinal Microbiota mouse cecum clone 16saw29-1c11.              feces), because the strain does not ferment sucrose or
q1k’), which showed an identity of 99.9% and an HSP                salicin [31]. Strain DSM 30083T is able to ferment
coverage of 100.0%. The most frequently occurring key-             lactose (Figure 1), which is a characteristic criterion for
words within the labels of all environmental samples               the differentiation against representatives of Shigella
which yielded hits were ‘intestin’ (9.9%), ‘mous’ (6.1%),          and Salmonella [28,29]. Comparable to most strains of
‘inflamm’ (5.8%), ‘microbiota’ (5.7%) and ‘cecum, com-             E. coli, strain DSM 30083T is positive for indole produc-
pet, exploit, salmonella, typhimurium’ (5.6%) (119 hits            tion, nitrate reduction, and urease but hydrogen-sulfide
in total). The most frequently occurring keywords                  negative (Figure 1) [28]. Additionally, Huys et al. [32]
within the labels of those environmental samples which             described strain ATCC 11775T as being positive for
yielded hits of a higher score than the highest scoring            D-raffinose and acetate utilization, positive for lysin-
species were ‘microbiota’ (12.5%), ‘cecum, compet, ex-             decarboxylase and ornithine-decarboxylase activity, and
ploit, inflamm, intestin, mous, salmonella, typhimurium’           negative for growth on D-arabitol, D-cellobiose and in the
(10.0%) and ‘gut, lusitanicu, thorect’ (2.5%) (5 hits in total).   presence of KCN. Furthermore, E. coli utilizes mucic acid,
These keywords fit well to the known ecology of E. coli.           does not produce acetoin (Voges–Proskauer negative),
                                                                   and does not utilize malonate [29].
Morphology and physiology                                             We used phenotyping with the OmniLog instrument
As described for the genus Escherichia, cells are Gram-            [Biolog Inc., Hayward, CA] to elucidate whether or not
negative, medium to long rods (Figure 2 and Table 1),              strain DSM 30083T might be able to utilize further
motile by the means of peritrichous flagella, non-                 substrates. A comparison of E. coli DSM 30083T and
pigmented, chemo-organotrophic, oxidase-negative, fac-             E. coli DSM 18039 (a K-12 MG1655 derivative with
ultative anaerobes. They produce acid and gas while                almost K-12 wild-type features) with Generation-III
fermenting D-glucose, lactose or other carbohydrates [28].         microplates run in an OmniLog phenotyping instrument
E. coli strains are able to grow at temperatures between           was conducted by Vaas et al. [44]. These data also serve as
10°C and 45°C, with an optimum between 37°C and 42°C,              exemplars for the substrate-information and feature-
and at pH 5.5-8.0 [28,29]. Koser [30] showed that                  selection facilities in the tutorial of the opm package [45]
“Bacterium coli communis” utilizes propionic acid, n-butyric       for analyzing phenotype microarray data in the R statis-
acid, succinic acid, malic acid, lactic acid and mucic acid        tical environment [46]. As shown in that tutorial, among
as sole carbon sources, but neither citric acid, salts of          the substrates contained in Generation-II plates, carbo-
citric acid, n- or iso-valeric acid, n-caprionic acid, tartaric    hydrates make the main difference between the two
acid, oxalic acid, benzoic acid, salicylic acid nor o-phthalic     strains, with DSM 30083T mostly reacting more strongly
acid. Based on the description by Kauffmann (Figure 1),            than DSM 18039.
strain DSM 30083T grows on D-trehalose, D-sorbitol, D-                The utilization of carbon compounds by E. coli DSM
mannitol, L-rhamnose, D-glucose, D-maltose, α-D-lactose, D-        30083T grown at 37°C in LB medium (DSMZ medium
                                                                   no. 381) [41] was also determined for this study using
                                                                   PM-01 and PM-02 microplates [Biolog Inc., Hayward,
                                                                   CA]. These plates were inoculated at 37°C with dye A
                                                                   and a cell suspension at a cell density of 85% turbidity.
                                                                   The exported measurement data were further analyzed
                                                                   with opm using its functionality for statistically estimat-
                                                                   ing parameters from the respiration curves such as the
                                                                   maximum height, and automatically translating these
                                                                   values into negative, ambiguous, and positive reactions.
                                                                   The reactions were recorded in two individual biological
                                                                   replicates, and results that differed between the two
                                                                   replicates were regarded as ambiguous.
                                                                      On PM-01 microplates, DSM 30083T was positive for
                                                                   L-arabinose, N-acetyl-D-glucosamine, D-saccharic acid,
                                                                   succinic acid, D-galactose, L-aspartic acid, L-proline,
 Figure 2 Scanning-electron micrograph of strain E. coli DSM
                                                                   D-alanine, D-trehalose, D-mannose, D-serine, D-sorbitol,
 30083T.
                                                                   glycerol, L-fucose, D-glucuronic acid, D-gluconic acid,
Meier-Kolthoff et al. Standards in Genomic Sciences 2014, 9:2 Page 5 of 19
http://www.standardsingenomics.com/content/9/1/2
Table 1 Classification and general features of E. coli DSM 30083T in accordance with the MIGS recommendations [33]
published by the Genome Standards Consortium [34]
MIGS ID Property Term Evidence code
Current classification Domain Bacteria TAS [35]
Phylum Proteobacteria TAS [36]
Class Gammaproteobacteria TAS [37,38]
Order 'Enterobacteriales' TAS [37,38]
Family Enterobacteriaceae TAS [39]
Genus Escherichia TAS [5,9]
Species Escherichia coli TAS [5,9]
Strain U5/41T TAS [5,9,40]
Serovar: O1:K1(L1):H7 IDA, TAS [10]
Gram stain Negative IDA, TAS [28]
Cell shape Rod TAS [28]
Motility Motile TAS [28]
Sporulation Non-sporeforming IDA, TAS [28]
Temperature range Mesophile NAS
MIGS-6.1 Optimum temperature 37°C IDA, TAS [41]
MIGS-6.3 Salinity range Not reported
MIGS-22 Oxygen requirement Aerobe and facultative anaerobe TAS [28,29]
Carbon source Carbohdrates, salicin, sorbitol, mannitol, indole, peptides IDA, TAS [41], (Figure 1)
Energy metabolism Chemo-organotrophic TAS, IDA [29]
MIGS-15 Biotic relationship Human specimen NAS
MIGS-14 Pathogenicity Human and animal NAS
Biosafety level 2 TAS [42]
MIGS-23 Isolation Urine TAS (Figure 1)
MIGS-23 Cultivation Nutrient agar (DSMZ medium 1) IDA, TAS [41]
MIGS-4 Geographic location Copenhagen, Denmark TAS (Figure 1)
Collected by F. Kauffmann TAS (Figure 1)
MIGS-5 Sample collection time 1941 TAS (Figure 1)
MIGS-4.1 MIGS-4.2 Latitude – Longitude 55° 40′ 34″ N, 12° 34′ 6″ E TAS (Figure 1)
Evidence codes - TAS: Traceable Author Statement (i.e., a direct report exists in the literature); NAS: Non-traceable Author Statement (i.e., not directly observed for
the living, isolated sample, but based on a generally accepted property for the species, or anecdotal evidence); IDA: Inferred from direct assay. Evidence codes are
from of the Gene Ontology project [43].
D,L-α-glycerol-phosphate, L-lactic acid, D-mannitol, L- The strain was negative for the negative control, dulci-
glutamic acid, D-glucose-6-phosphate, D-galactonic acid- tol, D-xylose, D-aspartic acid, α-keto-butyric acid, sucrose,
γ-lactone, D,L-malic acid, D-ribose, tween 20, L-rhamnose, m-tartaric acid, tween 80, α-hydroxy-glutaric acid-γ-
D-fructose, acetic acid, D-glucose, D-maltose, D-melibiose, lactone, α-hydroxy-butyric acid, adonitol, citric acid,
thymidine, L-asparagine, D-glucosaminic acid, tween 40, myo-inositol, D-threonine, mucic acid, D-cellobiose, tri-
α-keto-glutaric acid, α-methyl-D-galactoside, α-D-lactose, carballylic acid, acetoacetic acid, p-hydroxy-phenylacetic
lactulose, uridine, L-glutamine, α-D-glucose-1-phosphate, acid, m-hydroxy-phenylacetic acid, tyramine, D-psicose,
D-fructose-6-phosphate, β-methyl-D-glucoside, maltotriose, β-phenylethylamine and ethanolamine.
2′-deoxy-adenosine, adenosine, gly-asp, fumaric acid, bromo- Ambiguous results were obtained with sodium formate
succinic acid, propionic acid, glycolic acid, glyoxylic acid, and 1,2-propanediol.
inosine, gly-glu, L-serine, L-threonine, L-alanine, ala-gly, On PM-02 microplates, DSM 30083T was positive for
N-acetyl-β-D-mannosamine, mono-methyl succinate, me- dextrin, N-acetyl-D-galactosamine, N-acetyl-neuraminic
thyl pyruvate, D-malic acid, L-malic acid, gly-pro, L-lyxose, acid, β-D-allose, D-arabinose, 3-O-β-D-galactopyranosyl-
glucuronamide, pyruvic acid, L-galactonic acid-γ-lactone D-arabinose, D-lactitol, β-methyl-D-galactoside, β-methyl-D-
and D-galacturonic acid. glucuronic acid, D-raffinose, L-sorbose, D-tagatose, D-Meier-Kolthoff et al. Standards in Genomic Sciences 2014, 9:2 Page 6 of 19 http://www.standardsingenomics.com/content/9/1/2 glucosamine, β-hydroxy-butyric acid, D-lactic acid methyl and L-arabinose, but negative for L-arginine, citrate, ester, melibionic acid, L-alaninamide and dihydroxy-acetone. sulfide production, urease, L-tryptophane, acetoin pro- The strain was negative for the negative control, duction, gelatin, inositol, sucrose, amygdaline, and oxi- chondroitin sulfate C, α-cyclodextrin, β-cyclodextrin, γ- dase. In medium M9 strain DSM 30083T showed growth cyclodextrin, gelatin, glycogen, inulin, laminarin, mannan, on L-glutamic acid, tween 20, N-acetyl-D-galactosamine, pectin, amygdalin, D-arabitol, L-arabitol, arbutin, 2-deoxy- L-sorbose, and D-melibiose, but not on 1,2-propanediol, D-ribose, m-erythritol, D-fucose, β-gentiobiose, L-glucose, dulcitol, D-xylose, m-tartaric acid, and α-keto-butyric acid. D-melezitose, maltitol, α-methyl-D-glucoside, 3-O-methyl- In experiments conducted at DSMZ, strain DSM 30083T D-glucose, α-methyl-D-mannoside, β-methyl-D-xylopy- formed blue colonies on OXOID Brilliance ESBL Agar ranoside, palatinose, D-salicin, sedoheptulosan, stachyose, (P05302A, OXOID, UK) and utilized D-galactose and thus turanose, xylitol, N-acetyl-D-glucosaminitol, γ-amino-n- is both galactosidase- and glucuronidase-positive. Indi- butyric acid, δ-amino-valeric acid, butyric acid, capric acid, cated by the positive result of pyruvic acid in the OmniLog caproic acid, citraconic acid, D-citramalic acid, 2-hydroxy- phenotyping and the negative Voges–Proskauer test, strain benzoic acid, 4-hydroxy-benzoic acid, γ-hydroxy-butyric DSM 30083T is able to utilize pyruvate but does not acid, α-keto-valeric acid, itaconic acid, 5-keto-D-gluconic produce acetoin, a carbon storage and an intermediate to acid, malonic acid, oxalic acid, oxalomalic acid, quinic avoid acidification during fermentation [49]. acid, D-ribono-1,4-lactone, sebacic acid, sorbic acid, succinamic acid, D-tartaric acid, L-tartaric acid, acetamide, Chemotaxonomy N-acetyl-L-glutamic acid, L-arginine, glycine, L-histidine, To the best of our knowledge, data on the fatty acids or L-homoserine, L-hydroxyproline, L-isoleucine, L-leucine, polar lipids of E. coli DSM 30083T are not available in L-lysine, L-methionine, L-ornithine, L-phenylalanine, L- the literature. pyroglutamic acid, L-valine, D,L-carnitine, butylamine For details on the extensively studied molecular struc- (sec), D,L-octopamine, putrescine, 2,3-butanediol, 2,3- ture and chemical composition of the E. coli cell wall butanedione and 3-hydroxy-2-butanone. Ambiguous the reader is referred to Scheutz and Strockbine [29] and results were not observed on PM-02 microplates. the literature listed therein. In brief, E. coli has a single Results of the OmniLog phenotyping in PM-01 and peptidoglycan layer within the periplasm, consisting of PM-02 microplates (see Additional file 1 for further N-acetylglucosamine and N-acetylmuramic acid linked information) were in full agreement with growth experi- to the tetrapeptide L-alanine, D-glutamic acid, meso- ments as described in the aforementioned literature with diaminopimelic acid and D-alanine. The outer membrane the sole exception of mucic acid [29], which was not is a lipopolysaccharide layer consisting of (i) lipid A, (ii) metabolized by strain DSM 30083T in OmniLog pheno- the core region of the phosphorylated nonrepeating typing, at least not within the applied running time. In oligosaccharides, and (iii) the O-antigen polymer [28,29]. brief, strain DSM 30083T grows on succinic acid, D- E. coli, Shigella ssp. and Salmonella ssp. strains display sorbitol, L-lactic acid, D-mannitol, L-rhamnose, acetic a huge variety of lipopolysaccharide layer heat-stable acid, D-glucose, D-maltose, α-D-lactose, propionic acid, somatic (O), capsular (K; “Kapsel”, the German word for D-trehalose, D-malic acid, L-malic acid, D-arabinose, and capsule), flagellar filament (H), and fimbriae (F) antigens, D-raffinose, but does not grow on dulcitol, D-xylose, which serve since a long time as the basis for serotyping sucrose, m-tartaric acid, adonitol, citric acid, myo-inositol, [29]. K antigens are further subdivided into the L, B, and D-cellobiose, gelatin, D-arabitol, D-salicin, butyric acid, A categories, based on their physical properties [29]. malonic acid, oxalic acid, D-tartaric acid, and L-tartaric The serotype of E. coli DSM 30083T is O1:K1(L1):H7. acid. Strain DSM 30083T grows on D-galacturonic acid, Representatives of E. coli, as Gram-negative bacteria, D-glucuronic acid, α-keto-glutaric acid and glutamic are described to be intrinsically resistant to hydrophobic acid, which suggests a catabolism of D-glucuronic acid antibiotics (e.g. macrolites, novoviocins, rifamycins, and D-galacturonic acid to α-keto-glutaric acid and actinomycin D, fusidic acid) and may have acquired further to glutamic acid via the mucic-acid pathway further antibiotic resistances (e.g. aminoglycosides, β- [47,48]. lactam, chloramphenicol, sulfonamides, tetracyclines) [29]. We tested growth on further substrates by incubating We tested the antibiotic resistance of E. coli DSM strain DSM 30083T either on DSMZ medium 382 (M9) 30083T on Müller-Hinton agar at 30°C. Strain DSM without glucose [41], supplemented with 20 mM substrate 30083T was resistant against the cell-envelope antibiotics at 37°C for 72 h, or with API 20E strips (bioMérieux, bacitracin, oxacillin, penicillin G, teicoplanin and vanco- Nürtingen, Germany) at 37°C. On API 20E strips (see mycin as well as against the protein-synthesis inhibitors Additional file 1) strain DSM 30083T was positive for β- (50S subunit) clindamycin, lincomycin, linezolid, nystatin galactosidase, L-lysine, L-ornithine, indole production, D- (antifungal) and quinupristin/dalfooristin. In contrast, glucose, D-mannitol, D-sorbitol, L-rhamnose, D-melibiose, strain DSM 30083T was susceptible to the cell-envelope
Meier-Kolthoff et al. Standards in Genomic Sciences 2014, 9:2                                                            Page 7 of 19
http://www.standardsingenomics.com/content/9/1/2

antibiotics ampicillin, azlocillin, aztreonam, cefalotin,       Table 2 Genome sequencing project information
cefazolin, cefotaxime, ceftriaxone, colistin, fosfomycin,       MIGS ID     Property               Term
imipenem, mezlocillin, piperacillin/tazobactam, ticarcil-       MIGS-31     Finishing quality      Level 3: Improved-High-Quality Draft
lin and polymyxin B, the protein-synthesis inhibitors           MIGS-28     Libraries used         454 Titanium paired-end, Solexa
(30S subunit) amikacin, doxycyclin, gentamicin, kana-                                              paired end
mycin, neomycin and tetracyclin, the protein-synthesis          MIGS-29     Sequencing platforms   454-GS-FLX-Titanium, Illumina GAii
inhibitors (50S subunit) chloramphenicol and erythro-
                                                                MIGS-31.2   Sequencing coverage    14.3 x
mycin as well as against the nucleic-acid inhibitors
                                                                MIGS-30     Assemblers             Newbler, velvet
moxifloxacin, nitrofurantoin, norflaxacin, oflaxacin and
pipemidic acid.                                                 MIGS-32     Gene calling method    Prodigal 2.5
   As reported by F. Kauffmann (Figure 1) and tested at                     INSDC ID               AGSE00000000
DSMZ on enterohaemolysin agar (PB5105A, OXOID,                              GenBank Date of        13-MAY-2014
Wesel, Germany), strain DSM 30083T is enterohaemolysin-                     Release
negative and thus does not belong to enterohemorrhagic                      GOLD ID                Gi07590
serotype (enterohaemorrhagic E. coli, EHEC). The T phages                   NCBI project ID        PRJNA50621
T1-T7 did not lyse strain DSM 30083T cultivated on                          Database: IMG          2528311135
DSMZ medium 544 at 37°C.
                                                                MIGS-13     Source material        DSM 30083
                                                                            identifier
Genome sequencing and annotation                                            Project relevance      Tree of Life, GEBA
Genome project history
The E. coli type strain genome was sequenced as part of
the Genomic Encyclopedia of Bacteria and Archaea
(GEBA) project [4]. It was the only strain in the project
that was chosen for genome sequencing due to its emi-           conducted at LGC Genomics (Berlin) and resulted in
nent prominence as a model organism and its value as a          three aligned contigs for the chromosome and one for
taxonomic reference strain and not selected according           the plasmid.
to the GEBA criteria for distinct phylogenetic location
[4,50]. Project information is found in the Genomes On-
                                                                Genome annotation
Line Database [1]. Draft sequencing, initial gap closure
                                                                Genes were identified using Prodigal [56] as part of the
and annotation were performed by the DOE Joint Gen-
                                                                JGI genome annotation pipeline [57]. The predicted
ome Institute (JGI) using state-of-the-art sequencing
                                                                CDSs were translated and used to search the National
technology [51]. The Whole Genome Shotgun (WGS)
                                                                Center for Biotechnology Information (NCBI) nonre-
sequence is deposited in Genbank and the Integrated
                                                                dundant database, UniProt, TIGR-Fam, Pfam, PRIAM,
Microbial Genomes database (IMG) [52]. A summary of
                                                                KEGG, COG, and InterPro databases. Identification of
the project information is shown in Table 2.
                                                                RNA genes were carried out by using HMMER 3.0rc1 [58]
                                                                (rRNAs) and tRNAscan-SE 1.23 [59] (tRNAs). Other non-
Growth conditions and DNA isolation
                                                                coding genes were predicted using INFERNAL 1.0.2 [60].
A culture of strain DSM 30083T was grown aerobically
                                                                Additional gene prediction analysis and functional an-
in DSMZ medium 1 [41] at 37°C. Genomic DNA was
                                                                notation was performed within the Integrated Microbial
isolated using MasterPure Gram-Positive DNA Purifica-
                                                                Genomes - Expert Review (IMG-ER) platform [61]
tion Kit (Epicentre MGP04100) following the standard
                                                                CRISPR elements were detected using CRT [62] and
protocol provided by the manufacturer but modified by
                                                                PILER-CR [63].
incubation on ice over night on a shaker. DNA is avail-
able from DSMZ through the DNA Bank Network [53].
                                                                Genome properties
Genome sequencing and assembly                                  The genome statistics are provided in Table 3, Figure 3 and
The genome was sequenced using a combination of 454-            Figure 4. The genome of strain DSM 30083T has a total
GS-FLX-Titanium and Illumina GAii platforms. Illumina           length of 5,038,133 bp and a G+C content of 50.6%. Of the
contigs of a length greater than 800 bp were shredded           4,937 genes predicted, 4,762 were identified as protein-
into pieces of up to 1000 bp at 200 bp intervals prior to       coding genes, and 175 as RNAs. The majority of the protein-
the velvet [54] assembly. An additional round of automated      coding genes were assigned a putative function (84.2%)
gap closure yielded a draft version of the genome               while the remaining ones were annotated as hypothetical
sequence comprising 37 contigs. Further gap closure via         proteins. The distribution of genes into COGs functional
primer walking and finishing with Consed [55] was               categories is presented in Table 4.
Meier-Kolthoff et al. Standards in Genomic Sciences 2014, 9:2 Page 8 of 19
http://www.standardsingenomics.com/content/9/1/2
Table 3 Genome statistics DDH studies, yet the name Shigella was retained to not
Attribute Value % of total cause confusion in medical microbiology [39]. In accord-
Genome size (bp) 5,038,133 100.0 ance with the taxonomic classification, none of the strains
DNA coding region (bp) 4,492,959 89.2
from other Escherichia species yielded a dDDH similarity
>70% (Figure 5).
DNA G+C content (bp) 2,551,375 50.6
For easing the comparison with literature data, we used
Number of scaffolds MIGS-9 2 the phylotypes suggested by [67-69] and revised according
Extrachromosomal elements MIGS-10 1 to the sixth picture in [66], which reassigned strains to
Total genes 4,937 100.0 phylotypes in most cases where it was necessary to render
RNA genes 175 3.5 them monophyletic in a phylogenetic analysis of E. coli
rRNA operons 7
core genes (based on nucleotide alignments of 1,278 core-
genes from 186 E. coli genomes). We had to additionally
tRNA genes 58 1.2
split phylotype D into D1, D2 and D3 because this phylotype
Protein-coding genes 4,762 96.5 actually was distributed over three distinct clades in [66],
Genes with function prediction (proteins) 4,157 84.2 and for analogous reasons had to split F into F1 and F2 and
Genes in paralog clusters 3,570 72.3 Shigella II into Shigella IIa and Shigella IIb. The affiliation of
Genes assigned to COGs 3,651 74.0 the genomes present in our data set to the original phylo-
Genes assigned Pfam domains 4,365 88.4
types, if available, and the revised ones is contained in
Additional file 2. The affiliations of E. coli strains to serovars
Genes with signal peptides 447 9.1
were collected from GOLD [1], those to pathovars from [1]
Genes with transmembrane helices 1,132 22.9 and [70]; they are also listed in the supplement.
CRISPR repeats 2 Regarding the dDDH groups V, VI and VII in Figure 5
containing the E. coli strains with a dDDH similarity to the
Insights into the genome type strain of around 85% or higher, those with an assigned
Which E. coli genomes actually represent E. coli? revised phylotype uniformly belonged to phylotype B1. A
Since the focus of this study is the E. coli type strain histogram depicting the dDDH similarities between all
DSM 30083T, we will only discuss genomic aspects strains used in this study is contained in Additional file 1.
related to this strain in the following. Indeed, only the
availability of the type-strain genome enables one to Phylogenetic analysis with nucleotide GBDP
assess with modern genome sequence-based taxonomic Figure 6 depicts a phylogenetic tree of the same strains
methods whether or not the large number of genome- inferred using GBDP, the highly reliable method [71] to
sequenced E. coli strains actually belong to this species. calculate intergenomic distances, on which the inference
The taxonomist’s main criterion for species affiliation of digital DDH values as shown in Figure 6 is also based
is the 70% DNA:DNA hybridization (DDH) similarity [24,25]. The branch support values in this tree (Figure 6)
threshold [64,65], but here we use an improved modern originate from pseudo-bootstrapping [25], a procedure
variant of the method, which is based on intergenomic se- which is known as conservative [72] and in the context
quence distances [24,25]. This approach retains consistency of GBDP tends to underestimate branch support par-
with the microbial species concept because the trad- ticularly for branches close to the tips [73]. Accordingly,
itional DDH is, on average, closely mimicked, but the tree shows a well-supported backbone whereas
digital DDH (dDDH) avoids the pitfalls of traditional terminal branches reveal less support.
DDH due to the much lower error rate in genome Nevertheless, the tree topology (Figure 6) shows all
sequencing [26]. revised phylotypes as monophyletic, and some of them
Figure 5 shows the dDDH similarities between with high support. According to Figure 6 the type strain
DSM 30083T and a selection of 250 E. coli strains DSM 30083T is placed within phylotype B2 with E. coli
(see Additional file 2 for a full list) as well as outgroup ge- S88 as its closest neighbor. The observation that the
nomes inferred using the Genome-to-Genome Distance Shigella phylotypes occur in three different clades, but
Calculator [24], version 2 [25], which is based on the that these are all positioned within E. coli, together with
Genome BLAST Distance Phylogeny (GBDP) approach earlier studies [76,77] provides evidence against a recent
[24,25]. Apparently, all strains identified as E. coli are study [78] which proposes Shigella spp. as a sister group
within the 70% range of the type strain and hence need of E. coli rather than at least one of its subgroups. A
no reclassification (which would be the case for DDH possible reason might be that [78] utilized an alignment-
values below the 70% threshold). The analysis also free genome signature (“CVTree”) approach which was
confirms that Shigella (within dDDH group IV) is placed recently shown to be less accurate than GBDP [71]. High
within E. coli; this was already known from traditional (92%) support was achieved for a clade comprisingMeier-Kolthoff et al. Standards in Genomic Sciences 2014, 9:2 Page 9 of 19
http://www.standardsingenomics.com/content/9/1/2
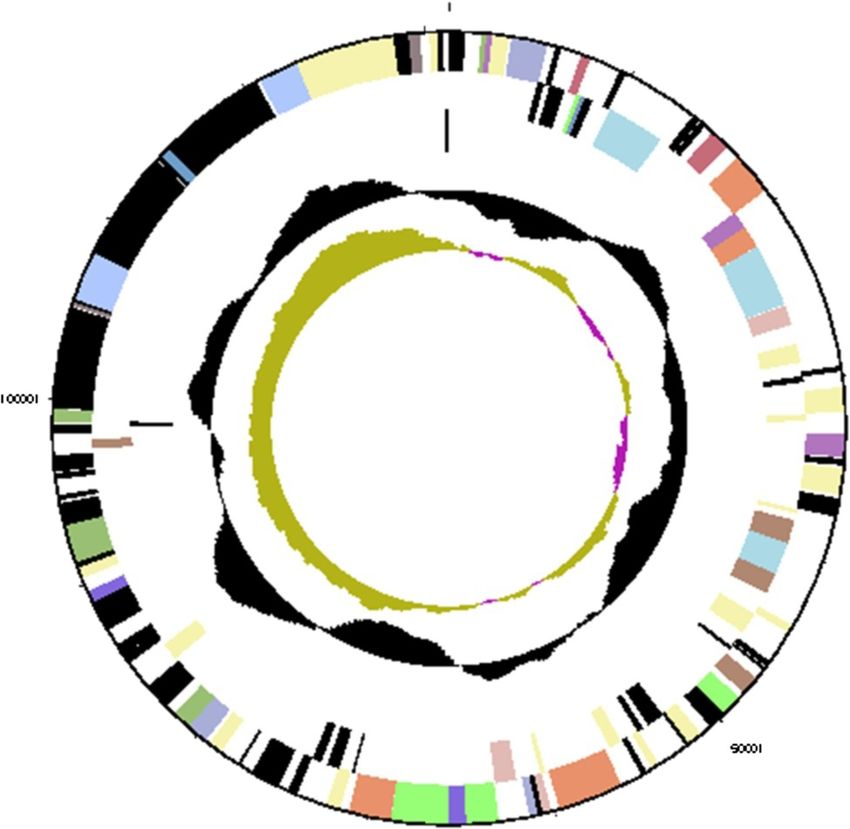
Figure 3 Graphical map of the chromosome. From bottom to the top: Genes on forward strand (colored by COG categories), Genes on
reverse strand (colored by COG categories), RNA genes (tRNAs green, rRNAs red, other RNAs black), G+C content (black), G+C skew (purple/olive).
phylotypes A, B1, C, Shigella I, Shigella IIa and Shigella phylogenomics pipeline as previously described [79-86]
IIb, and maximum support for a parent clade of that clade, using NCBI BLAST [87], OrthoMCL [88], MUSCLE
also comprising phylotypes D2, D3, E and Shigella III. The [89], RASCAL [90], GBLOCKS [91] and MARE [92] to
serovars and pathovars, as far as attributable to the ge- generate concatenated alignments of distinct selections of
nomes used in this study, showed lower agreement with genes (supermatrices). Maximum likelihood (ML) [93]
the tree topology. This might be due to the highly diverse and maximum parsimony (MP) [94,95] trees were inferred
adaptive paths present in E. coli [77]. from the data matrices with RAxML [96,97] and PAUP*
[98], respectively, as previously described [79-86].
Phylogenetic analysis of proteome sequences The topology of the ML MARE-filtered supermatrix
The genome sequences of a subset of 50 representative analysis is shown in Figure 7 together with ML and MP
genome-sequenced strains were phylogenetically investi- bootstrap support values from all supermatrix analyses if
gated in a complementary analysis using the DSMZ larger than 60%. Support was maximum (100%) for theMeier-Kolthoff et al. Standards in Genomic Sciences 2014, 9:2 Page 10 of 19 http://www.standardsingenomics.com/content/9/1/2 Figure 4 Graphical map of the plasmid. From bottom to the top: Genes on forward strand (colored by COG categories), Genes on reverse strand (colored by COG categories), RNA genes (tRNAs green, rRNAs red, other RNAs black), G+C content (black), G+C skew (purple/olive). majority of branches under ML and MP (Figure 7). Again, A, B1, E and all Shigella strains yield maximum support in this tree all phylotypes are represented as monophyla under all assessed gene selections; this large clade also ob- with the sole exception of B1, which was revealed only in tained 100% support with GBDP (Figure 6). Average the core-gene analysis, much like in [66]. A further differ- branch support under ML and MP, respectively, was 91.72/ ence to the 2012 study [66] and the GBDP tree (Figure 6) 87.62% using the core genes only (101,755 variable, 21,474 is that Shigella phylotypes I, IIa, IIb and III formed a clade parsimony-informative characters), 94.04/97.64% using the together; again this clade was not visible in the core-gene MARE-filtered supermatrix (285,814/99,071) and 90.3/ tree. In our view, trying distinct ways to generate super- 97.49% using the entire supermatrix (456,246/153,146). matrices has the strong advantage that branches that are This is largely in agreement with the tendency observed in sensitive to gene selection can be revealed [79-86]. previous studies using the same phylogenomics pipeline Whereas the above-mentioned groups are instable in this that more characters simply yield higher support, despite respect, others such as the group comprising phylotypes the frequent concerns regarding horizontal gene transfer
Meier-Kolthoff et al. Standards in Genomic Sciences 2014, 9:2                                                                 Page 11 of 19
http://www.standardsingenomics.com/content/9/1/2

Table 4 Number of genes associated with the general                        both is at most moderately supported. Support for a
COG functional categories                                                  monophyletic Shigella is high, however (98-100%). The
Code Value % age Description                                               phylotypes are revealed as monophyletic except for F1
J         182        4 Translation, ribosomal structure and biogenesis     and B1 (with strong support against them forming a
A           2        1 RNA processing and modification                     clade, respectively).
K         298        7 Transcription
L         197        5 Replication, recombination and repair               The within-species difference of genomic G+C content
B           0        0 Chromatin structure and dynamics                    The G+C content of 50.6% inferred from the genome
                                                                           sequence is in agreement with the value of 50.7 ± 0.6 mol%
D          35        1 Cell cycle control, cell division, chromosome
                       partitioning                                        determined for strain DSM 30083T by Albuquerque et al.
Y           0        0 Nuclear structure
                                                                           [101], but differs slightly from the G+C content of 51.0-
                                                                           51.7 mol%, determined from deposit ATCC 11775T [29].
V          50        1 Defense mechanisms
                                                                           The G+C content range of E. coli strains was reported as
T         174        4 Signal transduction mechanisms                      48.5-52.1 mol% [29], in conflict with more recent results
M         239        6 Cell wall/membrane/envelope biogenesis              [26]. Thus affiliation to E. coli was also assessed by calculat-
N         114        3 Cell motility                                       ing the genomic G+C content of all 251 strains in the data
Z           0        0 Cytoskeleton                                        set and the difference to the G+C content of the type strain,
W           1        0 Extracellular structures
                                                                           DSM 30083T. Results shown in Figure 9 are in agreement
                                                                           with the result from [26] that within-species differences in
U         137        4 Intracellular trafficking and secretion, and
                       vesicular transport                                 the G+C content are almost exclusively below 1%. As
                                                                           expected, E. coli cannot be distinguished from the other
O         137        3 Posttranslational modification, protein turnover,
                       chaperones                                          Escherichia species based on G+C content.
C         276        7 Energy production and conversion
G         413       10 Carbohydrate transport and metabolism               The 131-kb plasmid of E. coli DSM 30083T
                                                                           The E. coli type strain DSM 30083T contains a single cir-
E         359        8 Amino acid transport and metabolism
                                                                           cular incFII-type plasmid with a size of 131,289 bp and a
F          99        2 Nucleotide transport and metabolism
                                                                           G+C content of 49.3% (Figure 4). A homologous plasmid
H         160        4 Coenzyme transport and metabolism                   that just exhibits an inversion of 15 kb and an indel (in-
I          99        2 Lipid transport and metabolism                      sertion/deletion) of 3 kb is present in the closest relative
P         237        6 Inorganic ion transport and metabolism              E. coli strain S88 (CU928146). The 131-kb plasmid harbors
Q          69        2 Secondary metabolites biosynthesis, transport       a type IV secretion system and a highly syntenous conjuga-
                       and catabolism                                      tive plasmid has been identified in a multidrug-resistent
R         426       11 General function prediction only                    Salmonella enterica strain CVM29188 (NC_011076) [102]
S         370        9 Function unknown
                                                                           thus providing strong evidence of natural interspecies
                                                                           exchange of the extrachromosomal element.
-       1286        26 Not in COGs

                                                                           Physiological discrimination of E. coli DSM 30083T and
[99], but might also indicate advantages of the removal of                 DSM 18039
phylogenetically uninformative genes with MARE [92].                       Since the genomes of both E. coli strains DSM 30083T
                                                                           and K-12 MG1655 (=DSM 18039) fall into strongly sep-
Phylogenetic analysis of gene and ortholog content                         arated clusters, the question of phenotypic differences
The clusters of orthologs as inferred with OrthoMCL,                       between the type strain and the widely used laboratory
as well as clusters of homologs inferred using re-                         strain arises, too. We thus also investigated the substrate
implementation of the TribeMCL [100] algorithm as                          spectrum of using PM-01 and PM-02 microplates as de-
previously described [79-86], were converted to presence-                  scribed above (see also Additional file 1). In contrast to
absence matrices for phylogenetic inference using ML and                   DSM 30083T, DSM 18039 was positive for dulcitol, D-
MP. The topology of the MP ortholog-content analysis is                    xylose, α-keto-glutaric acid, m-tartaric acid, α-hydroxy-
shown in Figure 8 together with MP and ML bootstrap                        butyric acid, 5-keto-D-gluconic acid, but negative for
support values from ortholog-content and gene-content                      L-glutamic acid, D-glucosaminic acid, tween 20, tween
analyses if larger than 60%. In contrast to the GBDP                       40, mono-methyl succinate, N-acetyl-D-galactosamine,
(Figure 6) and supermatrix (Figure 7) analyses, E. coli                    D-arabinose, D-raffinose, L-sorbose, D-tagatose. On API
forms a sister group of Shigella spp., but with at most                    20E strips (see Additional file 1) strain DSM 18039T in
moderate (80%) support. Similarly, the clade containing                    contrast to E. coli 30083T was negative for L-ornithine.
Meier-Kolthoff et al. Standards in Genomic Sciences 2014, 9:2 Page 12 of 19
http://www.standardsingenomics.com/content/9/1/2
70 Number of
65 strains
60
60
55
Number of strains
50 40
45
20
40
35 0
30
25
20
15 IV VI
10
5 I II III V VII
0
0 10 20 30 40 50 60 70 80 90 100
dDDH (in %)
Figure 5 Histogram of the digital DDH similarities between the type strain, DSM 30083T, and other genome-sequenced E. coli strains
as well as outgroups. Interesting groups are marked by Roman numerals I-VII: Escherichia hermannii and Shimwellia blattae (I), E. fergusonii and
E. albertii (II), E. sp. TW09308 (III), E. coli (IV-VII). Regarding the revised phylotypes from [66] (compare Figure 6), phylotype B2 is covered by dDDH
groups V, VI, and VII with VII being the group containing (among other strains) type strain DSM 30083T itself and its closest relative E. coli S88. IV
marks the biggest group which includes phylotypes A, B1, D1, D2, D3, E, F1, F2 and Shigella I, IIa, IIb and III. The full list of dDDH values and
affiliation to phylotypes is contained in Additional file 2.
A unique diagnostic trait of all completely sequenced are all monophyletic according to current knowledge, com-
K-12 strains that allow the discrimination from other E. paring birds and mammals regarding, say, species numbers
coli isolates is a deletion of 3,205 bp in the aga gene makes much more sense than comparing birds and
cluster that is required for the conversion of N-acetyl-D- primates.
galactosamine [103]. To assess the homogeneity of the revised E. coli phylo-
types, some of their cluster statistics were calculated with
Subdivision of E. coli revisited OPTSIL [104] version 1.5 and the matrix of intergenomic
As shown above, after a small number of revisions as distances used for inferring dDDH values (Figure 5). Aver-
conducted in [66] and partially in this study, the pro- age within-cluster distances ranged between 0.00098 and
posed phylotypes of E. coli appear monophyletic in the 0.01571 with a median of 0.00503, whereas maximum
phylogenetic analyses of genome-scale data. The sole ex- within-cluster distances ranged between 0.00121 and
ception is phylotype B1, whose monophyly is confirmed 0.02199 with a median of 0.01444. Further, clustering
in Figure 6 but shows a sensitivity to gene selection in optimization as implemented in OPTSIL was conducted
analyses of proteome sequences (Figure 7). The additional using the revised phylotypes as reference partition; details
question arises, however, whether or not the phylotypes are are found in Additional file 3. The maximum agreement
not only monophyletic but also are comparable to each with the reference partition was obtained for a combin-
other with respect to the level of character divergence ation of clustering parameters that yielded 32 clusters,
within each group. This would be advantageous for (formal way more than the number of phylotypes plus outgroups
or informal) classification, as can easily be shown by a com- that were input into clustering optimization.
parison with the 70% DDH rule for delineating bacterial This analysis shows that the phylotypes of E. coli, even
species. There is, unfortunately, no guarantee that the set of if revised to obtain monophyly of all phylotypes in the
strains in the 70% (d)DDH range of a type strain form a phylogenetic analyses of genome-scale data as conducted
monophyletic group unless the distances are ultrametric in [66] and this study (Figure 6), are not homogeneous
[26]. But on the other hand, in contrast to the monophyly regarding their divergence as measured using genome-
criterion itself, the consequent application of the 70% DDH scale nucleotide data. This can also be shown indirectly
rule by construction yields groups with a similar upper by comparing the phylotypes to a clustering conducted
bound of character divergence. The same reasoning also with the slightly higher distance threshold of 0.0242,
holds for organisms not covered by the Bacteriological which corresponds to 79.3% dDDH. The tree in Figure 6
Code. For instance, whereas birds, mammals and primates is annotated with this clustering, too; it yields fiveMeier-Kolthoff et al. Standards in Genomic Sciences 2014, 9:2 Page 13 of 19 http://www.standardsingenomics.com/content/9/1/2 Figure 6 Whole-genome phylogeny inferred using the latest GBDP version [25] and rooted with Escherichia albertii. Other outgroup organisms, separated by long branches, were removed to ease visualization (E. hermannii, Shimwellia blattae, and E. fergusonii) but are shown in Additional file 1. Numbers above branches are greedy-with-trimming pseudo-bootstrap [73] support values from 100 replicates if larger than 50%. Leaves are colored according to their affiliation to phylotypes. The outer circles show the affiliation of the strains to potential subspecies, pathovars and serovars (if the information was retrievable). Labels with numbers in square brackets are duplicates (due to label shortening) and refer to the following full strains/GenBank accessions: [1] CS6:LT+:ST+, [2] TW07815, [3] AM946981, [4] CP001509, [5] CP001665, [6] AFST00000000, [7] AFRH00000000, [8] K-12, MG1655 U00096, and [9] CM000960. An asterisk (*) indicates the K-12 wild type. ITOL [74] was used to visualize the tree inferred using FastME [75]. clusters, four of which obtain GBDP pseudo-bootstrap this cluster is supported in proteome-based trees under values between 98% and 100%. Four of these clusters all investigated settings (Figure 7). It is not supported by directly correspond to one phylotype, respectively, the gene-content based phylogenies (Figure 8), but these namely B2, D1, F1 and F2, whereas the fifth cluster com- neither yield support against this cluster. Thus if mea- prises all remaining phylotypes, including all Shigella spp. sured from genome-scale nucleotide data the phylotypes (Figure 6). Interestingly, in contrast to some phylotypes, B2, D1, F1 and F2, as well as the combination of all
Meier-Kolthoff et al. Standards in Genomic Sciences 2014, 9:2                                                                           Page 14 of 19
http://www.standardsingenomics.com/content/9/1/2

 Figure 7 Phylogenetic tree inferred from the MARE-filtered supermatrix under the maximum likelihood (ML) criterion and rooted with
 E. hermannii NBRC 105704. Branch lengths within the outgroup were shortened to improve visualization. The branches are scaled in terms of
 the expected number of substitutions per site. Numbers above / below the branches (from left to right) are bootstrapping support values (if larger
 than 60%) from (i) ML MARE-filtered supermatrix; (ii) maximum-parsimony (MP) MARE-filtered supermatrix; (iii) ML “full” supermatrix, (iv) MP “full”
 supermatrix, (v) ML core-genes; (vi) MP core-genes analysis. Dots indicate branches with maximum support under all settings. Numbers in square
 brackets refer to further strain information as listed in the caption of Figure 6.

remaining clusters have approximately the same level of                      qualitative assessment of few selected phenotypic charac-
divergence, respectively.                                                    ters [65,105,106]. A quotation from [64] is worth reprodu-
                                                                             cing here: “Subspecies designations can be used for
Delineation of subspecies revisited                                          genetically close organisms that diverge in phenotype.
Bacterial subspecies were traditionally not determined                       There is some evidence, based on frequency distribution
based on a distance or similarity threshold, but on a                        of ΔTm values in DNA hybridization, that the subspecies
Meier-Kolthoff et al. Standards in Genomic Sciences 2014, 9:2 Page 15 of 19
http://www.standardsingenomics.com/content/9/1/2
Figure 8 Phylogeny inferred from the ortholog-content matrix under the maximum parsimony (MP) criterion and rooted with
E. hermannii NBRC 105704. The branches are scaled in terms of the minimum number of substitutions (DELTRAN optimization). Numbers
above/below the branches (from left to right) are bootstrapping support values (if larger than 60%) from (i) MP ortholog-content matrix; (ii)
maximum-likelihood (ML) ortholog-content matrix; (iii) MP gene-content matrix; (iv) ML gene-content matrix analysis. Dots indicate branches with
maximum support under all settings.
110
Number of
100 strains
Number of strains
90
80
90
70
60 60
50
40 30
30
0
20
10 A B
0
0.0 0.4 0.8 1.2 1.6 2.0 2.4 2.8 3.2 3.6 4.0 4.4 4.8 5.2 5.6 6.0
Difference in genomic G+C content (in %)
Figure 9 Histogram of the differences in genomic G+C content between the E. coli type strain and the other 250 strains contained in
the data set. In accordance to a within-species difference of at most 1% in the G+C content [26], none of the differences between the distinct
strains of E. coli are above that threshold. The G+C differences to E. hermannii NBRC 105704 (3.4%, “A”) and Shimwellia blattae DSM 4481 (5.9%,
“B”) are considerably larger, whereas E. albertii, E. fergusonii and “Escherichia sp. TW09308” (which are also phylogenetically more close to E. coli;
see Figure 6 and Figure 7) cannot be distinguished from E. coli using the G+C content.Meier-Kolthoff et al. Standards in Genomic Sciences 2014, 9:2 Page 16 of 19 http://www.standardsingenomics.com/content/9/1/2 concept is phylogenetically valid. (…) There is a need for Furthermore, values between 90% and 95% dDDH further guidelines for designation of subspecies.” Particu- could be reserved in the future for taxonomic ranks such larly because the availability of complete genome sequences as “variety”. Finally, values approaching 100% are unsuit- allows for the transition to genome-based taxonomy, yield- able because they might represent distinct clones or ing to a considerable increase in phylogenetic resolution deposits of the same strain or even genome sequences [99], rules for a genome-based, quantitative approach to obtained several times from the same strain. subspecies delineation in analogy to the 70% (d)DDH threshold for the delineation of species [24,25,65], would be Taxonomic consequences for E. coli? desirable. As mentioned above, E. coli is an attractive example for However, as emphasized in [26], inconsistencies can the application of the 79-80% dDDH rule (Figure 6). occur when distance or similarity thresholds are used Hence, the description of subspecies of E. coli is the next and the underlying distances specifically deviate from logical consequence. Regarding practice, it is noteworthy ultrametricity. These potential pitfalls are a general conse- that the already established detection of phylotypes [67- quence of the direct use of pairwise distances or similar- 69] will help detecting the subspecies, too, because the ities (which is not a phylogenetic method) for assessing (revised) phylotypes are either identical to subspecies or taxonomic affiliations [104] and not directly related to to subsets of subspecies (Figure 6). Furthermore, even traditional or digital DDH. Fewer taxonomic problems incompletely sequenced genomes can be used to detect are expected when comparisons between two non-type the subspecies by the comparison with the type strains strains are avoided (which is necessary for reasons of no- using the GGDC server [24,25]. Apparently, Shigella menclature anyway), but this does not entirely prevent spp. would not only be placed within E. coli [107] but even pitfalls [26]. Nevertheless, whether paradoxes really occur embedded within one of the subspecies defined at the in practice depends on the distance threshold and the 79-80% dDDH boundary (Figure 6). Crucially, this changes specific deviation of the data under study from the ultra- nothing regarding the status of Shigella: if this name is to metric condition [26]. Hence, if a threshold for delineat- be retained not to cause confusion in medical microbiol- ing bacterial subspecies is of interest, it makes sense to ogy anyway [39], it simply does not matter whether or not choose it so as to minimize the potential of taxonomic it otherwise would be placed entirely within E. coli or even inconsistencies related to non-ultrametric data as far as entirely within a yet to be established subspecies of E. coli. possible. This can be done for bacterial subspecies pre- However, the placement of Shigella yields yet another cisely because by tradition they have not been determined problem for the division of E. coli into subspecies. An based on a distance or similarity threshold, in contrast to approach to describe subspecies for E. coli could start the species rank, hence such a threshold can now be care- with the largest cluster in Figure 6, which contains most fully chosen based on the above-mentioned principles. of the genome-sequenced strains including strain K-12, Using the E. coli data as starting point, augmented by but also all strains of Shigella. Following the guidelines the data set used in [26] containing completely sequenced of the Bacteriological Code (1990 revision) [2] the type genomes for 105 genera of Archaea and Bacteria, in strain of this subspecies would be strain NewcastleT addition to criteria from the literature we have devised a (=NCTC 4837T) representing E. coli subsp. dysenteriae criterion called “clustering consistency” for optimizing (Shiga 1897) Castellani and Chalmers 1919, with strain thresholds for sub-specific bacterial lineages. Compared to U5/41T automatically becoming the type strain of E. coli the analysis of frequency distributions of (d)DDH values subsp. coli (Shiga 1897) Castellani and Chalmers 1919. as mentioned in [99], this approach has the advantage that Thus establishing this subspecies of E. coli would taxo- it directly addresses how to best cluster the sequences. nomically conflict with the purpose of retaining Shigella The analyses described in detail in Additional file 3 show [39], hence we refrain from proposing taxonomic conse- that regarding within-species clustering consistency a dis- quences here. The dDDH boundary suggested in this tance threshold corresponding to 79-80% dDDH makes study for delineating subspecies might nevertheless be of most sense for both the E. coli and the 105-genera Ar- use on many other groups of Bacteria and Archaea that chaea and Bacteria data sets. In addition to clustering are not hampered by similar (taxonomic) constraints. consistency, a value around 80% has a couple of other advantages. For instance, it is sufficiently larger than the Conclusions species boundary at 70% but nevertheless does not yield This study presents the genome sequence for the E. coli too many subspecies if applied strictly. This is particularly type strain DSM 30083T, whose marked physiological and important regarding the low number of currently de- genomic differences from the model bacterium E. coli scribed subspecies in the literature, which in our view K-12 are reviewed in detail. A phylogenomic analysis of makes it also impossible to estimate dDDH subspecies 250 E. coli strains reveals that their arrangement into boundaries from the currently validly named subspecies. the phylotypes suggested in the literature, even though
You can also read