Pandemics Depress the Economy, Public Health Interventions Do Not: Evidence from the 1918 Flu
←
→
Page content transcription
If your browser does not render page correctly, please read the page content below
Pandemics Depress the Economy, Public Health
      Interventions Do Not: Evidence from the 1918 Flu
                      Sergio Correia, Stephan Luck, and Emil Verner*

                                             June 5, 2020

                                                Abstract
          Do non-pharmaceutical interventions (NPIs) aimed at reducing mortality during a
      pandemic necessarily have adverse economic effects? We use variation in the timing
      and intensity of NPIs across U.S. cities during the 1918 Flu Pandemic to examine their
      economic impact. While the pandemic itself was associated with economic disruptions
      in the short run, we find these disruptions were similar across cities with strict and
      lenient NPIs. In the medium run, we find suggestive evidence that, if anything, NPIs
      are associated with better economic outcomes. Our findings indicate that NPIs can
      reduce disease transmission without necessarily further depressing economic activity.

   * Correia:Federal Reserve Board, sergio.a.correia@frb.gov; Luck: Federal Reserve Bank of New York,
stephan.luck@ny.frb.org; Verner: MIT Sloan School of Management, everner@mit.edu.
   The authors thank seminar participants at the Federal Reserve Board, SAECEN, Virtual Finance and
Economics Conference, VMACS, Banco Central de Chile, Stanford GSB, University of Cologne, European
Macro History, MIT, HELP Webinar, and the World Bank, as well as Natalie Cox, Andrew Bossie, Casper
Worm Hansen, Eric Hilt, Simon Jaeger, Aart Kraay (discussant), Sam Langfield, Atif Mian, Kris Mitchener,
Karsten Müller, Michala Riis-Vestergaard, Ole Risager, Hugh Rockoff, Paul Schempp, Francois Velde, and
Dorte Verner for valuable comments. Outstanding research assistance was provided by Fanwen Zhu, and we
thank Hayley Mink for her assistance in researching historical newspaper articles. We thank Casper Worm
Hansen for sharing city-level public spending data.
   The opinions expressed in this paper do not necessarily reflect those of the Federal Reserve Bank of New
York or the Federal Reserve Board.

                                                    1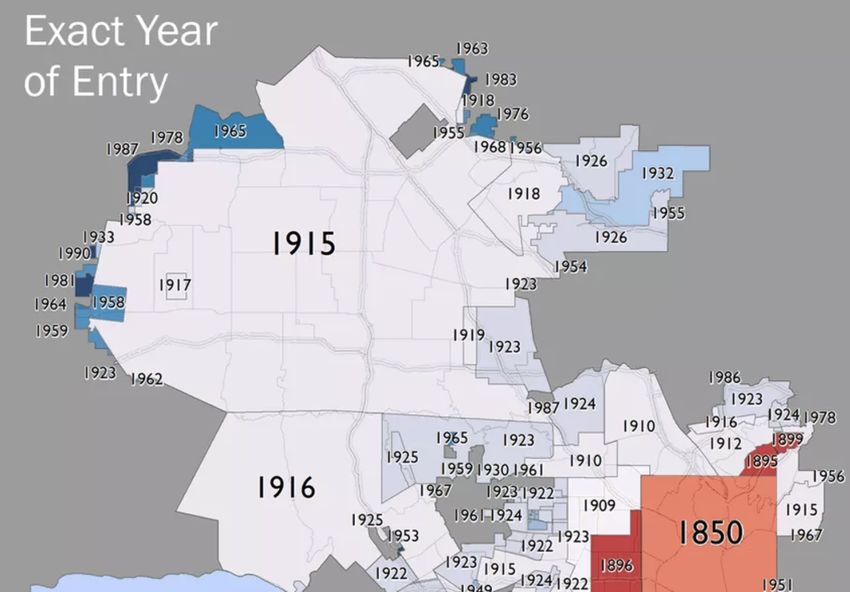
1   Introduction

Do non-pharmaceutical interventions (NPIs) such as social distancing have economic

costs, or can public health measures intended to contain the spread of a pandemic also

reduce its economic severity? The outbreak of the COVID-19 pandemic has sparked urgent

questions about the impact of pandemics and the associated public health responses on

the real economy. In this paper, we examine the economic effects of non-pharmaceutical

interventions during the largest influenza pandemic in U.S. history, the 1918 Flu Pandemic.

    In our empirical analysis, we exploit variation in the speed and intensity of the

implementation of NPIs across U.S. cities during the fall of 1918. NPIs implemented in

1918—although less extensive—resemble policies used to reduce the spread of COVID-

19, including school, theater, and church closures, public gathering bans, quarantine of

suspected cases, and restricted business hours.

    We start by studying the impact of NPIs on mortality. Consistent with existing evidence

from the epidemiology literature (Markel et al., 2007; Hatchett et al., 2007), we find that

NPIs achieved substantial reductions in peak mortality, of about 45%, thereby flattening the

infection curve. We also find evidence that cities that intervened both early and aggressively

experienced a modest reduction in cumulative excess mortality of about 20%. Thus,

NPIs were successful in slowing the rate of disease transmission and, to a lesser extent,

cumulative infection rates, potentially by mitigating epidemic overshoot (Bootsma and

Ferguson, 2007).

    Our main analysis examines the impact of NPIs on economic activity in U.S. cities in

the short and medium-run. In theory, the economic effects of NPIs could be either positive

or negative. All else equal, NPIs constrain social interactions and thus economic activity

that relies on such interactions. However, economic activity in a pandemic is also reduced

in absence of such measures, as households reduce consumption and labor supply to

lower the risk of becoming infected, and firms cut investment in response to increased

uncertainty. Moreover, while the direct effect of NPIs is to lower economic activity, they

                                              1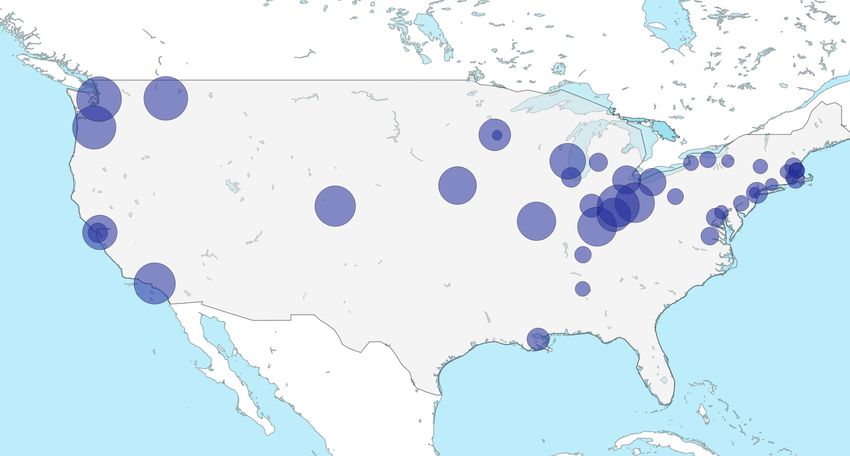
also mitigate the impact of the original shock: the pandemic itself. By containing the

pandemic, NPIs can thus also mitigate the pandemic-related economic disruptions.

   To study the short-term impact of NPIs on local economic activity, we construct a

city-level index of business disruptions at a monthly frequency based on a contemporary

trade journal. Our index implies that the pandemic itself is associated with an increase in

business disruptions in the fall of 1918. The increase in business disruptions is supported

by narrative evidence from contemporary newspapers, which report significant declines

in output and sales across a wide range of industries due to labor shortages and falling

demand. However, when we compare cities with strict and lenient NPIs, we find that the

increase in business disruptions in the fall and winter of 1918 was quantitatively similar

across the two sets of cities. Our findings thus indicate that NPIs did not clearly exacerbate

the economic downturn during the pandemic.

   Further, we examine the economic impact of NPIs in the medium run. We find no

evidence that cities that intervened earlier and more aggressively perform worse in the

years after the pandemic, measured by local manufacturing employment and output and

the size of the local banking sector. At a minimum, our estimates reject that cities with

stricter NPIs experienced a large decline in employment and output in the years following

the pandemic, relative to cities with lenient NPIs. If anything, high NPI cities experience a

relative increase in economic activity from 1919 onwards. Altogether, our findings suggest

that, while pandemics are associated with economic disruptions, NPIs may reduce disease

transmission without exacerbating the pandemic-induced downturn.

   Our findings are subject to the concern that policy responses are endogenous and

may be driven by factors related to future economic outcomes. This concern is somewhat

mitigated by the insight that cities that experienced outbreaks at later dates tended to

implement NPIs sooner within their outbreak, as they learned from the experiences of

cities affected earlier (Hatchett et al., 2007). Thus, as the flu moved from east to west, cities

located further west were faster in implementing NPIs. Importantly, we also show that

our results are robust to controlling for time-varying shocks correlated with characteristics

                                               2
that differ between western and eastern cities, such as the exposure to agriculture, past

population growth, density, and proxies for the quality of local institutions.

      We emphasize caution when generalizing these results to the current COVID-19

outbreak. The 1918 Flu Pandemic was significantly deadlier than what current estimates

suggest for COVID-19, especially for working-age individuals. Thus, the economic merits

of NPIs may have been greater in 1918. NPIs implemented in 1918 were also less extensive

than those used during the COVID-19 outbreak. Moreover, the structure of the U.S.

economy and society has evolved substantially over a century. Nevertheless, our results

suggest that it is not a foregone conclusion that there is a trade-off between reducing

disease transmission and stabilizing economic activity in a pandemic.

      The rest of the paper is structured as follows. Section 2 discusses the historical

background on the 1918 Flu Pandemic and non-pharmaceutical interventions. Section 3

describes our dataset. Sections 4 present our results, and Section 5 offers a discussion and

concluding remarks.

2     Historical Background and Related Literature

2.1     The 1918 Flu Pandemic

The 1918 Flu Pandemic lasted from January 1918 to December 1920, and it spread world-

wide. The number of deaths is estimated to be at least 50 million globally, with about

550,000 to 675,000 occurring in the U.S. (Johnson and Mueller, 2002). The pandemic thus

killed about 0.66 percent of the U.S. population. A distinct feature of the 1918-19 influenza

pandemic was that it resulted in high death rates for 18-44 year old adults and healthy

adults. Figure A1 shows the sharp spike in mortality from influenza and pneumonia in

1918 in the U.S.

      The pandemic came in three different waves, starting with the first wave in spring 1918,

a second wave in fall 1918, and a third wave in the winter of 1918 and spring of 1919. The

pandemic peaked in the U.S. during the second wave in the fall of 1918. This highly fatal

                                               3
second wave was responsible for most of the deaths attributed to the pandemic in the U.S.
Deaths typically occurred about 10 days after contracting the virus (Markel et al., 2007). In
the U.S., the virus was first identified in military personnel in spring 1918. Mass troop
movements during the closing stages of WWI contributed to the spread of the flu in the
U.S. and around the world (Crosby, 2003).
Velde (2020) presents a comprehensive account of the economic impact of the 1918 Flu
Pandemic in the U.S. and documents that it was associated with a short and moderate
recession in the aggregate. Garrett (2009) finds that geographic areas with higher influenza
mortality saw a relative increase in wages from 1914 to 1919 census years, consistent with
labor shortages. Barro et al. (2020) uses country-level data and finds that the 1918 Flu
Pandemic lowered real GDP by 6-8% in the typical country. Dahl et al. (2020) find that
the 1918 pandemic resulted in a V-shaped recession using municipality-level data from
Denmark. Using more disaggregated variation, Guimbeau et al. (2019) and Almond (2006)
find negative effects of the 1918 flu on long-term health and productivity. Using regional
data from Sweden, Karlsson et al. (2014) find that the 1918 pandemic led to a persistent
increase in poverty rates and a reduction in the return on capital.
2.2 Non-Pharmaceutical public health interventions
Most U.S. cities applied a range of NPIs during the second wave in fall 1918. The
measures applied include social distancing measures such as the closure of schools,
theaters, and churches, the banning of mass gatherings, but also other measures such as
mandated mask wearing, case isolation, making influenza a notifiable disease, and public
disinfection/hygiene measures. Measures in 1918 were not as extensive as measures used
to combat COVID-19 in terms of closing non-essential businesses. For instance, rather
than closing businesses altogether, staggered business hours were introduced mostly to
avoid crowding in public transportation.
The epidemiology literature has studied NPIs and their effect on mortality during the
1918 pandemic in depth. Altogether, the evidence suggests that the implementation of
4NPIs was associated with reduced disease transmission (see, e.g., Bootsma and Ferguson,
2007; Hatchett et al., 2007; Markel et al., 2007). The literature finds that early and aggressive
NPIs—measures undertaken right after the flu arrived in a location—led to significant
(around 50%) reductions in peak mortality, i.e. flattening the curve. However, these studies
find more moderate (10-30%) reductions in cumulative mortality.1
3 Data
We build a city-level dataset for the years around the 1918 pandemic with information
on non-pharmaceutical public health interventions, influenza mortality, economic activity,
and bank balance sheets. For city-level NPIs, we rely on data from Markel et al. (2007),
who gather detailed information on NPIs for 43 major U.S. cities from municipal health
department bulletins, local newspapers, and reports on the pandemic (see Appendix Table
A1). We also draw on Markel et al. (2007) for estimates of peak and cumulative excess
mortality from influenza and pneumonia during the 24-week period from September 8,
1919 to February 22, 1919. In addition, we collect annual data on influenza mortality at the
city level from the Center for Disease Control’s (CDC) Mortality Statistics tables.
To study the short-run economic impact of the 1918 Flu Pandemic and associated
NPIs, we construct a monthly city-level measure of business disruptions. We digitize
information on business conditions from Bradstreet’s weekly “Trade at a Glance” tables.2
These tables provide city-level one-word summaries of the conditions of wholesale trade,
retail trade, and manufacturing. We categorize these words into an indicator variable of
whether trade was “Not disrupted” or “Disrupted.”3 We then aggregate this measure into
monthly frequency, as information for some cities is not reported every week. This results
in a monthly series of business disruptions for 25 cities with NPI measures from January
1 Adda (2016), using high-frequency data from France, finds that NPIs reduce the spread of viruses, but
argues that NPIs are not necessarily cost-effective.
2 In concurrent work, Velde (2020) also uses the Trade at a Glance tables to study the impact of mortality
acceleration and business closures on local trade conditions.
3 For robustness, we also construct a three-valued measure that ranks business conditions into “Bad,” “Fair,”
and “Good”.
51918 to September 1919. Further details are provided in the data appendix.
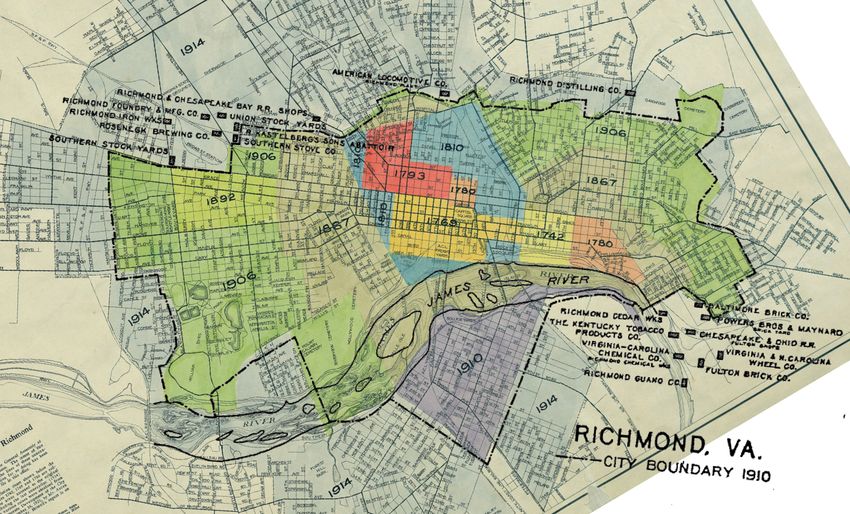
To study the medium-run impact of NPIs, we digitize information on city-level man-
ufacturing activity from the Census of Manufactures. We use manufacturing data on
employment and output for the years 1904, 1909, 1914, 1919, 1921, 1923, 1925, and 1927.
The data appendix describes in detail how we adjust for changes in the Census’ methodol-
ogy and city boundaries over time. We also use city-level annual bank assets as a proxy for
local economic activity, digitized from the Annual Reports of the Comptroller of the Currency.
Finally, we collect variables used to control for baseline economic differences across cities.
We collect state agricultural employment share, city population, and city density from
various decennial censuses. We also use city-level public health spending per capita from
Swanson and Curran (1976) and city-level third Liberty Loan subscriptions from a 1918
hearing before the House of Representatives Committee on Ways and Means.
4 Non-pharmaceutical Interventions and Economic Activity
4.1 Measures of non-pharmaceutical interventions
Our empirical approach uses variation in the speed and intensity of the implementation
of non-pharmaceutical interventions (NPIs) across major U.S. cities in fall 1918. Drawing
on the variables constructed by Markel et al. (2007), we measure NPIs in three ways.
First, we measure the intensity of NPIs by the cumulative sum of the number of days
where three types of NPIs were activated (school closure, public gathering bans, and
quarantine/isolation of suspected cases) in fall 1918, denoted by NPI Intensity.
Second, we measure how quickly an NPI was implemented by the number of days
elapsed between when the city death rate exceeded twice its baseline death rate and the
first day city officials enforced a local NPI. We multiply the day count by minus one so
that higher values indicate a faster response and denote this measure by NPI Speed.
Third, given that the most effective interventions are likely early and aggressive, we
also construct an indicator variable equal to one for cities with both NPI Speed and
6NPI Intensity above their medians, which we refer to as High NPI. High NPI equals one
for 18 cities and zero for 25 cities in the sample of 43 NPI cities. This High NPI measure is
our preferred measure of NPI implementation.
All of the 43 cities analyzed in Markel et al. (2007) eventually adopted at least one of the
three types of NPIs. School closures and cancellation of public gatherings were the most
common. However, there was variation across cities in the speed and aggressiveness of
these measures. The median duration was four weeks, with the longest lasting ten weeks
(Markel et al. (2007)). High NPI cities on average implemented the first NPI about 1.5 days
after the mortality rate reached twice its baseline level, whereas Low NPI cities reacted on
average only after twelve days (see Table A2 in the Appendix). Similarly, High NPI cities
had an average NPI intensity of 133, compared to 56 for the Low NPI cities.
4.2 Identification
An important concern is that NPIs may be endogenous to local health and economic
outcomes. For instance, officials may be more inclined to intervene if the historical
exposure to the flu is higher, which in turn may be correlated with other factors such as
socio-demographic or geographic characteristics (Bootsma and Ferguson, 2007). Another
concern is that interventions reflect the quality of institutions, including the health care
system. Places with better institutions may have a lower cost of intervening, as well as
better economic prospects.
These concerns can in part be addressed by studying the variation in NPIs across cities.
Local responses were not driven by a federal response, as no coordinated pandemic plans
existed. Instead, as the fall wave of the pandemic swept the country from east to west,
cities in the west that were affected later implemented NPIs faster, as they were able to
learn from cities in the east that were affected earlier (see, e.g., Crosby, 2003; Hatchett et al.,
2007). As a result, distance to the East Coast explains a large part of the variation in NPIs
across cities (see Figure A2). In line with being further west, High NPI cities are located in
states whose industry tends to be oriented more toward agriculture (see Table A2). Further,
7they have lower influenza mortality in previous years. On the other hand, High NPI cities
are not significantly different in terms of health spending per capita, density, population
in the 1910 census, or manufacturing employment. The main identification concern is
therefore that differences between cities with aggressive and less aggressive NPIs are
driven by differential responses of cities in the west to the end of WWI, for instance,
because they are more exposed to the agricultural boom and bust (Rajan and Ramcharan,
2015).
Beyond distance from the eastern U.S., there is variation within regions in the speed
and intensity of NPIs driven by the different decisions of local policymakers with limited
information reacting to rapidly changing events. For example, local officials in Minneapolis
moved swiftly to ban public gatherings and close schools in early October. Right across
the Mississippi River, St. Paul remained largely open into November, as its leaders were
confident they had the epidemic under control and believed NPIs would not be effective.4
To address endogeneity concerns, in our regressions we control for several relevant
city-level observables. We control for log city population in 1900 and 1910, city density
in 1910, public health expenditure in 1917 relative to 1910 population, manufacturing
employment in 1914 to 1910 population, and the state agriculture employment share in
1910 (“Baseline controls”). Further, to capture baseline differences in influenza exposure
we also control for lagged influenza and pneumonia mortality in 1917.
4.3 Non-pharmaceutical interventions and mortality
We first examine the relation between NPIs and mortality by estimating city-level regres-
sions of the form
Mortc = α + β NPIc + Xc δ + uc , (1)
4 See “A look back at the 1918 flu pandemic and its impact on Minnesota,” MinnPost, March 4, 2020.
8where Mortc is a city-level measure of mortality from influenza and pneumonia and NPIc
is one of the three NPI measures. Panel A of Table 1 studies the impact of NPIs on weekly
peak mortality. Columns (1)-(3) report the regressions without controls. The estimates are
statistically significant for NPI Intensity and High NPI. For NPI Speed, the point estimate
is negative but not statistically significant, and the R2 is substantially lower. Columns
(4)-(6) show that the estimates are similar with the inclusion of our baseline controls for
city characteristics. Next, columns (7)-(9) reveal that when we include lagged influenza
mortality, the estimates fall slightly, but the estimates on NPI Intensity and High NPI
remain statistically significant. In terms of magnitudes, the estimate in column (9) implies
that high NPI cities experienced a 45% reduction in peak mortality relative to the mean.
NPIs in the fall of 1918 were thus successful in flattening the curve.
In Panel B of Table 1, we examine the relation between NPIs and cumulative excess
mortality over the 24-week period from September 8, 1918 to February 22, 1919. Columns
(1)-(3) show that NPI Intensity and High NPI are associated with statistically significantly
lower cumulative excess mortality in a regression without controls (see also Figure A3).
As in the regressions for peak mortality in Panel A, the estimate on NPI Speed is negative
but not statistically significant. Columns (4)-(6) show that the estimates are similar with
the inclusion of our baseline controls for city characteristics. However, columns (7)-(9)
show that the estimates decline substantially when controlling for lagged mortality. Only
the estimate on High NPI in column (9) remains significant at the 5% level. This estimate
implies a reduction in cumulative mortality of 22% relative to the mean, a magnitude
similar to Hatchett et al. (2007) (20% reduction) and Bootsma and Ferguson (2007) (10-30%
reduction).5
5 These results are broadly consistent with Barro (2020), who finds that NPIs measured by Markel et al.
(2007) led to a reduction in peak mortality, but finds that NPIs did not reduce cumulative mortality. Barro
(2020) suggests this may be because they were not in place long enough. An important difference relative
to Barro (2020) is that we also examine the impact of both timely and aggressive NPIs using the High NPI
measure, which suggests a modest impact also on cumulative mortality.
94.4 Non-pharmaceutical interventions and economic disruptions in the short
run
Were NPIs that flattened the curve associated with a worse downturn in fall 1918? We next
examine the impact of the pandemic and NPIs on city-level business disruptions during the
pandemic. For this, we rely on a monthly index of business disruptions constructed from
Bradstreet’s trade conditions reports. Figure 1 plots the average of our “No disruptions”
variable across cities with above-median NPI Intensity and NPI Speed in the sample of
25 cities for which the index is available. “No disruptions” are assigned a value of 100;
“Disruptions” are assigned a value of 0. Panel (a) plots the combined index for Wholesale
Trade, Retail Trade, and Manufacturing, and the remaining panels plot the index for each
sector separately.6
The first take-away from Figure 1 is that the pandemic itself was associated with
disruptions in economic activity. Panel (a) shows that from September 1918 to February
1919 there is a decline in the combined index. Panels (b)-(d) reveal that the disruptions
were most widespread in manufacturing, followed by wholesale trade. The decline in retail
trade was more modest, and retail trade saw a rebound already in December 1918. The
business disruptions index then displays a gradual recovery through spring 1919. Given
the qualitative nature of the business conditions reports, we cannot ascertain whether the
recovery was to the previous trend or to a lower trend.
The economic disruption in fall of 1918 is also reflected in contemporary newspaper
accounts.7 Reports from the time indicate that the pandemic depressed the economy
through both supply and demand-side channels in the form of productivity reduction,
labor shortages, and falling demand for retail goods. For example, on October 24, 1918,
the Wall Street Journal reported:
6 Figure A6 shows results are similar when splitting cities into those with above and below median
NPI Intensity. Figure A7 shows the results are similar when using a three-valued index for whether trade
conditions are “Bad” (=1), “Fair” (=2), or “Good”(=3).
7 See Appendix C for more extensive evidence of economic disruptions from contemporary newspaper
accounts. Garrett (2008) also provides narrative evidence from local newspaper reports that the pandemic
caused severe disruption to businesses in many sectors of the economy.
10In some parts of the country [the influenza epidemic] has caused a decrease in production
of approximately 50% and almost everywhere it has occasioned more or less falling off.
The loss of trade which the retail merchants throughout the country have met with has
been very large. The impairment of efficiency has also been noticeable. There never has
been in this country, so the experts say, so complete domination by an epidemic as has
been the case with this one. (WSJ, Oct. 24, 1918.)
Newspaper accounts in Appendix C also reveal that output declines were seen across
many sectors of the economy, including coal and copper mining, shipbuilding, textile
production, retail and wholesale trade, and entertainment.8
The second take-away from Figure 1 is that the decline in activity was similar in
high and low NPI cities. In particular, Panel (a) shows that high and low NPI cities see
approximately equal declines in the combined business disruptions index. For example,
from September 1918 to February 1919, high NPI cities saw a 41 point decline in the index,
while low NPI cities saw a 52 point decline. The patterns in Panel (b) for wholesale trade
are similar. Retail trade in Panel (c) also shows similar swings in high and low NPI cities.
Panel (d) for manufacturing shows that high and low NPI cities saw similar declines in
business conditions. The figure indicates that high NPI cities saw a slightly accelerated
decline based on the December 1918 value, as well as a slightly delayed recovery in spring
1919.
To more systematically examine the patterns in Figure 1, Table 2 presents results from
estimating difference-in-differences models of the form
TradeDisruptionsct = αc + τt + β( NPIc × Postt ) + ( Xc × Postt )Γ + ect , (2)
where TradeDisruptionsct is one of the four trade disruptions indexes from Bradstreet’s,
NPIc is one of the three NPI measures, and Xc contains a set of city-level controls, reported
8 In Appendix A, we provide additional suggestive evidence on the economic effects of the pandemic in
the medium run by exploiting cross-sectional variation in exposure to the pandemic across U.S. states and
cities and studying manufacturing outcomes. In line with Garrett (2007); Barro et al. (2020), we find that the
pandemic may have had adverse economic consequences also in the medium run.
11in the table.9 The estimation period is January 1918 to February 1919, and Postt is a dummy
that equals one from August 1918 onward. Across all three NPI measures, higher NPIs
are generally not associated with significant reductions in the combined index (column 1),
the wholesale trade index (column 2), retail trade (column 3), or manufacturing (column
4). While the estimates are generally negative, they are small, and none is statistically
significant.
Taken together, monthly information on business disruptions indicates that cities that
flattened the curve through NPIs did not experience clearly larger disruptions in local
business activity. The pandemic itself was disruptive for the economy, but public health
interventions did not exacerbate the disruptions.
4.5 Non-pharmaceutical interventions and economic activity in the medium
run
Our findings above indicate that cities with stricter NPIs did not experience different
degrees of short-term business disruptions. We now ask whether the same is true in
the medium run. To do so, we use city-level data from the Census of Manufacturers on
employment and output. The advantage of Census data over the high-frequency Bradstreet
disruption index is that Census data are measures of actual economic outcomes instead of
qualitative measures. Moreover, Census data cover all 43 cities with NPI data. However,
a drawback of the Census of Manufactures is that it was only collected every five years
until 1919 and every two years from 1919 onwards. To address this drawback, we also
proxy for local economic activity using data on total national bank assets per city, which
are available at an annual frequency.
We begin by studying the correlation between NPIs and growth in local manufacturing
activity between 1914 and 1919. Figure 2a shows a city-level scatterplot of the growth in
manufacturing employment between the 1914 and 1919 census years against NPI Intensity.
9 Table A4 presents the same table excluding Xc × Postt controls. The results without controls generally
suggest even smaller effects of NPIs on economic disruption.
12If NPIs had a substantial negative effect on the economy, one would expect a negative
relation between the two. However, Figure 2a reveals a positive correlation. An important
concern is that cities with stricter NPIs could have been on different growth trajectories
prior to the 1918 Flu. A natural placebo test to address this concern is to correlate NPIs
with the growth in manufacturing employment between the pair of census years preceding
the pandemic, 1909-1914. Figure 2b shows that there is no correlation between NPIs and
previous growth in manufacturing. These patterns thus provide initial suggestive evidence
that NPIs are not associated with weaker economic activity in the aftermath of the 1918
flu.
To more formally study the medium-term impact of NPIs around the 1918 Flu Pandemic
and to control for other observable characteristics and longer pre-trends, we estimate a
dynamic difference-in-differences equation of the form
Yct = αc + τt + ∑ β j NPIc,1918 1 j=t + ∑ Xs γ j 1 j=t + ε ct , (3)
j6=1914 j6=1914
where Yct is a measure of economic activity in city c, such as the log of manufacturing
employment or national bank assets, and NPIc1918 is one of the NPI measures. The set
of coefficients β j capture the relative dynamics of cities with stricter NPIs. Moreover, Xs
is a set of control variables that are interacted with time indicator variables to allow for
changes in the relation between outcome variables and controls.
Panels (c)-(d) of Figure 2 present the results from estimating Equation (3) for manufac-
turing employment using the NPI Intensity and High NPI measures as regressors.10 The
estimates without controls show that, relative to 1914, cities with stricter NPIs had a higher
level of employment from 1919 onward than those with more lenient NPIs. For instance,
the estimate for 1919 implies that High NPI cities experienced 18% higher employment
growth from 1914 to 1919. Further, the confidence bands indicate that growth lower than
2% can be rejected at the 95% level.
10 Figure A8 shows the results on manufacturing output and value added, as well as with the NPI Speed
measure.
13However, the estimates without controls also show that cities with stricter NPIs grew
faster between 1904-1909, indicating a pre-trend from 14 to 9 years before the pandemic.
This raises the concern that the results may be driven by more general city-growth patterns.
This is not entirely surprising given that most cities with strict NPIs were located further
west. As the structure of the U.S. economy and U.S. cities changed quickly around the
turn of the 20th century, this implied that cities like Los Angeles and Seattle with stricter
NPIs also changed considerably between 1904 and 1909.11
One approach to addressing this concern is to control for observable differences across
cities with strict and lenient NPIs. The estimates with controls in panels (c) and (d) of
Figure 2 indicate that there are no apparent differences between cities with stricter and
more lenient NPIs in the years prior to the 1918 Flu. Once we include controls, the
estimates after 1918 remain positive but are not always significant. For instance, the point
estimate suggests that manufacturing employment in High NPI cities is around 5 percent
higher in 1919 compared to 1914, but the coefficient is not significant. The 95% confidence
intervals suggests that, if anything, cities with stricter NPIs saw a relative increase in
manufacturing employment after 1914, and at the lower bound, we can reject growth lower
than -6% between 1914 and 1919.
To confirm this visual pattern, Table 3 compares the pre- and post-period average
in manufacturing employment and output, while controlling for city observables. The
estimates with controls suggest that High NPI cities see around 11% higher manufacturing
employment and 18% higher output after the pandemic (see column 6) . The estimates
using the other two measures of NPIs are not always significant, but the point estimates
suggest moderate positive effects. The confidence intervals reject a large negative effect of
NPIs on both measures of economic activity.
As mentioned above, a key drawback of using the Census of Manufacturers data is that
data are not available from 1915 through 1918. This raises the concern that cities with strict
and lenient NPIs may have been on different trajectories in this time period. To address
11 For
a detailed discussion of pre-trends in this context, see Lilley et al. (2020a); Correia et al. (2020);
Sant’Anna (2020).
14this concern, Figure 2e and Figure 2f depict estimates of Equation (3) using annual data
on log total national bank assets as the dependent variable.12 With controls, there is no
indication of a pre-trend in national bank assets for cities with stricter NPIs between 1910
an 1917. This is reassuring because if cities with stricter NPIs were growing at a faster
pace before 1918, this should arguably be reflected in the size of the local banking system.
Further, Figure 2e and Figure 2f suggest a slight uptick in bank assets using both the
High NPI and NPI Intensity measure after August 1918. At a minimum, for both NPI
measures, we can reject large negative growth in banking assets for the years 1919 and
1920. Moreover, the overall pattern suggests that there was a sight increase in the size
of the local banking system in the medium term for cities with strict NPIs, although the
confidence bands become wider after 1920. These patterns can be confirmed by comparing
the pre- and post-period average in bank assets in Panel C of Table 3, which suggest that
national bank assets growth tended to be higher in cities with stricter NPIs after 1918.
5 Discussion and Conclusion
This paper examines the impact of non-pharmaceutical interventions during the 1918 Flu
Pandemic on mortality and economic activity. We find that while NPIs flattened the curve
of disease transmission, they were not associated with worse economic performance during
or after the pandemic. Instead, our findings suggest that the main source of economic
disruption was the pandemic itself.
There are several important caveats to keep in mind with our analysis. First, our
sample is limited to only 43 cities. Second, we cannot carefully examine pre-trends for
manufacturing outcomes in the years 1915, 1916, or 1917, as the data is not available at an
annual frequency. Third, the economic environment toward the end of 1918 was unusual
12 The
reporting date for the OCC data is either August or September of a given year. We normalize
coefficients to August 31, 1918. In order to account for Liberty Bond issuance impacting the local banking
system (see, e.g., Hilt and Rahn, 2020), we control for the ratio of the amount subscribed to the Third Liberty
Bond to total bank assets in 1918. Moreover, to account for the 1913 founding of the Federal Reserve System
as well as for heterogeneity across Federal Reserve Districts, we also include reserve district-year fixed effects.
15due to the end of WWI. Fourth, our cross-regional analysis does not allow us to capture
aggregate equilibrium effects of NPIs.
With these caveats in mind, our findings nonetheless raise the question: Why might
NPIs not be economically harmful during a pandemic, and possibly even beneficial in the
medium-term? It is challenging to shed light on the exact mechanisms through which
NPIs affected the economy with the limited data available for 1918, but we offer some
potential channels. The direct effect of NPIs such as theater closures and public gathering
bans is contractionary, as these policies necessarily restrict economic activity. However,
the pandemic itself can be highly disruptive for the economy. Many activities that NPIs
restrict would likely not have occurred even in the absence of NPIs. To avoid contracting
the virus, households cut back on consumption and labor supply (see, e.g., Eichenbaum
et al., 2020), while businesses reduce investment in response to labor shortages, lower
demand, and increased uncertainty. As a result, the counterfactual without NPIs would
still involve a downturn.
Moreover, NPIs may have indirect economic benefits by addressing the root of the
economic disruption—the pandemic itself— in a coordinated fashion. Mitigating the
pandemic can prevent an ultimately worse economic downturn. For example, Bodenstein
et al. (2020) present a two-sector model where NPIs mitigate the decline in output by
flattening the curve, even without significantly reducing cumulative infection. In their
model, production in the sector essential to the economy is less disrupted when illness
and the risk of contracting a virus at a given point in time is lower, leading to a smaller
overall decline in output. Further, by reducing cumulative infection rates, NPIs may have
medium-term economic benefits by directly reducing illness and mortality and by reducing
the costs associated with increased morbidity.
More specific historical details also shed light on why NPIs in 1918 did not worsen the
economic downturn. NPIs implemented in 1918 were milder than the measures adopted
in some countries during COVID-19. More severe measures such as closures of business
likely increase the cost of NPIs. School closures were less costly in 1918, as female labor
16force participation was lower. Estimates suggest that 1918 Flu was more deadly than
COVID-19, especially for prime-age workers, which also suggests more severe economic
impacts of the 1918 Flu and greater medium-run benefits of NPIs. The 1918 H1N1 virus
also had a shorter incubation period than COVID-19, which facilitated identifying and
isolating suspected cases. As a result, we stress the limits of external validity of lessons
from the 1918 Flu Pandemic.
Despite these important differences, ongoing research finds that NPIs implemented in
2020 have reduced disease transmission without leading to substantial further economic
disruptions (see, e.g., Andersen et al., 2020; Lin and Meissner, 2020), and countries that
implemented NPIs in the earlier stages of the COVID-19 pandemic have better short-
term economic outcomes (see, e.g., Demirgüç-Kunt et al., 2020). We look forward to
future research that disentangles the net impact, direct costs, and indirect benefits of NPIs
implemented during COVID-19 in both the short and medium run.
17References
Adda, J. (2016). Economic Activity and the Spread of Viral Diseases: Evidence from High
Frequency Data. The Quarterly Journal of Economics 131(2), 891–941.
Almond, D. (2006). Is the 1918 influenza pandemic over? long-term effects of in utero
influenza exposure in the post-1940 u.s. population. Journal of Political Economy 114(4),
672–712.
Andersen, A. L., E. T. Hansen, N. Johannesen, and A. Sheridan (2020). Pandemic, shutdown
and consumer spending: Lessons from scandinavian policy responses to covid-19.
Working Paper.
Barro, R. J. (2020, April). Non-pharmaceutical interventions and mortality in u.s. cities
during the great influenza pandemic, 1918-1919. Working Paper 27049, National Bureau
of Economic Research.
Barro, R. J., J. F. Ursúa, and J. Weng (2020). The coronavirus and the great influenza
pandemic: Lessons from the “spanish flu” for the coronavirus’s potential effects on
mortality and economic activity. Working Paper 26866, National Bureau of Economic
Research.
Bodenstein, M., G. Corsetti, and L. Guerrieri (2020). Social distancing and supply disrup-
tions in a pandemic. Finance and Economics Discussion Series, Federal Reserve Board.
Bootsma, M. C. J. and N. M. Ferguson (2007). The effect of public health measures
on the 1918 influenza pandemic in u.s. cities. Proceedings of the National Academy of
Sciences 104(18), 7588–7593.
Brainerd, E. and M. V. Siegler (2003). The Economic Effects of the 1918 Influenza Epidemic.
CEPR Discussion Papers 3791, C.E.P.R. Discussion Papers.
Correia, S., S. Luck, and E. Verner (2020). Response to Lilley, Lilley, and Rinaldi.
18Crosby, A. W. (2003). America’s Forgotten Pandemic: The Influenza of 1918. Cambridge
University Press.
Dahl, C. M., C. W. Hansen, and P. S. Jensen (2020). The 1918 epidemic and a v-shaped
recession: Evidence from municipal income data. Working Paper.
Demirgüç-Kunt, A., M. Lokshin, and I. Torre (2020). The sooner, the better: The early
economic impact of non-pharmaceutical interventions during the covid-19 pandemic.
Working Paper.
Eichenbaum, M. S., S. Rebelo, and M. Trabandt (2020). The macroeconomics of epidemics.
Working Paper 26882, National Bureau of Economic Research.
Garrett, T. A. (2007). Economic Effects of the 1918 Influenza Pandemic: Implications for a
Modern-Day Pandemic. Federal Reserve Bank of St. Louis.
Garrett, T. A. (2008). Pandemic economics: the 1918 influenza and its modern-day
implications. Review 90(Mar), 74–94.
Garrett, T. A. (2009). War and pestilence as labor market shocks: U.s. manufacturing wage
growth 1914–1919. Economic Inquiry 47(4), 711–725.
Guimbeau, A., N. M. Menon, and A. Musacchio (2019). The brazilian bombshell? the
long-term impact of the 1918 influenza pandemic the south american way.
Hatchett, R. J., C. E. Mecher, and M. Lipsitch (2007). Public health interventions and
epidemic intensity during the 1918 influenza pandemic. Proceedings of the National
Academy of Sciences 104(18), 7582–7587.
Hilt, E. and W. M. Rahn (2020). Financial asset ownership and political partisanship:
Liberty bonds and republican electoral success in the 1920s. Journal of Economic History,
forthcoming.
Johnson, N. P. A. S. and J. Mueller (2002). Updating the accounts: Global mortality of the
1918-1920 "spanish" influenza pandemic. Bulletin of the History of Medicine 76(1), 105–115.
19Jorgensen, L. (1982). The San Fernando Valley: past and present. Pacific Rim Research.
Karlsson, M., T. Nilsson, and S. Pichler (2014). The impact of the 1918 spanish flu epidemic
on economic performance in sweden: An investigation into the consequences of an
extraordinary mortality shock. Journal of Health Economics 36, 1 – 19.
Lilley, A., M. Lilley, and G. Rinaldi (2020a). Public health interventions and eco-
nomic growth: Revisiting the spanish flu evidence. Unpublished. Available online at
https://ssrn.com/abstract=3590008.
Lilley, A., M. Lilley, and G. Rinaldi (2020b). Public health interventions and economic
growth: Revisiting the spanish flu evidence: Response to correia, luck and verner.
Unpublished. Available online at https://almlgr.github.io/LLR_response.pdf .
Lin, P. Z. and C. M. Meissner (2020). Health vs. wealth? public health policies and the
economy during covid-19. Working Paper.
Markel, H., H. B. Lipman, J. A. Navarro, A. Sloan, J. R. Michalsen, A. M. Stern, and M. S.
Cetron (2007). Nonpharmaceutical Interventions Implemented by US Cities During the
1918-1919 Influenza Pandemic. JAMA 298(6), 644–654.
Rajan, R. and R. Ramcharan (2015). The anatomy of a credit crisis: The boom and bust
in farm land prices in the united states in the 1920s. American Economic Review 105(4),
1439–1477.
Sant’Anna, P. H. C. (2020). Health policies, economic growth and the 1918 spanish flu.
Available online at https://pedrohcgs.github.io/posts/Spanish_flu.
Swanson, J. A. and C. Curran (1976). The fiscal behavior of municipal governments:
1905–1930. Journal of Urban Economics 3(4), 344 – 356.
Velde, F. (2020). What happened to the us economy during the 1918 influenza pandemic?
a view through high-frequency data. Federal Reserve Bank of Chicago Working Paper, No.
2020-11.
20100 100
80 80
No disruptions (%)
No disruptions (%)
60 60
40 40
20 20
0 0
Jan 1918 May 1918 Sep 1918 Jan 1919 May 1919 Sep 1919 Jan 1918 May 1918 Sep 1918 Jan 1919 May 1919 Sep 1919
Month Month
Low NPI High NPI Low NPI High NPI
(a) Combined index (wholesale, retail, and manufacturing) (b) Wholesale
21
100 100
80 80
No disruptions (%)
No disruptions (%)
60 60
40 40
20 20
0 0
Jan 1918 May 1918 Sep 1918 Jan 1919 May 1919 Sep 1919 Jan 1918 May 1918 Sep 1918 Jan 1919 May 1919 Sep 1919
Month Month
Low NPI High NPI Low NPI High NPI
(c) Retail (d) Manufacturing
Figure 1: Non-pharmaceutical interventions and short-run economic disruptions. This figure plots the average across high
and low NPI cities of an indicator variable for whether the Bradstreet Trade conditions suggest “disruptions” in specific sectors.
High NPI cities are defined as cities with above median NPI Intensity and NPI Speed.Seattle
120 120
Oakland
Growth of manuf. employment, 1914-1919
Growth of manuf. employment, 1909-1914
Portland
80
80
Los Angeles
40
Birmingham Los Angeles
Spokane
New OrleansCleveland
San Francisco
Denver
40 Rochester
Omaha Birmingham Cleveland
Grand Rapids Milwaukee
Minneapolis Kansas City Rochester
San Francisco Oakland Kansas City
Baltimore Seattle
Chicago Boston Chicago
NYC Minneapolis
St. Louis Pittsburgh
Baltimore Omaha
Milwaukee
Nashville Saint Paul Philadelphia New Orleans Cincinnati
Grand Rapids
Saint Paul
Pittsburgh
Cincinnati
0 St. Louis
Louisville
Denver
Louisville Lowell Portland
Boston
Philadelphia Nashville
NYC
Lowell Spokane
0
0 50 100 150 0 50 100 150
NPI Intensity NPI Intensity
(a) NPI Intensity and log manufacturing employ- (b) NPI Intensity and log manufacturing employ-
ment growth 1914 to 1919. ment growth 1909 to 1914.
40.0
0.4
20.0
0.2
Coefficient Estimate
Coefficient Estimate
0.0
0.0
-20.0
-0.2
-0.4 -40.0
1904 1909 1914 1919 1921 1923 1925 1927 1904 1909 1914 1919 1921 1923 1925 1927
Year Year
Without controls With controls Without controls With controls
(c) NPI Intensity and log manufacturing employ- (d) High NPI and log manufacturing employment.
ment.
2 60
40
1
Coefficient Estimate
Coefficient Estimate
20
1
0
0
-20
-1 -40
1910 1912 1914 1916 1918 1920 1922 1924 1910 1912 1914 1916 1918 1920 1922 1924
Year Year
Without controls With controls Without controls With controls
(e) NPI Intensity and log National Bank Assets. (f) High NPI and log National Bank Assets.
Figure 2: Non-pharmaceutical interventions in fall 1918 and medium-run economic
outcomes. Panel (c) through (f) show results from estimating Equation (3) for various
outcomes with and without controls. 95% confidence bands.
22Table 1: Non-pharmaceutical interventions, peak mortality, and cumulative mor-
tality.
Panel A: Peak Mortality
(1) (2) (3) (4) (5) (6) (7) (8) (9)
NPI Intensityc -0.62 -0.55 -0.45
(0.11) (0.16) (0.19)
NPI Speedc -1.00 -0.55 -0.42
(0.96) (1.13) (0.87)
High NPIc -56.8 -52.6 -44.2
(11.5) (14.6) (17.4)
R2 .33 .025 .32 .4 .22 .43 .45 .34 .47
Effect size (%) -55.4 -22.8 -57.6 -49.3 -12.5 -53.3 -40.5 -9.7 -44.8
Panel B: Cumulative Excess Mortality
(1) (2) (3) (4) (5) (6) (7) (8) (9)
NPI Intensityc -1.03 -1.28 -0.62
(0.37) (0.46) (0.42)
NPI Speedc -3.20 -2.82 -2.21
(2.61) (3.37) (1.82)
High NPIc -140.8 -163.2 -109.3
(35.0) (40.5) (42.3)
R2 .12 .033 .26 .24 .12 .37 .52 .5 .6
Effect size (%) -18 -14.2 -27.9 -22.4 -12.5 -32.3 -10.9 -9.8 -21.6
N 43 43 43 43 43 43 43 43 43
Baseline Controls Yes Yes Yes Yes Yes Yes
Lagged Mort. Control Yes Yes Yes
Notes: This table presents city-level regressions of peak mortality (panel A) and cumulative excess
mortality (panel B). Mortality refers to influenza and pneumonia mortality. Data on peak and
cumulative mortality and NPIs are from Markel et al. (2007). Peak mortality is the weekly excess
death rate per 100,000 in the first peak of the fall 1918 pandemic. Cumulative excess mortality
is the total excess death rate from September 8, 1918 to February 22, 1919. “Baseline Controls"
are city log 1900 and 1910 population, city 1914 manufacturing employment to 1910 population,
city public health spending per capita, city density, and state 1910 agriculture employment share.
“Lagged Mort. Control" is the city-level influenza and pneumonia mortality in 1917. “Effect
size” for NPI Intensity, NPI Speed, and High NPI variables are calculated as 100 β̂ NPI Intensity/Y,
100 β̂ DaysToPeak/Y, and 100 β̂ /Y, respectively. Here NPI Intensity = 88, DaysToPeak = 22.4, and Y is
the mean of the dependent variable. DaysToPeak is the number of days between the acceleration
and the peak of deaths rates. Robust standard errors in parentheses.
23Table 2: Non-pharmaceutical interventions and short-term economic disrup-
tions in Bradstreet’s Trade Conditions.
Panel A: NPI Intensity Measure
Combined: Wholesale Retail
W+R+M Trade Trade Manufacturing
(1) (2) (3) (4)
NPI Intensityc × Postt -0.088 -0.12 -0.030 -0.12
(0.065) (0.13) (0.15) (0.12)
R2 (Within) .0097 .0074 .00036 .012
N 344 343 342 340
Panel B: NPI Speed Measure
(1) (2) (3) (4)
NPI Speedc × Postt -0.11 -0.64 0.097 0.12
(0.45) (0.61) (0.94) (0.33)
R2 (Within) .00052 .0069 .00013 .00041
N 344 343 342 340
Panel C: High NPI Measure
(1) (2) (3) (4)
High NPIc × Postt -3.86 -6.69 7.65 -15.3
(7.78) (13.4) (14.5) (10.2)
R2 (Within) .0028 .0033 .0035 .028
N 344 343 342 340
No of cities 25 25 25 25
City and Time FE Yes Yes Yes Yes
Controls Yes Yes Yes Yes
Notes: This table presents estimates of equation (2). The dependent variables are monthly
city-level indexes of economic disruptions that take a value of 100 for “No disruptions” and
0 for “Disruptions” (see Appendix D for details). Controls interacted with Postt are log 1900
and 1910 city population, 1910 city density, 1917 health spending per capita, manufacturing
employment in 1914 to 1910 population, 1910 state agriculture employment share, and 1917
influenza and pneumonia mortality. Standard errors are clustered at the city level.
24Table 3: Non-pharmaceutical interventions and local manufacturing employ-
ment, output, and bank assets.
Panel A: Manufacturing Employment
(1) (2) (3) (4) (5) (6)
NPI Intensityc × Postt 0.317 0.080
(0.081) (0.038)
NPI Speedc × Postt 0.753 0.381
(0.402) (0.258)
High NPIc × Postt 25.757 10.879
(8.201) (4.834)
R2 (Within) .19 .45 .03 .45 .14 .46
N 344 344 344 344 344 344
No of Cities 43 43 43 43 43 43
Panel B: Manufacturing Output
(1) (2) (3) (4) (5) (6)
NPI Intensityc × Postt 0.213 0.029
(0.088) (0.063)
NPI Speedc × Postt 0.714 0.371
(0.397) (0.390)
High NPIc × Postt 20.503 9.497
(9.009) (7.472)
R2 (Within) .066 .25 .021 .25 .071 .26
N 344 344 344 344 344 344
No of Cities 43 43 43 43 43 43
Panel C: National Bank Assets
(1) (2) (3) (4) (5) (6)
NPI Intensityc × Postt 0.246 0.265
(0.129) (0.149)
NPI Speedc × Postt 1.124 1.125
(0.611) (0.619)
High NPIc × Postt 15.657 14.228
(10.973) (9.281)
R2 (Within) .026 .083 .034 .089 .021 .075
N 683 683 683 683 683 683
No of Cities 43 43 43 43 43 43
City and Time FE Yes Yes Yes Yes Yes Yes
Controls No Yes No Yes No Yes
Notes: This table reports results from estimating a regression of the form:
Yct = αc + τt + β × NPIc1918 × Postt + γ × Xt × Postt + ect ,
where NPIc is either High NPI, NPI Speed or NPI Intensity; Postt =1 from 1919 onwards; Xs contains the
1910 state-level agriculture employment share, city-level 1914 manufacturing to 1910 population, city-level
1910 and 1900 log population, 1910 city density, per capita city health spending, and city-level mortality in
1917. The dependent variable is average manufacturing employment for Panel A and output for Panel B,
using data from the 1904, 1909, 1914, 1919, 1921, 1923, 1925, and 1927 census. In Panel C, the dependent
25 data at annual frequency from 1910 to 1925. Further,
variable is total assets of national banks per city, using
columns 2, 4, and 6 of Panel C also control for city-level subscriptions to the third Liberty Loan (May
1918) normalized by total national bank assets as of August 1918, and Federal Reserve District fixed effects.
Standard errors clustered at the city level in parentheses.ONLINE APPENDIX
Appendix A: Mortality and Manufacturing Outcomes
Appendix B: Supplementary Tables and Figures
Appendix C: Narrative Evidence from Historical Newspaper Archives
Appendix D: Data
A The Effects of Mortality On Manufacturing Outcomes
In this appendix, we provide suggestive evidence that the severity of the 1918 Flu is
correlated with lower economic activity using variation across U.S. states and cities. In
particular, we use two approaches to estimate the impact of the 1918 Flu Pandemic on the
real economy. The first approach is a standard difference-in-differences specification:
Yst = αs + τt + ∑ β j Mortalitys,1918 1 j=t + ∑ Xs γ j 1 j=t + ε st (4)
j6=1914 j6=1914
where Yst is an outcome such as log manufacturing employment in a local area s in year t.
The sequence of coefficients β j captures the dynamics of severely affected areas such as
Pennsylvania relative to mildly affected areas such as Minnesota. Our baseline measure
of local exposure to the 1918 pandemic is the local mortality rate from influenza and
pneumonia per 100,000 inhabitants in 1918, Mortalitys,1918 .
The identifying assumption behind estimation of (4) is parallel trends, i.e., Mortalitys,1918
is not correlated with other time-varying, regional economic shocks. While there is sig-
nificant geographic variation in the severity of the pandemic, studies using state-level
variation in Mortalitys,1918 argue that the spread of the virus was somewhat arbitrary and
that regional variation in mortality was largely orthogonal to ex ante economic conditions
(Brainerd and Siegler, 2003). Eastern states and cities were more severely affected, as the
influenza arrived from Europe and travelled from east to west, but there is variation within
U.S. regions.
It is not obvious that Mortalitys,1918 would be correlated with other economic shocks
that differentially affected U.S. regions. Nevertheless, the period 1918-1921 witnessed
a variety of macroeconomic shocks, most notably the end of WWI, a large agricultural
boom and bust cycle, and a severe recession in 1920-21, (see, e.g., Velde, 2020). To
account for potential differential exposure to these shocks, at the state level we control for
the agriculture employment share, manufacturing employment share, urban population
share, population, income per capita, and a war production dummy from Garrett (2007),
represented by Xs in (4). At the city level, we control for 1910 population, manufacturing
employment in 1914 to 1910 population, health expenditures in 1917 to 1910 population,
city density in 1910, state agriculture employment share in 1910, and the state-level war
production dummy. As in the main body of the text, all controls are measured before the
261918 pandemic and are always interacted with time fixed effects to control for time-varying
shocks that are correlated with baseline differences across regions. We also present tests
using a variety of additional controls.
A concern with exploiting variation in Mortalitys,1918 is that mortality may be endoge-
nous to economic outcomes. For example, higher mortality may have been a result of dire
economic trajectories, so the parallel trends assumption may not be satisfied using varia-
tion in Mortalitys,1918 . To address this challenge, in our second approach, we instrument
Mortalitys,1918 with ex ante exposure to military camps, similar to the empirical strategy
suggested by Hilt and Rahn (2020). WWI military camps were important clusters and
vectors of infection. For instance, Fort Devens in Boston was the first cluster after the virus
arrived from Europe, and it was transmitted to other camps via troop movements (Crosby,
2003). Troops lived in close quarters, leading to rapid spread within camps, and troop
movements disseminated virus across camps and to nearby cities. Camp location choice
often also driven by historical military sites. For instance, Camp Funston in Kansas was
built close to the historical military base in Fort Riley. Camp Colt in Pennsylvania was
installed the historical Civil War site of Gettysburg.
We collect information on the location and size of 40 military camps used on the
continental U.S. in use during WWI (see Appendix D.3 for details). For each city, we
construct a city-level instrument based on the weighted inverse distance to military camps:
ln(camp size j )
Zc = ∑ ln(distc,j )
.
j
camp size j is the average number of troops stationed in camp j from July to September
1918, the onset of the second wave of the 1918 Flu Pandemic. distc,j is the shortest path
distance between city c and camp j. In this formulation, larger camps receive a higher
weight, and each camp’s relative importance to city c is weighted by the distance to city c.
We also construct this instrument at the state-level using the distance between camp j and
the state centroid.
Our military camps instrument Zc is a reasonably strong predictor of 1918 city-level in-
fluenza and pneumonia mortality at the city-level. The first-stage F-statistic of a regression
of 1918 city level mortality on Zc is 19.9 without controls and 13.6 with baseline controls.
At the state level, the first-stage F-statistics for the instrument are 3.25 without controls
and 11.31 with controls.
One potential concern with military camps exposure as an instrument for Mortalitys,1918
is that military camps may have been close to locations with war production. During the
war, these locations may have benefited from stronger growth in output. This concern is
mitigated by examining the evolution of manufacturing outcomes from 1914, before the
ramp-up in production, to 1919. Moreover, we find that controlling for a dummy variable
for whether a state was heavily involved in war production from Garrett (2007) does not
alter the results. Based on the measure from Garrett (2007), the location of military camps
does not appear to be strongly related to major centers of war production.
27You can also read