Comprehensive Five-year Affordable Housing Study - Tuscaloosa, Alabama October 2018 - Framework
←
→
Page content transcription
If your browser does not render page correctly, please read the page content below
Comprehensive Five-year
Affordable Housing Study
Tuscaloosa, Alabama
October 2018
ii Tuscaloosa, Alabama | 2018 Five-year Affordable Housing Study

CONTENTS
1. EXECUTIVE SUMMARY . . . . . . . . . . . . . . . . . . . . . . . . . . . . . . . . . . .  2
Highlights from Study .  .  .  .  .  .  .  .  .  .  .  .  .  .  .  .  .  .  .  .  .  .  .  .  .  .  .  .  .  .  .  .  .  .  .  .  .  .  .  .  .  .  .  .  .  .  .  .  .  .  .  .  .  .  .  .  .  .  .  .  . 3

2. COMMUNITY PROFILE . . . . . . . . . . . . . . . . . . . . . . . . . . . . . . . . . . .  6
Demographic Trends and Projections.  .  .  .  .  .  .  .  .  .  .  .  .  .  .  .  .  .  .  .  .  .  .  .  .  .  .  .  .  .  .  .  .  .  .  .  .  .  .  .  .  .  .  .  .  .  . 7
Economic Trends.  .  .  .  .  .  .  .  .  .  .  .  .  .  .  .  .  .  .  .  .  .  .  .  .  .  .  .  .  .  .  .  .  .  .  .  .  .  .  .  .  .  .  .  .  .  .  .  .  .  .  .  .  .  .  .  .  .  .  .  .  .  .  . 15
Housing Trends .  .  .  .  .  .  .  .  .  .  .  .  .  .  .  .  .  .  .  .  .  .  .  .  .  .  .  .  .  .  .  .  .  .  .  .  .  .  .  .  .  .  .  .  .  .  .  .  .  .  .  .  .  .  .  .  .  .  .  .  .  .  .  .  . 18   Appendices
                                                                                                                                                                                                                      • Appendix A:
3. HOUSING INVENTORY. . . . . . . . . . . . . . . . . . . . . . . . . . . . . . . . . .  22                                                                                                                             Summary of Assisted
                                                                                                                                                                                                                        Housing Programs
Housing Inventory.  .  .  .  .  .  .  .  .  .  .  .  .  .  .  .  .  .  .  .  .  .  .  .  .  .  .  .  .  .  .  .  .  .  .  .  .  .  .  .  .  .  .  .  .  .  .  .  .  .  .  .  .  .  .  .  .  .  .  .  .  .  . 24
Housing Conditions.  .  .  .  .  .  .  .  .  .  .  .  .  .  .  .  .  .  .  .  .  .  .  .  .  .  .  .  .  .  .  .  .  .  .  .  .  .  .  .  .  .  .  .  .  .  .  .  .  .  .  .  .  .  .  .  .  .  .  .  .  . 34
                                                                                                                                                                                                                      • Appendix B:
Proximity to Community Assets. . . . . . . . . . . . . . . . . . . . . . . . . . . . . . . . . . . . . . . . . . . . . . . . . . . 40                                                                                   Tuscaloosa Housing
                                                                                                                                                                                                                        Policy Document
4. CURRENT POLICIES. . . . . . . . . . . . . . . . . . . . . . . . . . . . . . . . . . . . .  44                                                                                                                        Summaries
Housing Policy Inventory .  .  .  .  .  .  .  .  .  .  .  .  .  .  .  .  .  .  .  .  .  .  .  .  .  .  .  .  .  .  .  .  .  .  .  .  .  .  .  .  .  .  .  .  .  .  .  .  .  .  .  .  .  .  .  .  . 45
Current Policy Direction .  .  .  .  .  .  .  .  .  .  .  .  .  .  .  .  .  .  .  .  .  .  .  .  .  .  .  .  .  .  .  .  .  .  .  .  .  .  .  .  .  .  .  .  .  .  .  .  .  .  .  .  .  .  .  .  .  . 46              • Appendix C:
                                                                                                                                                                                                                        Housing Agencies,
Policy Direction to Consider. .  .  .  .  .  .  .  .  .  .  .  .  .  .  .  .  .  .  .  .  .  .  .  .  .  .  .  .  .  .  .  .  .  .  .  .  .  .  .  .  .  .  .  .  .  .  .  .  .  .  .  .  .  . 47                       Nonprofits, and
                                                                                                                                                                                                                        Programs Providing
5. NEEDS ASSESSMENT. . . . . . . . . . . . . . . . . . . . . . . . . . . . . . . . . . . .  48                                                                                                                          Assistance and
                                                                                                                                                                                                                        Services in
Drivers of Supply .  .  .  .  .  .  .  .  .  .  .  .  .  .  .  .  .  .  .  .  .  .  .  .  .  .  .  .  .  .  .  .  .  .  .  .  .  .  .  .  .  .  .  .  .  .  .  .  .  .  .  .  .  .  .  .  .  .  .  .  .  .  .  . 50     Tuscaloosa
Drivers of Demand. .  .  .  .  .  .  .  .  .  .  .  .  .  .  .  .  .  .  .  .  .  .  .  .  .  .  .  .  .  .  .  .  .  .  .  .  .  .  .  .  .  .  .  .  .  .  .  .  .  .  .  .  .  .  .  .  .  .  .  .  .  . 58
                                                                                                                                                                                                                      • Appendix D:
6. STRATEGIES TO CONSIDER. . . . . . . . . . . . . . . . . . . . . . . . . . . . . . .  64                                                                                                                              Endnotes
Strategies and Tools for Consideration.  .  .  .  .  .  .  .  .  .  .  .  .  .  .  .  .  .  .  .  .  .  .  .  .  .  .  .  .  .  .  .  .  .  .  .  .  .  .  .  .  .  .  .  . 65

Terms used within this report are either defined within the body of the report, within Appendix D: Endnotes, or
  within the project glossary (a stand-alone document that defines terms used in this process).

                                                                                                                                       2018 Five-year Affordable Housing Study | Tuscaloosa, Alabama                                          1
Chapter 1: Executive Summary

    1/                        EXECUTIVE
                              SUMMARY
    This Five-Year Affordable Housing Study is intended
    to provide information related to housing trends and
    issues to help inform development of the Tuscaloosa
    Framework comprehensive planning effort. This
    Executive Summary highlights the critical findings of
    this effort.

2    Tuscaloosa, Alabama | 2018 Five-year Affordable Housing Study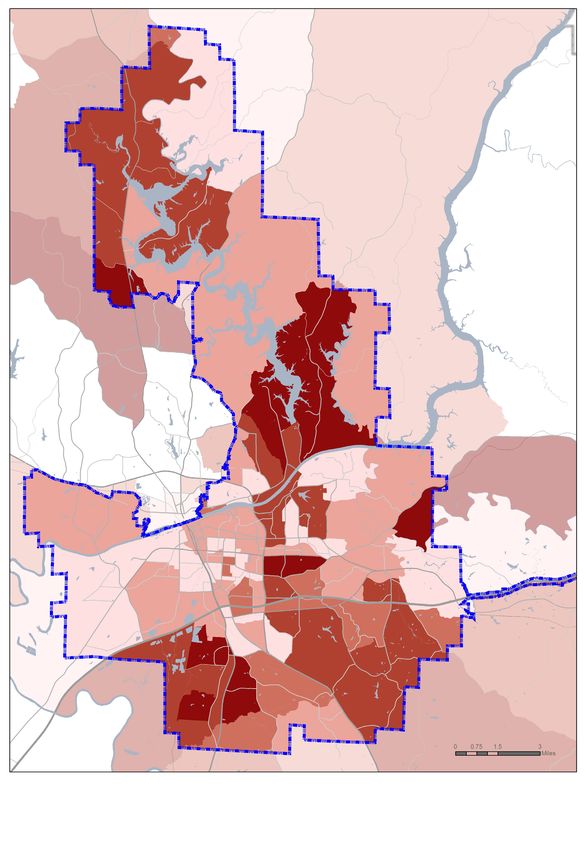
Chapter 1: Executive Summary

HIGHLIGHTS FROM STUDY
PURPOSE OF STUDY
The Five-Year Affordable Housing Study was developed to provide foundational information related to
housing and neighborhoods in Tuscaloosa that can assist with making decisions about future policy direction
for the city as part of the Tuscaloosa Framework comprehensive planning process. It was also developed to
provide information that can be used to update the city's Five-Year Consolidated Housing Plan required by
the U.S. Department of Housing and Urban Development. This Comprehensive Five-Year Affordable Housing
Study is organized into six key sections:
1.	 Executive Summary
2.	 Community Profile (sociodemographic and market trends)
3.	 Housing Inventory (types of units, condition, and location)
4.	 Current Policies (summary of current policy direction)
5.	 Needs Assessment (analysis of 5-year forecasts for housing demand and supply)
6.	 Strategies to Consider (Strategies and tools to consider during Tuscaloosa Framework process)

KEY FINDINGS
This study provides several key trends and forecasts that are important to consider when evaluating future
housing policy direction:
• Tuscaloosa is Growing and Expected to Grow Faster Than Most Places in Alabama. The city
  has increased its population by 24% since 2000, faster than the five largest cities in Alabama. Most of
  this past growth is attributed to growth in enrollment at the University of Alabama, which is projected to
  stabilize. While the city is forecast to grow, that growth will likely be slower than that which occurred over
  the past 20 years. Forecasts suggest that the Tuscaloosa MSA (Tuscaloosa, Hale, and Pickens Counties)
  will grow by 21.4%, the second highest growth rate after Huntsville (39%).

• Tuscaloosa is a Regional Center for Jobs. Nearly 70% of people working in Tuscaloosa commute in
  from outside of the city. This suggests that the city is a regional economic hub. It also suggests that there
  may not be ample housing for workers wanting to live in the city.

• Housing Prices are Increasing and Above 2008 Levels. Recent sales trends suggest that housing
  values are higher than pre-recession levels and climbing, and that there is an increase in sales at the
  highest end of the market and a lower number of homes selling for $175,000-$300,000. This suggests
  that there is a shortage of homes available at these moderate price points.

• Non-Student Rental Market is Tight and Student Housing Distorts Pricing. The prevalence of
  college students in Tuscaloosa seems to have had a significant impact on the local rental market. The
  point in time rental market analysis shows that student rental housing has higher per bedroom market
  lease rates when compared to non-student rental housing. Vacancy rates are very low suggesting that
  there is a limited supply of rental housing for both students and non-student households. The higher
  value return of student rental housing is likely driving developers of rental properties to focus on student
  rental units versus traditional housing for families and households.

                                                          2018 Five-year Affordable Housing Study | Tuscaloosa, Alabama   3
Chapter 1: Executive Summary

    • Need to Address Aging Housing Stock and Affordability. A significant portion of
      the city's housing stock is over 40 years old. These homes are typically more affordable
      than newer homes, but many require significant updates to keep them viable. Analysis
      of home improvement loan applications suggest that many homeowners in Tuscaloosa
      are attempting to make improvements to their homes and are being denied loans
      (88% denial rate in 2016). There are likely opportunities to assist these homeowners to
      maintain the naturally occurring stock of affordable housing in the city.

    • Significant Increase in Seasonal, Recreational, and Occasional Use Homes
      Is Reducing Housing Stock Available to Renters and Owners. Since 2010, the
      American Community Survey estimates that an additional 7,898 units have been built
      or converted for use as student housing, game day homes, second homes, short-term
      rentals, or other occasional use housing. The total number of units in this category is
      equivalent to 19% of the city's total housing stock. It is likely that the uptick in these
      types of units and the profits generated from them is having an impact on the types of
      housing being produced in Tuscaloosa, and reducing the number of units for sale and
      rent to households looking for permanent housing.

    • Poverty Rates Have Been Stable Over Time and Children Have the Highest
      Rate of Poverty. While the local college student populations does skew the poverty
      rates for the city (24%), further exploration reveals that college students make up
      approximately 5%, reducing the poverty rate of the permanent population to 19%. The
      largest age cohort suffering from poverty in Tuscaloosa is children under 18 years old.
      29% of children under 18 in Tuscaloosa are living in poverty.

    • Five Year Forecast Shows Demand Will Generally Meet Supply, But May
      Not Actually Provide the Units Needed. Forecasts that compare future housing
      demand and supply for the next five years suggest that if current trends continue,
      there will likely be the equivalent number of units in the city's housing supply to meet
      demand. However, many trends suggest that there may be a mismatch between the
      units available, and the types of units that are being demanded, both in terms of price
      point and in terms of the type of unit. The analysis suggests there will be a need for
      housing units at a full range of price points.
    • Future Demographic Shifts May Put Pressure on Certain Housing Types.
      Forecasts for future age cohorts suggest that there will likely be new demand for
      starter homes for first time homebuyers and housing affordability to working families,
      as well as senior housing or units suitable for households to age-in-place safely. These
      are likely units that will be in demand in the coming years.

    CURRENT POLICY DIRECTION
    An analysis of current policies found in city adopted plans identifies four key areas of strong policy
    direction in Tuscaloosa:
    • Protecting Neighborhood Character
    • Promoting Housing Diversity
    • Assisting Lower Income Households
    • Serving Neighborhoods

4   Tuscaloosa, Alabama | 2018 Five-year Affordable Housing Study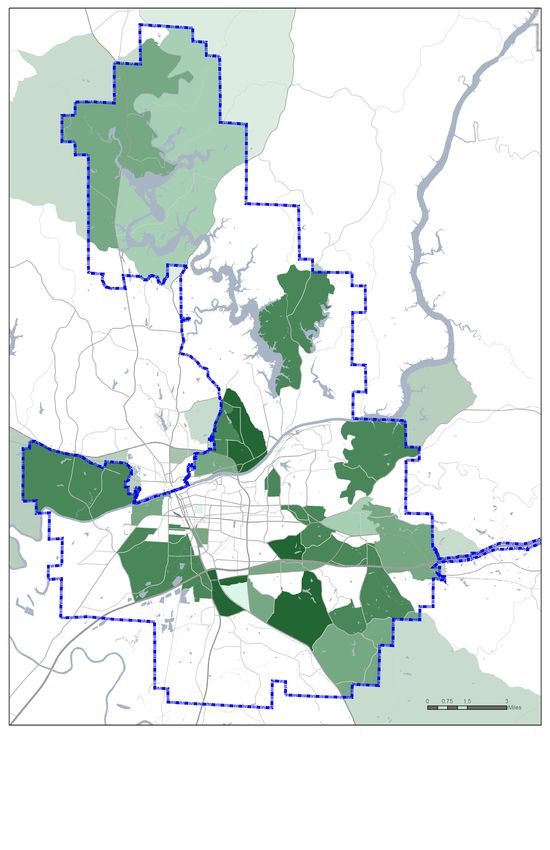
Chapter 1: Executive Summary

STRATEGIES TO CONSIDER
Using input from stakeholder interviews conducted in July 2018 with elected officials, advisory board
members, neighborhood leaders, local businesses, real estate developers and landowners, and other
community stakeholders, this report provides an array of potential tools and strategies to consider
implementing through the city's new comprehensive plan. (See Chapter 6 for details on each of
these strategies to consider.) These strategies to consider have been organized under the same four
key policy areas listed on the previous page.

Protecting Neighborhood Character
• Context sensitive standards for redevelopment and infill
• Neighborhood compatibility standards for new uses and transitions
• Tree protection
• Street designs that match neighborhood context and mobility preferences
• Enhance regulations addressing student rental housing
• Strategies to Address Blighted and Vacant Properties
• Good neighborhood program for students living in city neighborhoods

Promoting Housing Diversity
• Adjust Zoning standards to allow for a broader mix of unit types
• Consider public-private partnerships to assist with home improvement loans and
  construction of workforce housing
• Establishing housing land trust1

Assisting Lower Income Households
• Implement existing affordable housing plans
• Assist with rehabilitation of older homes to maintain affordable housing stock
• Support development of rental housing
• Support investment without creating displacement of existing residents

Serving Neighborhoods
• Create complete neighborhoods
• Target community investments to priority redevelopment areas
• Support job creation to employ local residents
• Plan for increased transit assistance to aging seniors

These strategies can be evaluated further in the Tuscaloosa Framework process to
identify the appropriate policy direction to implement as part of the new comprehensive
plan.

                                                              2018 Five-year Affordable Housing Study | Tuscaloosa, Alabama   5
Chapter 2: Community Profile

    2/                       COMMUNITY
                             PROFILE
                                                                    Chapter Contents
    Tuscaloosa's housing market is influenced                       • Demographics Trends
    by a myriad of factors that combined                            • Economic Trends
                                                                    • Housing Trends
    determine the ultimate demand for housing
    by households and supply of housing built by
    housing developers. This Community Profile
    highlights key demographic, economic,
    and housing trends that influence the local
    housing market.

                                                                    Caption?

6   Tuscaloosa, Alabama | 2018 Five-year Affordable Housing Study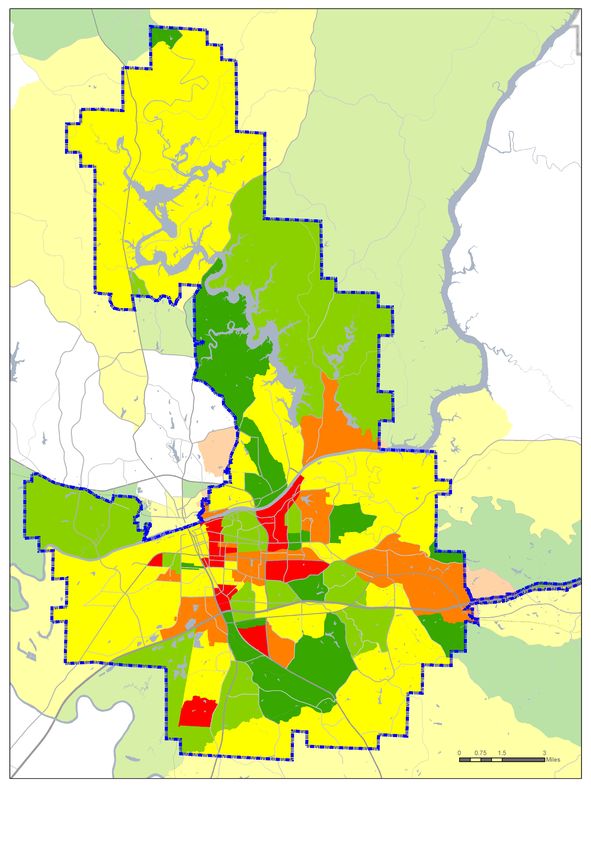
Chapter 2: Community Profile

DEMOGRAPHIC TRENDS AND
PROJECTIONS
GROWING FASTER THAN MOST PARTS OF THE STATE
Since 2000 and according to American Community Survey 5-year estimates,
Tuscaloosa's population has grown from 77,906 to 96,352 in 2016; an increase of
18,446 (24%). U.S. Census 2017 single-year estimates put the city's population at
100,287. The areas within Tuscaloosa County not including the City of Tuscaloosa
grew 22%, and the state as a whole grew 9% during the same timeframe. Tuscaloosa                        SOURCES:
                                                                                                        Demographic trends
grew the fastest of the big five cities in Alabama (see Table 2.1 for a comparison of                   are based on an
metro areas).                                                                                           analysis of Census
                                                                                                        data, American
          TABLE 2.1 COMPARISON OF METRO AREA                                                            Community Survey
          POPULATION GROWTH (2000 - 2016)                                                               data, and population
                                                                                                        projections were
                                                                                                        prepared by the
                                                                              2000-2016                 Center for Business
           City                     2000 Pop.           2016 Pop.
                                                                            Pop. Change                 and Economic
                                                                                                        Research at the
           Tuscaloosa                  77,906              96,352                  24%
                                                                                                        University of Alabama.
           Birmingham                 242,820             212,424                 -13%
           Huntsville                 158,216             188,973                  19%
           Mobile                     198,915             193,717                  -3%
           Montgomery                 201,568             201,717                   0%
          Source: U.S. Census (2000) and American Community Survey (2012-2016)

PROJECTED TO GROW FASTER                                   DRIVERS OF GROWTH
THAN THE STATE AND MANY                                    The population growth in Tuscaloosa may be partially
OTHER METRO AREAS                                          attributed to a substantial increase in the number
The Tuscaloosa MSA, comprised of                           of students attending The University of Alabama.
Tuscaloosa, Hale and Pickens Counties,                     Enrollment has nearly doubled since the year 2000,
is projected to grow by 21.4% between                      increasing by 18,347 students to a total of 37,665
2010 and 2040 compared to 11.3%                            enrolled in 2016.
growth in the state as a whole. By                         While the University’s enrollment growth is similar
comparison, the only other larger MSA                      in number to the city’s overall population growth,
that is projected to grow over 20% is                      it should be noted that a portion of these students
Huntsville (with a projected increase                      do not live in Tuscaloosa (student residency data is
of 39%) as estimated by the Center for                     unavailable). Also, the Census counts and estimates
Business and Economic Research at the                      from the American Community Survey typically
University of Alabama.                                     underreport college student populations.
                                                           Another driver of the city’s
                                                                                 City’s past
                                                                                        past growth
                                                                                             growth is
                                                                                                     is employment.
                                                           The city of Tuscaloosa
                                                           employment.   The City of
                                                                                  hasTuscaloosa
                                                                                        added 6,000
                                                                                                 hasnew
                                                                                                      added
                                                                                                          jobs6,000
                                                                                                                since
                                                           2009jobs
                                                           new   (seesince
                                                                      page2009
                                                                           11). (see page 11).

                                                                 2018 Five-year Affordable Housing Study | Tuscaloosa, Alabama   7
Chapter 2: Community Profile

    TUSCALOOSA HAS A YOUNGER                                           AND AN AGING POPULATION
    POPULATION                                                         While Tuscaloosa has a population that is younger
    With a median age of 28.6 the city is 10 years                     overall compared to the state, the older segment of
    younger than the state, which has a median age of                  the population is growing.
    38.6. Figure 2.1 illustrates the 2016 population by                Tuscaloosa County is projected to experience aging
    age cohort.                                                        of the population over the next several decades.
    The University of Alabama’s student population                     2040 projections put the county’s 65 and over
    plays a significant role in this younger                           population at 16% of the total, up from 11% today.
    demographic, with a current enrollment of                          By comparison, the state’s share of this age cohort
    approximately 38,000 students (approximately                       is projected to grow from 15% to 22%.
    85% of whom are between 18-24 years old).                          An aging population has many implications for
                                                                       city policy, including the type of housing available,
                                                                       transportation access and safety, healthcare
                                                                       facilities, retail, service and recreational needs.

                    FIG. 2.1 SHARE OF POPULATION BY AGE COHORT (2016)

                    Source: U.S. Census American Community Survey (2012-2016)

8   Tuscaloosa, Alabama | 2018 Five-year Affordable Housing Study
Chapter 2: Community Profile
AND A DIVERSIFYING
POPULATION
Tuscaloosa's population is predominantly
white (53%) and Black/African American TABLE 2.2 POPULATION INCREASES BY
(43%). While other races comprise a small RACE AND ETHNICITY (2000-2016)
portion of the overall population they have
White 8,534 +
seen increases since 2000 as has the Latinx
Black or African American 8,496 +
population. Comparatively, the state has a
population that is 69% white and 26% Black/ Asian 1,402 +
African American. It has also seen similar Some Other Race 257 +
percentage increases in other races as well Latinx 1,619 +
as the Latinx population. Table 2.2 shows Source: U.S. Census (2010) and American Community
the new population added between 2000 Survey (2012-2016)
and 2016 by race and ethnicity, and Figure
2.2 show the city’s share of population by
race and ethnicity for 2000 and 2016.
FIG. 2.2 CHANGE IN RACE AND ETHNICITY (2000-2016)
Source: U.S. Census (2000) & American Community Survey (2012-2016)
2018 Five-year Affordable Housing Study | Tuscaloosa, Alabama 9Chapter 2: Community Profile
A SIGNIFICANT DISABLED
POPULATION
Just over 11% of the city’s population has a FIG. 2.3 DISABILITY BY TYPE FOR INDIVIDUALS AGED 65+
disability compared to 16% statewide. 51%
of the population 75 years and over and
25% of the population 65 to 74 has some
form of disability. Figure 2.3 breaks down
the 65+ population by type of disability.
The implications of the city's disabled
population are important to consider. In
some cases, populations with disabilities
may need specialized types of housing and
special transportation needs. In the future,
it will be important to plan for changing
Source: American Community Survey (2012-2016)
housing and transportation needs for the
city's aging and disabled populations.
HIGH NUMBER OF NONFAMILY
HOUSEHOLDS
Tuscaloosa was home to 33,933 households
in 2016, an increase of 8% since 2000. WHAT IS A HOUSEHOLD?
The number of households has grown
A person or group of people living together in
more slowly compared to the city’s total
one housing unit.
population, which grew 24% during this
timeframe.
WHAT IS A HOUSING UNIT?
Not surprisingly, the city has a high number A house, apartment, mobile home, group of
of nonfamily households (43% of total rooms or single room, which are intended as
households) compared to the state (33% of separate living quarters.
households) and Tuscaloosa County (34% of
households). WHAT IS A FAMILY HOUSEHOLD?
The presence of the University's student A group of two or more people living together in
population has some impact on this trend. a housing unit who are related by birth, marriage,
However, Tuscaloosa's nonfamily share adoption, etc.
is down from 2000 when 46% of the
households were nonfamily. The decreased WHAT IS A NONFAMILY HOUSEHOLD?
share in nonfamily households between Households that consist of people who live alone
2000 and 2016 appears to be due to family or who share their residence with unrelated
households growing faster during this time individuals.
period; 13% compared to 1% for nonfamily
households.
10 Tuscaloosa, Alabama | 2018 Five-year Affordable Housing StudyChapter 2: Community Profile
INCREASING SHARE OF SINGLE AVERAGE HOUSEHOLD SIZE IS
PARENT HOUSEHOLDS INCREASING
Between 2000 and 2016 the share of single The city’s average household size increased
parent family households with children from 2.22 to 2.56 between 2000 and 2016.
under 18 rose from 43% of families with Family households also saw an increase
children under 18 to 49%. While female from 2.93 to 3.26. The state’s household
householders made up the majority of those sizes increased, but not to the same degree.
single parent families, male householders The county also experienced growth in
have increased their share as well. The household size.
increase in single parent households can be
Nationally, the size of households has
attributed to many factors including divorce,
gradually become smaller during the latter
teen pregnancy, and new forms of family
half of the twentieth century as families have
structures such as a woman deciding to
fewer children, young people delay starting
have a child on her own.
families, and the number of “empty nester”
These trends are important to consider as households grows with people living longer.
the planning process identifies locations In many communities, this trend has meant
for, and services and amenities needed that the number of households has grown
within close proximity of housing that could faster than the rate of population growth.
serve this population sector. For example,
In the past decade, this long-term national
these single-parent households could be
trend slowed and even reversed in some
well served to live in neighborhoods that
communities as people chose to live
are proximate to groceries, pharmacies,
together due to economic constraints.
pediatrician offices, daycares, and parks and
recreation amenities.
In 2016, it is estimated that...
FIG. 2.4 AVERAGE HOUSEHOLD SIZE COMPARISON
49%
of family households were headed by a
single-parent,
42%
of family households were headed by a
female single-parent, and
7% Source: U.S. Census and American Community Survey (2012-2016)
of family households were headed by a
male single-parent.
2018 Five-year Affordable Housing Study | Tuscaloosa, Alabama 11Chapter 2: Community Profile
HOUSEHOLD INCOMES ARE
SIMILAR TO THE STATE WITH
SOME EXCEPTIONS
Figure 2.5 illustrates the distribution of
households by income for the city, county
and the state. While mostly consistent,
Tuscaloosa has a higher share of lower
income households. To some degree this
is due to the student population that is
earning very little income in most cases.
The state and county have a higher share of
households with incomes between $50,000
and $150,000 than the city. On the high
end, the city has a higher share of those
making $200,000 or more.
FIG. 2.5 COMPARISON OF INCOME DISTRIBUTIONS (2016)
Source: American Community Survey (2012-2016)
12 Tuscaloosa, Alabama | 2018 Five-year Affordable Housing StudyChapter 2: Community Profile
POVERTY RATES HAVE REMAINED CONSISTENT SINCE 2000
Almost 24% of individuals and 15% of families live below the poverty level in the city
compared to 18% of individuals and 14% of families statewide and 20% and 18% in the
county. As with household income patterns, the presence of college students plays a part
in determining local poverty rates as student incomes are often below the poverty rate.
FIG. 2.6 COMPARISON OF CHANGES IN POVERTY RATES
(2000-2016)
Source: U.S. Census (2000, 2010) and American Community Survey (2012-2016)
When Tuscaloosa residents in poverty are
separated by age, it is clear that a significant
proportion of impoverished people (47%)
are in the college age cohort aged 18-24. Acknowledging the impact of college
(See Table 2.3 on the next page.) students on the local poverty rate, the
U.S. Census estimates that excluding
The American Community (ACS) Survey off-campus college students reduces
suggests that excluding off-campus college the poverty rate of Tuscaloosa to
19%
students decreases the poverty rate by 5%,
reducing the overall rate from 24% to 19%.2
This rate is similar to the state's poverty rate
a 5% decrease from the total poverty
of 18%.
rate of 24% for Tuscaloosa.
Children under 18 have the highest poverty
30%
rate of any age cohort living in Tuscaloosa
- nearly 30%. This number is similar to the
state's child poverty rate of 27%.
of all children in Tuscaloosa live in
Being impoverished has been shown to have poverty.
significant impacts on the academic and
professional success of children and may
also influence health, and longevity of the
person over time.
2018 Five-year Affordable Housing Study | Tuscaloosa, Alabama 13Chapter 2: Community Profile
TABLE 2.3 PERSONS IN POVERTY BY AGE COHORT (2016)
City of Tuscaloosa State of Alabama
Age Cohort # in Cohort* # in Poverty % in Poverty # in Cohort* # in Poverty % in Poverty
Under 18
17,438 4,996 29% 1,090,244 289,382 27%
years
18-24 16,313 7,649 47% 428,957 120,323 28%
25-64 41,960 7,308 17% 2,478,993 382,619 15%
65+ 10,940 776 7% 722,398 76,342 11%
Total
86,651 20,729 24% 4,720,592 868,666 18%
Population
*Population numbers are only for whom poverty status is determined.
Source: American Community Survey (2012-2016)
NON-WHITE HOUSEHOLDS HAVE A HIGHER PROPORTION OF PEOPLE
IN POVERTY
The percent of people living in poverty is higher for people identifying as Black/African
American alone, and Asian and Hispanic/Latinx than for persons identifying as White
alone. 19% of White alone residents are in poverty compared to 29% of Black/African
American residents, 30% of Asian residents, and 28% of Hispanic/Latinx residents.
This is important to understand because poverty trends that correspond with race in a
community have been shown to result in challenges to finding affordable housing for non-
white households.
TABLE 2.4 PERSONS IN POVERTY BY RACE/ETHNICITY (2016)
Race/Ethnicity # in Poverty % in Poverty % of Population
White alone* 8,134 19% 53%
Black or African American alone* 11,382 29% 43%
Asian 667 30% 3%
Hispanic or Latinx (of any race) 709 28% **3%
Source: American Community Survey (2012-2016)
* White alone and Black or African American alone mean that the person identified as this race and no other race.
** Hispanic/Latinx is defined as an ethnicity and not a race. White and Black/African American individuals may also identify
as Hispanic/Latinx. Therefore, the sum of the percentages of population by race/ethnicity exceeds 100%.
14 Tuscaloosa, Alabama | 2018 Five-year Affordable Housing StudyChapter 2: Community Profile
ECONOMIC TRENDS
EDUCATION IS THE TOP EMPLOYER SOURCES:
Economic trends are
The University of Alabama (UA) is the largest employer in the city based on analysis
with 11,500 employees . This one employer is larger than the total of Alabama Labor
Market Information's
count of employees for the next largest private sector industry Quarterly Census
(manufacturing, which has estimated employment of 10,200). of Employment and
Wages.
Top Three Industries Make Up 51% of the City's Private
Sector Jobs
2016 jobs estimates put total private employment in the city
at approximately 48,700 jobs. The top three private industry
sectors comprised 51% of private sector employment in 2016:
manufacturing, retail trade, and accommodations and food
services. They represented about the same share in 2009.
FIG. 2.7 TUSCALOOSA'S ESTIMATED
TOP PRIVATE INDUSTRIES BY EMPLOYMENT
Source: Alabama Labor Market Information, Quarterly Census for Employment & Wages
Note: AL LMI advised to reduce base employment data (i.e., Tuscaloosa County) by 30% to determine
estimates for City of Tuscaloosa. Data is available in disaggregated, comparable sectors starting in
2009.
2018 Five-year Affordable Housing Study | Tuscaloosa, Alabama 15Chapter 2: Community Profile
SIGNIFICANT GROWTH IN SOME,
BUT NOT ALL INDUSTRY SECTORS
Since 2009, the city has added 6,000 new
jobs. Industries with significant job growth
(i.e. more than 1,000 net new jobs) include
manufacturing (1,500), administrative and
waste services (1,970), and accommodation
and foods services (1,470). See Figure 2.8 for
employment trends by top sectors.
FIG. 2.8 TUSCALOOSA JOB TRENDS IN TOP SECTORS
(2009-2016)
Source: Alabama Labor Market Information, Quarterly Census for Employment & Wages
Note: AL LMI advised to reduce base employment data (i.e., Tuscaloosa County) by 30% to determine estimates
for City of Tuscaloosa. Data is available in disaggregated, comparable sectors starting in 2009.
16 Tuscaloosa, Alabama | 2018 Five-year Affordable Housing StudyChapter 2: Community Profile
TUSCALOOSA IS A CENTER
FOR JOBS TABLE 2.5 & FIG 2.9 COMMUTING DISTANCE FOR
PRIMARY JOBS IN TUSCALOOSA (2015)
The most recent detailed commuting
patterns are for 2015 from the Census’
OnTheMap program. Table 2.5 displays Count Share
the breakdown of distance to jobs for Total Jobs 59,099 100%
Tuscaloosa workers in 2015. Just under
Less than 10 miles 32,337 54.7%
45% of Tuscaloosa’s workforce commutes
10 to 24 miles 8,604 14.6%
10 miles or more to work with about 30%
commuting 25 miles or more. 25 to 50 miles 7,256 12.3%
Greater than 50 miles 10,902 18.4%
As Figure 2.9 shows, the workforce is
Source: U.S. Census OntheMap (2015)
spread out around the city with the longest
commutes from the Northeast. Figure 2.10
illustrates the jobs inflow and outflow for
the city, which shows that just under 70%
of the workforce lives outside the city and
commutes into work each day. (Note that
the arrows in Figure 2.10 aren't intended
to show the actual commuting direction of The color legend
workers, but instead are showing that they for Figure 2.9 to the
commute into or out of the City.) right is provided in
Table 2.3 above.
Just Under
70% FIG 2.10 COMMUTING DIRECTION FOR WORKERS
of the city's workforce
LIVING AND WORKING IN TUSCALOOSA (2015)
commutes in from
outside Tuscaloosa
Commute Commute
Into Out of
Tuscaloosa Tuscaloosa
Note that arrows don't show cardinal direction of commuting
patterns, but instead show overall outcommuting and incommuting.
Source: U.S. Census OntheMap (2015)
2018 Five-year Affordable Housing Study | Tuscaloosa, Alabama 17Chapter 2: Community Profile
HOUSING TRENDS
RESIDENTIAL BUILDING TRENDS
Real estate markets, including housing, go in cycles. It is important to evaluate housing
market trends over a significant period of time to assess general trends over the period,
and how these trends might inform forecasts for future real estate trends.
Residential land development permits were assessed for the period of 2011 through
August of 2018 to determine the number of units and bedrooms by type that were being
constructed in a given year. It was assumed that smaller projects came online the same
year as the land development permit was issued, and larger projects (100+ bedrooms)
were constructed two years after the permit was issued.
More than 6,000 units are estimated to have been built or are in process of being built
between 2011 and 2018. The majority of these units (54%) were multifamily units with
five or more units in the building. Single family detached housing comprised 38% of units,
townhomes/duplexes were 5%, and triplex or duplex were 3% of units.
A large percentage of the multifamily units were student multifamily housing for students
attending UA and living off-campus. Production of these units appears to have peaked in
2015, then significantly declined, and appears to be increasing in 2018. As the projected
enrollment of UA is likely to decline in future years, it will be important to manage
the vacancies of off-campus student rental housing to ensure minimal impacts to the
community.
Single family detached, townhomes/duplexes, and triplex/quadplex developments have
had fairly steady construction rates during this period with some fluctuations.
TABLE 2.6 NUMBER OF RESIDENTIAL UNITS DELIVERED ANNUALLY
(2011- Q2 2018)
Year Permit Single Family Townhome/ Triplex or Multifamily
Total Units
Issued Detached Duplex Quadplex (5+ units)
2011* 312 20 4 22 358
2012* 370 43 7 116 536
2013 378 86 20 313 797
2014 240 57 23 843 1,163
2015 248 23 53 1,046 1,370
2016 281 12 20 399 712
2017 275 59 61 195 590
2018** 182 4 13 320 519
Total units 2,286 304 201 3,254 6,045
% of Total 38% 5% 3% 54% 100%
Source: Tuscaloosa Office of Urban Development, Planning Division (August 2018); Single Family Detached
provided per Tuscaloosa BuildingEye; Townhome, Duplex, Triplex, Quadplex, and Multifamily provided by
Tuscaloosa Planning Division Listings
* Does not include Multifamily Land Development Permits for 100+ Bedroom Units from previous years
** Data as of August 15, 2018
Years 2013-2018 include estimated delivery of Multifamily projects with 100+ bedroom units from LDPs
issued two years prior and do not include units that have not been constructed or Tuscaloosa Housing
Authority replacement units.
18 Tuscaloosa, Alabama | 2018 Five-year Affordable Housing StudyChapter 2: Community Profile
FIG. 2.11 RESIDENTIAL BUILDING PERMIT TRENDS
Source: Tuscaloosa Office of Urban Development, Planning Division (August 2018); Single Family Detached
provided per Tuscaloosa BuildingEye; Townhome, Duplex, Triplex, Quadplex, and Multifamily provided by
Tuscaloosa Planning Division Listings
* Does not include Multifamily Land Development Permits for 100+ Bedroom Units from previous years
** Data as of August 15, 2018
Years 2013-2018 include estimated delivery of Multifamily projects with 100+ bedroom units from LDPs issued
two years prior and do not include units that have not been constructed or Tuscaloosa Housing Authority
replacement units.
TABLE 2.7 NUMBER OF BEDROOMS DELIVERED ANNUALLY (2011- Q2 2018)
Year Permit Townhome/ Triplex or Multifamily
Issued Duplex Quadplex (5+ units)
2011* 94 12 66
2012* 164 31 201
2013 323 58 804
2014 214 102 2,729
2015 88 219 2,277
2016 53 70 972
2017 205 248 402
2018** 20 49 789
Total units 1,161 789 8,240
Source: Tuscaloosa Office of Urban Development, Planning Division (August 2018); Single Family Detached
provided per Tuscaloosa BuildingEye; Townhome, Duplex, Triplex, Quadplex, and Multifamily provided by
Tuscaloosa Planning Division Listings
* Does not include Multifamily Land Development Permits for 100+ Bedroom Units from previous years
** Data as of August 15, 2018
Years 2013-2018 include estimated delivery of Multifamily projects with 100+ bedroom units from LDPs
issued two years prior and do not include units that have not been constructed or Tuscaloosa Housing
Authority replacement units.
2018 Five-year Affordable Housing Study | Tuscaloosa, Alabama 19Chapter 2: Community Profile
TUSCALOOSA IS A MAJORITY RENTER MARKET
Approximately 47% of non-institutional residential properties are owner-occupied
according to an analysis of tax assessors records for the study area. This percentage
matches the occupancy rates on the most recent American Community Survey, which
lists an owner/renter occupancy split of 48%/52%. This pattern was the same in
2000 according to U.S. Census data; however, there was an increase in the percent of
renters between 2000 and 2010 that declined in 2016 to 2000 levels.
Since many residential structures (e.g. apartment buildings) hold more than one unit
we know that the non-owner occupied percentage is actually higher. This makes
sense given the significant number of University of Alabama students who live off
campus - approximately 74% of the student body (27,870 students).
VACANCY RATES HAVE DECREASED OVER TIME
For sale and for rent vacancy rates for both owners and renters have decreased since
2000 in the city indicating a tighter housing market. This pattern holds for the county
and partly for the state.
FIG. 2.12 FOR SALE OR RENT RESIDENTIAL PROPERTY
VACANCY RATES (2000 & 2016)
(2000) (2016) (2000) (2016)
Source: U.S. Census (2000), and American Community Survey (2012-2016)
SALES PRICES ON PAR WITH REGION WITH SOME VARIATION
As of July 2018 and according to Trulia.com, the median sales price for a home in
Tuscaloosa was $165,000 with a price per square foot of $113. Of the 988 properties
listed, single family units comprised 55%, and land for these units accounted for
25%. About 17% (171 properties) were listed as foreclosures. In general, median sale
prices are on par with the region, with the most expensive housing towards the north
end of the city.
20 Tuscaloosa, Alabama | 2018 Five-year Affordable Housing StudyChapter 2: Community Profile
HOUSING PRICES HAVE HAD A SLOW RETURN TO PRE-RECESSION VALUES
Zillow calculates a home value index, which is a smoothed, seasonally adjusted measure of the median
estimated home value across a given region and housing type. According to this index, the Tuscaloosa metro
was at a high of $139,000 in 2008 with a current price of $137,933. See Figure 2.13 for home index trends
for 2008-current.
FIG. 2.13 ZILLOW HOME INDEX TRENDS (2008-2018) Zillow's Home Index
estimates the median
home value in the
Tuscaloosa metro area
at
$137,933
in 2018. This is
the same smooth,
seasonally adjusted
home value for the
metro area in 2008.
Source: zillow.com
PER BEDROOM RENTAL PRICES RENTERS ARE COST-BURDENED
ON PAR WITH THE REGION BUT EXACT AMOUNT MASKED BY
For apartments, the calculated price per STUDENT RENTS
bedroom was $525 for 1 bedroom units and Almost 60% of renters are cost burdened
$411 for two bedroom units. These prices (meaning that gross rent is 30% or more
are generally comparable to the region of household income). By comparison, the
according to Trulia.com. As of July 2018, the county had 53% and the state had 50% of
median rent in Tuscaloosa was $963. Of renter households paying 30% or more
the 931 property listings on Apartments. of income towards gross rent. The exact
com, 390 (42%) were listed with a specialty in percentage of non-student renters is not
student housing. This number is not an exact easily determined, and the cost-burdened
count of student rental units in Tuscaloosa, percentages for UA students elevates the
but provides an estimate of properties and overall percentage of cost-burdened renters
may not include multiple units within a single in Tuscaloosa.
property.
1/3 OF ALL HOMEOWNERS ARE
COST BURDENED
The ACS calculates selected monthly owner
costs as a percentage of household income.
Housing in considered affordable generally
when costs are 30% or less of household
income. For the most recent ACS in 2016,
31% of home owners paid 30% or more
of their income towards housing costs
compared to 28% and 31% in the county
and state respectively.
2018 Five-year Affordable Housing Study | Tuscaloosa, Alabama 21Chapter 3: Housing Inventory
3/ HOUSING
INVENTORY
Chapter
It is important to understand the current Contents
inventory of housing in the city, the spatial • Housing Inventory
• Housing Conditions
trends of housing conditions, and the • Proximity to
Community Assets
proximity of housing to employment and
shopping needs as a basis for projecting
future demand in the planning area. This
Housing Inventory section provides a
snapshot of the city's current housing stock
and considerations for the future.
Caption?
22 Tuscaloosa, Alabama | 2018 Five-year Affordable Housing StudyChapter 3: Housing Inventory
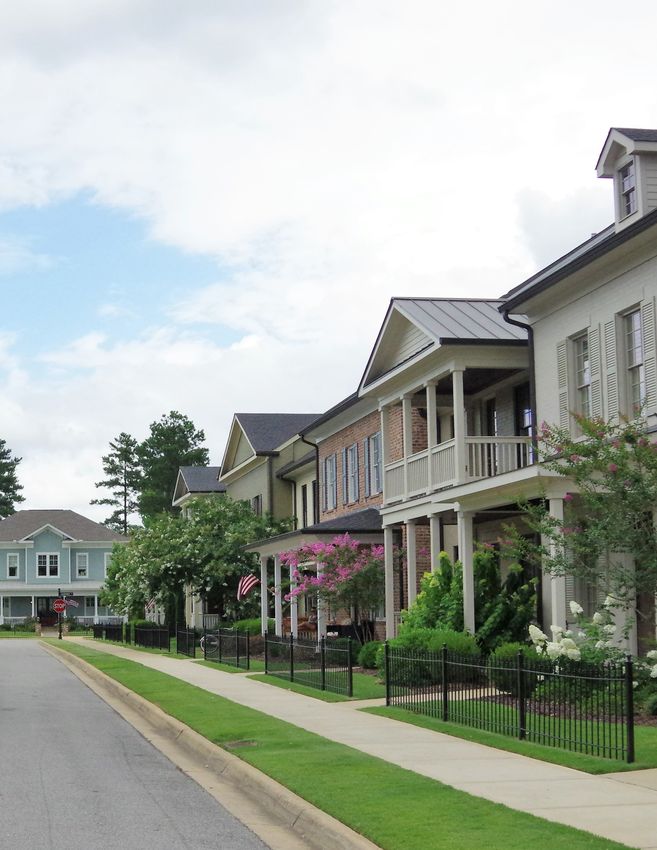
TUSCALOOSA PLANNING AREA
For the purposes of the Framework Tuscaloosa planning
effort, the planning area used includes the city's incorporated
area and the area where Tuscaloosa has subdivision authority
(Planning Jurisdiction). The map below depicts this area.
Sources:
Data included in this
section came from
the City's Urban
Development Office,
the City's GIS office,
and the U.S. Census
American Community
Survey (2012-2016).
TUSCALOOSA PLANNING AREA
Source: Tuscaloosa County Assessor's
Parcel Database
2018 Five-year Affordable Housing Study | Tuscaloosa, Alabama 23Chapter 3: Housing Inventory
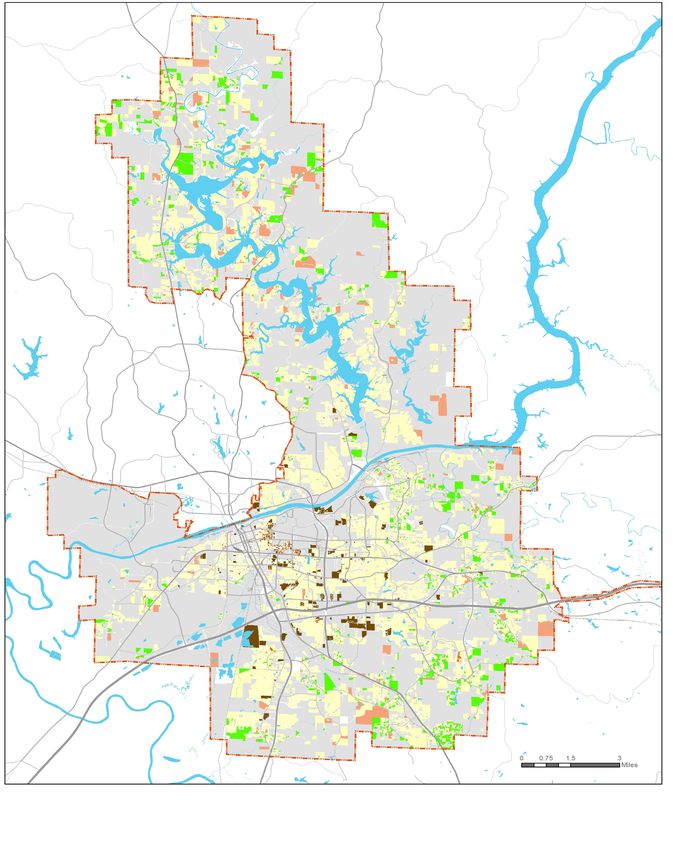
HOUSING INVENTORY
RESIDENTIAL LAND
DOMINATED BY SINGLE-
FAMILY
The vast majority of residential
properties in Tuscaloosa's planning
area are single-family detached housing
(85.7%), followed by multifamily/student
housing (8.0%), mobile homes (3.6%),
duplex, triplex, and townhomes (1.6%),
and other residential uses such as
nursing homes (1.0%).
Single-family, mobile homes, and
miscellaneous land uses are distributed
throughout the planning area.
More dense housing types, such as
townhomes and apartments, are
generally found in the core areas of the
city and proximate to jobs and shopping
areas.
TABLE 3.1 RESIDENTIAL PROPERTIES IN PLANNING AREA
Residential Type Properties % of Total Properties
Single Family 34,960 85.7%
Multifamily/Student
3,270 8.0%
Housing
Mobile Homes 1,490 3.6%
Duplex, Triplex,
667 1.6%
Townhome
Other 427 1.0%
Total 40,814 100.0%
Source: Tuscaloosa County Tax Assessor Parcel Database, June 2018 (land use description code)
24 Tuscaloosa, Alabama | 2018 Five-year Affordable Housing StudyChapter 3: Housing Inventory
RESIDENTIAL PROPERTIES BY TYPE,
TUSCALOOSA PLANNING AREA
Source: Tuscaloosa County Assessor's Parcel Database (land use description code)
2018 Five-year Affordable Housing Study | Tuscaloosa, Alabama 25Chapter 3: Housing Inventory
MAJORITY OF HOUSING STOCK
BUILT IN LAST FOUR DECADES
65% of the housing units within the FIG. 3.1 BUILD DATE FOR HOMES IN TUSCALOOSA
Tuscaloosa City Limits were built
between 1970 and 2009, with the
majority built from 2000 to 2009. The
highest concentrations of homes built
since 1990 are located primarily in the
northern and southwestern portions of
the city. Meanwhile the older homes,
built before 1950, are concentrated
in the central parts of Tuscaloosa
surrounding the University of Alabama.
The maps shown here show the number
of units by Census Block Group that (2000) (2016) (2000) (2016)
were built pre-1950, 1950-1989, and Source: American Community Survey (2012-2016)
1990 to present.
HOUSING UNITS HOUSING UNITS
BUILT PRIOR TO BUILT 1950-1989
1950 BY CENSUS BY CENSUS BLOCK
BLOCK
26 Tuscaloosa, Alabama | 2018 Five-year Affordable Housing StudyChapter 3: Housing Inventory
HOUSING UNITS BUILT SINCE 1990, BY CENSUS BLOCK
Source: U.S. Census, American Community Survey, 2012-2016
2018 Five-year Affordable Housing Study | Tuscaloosa, Alabama 27Chapter 3: Housing Inventory
RENTAL AND OWNER- SIGNIFICANT INCREASE IN
OCCUPANCY HAS FLUCTUATED SEASONAL, RECREATIONAL, AND
BUT REMAINED FAIRLY STABLE OCCASIONAL PURPOSE HOUSING
While Tuscaloosa has remained a UNITS
majority renter market, the occupancy Vacancy rates among for-rent and for-sale
trends have shifted since 2010. As units have decreased since 2000 in the city
shown in Figure 3.2, between 2010 indicating a tighter housing market. This
and 2016 the total number of renter- pattern holds for the county and partly
occupied housing units in the city for the state. However, there are some
increased by 6%, and correspondingly underlying occupancy trends that have
the total number of owner-occupied shifted since 2010.
housing units decreased by 6%.
The total number of housing units in the
The maps on the following pages show city increased, but the number of occupied
the geographic distribution of these housing units actually decreased between
trends across the entire planning 2010 and 2016 as shown in Figure 3.3.
area. The first map shows the percent
change in owner-occupied units for each While the vacancy rates of for-sale or for-
block group, where green shows areas rent units have decreased, there has been
of decrease and red shows areas of an increase in the total number of vacant
increase. units as shown in Figure 3.4. This is largely
due to the increase in vacant housing
Similarly, the second map shows the units in Tuscaloosa that are being used
percent change in renter-occupied units for seasonal, recreational, or occasional
for each block group in the planning purposes accounting for an estimated
area. The green areas experienced a 8,561 units in 2016 and comprising 70% of
decrease in renter occupied units, while the vacant units. This amounts to 19% of
the red colors show areas of increase. the total housing stock in the city. In 2010
It is important to note that the two there were only 663 of these seasonal,
maps are not mirror images, as they are recreational, or occasional purpose vacant
showing percent change in number of units. These units effectively aren't part of
rental or for-sale units compared to the the housing inventory.
base year 2010.
FIG. 3.2 PERCENT OF RENTER VS. OWNER-OCCUPIED UNITS,
CITY OF TUSCALOOSA (2000, 2010, 2016)
(2000) (2016) (2000) (2016)
Source:
Source: U.S.U.S. Census
Census 2000(2000 andAmerican
& 2010, 2010), American Community
Community Survey Survey (2012-2016)
(2012-2016)
28 Tuscaloosa, Alabama | 2018 Five-year Affordable Housing StudyChapter 3: Housing Inventory
FIG. 3.3 TOTAL HOUSING UNITS COMPARED TO
19%
OCCUPIED HOUSING UNITS IN TUSCALOOSA
of housing units
in Tuscaloosa are
estimated to be
used for seasonal,
recreational or
occasional purposes
(2016)
Source: U.S. Census 2000 & 2010, American Community Survey (2012-2016)
FIG. 3.4 PERCENT OF OCCUPIED AND VACANT
HOUSING UNITS IN TUSCALOOSA (2000, 2010, 2016)
(2016)
Source: U.S. Census 2000 & 2010, American Community Survey (2012-2016)
2018 Five-year Affordable Housing Study | Tuscaloosa, Alabama 29Chapter 3: Housing Inventory
CHANGE IN OWNER-OCCUPANCY (2010-2016)
16
Source: U.S. Census, American Community Survey, 2012-20
30 Tuscaloosa, Alabama | 2018 Five-year Affordable Housing StudyChapter 3: Housing Inventory
CHANGE IN RENTER-OCCUPANCY (2010-2016)
Source: U.S. Census, American Community Survey, 2012-2016
2018 Five-year Affordable Housing Study | Tuscaloosa, Alabama 31Chapter 3: Housing Inventory
PUBLIC HOUSING UNITS ARE
CLUSTERED IN WEST TUSCALOOSA
AND PARKWOOD
Several programs exist to provide housing households where the assistance is generally tied
assistance to lower income households in to the household and not the actual unit. Section
Tuscaloosa. Tables 3.2 and 3.3 below provide an 8 housing vouchers3 comprise the majority of
inventory of these different types of assistance. this assistance. Federal Fair Housing (FFHA) rules
Table 3.2: Price Restricted Affordable Housing request that public housing receiving federal
Units shows the restricted housing units assistance should be dispersed throughout the
supported by various federal programs and public community and not clustered. As the Tuscaloosa
funding sources, in addition to affordable homes Housing Authority rebuilds older units over the
built by Habitat for Humanity. Table 3.3: Affordable next decade, it will be important to identify FFHA
Housing Assistance by Household/Voucher compliant sites. See Appendix C for information on
includes other programs that support low-income these programs.
TABLE 3.2 PRICE RESTRICTED AFFORDABLE HOUSING UNITS
Funding Program Type Unit Count % of Total
Public Housing (Government-Owned) 905* 34%
Multifamily (Privately Owned) 794 30%
LIHTC (less public housing and
829 31%
multifamily units)
Habitat For Humanity Houses 120 5%
Total 2,648 100.0%
Source: Tuscaloosa Housing Authority, HUD eGIS Open Data, Habitat for Humanity Tuscaloosa, June 2018
*The Tuscaloosa Housing Authority is in the process of redeveloping several public housing developments.
Upon completion, there will be 1,237 public housing units.
TABLE 3.3 AFFORDABLE HOUSING ASSISTANCE BY HOUSEHOLD/VOUCHER
Funding Program Type Unit Count % of Total
Housing Choice Vouchers 1,969 57%
HOME Units - Homebuyer/Homeowner
780 23%
Assistance
HOME Units - Rental/Tenant Assistance 264 8%
CDBG Housing Activity -
266 8%
Owner-Occupied Units
CDBG Housing Activity -
179 5%
Renter-Occupied Units
Total 3,458 100.0%
Source: City of Tuscaloosa Federal Programs Office, June 2018
32 Tuscaloosa, Alabama | 2018 Five-year Affordable Housing StudyChapter 3: Housing Inventory
LOCATION OF PUBLIC HOUSING UNITS AND HOUSING VOUCHERS
Source: Tuscaloosa Urban Development GIS Database
2018 Five-year Affordable Housing Study | Tuscaloosa, Alabama 33Chapter 3: Housing Inventory
HOUSING CONDITIONS
RESIDENTIAL AREAS WITH
HIGH PROPENSITY FOR
CHANGE
Households where the head of
household is in the 50 to 64 age range
or the 75 and up age range may be
more likely to sell their homes due to
downsizing or transitioning to senior
housing and eldercare facilities.
Moreover, the housing market has a
higher propensity for change4 in high
homeownership areas with larger
concentrations of these age groups.
The map to the right shows the
Census block groups in the Tuscaloosa
Planning Area where 25% or more of
the population falls within 50 to 64
and the 75 and older age ranges. The
different shades of green represent
the proportions of owner-occupied
housing units in each block group.
The darkest green areas may have the
highest propensity for change within the
planning area.
34 Tuscaloosa, Alabama | 2018 Five-year Affordable Housing StudyChapter 3: Housing Inventory
PROPENSITY FOR CHANGE AREAS, TUSCALOOSA PLANNING AREA
PROPENSITY FOR CHANGE
TUSCALOOSA PLANNING AREA
Source: Tuscaloosa Urban Development GIS Database
2018 Five-year Affordable Housing Study | Tuscaloosa, Alabama 35Chapter 3: Housing Inventory
WHILE NOT OUT OF THE
ORDINARY, PROPERTY CODE
AND CRIME VIOLATIONS ARE
CLUSTERED IN CORE OLDER
NEIGHBORHOODS
Some areas of the city are more prone
to having municipal property code
violations (e.g., exceeding occupancy
standards) and instances of property
crime (e.g., burglary and property
damage). City of Tuscaloosa property
code violations and property crime
location sites were assessed to identify
clusters of activity on residential
properties in the city. The map to the
right illustrates the propensity for these
events to occur in and around the
downtown area, in Alberta, and in West
Tuscaloosa. The comprehensive plan
can identify potential tools to address
these "hot spots" that create real and
perceived challenges to these residential
areas.
36 Tuscaloosa, Alabama | 2018 Five-year Affordable Housing StudyChapter 3: Housing Inventory
PROPERTY CHALLENGES, CITY OF TUSCALOOSA
Source: Tuscaloosa Urban Development GIS Database
2018 Five-year Affordable Housing Study | Tuscaloosa, Alabama 37Chapter 3: Housing Inventory
OPPORTUNITIES FOR
PROPERTY REHABILITATION
ARE SCATTERED THROUGHOUT
OLDER CITY NEIGHBORHOODS
The Potential Rehabilitation
Opportunities Map on the next page
identifies potential sites that may be
opportunities for rehabilitation or
redevelopment of older properties with
structures that are significantly lower in
value than the land they are located on.
Tuscaloosa County Tax Assessor
information was used to calculate
the ratio of improvement value5
(improvement = built structures) to land
value ratio6 for all the residential parcels
in the low income areas of the planning
area. The Parcels with $0 land value or
improvement value were excluded from
the map.
These low income areas include all of
the Census block groups where 57% or
more of the households have incomes
less than $45,000 as of 2016. This
correlates with the U.S. Housing and
Urban Development (HUD) low income
limit (80% AMI) for a family of three in
the Tuscaloosa Area listed at $44,300.
The parcels shown in blue are those with
an improvement to land value ratio that
is between 0 and 1. These areas have
potential for rehabilitation opportunities
because the value of the land is greater
than the value of the improvements (i.e.,
built structures).
38 Tuscaloosa, Alabama | 2018 Five-year Affordable Housing StudyChapter 3: Housing Inventory
OPPORTUNITY AREAS FOR PROPERTY REHABILITATION, TUSCALOOSA PLANNING AREA
Source: Tuscaloosa Urban Development GIS Database and Tuscaloosa County Tax Assessor Property Database
2018 Five-year Affordable Housing Study | Tuscaloosa, Alabama 39Chapter 3: Housing Inventory
PROXIMITY TO COMMUNITY ASSETS
HOUSING WITHIN THE
TRANSIT WALKSHED
Locating affordable housing proximate
to public transit can help low income7
households stretch their household
32%
of residential
earnings further by reducing the properties in the
need for automobiles and associated planning area are
expenses. Approximately 32% of within the 1/4 mile
transit walkshed
residential properties in Tuscaloosa are
in a 1/4 mile walkshed of Tuscaloosa
Transit stops. The vast majority of these
properties are single family, which
corresponds to the prevalence of single
family in the community. Multifamily and
student housing is the next highest type
of residential with walkable access to
public transportation.
TABLE 3.4 RESIDENTIAL PROPERTIES WITHIN TRANSIT WALKSHED
% of Total Properties in
Residential Type Properties
Walkshed
Single Family 10,309 79.9%
Multifamily/Student
2,055 15.9%
Housing
Mobile Homes 166 1.29%
Duplex, Triplex,
314 2.4%
Townhome
Other 61 0.5%
Total 12,905 100.0%
Source: Tuscaloosa County Tax Assessor Parcel Database, June 2018 and Tuscaloosa Transit Stop Locations.
Calculated by Clarion Associates.
40 Tuscaloosa, Alabama | 2018 Five-year Affordable Housing StudyChapter 3: Housing Inventory
RESIDENTIAL PROPERTIES WITHIN THE TRANSIT WALKSHED (1/4 MILE FROM BUS STOP)
Source: Tuscaloosa Urban Development GIS Database and Tuscaloosa County Tax Assessor Property Database
2018 Five-year Affordable Housing Study | Tuscaloosa, Alabama 41Chapter 3: Housing Inventory
PROXIMITY OF HOUSING TO
EMPLOYMENT CENTERS AND
66%
SERVICES
In addition to walkability and access
to local transit, national trends have
of residential
shown that better access to employment properties in the
centers and shopping and dining areas planning area are
is highly valued by a broad spectrum of within a 1-mile
commute of
household types. employment centers
and services
Approximately 66% of residential
properties in the planning area are
within a 1 mile commute of employment
centers and services. 44% of residential
properties are within a 1/2 mile
commute to these locations. Contrasted
with the fact that 70% of Tuscaloosa's
workers live outside the city and
commute into work each day, there
appears to be quality opportunities to
reduce commute times within existing
neighborhoods.
TABLE 3.5 RESIDENTIAL PROPERTIES WITHIN QUICK COMMUTE TO
EMPLOYMENT CENTERS AND SERVICES
% of Total Properties in
Residential Type Properties
1 Mile Proximity
Single Family 22,409 83.4%
Multifamily/Student
3,578 13.3%
Housing
Mobile Homes 284 1.06%
Duplex, Triplex,
501 1.9%
Townhome
Other 105 0.4%
Total 26,877 100.0%
Source: Tuscaloosa County Tax Assessor Parcel Database, June 2018 and Tuscaloosa Transit Stops Data
provided by Office of Urban Development Planning division.
42 Tuscaloosa, Alabama | 2018 Five-year Affordable Housing StudyChapter 3: Housing Inventory
RESIDENTIAL PROPERTIES WITHIN A QUICK COMMUTE TO LOCAL EMPLOYMENT CENTERS
AND SERVICES
Source: Tuscaloosa Urban Development GIS Database and Tuscaloosa County Tax Assessor Property Database
2018 Five-year Affordable Housing Study | Tuscaloosa, Alabama 43Chapter 4: Current Policies
4/ CURRENT
POLICIES
Chapter
The city's housing policies and regulations Contents
have a direct effect on the supply of housing • Housing Policy
Inventory
in Tuscaloosa. This chapter evaluates the • Current Policy
Direction
current housing policies that guide decision- • Policy Opportunities
making and offers some policy direction
options for consideration.
Caption?
44 Tuscaloosa, Alabama | 2018 Five-year Affordable Housing StudyChapter 4: Current Policies
HOUSING POLICY INVENTORY
To gain a better understanding of the complete array of housing policies that guides
decision-making in Tuscaloosa, a housing policy database was built that includes all
housing related policy statements and action items included within relevant policy
documents.
The inventory of policy documents reviewed and inventoried includes:
• Tuscaloosa's HUD Annual Action Plan (2018)
• Analysis of Impediments to Fair Housing Choice (2015)
• 5-Year Consolidated Housing Plan (2015-2019)
• Tuscaloosa Forward Strategic and Generational Plans (2011)
• Update to Specific Plan for District 3 (2017)
• Greater Downtown Plan (2010)
• Future Land Use Plan (2009)
• Specific Plans District 6 and 7 (2009)
• Specific Plans – West Tuscaloosa and Greater Alberta Community (2007)
• Urban Renewal (2005)
• Specific Plan – University Area Neighborhood (2004)
• Specific Plan – Forest Lake Neighborhood (2003)
The policy statements and action items in these policy documents were reviewed and
documented in a searchable database and classified using searchable tags to help
assess and document the key policy direction themes among the policy documents.
Appendix B of this report includes a summary of key policy directions for each
individual plan. Appendix C includes a list of relevant agencies and programs that
provide housing related services and support.
The Tuscaloosa Framework process includes a thorough review and diagnosis of the
city's current Zoning Ordinance. This diagnosis and assessment will use the vision
and goals of the new comprehensive plan to diagnose the city's regulations and make
formal recommendations for changes to the codes.
2018 Five-year Affordable Housing Study | Tuscaloosa, Alabama 45Chapter 4: Current Policies
CURRENT POLICY DIRECTION
The assessment of the policy inventory resulted in the identification of four primary
housing policy themes:
• Protecting Neighborhood Character
• Promoting Housing Diversity
• Assisting Lower Income Households
• Serving Neighborhoods
Each of these four housing policy themes was evaluated to determine the key components of
the policy direction theme and are listed below. There is an opportunity to evaluate these policy
directions as part of the Tuscaloosa Framework planning effort.
PROTECTING NEIGHBORHOOD CHARACTER
• Context sensitive compatibility requirements for redevelopment in established and
stable neighborhoods
• Protection of green infrastructure networks in neighborhoods and encourage
development of parks and trails
• Street designs that are compatible with scale and function of neighborhood
• Creating consistency of design and safety within the pedestrian realm
PROMOTING HOUSING DIVERSITY
• Creating neighborhoods that offer a variety of housing types proximate to services
and transit
• Protection of neighborhood compatibility through zoning that allows for character
transitions and flexibility for increased densities in established neighborhoods
• Exploring regulatory opportunities to remove barriers to missing middle housing
ASSISTING LOWER INCOME HOUSEHOLDS
• Reducing concentrations of lower income households
• Reducing poverty through economic development and provision of affordable
housing
• Leveraging partnerships to reduce homelessness
• Increasing interagency coordination to reduce foreclosure and evictions
• Furthering fair housing through education on rights of renters and homebuyers
• Building affordable housing units on blighted and vacant properties
46 Tuscaloosa, Alabama | 2018 Five-year Affordable Housing StudyYou can also read