RICHLAND 2019 - COMPREHENSIVE PLAN - CMPDD
←
→
Page content transcription
If your browser does not render page correctly, please read the page content below
RICHLAND
COMPREHENSIVE PLAN

                   2019
                   Prepared by:
Central Mississippi Planning & Development District
        1170 Lakeland Drive - P.O. Box 4935
         Jackson, Mississippi 39296-4935
    Phone: 601-981-1511 Fax: 601-981-1515
                   www.cmpdd.org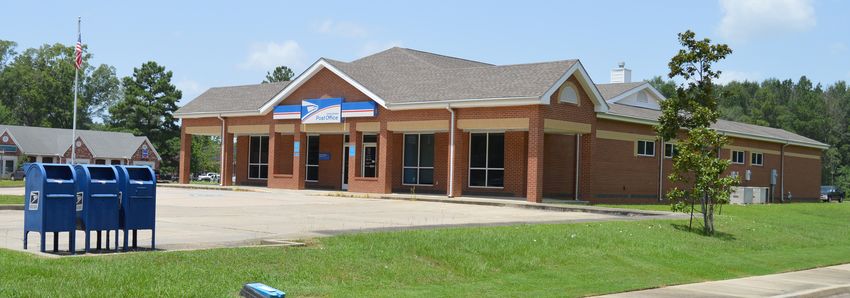
P.O. Box 180609
                           Richland, MS 39218

                          Phone: 601-932-3000

                      Website: www.richlandms.org

                           Pat Sullivan, Mayor

                           Board of Aldermen:
                               Gus Black
                               Clay Burns
                              Robert Craft
                              Beth Sanford
                             Cathey Wynne

The preparation of this Comprehensive Plan was partially funded through
Federal Highway Administration Section 104 (f) U. S. C.
TABLE OF CONTENTS
INTRODUCTION..........................................................................................................................2
PURPOSE OF THE PLAN......................................................................................................... 2
ELEMENTS OF THE PLAN....................................................................................................... 3
WEB-BASED GIS MAPPING VIEWER....................................................................................... 4
HOW TO USE THIS PLAN...........................................................................................................6
OVERVIEW............................................................................................................................... 6
USE OF THE PLAN................................................................................................................... 7
NONCONFORMANCE TO THE PLAN AND PLAN AMENDMENTS........................................ 7
IMPLEMENTATION DEVICES.................................................................................................. 8
PREVIOUS PLANS................................................................................................................... 8
GENERAL GOALS AND OBJECTIVES ...................................................................................... 9
CHAPTER 1: PUBLIC INPUT....................................................................................................10
GOALS AND OBJECTIVES...................................................................................................... 10
CHAPTER 2: POPULATION PROJECTIONS AND DEMOGRAPHICS................................14
POPULATION PROJECTIONS............................................................................................... 14
CHAPTER 3: ECONOMIC DEVELOPMENT........................................................................... 20
GOALS AND OBJECTIVES...................................................................................................... 20
LABOR FORCE ...................................................................................................................... 22
Commute Patterns................................................................................................................23
BUSINESS INVENTORY......................................................................................................... 24
EDUCATION.......................................................................................................................... 25
HOUSING.............................................................................................................................. 28
TAXES.................................................................................................................................... 29
Sales and Use Taxes..............................................................................................................30
Property Taxes.......................................................................................................................31
LAND..................................................................................................................................... 32
CHAPTER 4: COMMUNITY FACILITIES.................................................................................34
GOALS AND OBJECTIVES...................................................................................................... 34
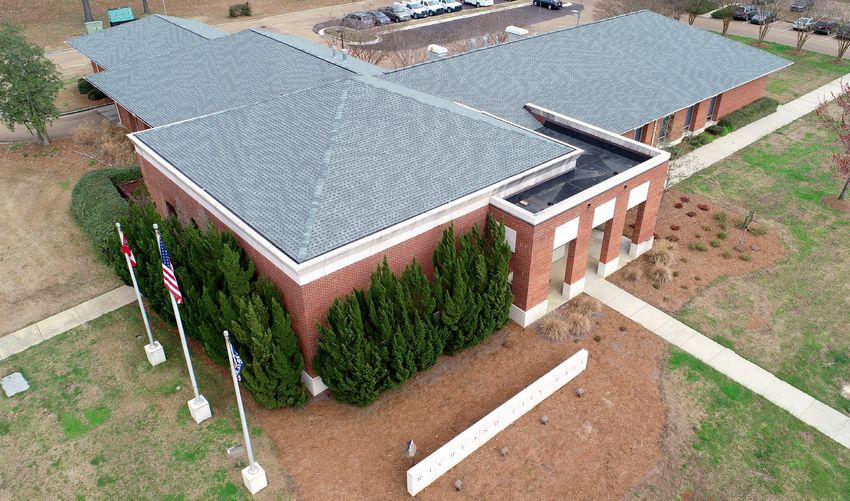
CITY HALL............................................................................................................................. 35
POLICE DEPARTMENT.......................................................................................................... 35
FIRE DEPARTMENT............................................................................................................... 36
Equipment by Station:..........................................................................................................36
PARKS AND RECREATION.................................................................................................... 36
WATER SUPPLY..................................................................................................................... 37
SEWAGE DISPOSAL............................................................................................................... 37
LIBRARY................................................................................................................................ 37
CHAPTER 5: TRANSPORTATION PLAN................................................................................ 38
GOALS AND OBJECTIVES...................................................................................................... 38
INTRODUCTION................................................................................................................... 39
Existing Major Roads.............................................................................................................40
CHAPTER 6: LAND USE PLAN...............................................................................................44
GOALS AND OBJECTIVES...................................................................................................... 44
INTRODUCTION................................................................................................................... 46
EXISTING LAND USE METHODOLOGY................................................................................ 46
THE LAND USE PLAN............................................................................................................ 48
Overview.................................................................................................................................48
Methodology..........................................................................................................................48
Location Criteria....................................................................................................................49
LAND USE PLAN MAP.......................................................................................................... 50
EXPLANATION OF LAND USE CATEGORIES........................................................................ 51
RICHLAND COMPREHENSIVE PLAN 1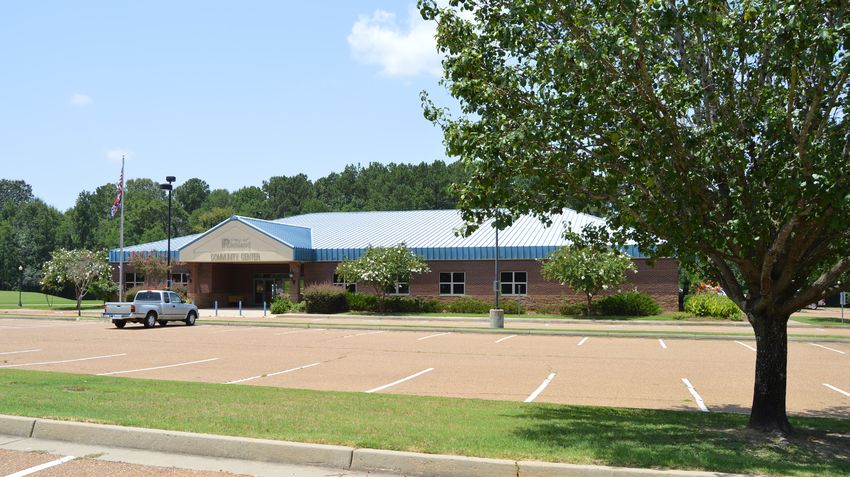
INTRODUCTION

                                  PURPOSE OF THE PLAN
                                    The purpose of this Comprehensive
                                  Plan is to serve as a general and long-
                                  range policy guide to decision-making
                                  for the City of Richland. The Plan is
                                  “comprehensive” in that it includes all
                                  of the City’s geographical areas and
                                  service functions that sustain or sup-
                                  port the City’s physical development.
                                  The Plan is “long-range” in that it looks
                                  beyond the City’s immediate condi-
                                  tions and issues to the City’s future (20
                                  to 25 years) needs and potential. The
                                  Plan is “general” in that recommen-
                                  dations, proposals, and policies are
                                  summarized rather than detailed. The
                                  Plan often indicates approximate loca-
                                  tions rather than exact locations. Many
                                  recommendations and proposals are
                                  conceptual ideas, intended to spur fur-
                                  ther discussion and thought. Some of
                                  the illustrations and photos are of this
                                  nature. A “master plan” is a more de-
                                  tailed development plan for a specific
                                  area, based at least in part on the Com-
                                  prehensive Plan.

                                    City officials recognize the impor-
                                  tance of planning in making effective
                                  decisions concerning the City’s future.
                                  This plan is a result of extensive study
                                  into existing development patterns as
                                  well as population and the economy.
                                  This plan should, however, be reviewed
                                  and updated periodically (every 5 to 10
                                  years) in order for it to remain current
                                  and be effective.

2   RICHLAND COMPREHENSIVE PLAN
Comprehensive Plans are often times seen as      ELEMENTS OF THE PLAN
a means to an end. If a county or municipali-         Section 17-1-1 of the Mississippi Code defines
ty wants to have zoning regulations, then they     a Comprehensive Plan as follows: “...a statement
must have a comprehensive plan that meets          of policy for the physical development of the en-
the requirements outlined in the State Code.       tire municipality or county adopted by resolu-
According to Mississippi Code Section 17-1-        tion of the governing body...” The Code goes
1, a comprehensive plan must include a mini-       on to state that a comprehensive plan must in-
mum of four components. These components           clude a minimum of four components in order
are long-range goals and objectives, a land use    to comply with the statute. These components
plan, a transportation plan, and a community       are long-range goals and objectives, a land use
facilities plan.                                   plan, a transportation plan, and a community
  From a planning perspective, the comprehen-      facilities plan. This plan goes beyond the re-
sive plan is much more than that. With today’s     quired elements by including a separate chap-
technology, a comprehensive plan can also be a     ter for the following topics: public input, popu-
valuable economic development tool. The use        lation projections, and economic development.
of online surveys, GIS map viewers and Story       The goals and objectives are found throughout
Maps can help local governments better collect     this plan as they pertain to the other elements
public input into the planning process and ulti-   as contained herein.
mately produces a plan that engages the public       The goals and objectives of a comprehensive
and serves as a useful marketing and economic      plan are made with respect to the future. Long-
development tool. When released in Story Map       range community development plans help a
form, a comprehensive plan is accessible from      community identify what it desires to achieve
any computer, tablet, or web-enabled mobile        in the future. Section 17-1-1 of the Mississip-
device. To view this plan in Story Map format      pi Code requires that the goals and objectives
visit www.richlandms.org.

                                                       RICHLAND COMPREHENSIVE PLAN                     3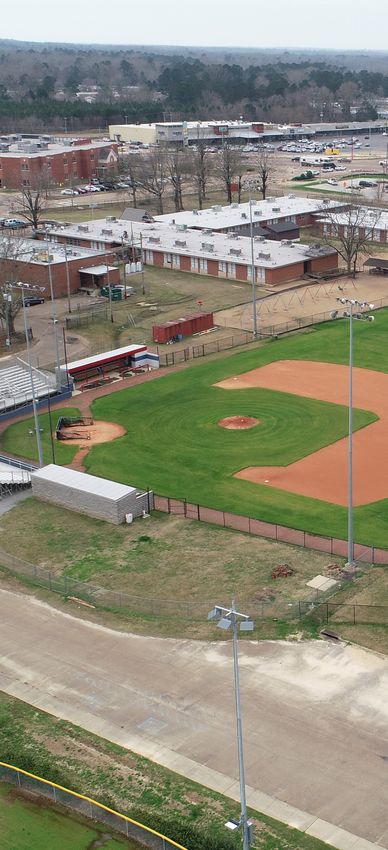
section of the plan address residential, com-         some legal weight. The plan should serve as a
    mercial, and industrial development as well as        guide for consideration of amendments to the
    parks, open space, and recreation. Additionally,      Zoning Ordinance, the Official Zoning Map, the
    street and road improvements, public schools,         Subdivision Ordinance, the Capital Improve-
    and community facilities must be considered.          ments Program, and the Capital Improvements
                                                          Budget. The Land Use Map in the plan is in-
      Chapter One contains the Public Input section.      tended to indicate broad categories of land for
    An important part of the planning process is to       future development. To be useful for zoning,
    solicit citizen input. In an effort to gain input     the land use map attempts to delineate exact
    from the public, a short online survey was con-       boundaries wherever possible.
    ducted and a public meeting was held.

      The next chapter addresses Existing Demo-           WEB-BASED GIS MAPPING VIEWER
    graphics Characteristics and Population Pro-            As part of the development of the Compre-
    jections provides information that is used to         hensive Plan for Richland, the CMPDD created
    develop population, employment, and other             a interactive web-based GIS (Geographic In-
    projections used in other chapters.                   formation Systems) mapping application and
                                                          viewer. With this internet based GIS viewing
      The third chapter addresses Economic Devel-
                                                          tool, users are able to pick and choose which
    opment in Richland. Labor force and existing
                                                          background map and data layer(s) they wish
    business inventory were analyzed to gain an ac-
                                                          view from a menu of available information. This
    curate picture of the economic conditions pres-
                                                          new service will allow accessibility to numerous
    ent in the City.
                                                          informational data layers including aerial imag-
      The fourth chapter of this Comprehensive            ery, topography, existing land use, the land use
    Plan is the Community Facilities Plan. Used as a      plan, the transportation plan, water lines, rec-
    basis for making capital improvement decisions,       reational features/facilities, demographic data,
    the community facilities plan includes: housing,      land ownership, flood zones, and zoning. A link
    schools, parks, and recreation, public buildings      to the viewer can be found on the City’s website
    and facilities, utilities and drainage.               at www.richlandms.org.

      Chapter Five addresses the Transportation
    Plan. This Plan classifies all existing and pro-
    posed streets, roads and highways and shows
    them on a Major Thoroughfares Map. The
    Transportation Plan covers the same time pe-
    riod that the Land Use Plan covers. The Plan
    includes arterial, collector and local streets, and
    roads and highways, as defined by minimum
    rights-of-way and surface width requirements.

      Chapter Six of this Comprehensive Plan is the
    Land Use Plan. This Plan designates the antic-
    ipated distribution and extent of land uses for
    residential, commercial, industrial, and other
    categories of land usage. This chapter of the
    Plan contains projections of land use for the
    community.

      A comprehensive plan is not a legal tool; how-
    ever, because it forms the basis for the zoning
    ordinance, the subdivision regulations, and oth-
    er implementation documents, it does carry

4      RICHLAND COMPREHENSIVE PLAN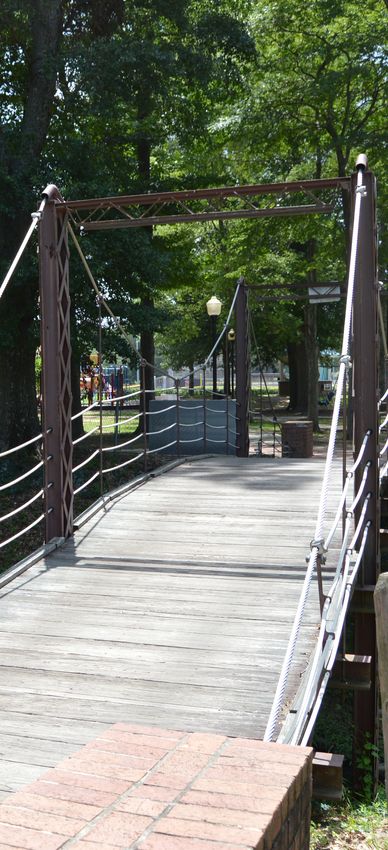
RICHLAND COMPREHENSIVE PLAN 5

HOW TO USE THIS PLAN

                                  OVERVIEW
                                    As noted in the Introduction, a com-
                                  prehensive plan serves as a policy
                                  guide for the physical and economic
                                  development of the community. It is to
                                  be used in making decisions regarding
                                  rezoning, variances, conditional uses,
                                  and site plan review. It may also be
                                  used to aid in locating business, indus-
                                  tries, and public facilities.

                                     Community planning does not at-
                                  tempt to replace market forces of sup-
                                  ply, demand, and price but to shape
                                  and channel market forces by estab-
                                  lishing certain rules for development
                                  and conservation. A community plan
                                  should foster growth policies that en-
                                  hance the community. For example,
                                  haphazard growth is unsightly and
                                  wasteful of space and public facilities,
                                  which results in higher public costs and
                                  property tax increases. Planning seeks
                                  to reduce these unnecessary costs.

                                    According to state law, zoning and
                                  other land use regulations must be
                                  based upon a comprehensive plan.
                                  This means that zoning and subdivi-
                                  sion regulations, at a minimum, must
                                  conform to the local comprehensive
                                  plan. The implication is that compre-
                                  hensive plans must precede land use
                                  regulations in preparation and adop-
                                  tion. Regulations that are consistent
                                  with, or conform to, a comprehensive
                                  plan must be consistent with each el-
                                  ement of the plan. Even though there

6   RICHLAND COMPREHENSIVE PLAN
is generally not an exact match between the             Usually, a rezoning’s conformance or noncon-
land use plan map and the zoning map, the two         formance can be quickly established by looking
should mirror each other as closely as possible.      at the land use plan map. The colored designa-
                                                      tions of land use categories on the map should
  The reason for such consistency or compati-         follow specific boundaries to be useful as a de-
bility is that the courts are likely to uphold land   cision-making guide. Arbitrarily drawn land use
use decisions when these decisions are based          boundaries can make it difficult to determine
on plans.                                             into which map section a particular piece of
  The goals and objectives element of the Plan        property falls. If the property falls on or near
gives the governing authority written, consis-        the boundary between a conforming and a non-
tent policies about how the community should          conforming land use category on the Land Use
develop. The Plan enables the legislative body        Plan, the applicant should make a case that his
to make decisions on development matters, us-         particular proposal is consistent with the Plan
ing a unified set of general, long range policies.    to the nearest natural topographical boundary,
The Plan is supposed to serve as a practical          or to the nearest street or property line. The
working guide to the governing body in making         applicant should also establish conformance
decisions.                                            with both the map and text, if possible, and it
                                                      is important that both the plan and the facts
  The governing body uses the comprehensive           showing conformance be placed into the record
plan to take action on two types of physical          of the hearing.
development matters: 1) measures which are
specifically designed to implement the com-
                                                      NONCONFORMANCE TO THE PLAN
prehensive plan (zoning ordinance, subdivision
regulations, capital improvements program             AND PLAN AMENDMENTS
and budget, the official zoning map, and de-            If the proposed change does not conform to
velopment plans), and 2) other measures that          the Plan, the Plan must be amended before the
routinely require legislative approval (rezoning      requested change in zoning classification can be
cases, special use permits/special exception/         approved. For all practical purposes, if an appli-
conditional use permits, variance applications,       cant submits a plan amendment application to
subdivision plats, street closing, site acquisi-      change the designation of a parcel of land, he
tions, and public works projects. For both types,     should also submit a rezoning application. The
the Plan should at least be consulted to see if       application should explain exactly why a plan
the Plan speaks specifically to the matter or pro-    amendment and zoning map amendment are
vides any guidance as to how the matter should        needed. The reason is that the Planning Com-
be handled. It should be remembered that the          mission should be informed as to the intent of
Plan may not indicate what action to take, nor        the plan amendment so that they can make an
will it answer all the questions that come before     informed decision. Most proposed plan amend-
the governing body. It is not supposed to; its        ments are in pursuit of rezoning.
purpose is to serve as a generalized guide to           All development proposals, as well as pro-
making development decisions.                         posed rezonings, should not only be reviewed
                                                      in light of the standards set forth in the zoning
USE OF THE PLAN                                       ordinance, but also according to each individ-
  The proponent or applicant for a zoning             ual element of the Plan. The goals and objec-
change must show that the proposed change is          tives should be checked against the proposal
in conformance with the Comprehensive Plan.           to determine if there is any conflict. The Land
The applicant must also show that there is a          Use Plan must be checked to determine if the
public need for the kind of change in question,       proposed rezoning is in conformance with the
and that the need will be best served by chang-       designated land use category. For example, if
ing the zoning classification of the property in      a proposed rezoning to a multi-family district is
question.                                             indicated, then the Land Use Plan must show

                                                          RICHLAND COMPREHENSIVE PLAN                      7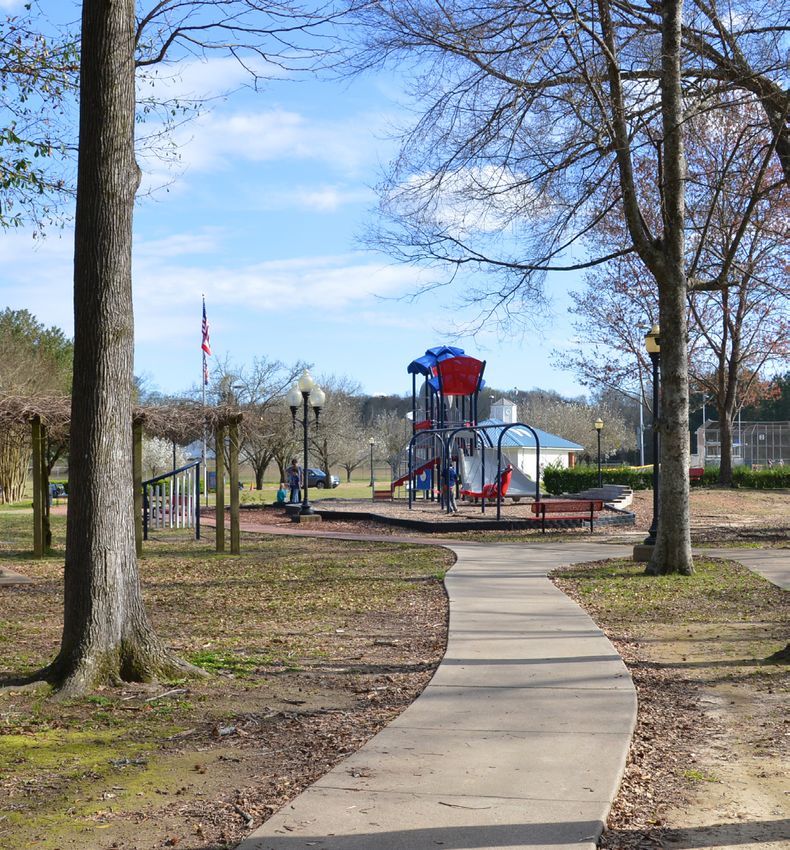
a high density classification for that site. The    pens is that when infrastructure is inadequate
    proposed rezoning must not be in conflict with      to support development, the existing facilities
    the Transportation Plan’s recommendations,          are overwhelmed and the cost of bringing the
    nor with those of the Community Facilities Plan,    infrastructure up to standard can be difficult
    both of which relate to capital improvements.       and quite expensive. It is better to have ade-
                                                        quate infrastructure in place before develop-
                                                        ment takes place. This becomes a matter of
    IMPLEMENTATION DEVICES                              timing.
      Once the Plan has been prepared and adopt-
    ed, it should be implemented. There are three
    primary means or devices commonly used to           PREVIOUS PLANS
    implement comprehensive plans; zoning ordi-           In 1978, the Central Mississippi Planning and
    nances, subdivision regulations, and capital im-    Development District (CMPDD) prepared a
    provements programs. Other devices include          “General Land Development Plan for the Year
    official maps and specific area development         2000” for the City of Richland. Ten years later,
    plans such as a downtown plan or neighbor-          in April 1988 the consulting firm Urban Planning
    hood plans. Comprehensive plans should be           Associates developed a “Community Develop-
    reviewed each year to determine if revisions are    ment and Revitalization Program” for Richland.
    needed. Plans should be completely revised or
    rewritten every five to ten years to take advan-      Recognizing that Mississippi Code Section 17-
    tage of changes that have occurred and to use       1-1 was amended in 1988 to define the required
    current information.                                elements of a “Comprehensive Plan”, the City
                                                        of Richland contracted with CMPDD in 2007 to
      Comprehensive plans can and should be used        prepare a new Comprehensive Plan and Zoning
    for concurrency plans. This is a concept that ad-   Ordinance. The new Comprehensive Plan was
    equate infrastructure should be in place before     adopted in 2012 followed by the current Zoning
    development is allowed to occur or as a condi-      Ordinance adopted in 2014.
    tion of rezoning. Otherwise, what often hap-

8      RICHLAND COMPREHENSIVE PLAN
GENERAL GOALS AND OBJECTIVES
The Richland Comprehensive Plan begins GOAL: To provide for an orderly arrange-
with a set of general goals. These are followed ment of land uses in Richland.
by more specific goals in the following chap- • OBJECTIVE: To encourage proper land
ters: Economic Development, Community use patterns and to enforce zoning laws
Facilities, Transportation Plan, and Land Use to insure compatibility of land uses. To
Plan. provide a mechanism through which de-
velopment and redevelopment will be in
Among other things, this Comprehensive accordance with the City’s Land Use Plan.
Plan is designed to: • OBJECTIVE: To recognize the desirability
• improve transportation; for separation of land uses into compat-
• improve public safety; ible types.
• encourage economic development; • OBJECTIVE: To grade land uses by type,
• prevent the overcrowding of land; character, intensity and orientation with
• continue to promote the high quality of particular emphasis on the relationship
living within Richland and the surround- between adjacent residential and com-
ing areas. mercial uses.
• OBJECTIVE: To separate incompatible
GOAL: To guide and direct the development land uses and require buffering to reduce
of the foreseeable future into desirable possible conflicts where different land
forms and patterns rather than inefficient use classifications adjoin.
sprawl.
• OBJECTIVE: To prevent the inefficient use GOAL: To use the Comprehensive Plan as a
of land. By using the Comprehensive Plan guide to future development.
as a guide to development, the desired • OBJECTIVE: To make citizens, property
land use pattern will be produced. owners and developers aware of the plan
• OBJECTIVE: To promote orderly expan- and its policies and recommendations.
sion of urban growth to provide efficient
use of resources.
• OBJECTIVE: To coordinate land uses so as
to create and maintain a functional and
appealing image for the City.
• OBJECTIVE: To protect and preserve
property values.
RICHLAND COMPREHENSIVE PLAN 9CHAPTER 1:
PUBLIC INPUT
GOALS AND OBJECTIVES
GOAL: To seek out and incorpo-
rate input from all citizens and
stakeholders into the Compre-
hensive Plan in order to develop
a plan that serves the needs of
the community.
• OBJECTIVE: To make citizens,
property owners and developers
aware of the plan and provide
them an opportunity to partic-
ipate in the development of its
policies and recommendations.
An important part of the planning
process is seeking public input. For
a plan to be truly community driven,
feedback and input from citizens and
other stakeholders must be consid-
ered. During the early stages of devel-
opment of this Plan, an online survey
was conducted. The survey contained
eleven questions related to why people
choose to live in Richland, options for
shopping and recreation, bicycle and
pedestrian facilities, and other areas of
concern. The public was asked to par-
ticipate by advertising the survey on
the City’s website and Facebook page,
and also through an email blast.
Also, in an effort to make the Plan
more accessible to the public, this Plan
was developed in an electronic format
that integrates an interactive GIS map
viewer and can easily be viewed from
the City’s website.
10 RICHLAND COMPREHENSIVE PLANCity of Richland Seeking Input for Comprehensive Plan
The City of Richland is working with the Central Mississippi Planning and Development District
(CMPDD) on an update of the city’s Comprehensive Plan. In order to assist CMPDD planners
and city leaders in developing this plan, we are asking citizens to complete a brief online survey.
Your input and comments will be a valuable part of this process.
To take our brief survey simply scan this code with your smartphone or visit
https://www.surveymonkey.com/r/richlandplan
RICHLAND COMPREHENSIVE PLAN 110
Why did you choose to live in Richland? Please select any that apply.
Other: Please respond in the box below.
Small Town Atmosphere
Schools
Safety/Crime Rates
Quality of Life
Proximity to Work
Proximity to Recrea�onal Ac�vi�es
Proximity to Family
Housing Prices/Property Values
0.00% 5.00% 10.00% 15.00% 20.00% 25.00% 30.00% 35.00% 40.00% 45.00% 50.00%
Please indicate your agreement with the following statements Strongly Disagree Disagree Agree Strongly Agree
regarding Richland's retail offerings. Percent Count Percent Count Percent Count Percent Count
Generally, for day to day activities, the current stores in Richland
meet my shopping needs. 8.25% 25 23.10% 70 55.12% 167 13.53% 41
Generally, for my annual shopping activities, the current stores in
Richland meet my shopping needs. 18.15% 55 45.87% 139 30.03% 91 5.94% 18
I believe there should be more fast food restaurants located in
Richland. 29.37% 89 38.61% 117 24.75% 75 7.26% 22
I believe there should be more full service/dine in restaurants
located in Richland. 0.99% 3 1.32% 4 28.05% 85 69.64% 211
Select the types of businesses you would like to
see added in Richland. Select any that apply.
0.6
0.5
0.4
0.3
0.2
0.1
0
12 RICHLAND COMPREHENSIVE PLANStrongly Disagree Disagree Agree Strongly Agree
Percent Count Percent Count Percent Count Percent Count
I would support architectural guidelines for
commercial and industrial areas in Richland. 4.98% 15 11.96% 36 58.80% 177 24.25% 73
Please select any of the following that are
of concern.
0.8
0.7
0.6
0.5
0.4
0.3
0.2
0.1
0
Please indicate your agreement with the Strongly Disagree Disagree Agree Strongly Agree
following statements. Percent Count Percent Count Percent Count Percent Count
I currently walk to commercial areas, i.e.
grocery store, pharmacy, restaurants, in
Richland. 50.83% 153 41.86% 126 5.32% 16 1.99% 6
I would walk to commercial areas if
additional trails and sidewalks were installed.
11.96% 36 30.56% 92 41.86% 126 15.61% 47
I would utilize biking as a mode of
transportation if additional bike lanes or trails
were installed. 14.29% 43 30.90% 93 38.21% 115 16.61% 50
Please indicate your agreement with the following Strongly Disagree Disagree Agree Strongly Agree
statements regarding Richland's Comprehensive Plan. Percent Count Percent Count Percent Count Percent Count
The Plan should encourage new commercial developments. 5.81% 18 6.13% 19 50.00% 155 38.06% 118
The Plan should encourage new residential developments. 6.45% 20 10.32% 32 50.32% 156 32.90% 102
The Plan should encourage new industrial developments. 7.74% 24 19.03% 59 49.35% 153 23.87% 74
Please indicate your agreement with the following statements Strongly Disagree Disagree Agree Strongly Agree
regarding a designated Walking/Biking Route in Richland. Percent Count Percent Count Percent Count Percent Count
I would support a designated walking/biking route along streets in
Richland that connects parks, schools, and downtown with
residential areas. 2.65% 8 5.63% 17 39.07% 118 52.65% 159
I believe directional signage with mileage markers along the
designated route would be useful. 2.65% 8 14.24% 43 49.67% 150 33.44% 101
RICHLAND COMPREHENSIVE PLAN 13CHAPTER 2: POPULATION
PROJECTIONS AND DEMOGRAPHICS
POPULATION PROJECTIONS
Table II-1 contains population counts
and projections for the City of Richland
and Rankin County. These Projections
are in ten-year increments from 2010
to 2040. The projections do not as-
sume that growth will be confined to
within the city limits. Naturally, as the
city grows, the geographic area con-
sidered to be part of the city will grow.
The projections for the City and County
were generated using a linear regres-
sion technique.
TABLE II-1
POPULATION PROJECTIONS
RANKIN CITY OF
YEAR
COUNTY RICHLAND
1980 69,427 3,955
1990 87,655 4,014
2000 115,327 6,027
2010 141,617 6,912
2020 164,567 7,948
2030 188,991 9,036
2040 213,415 10,125
Source: U.S. Census Bureau and CMPDD
14 RICHLAND COMPREHENSIVE PLANPopulation Summary
Richland, Mississippi
Population by Race Number Percent Total Population
Reporting One Race 6,840 98.96% 2000 6,072
White 5,446 78.79% 2010 6,912
Black 999 14.45% Annual Rate (%) 1.30
American Indian 16 0.23% Popula�on by Sex
Asian 116 1.68%
Pacific Islander 10 0.14%
Other Race 253 3.66%
Reporting Two or More Races 72 1.04% 49%
Total Hispanic Population 371 5.37% 51%
Population by Sex
Male 3,388 49.0%
Male Female
Female 3,524 51.0%
Population by Age
0-4 576 8.33% Popula�on by Race
5-9 539 7.80%
10-14 520 7.52%
15-19 472 6.83%
0.23%
20-24 451 6.52%
14.45% 1.68%
25-29 555 8.03%
30-34 486 7.03% 0.14%
78.79%
35-39 491 7.10% 3.66%
40-44 461 6.67% 1.04%
45-49 488 7.06%
50-54 449 6.50% 5.37%
55-59 400 5.79%
60-64 326 4.72% White
65-69 240 3.47% Black
70-74 167 2.42% American Indian
75-79 146 2.11% Asian
80-84 88 1.27% Pacific Islander
57 Other Race
85+ 0.82%
Repor�ng Two or More Races
18+ 5,005 72.41% Total Hispanic Popula�on
65+ 698 10.10%
Popula�on by Age
1,000
100
10
1
0-4
5-9
10-14
15-19
20-24
25-29
30-34
35-39
40-44
45-49
50-54
55-59
60-64
65-69
70-74
75-79
80-84
85+
Data Note: Hispanic population can be of any race. Census 2010 medians are computed from reported data distributions.
Source: U.S. Census Bureau, Census 2010 Summary File 1. Esri converted Census 2000 data into 2010 geography.
RICHLAND COMPREHENSIVE PLAN 15Population Summary and Projections
Richland, Mississippi
2010 2018 2023
Population
6,912 6,917 7,022
Population by Age Number Percent Number Percent Number Percent
0-4 576 8.3% 525 7.6% 504 7.2%
5-9 539 7.8% 539 7.8% 529 7.5%
10 - 14 520 7.5% 517 7.5% 555 7.9%
15 - 19 472 6.8% 432 6.2% 485 6.9%
20 - 24 451 6.5% 410 5.9% 372 5.3%
25 - 34 1,041 15.1% 1,022 14.8% 917 13.1%
35 - 44 952 13.8% 973 14.1% 1,049 14.9%
45 - 54 937 13.6% 853 12.3% 848 12.1%
55 - 64 726 10.5% 818 11.8% 804 11.4%
65 - 74 407 5.9% 534 7.7% 610 8.7%
75 - 84 234 3.4% 221 3.2% 272 3.9%
85+ 57 0.8% 74 1.1% 77 1.1%
Race and Ethnicity
White Alone 5,446 78.8% 5,247 75.9% 5,317 75.7%
Black Alone 999 14.5% 1,189 17.2% 1,213 17.3%
American Indian Alone 16 0.2% 16 0.2% 16 0.2%
Asian Alone 116 1.7% 117 1.7% 117 1.7%
Pacific Islander Alone 10 0.1% 9 0.1% 9 0.1%
Some Other Race Alone 253 3.7% 252 3.6% 262 3.7%
Two or More Races 72 1.0% 88 1.3% 90 1.3%
Hispanic Origin (Any Race) 371 5.4% 368 5.3% 380 5.4%
Race and Ethnicity Popula�on by Age
Hispanic Origin (Any Race) 1,200
Two or More Races 1,000
Some Other Race Alone 800
Pacific Islander Alone 600
Asian Alone 400
American Indian Alone
200
Black Alone
0
White Alone
0-4
5-9
10 - 14
15 - 19
20 - 24
25 - 34
35 - 44
45 - 54
55 - 64
65 - 74
75 - 84
85+
0 2,000 4,000 6,000
2010 2018 2023 2010 2018 2023
Source: U.S. Census Bureau, Census 2010 Data. Esri forecasts for 2018 and 2023.
16 RICHLAND COMPREHENSIVE PLANHousehold Summary
Richland, Mississippi
Households by Type Number Percent Total Households
Households with 1 Person 697 26.1% 2000 2,327
Households with 2+ People 1,971 73.9% 2010 2,668
Family Households 1,847 69.2% Annual Rate (%) 1.38%
Husband-wife Families 1,232 46.2% Average Size 2.59
With Own Children 557 20.9%
Other Family (No Spouse Present) 615 23.1% Households by Size
With Own Children 371 13.9%
Nonfamily Households 124 4.6% 800
All Households with Children 1,051 39.4% 700
Multigenerational Households 161 6.0% 600
Unmarried Partner Households 169 6.3%
Male-female 160 6.0% 500
Same-sex 9 0.3%
400
Population by Relationship and Household Type
Total 6,912 100.0% 300
In Households 6,912 100.0%
200
In Family Households 5,934 85.9%
Householder 1,847 26.7% 100
Spouse 1,232 17.8%
Child 2,399 34.7% 0
Other relative 248 3.6%
Nonrelative 208 3.0%
In Nonfamily Households 978 14.1%
In Group Quarters 0 0.0%
Institutionalized Population 0 0.0% Family Non Family
Noninstitutionalized 0 0.0%
Households by Size
Family Non Family Popula�on by Rela�onship and
Number Percent Number Percent Household Type
Total 1,847 100.0% 821 100.0%
1 Person --- 697 84.9%
2 People 699 37.8% 103 12.5% 0.0%
3 People 488 26.4% 12 1.5%
4 People 381 20.6% 7 0.9%
174 14.1% 17.8%
5 People 9.4% 1 0.1% 34.7%
6 People 73 4.0% 1 0.1%
7+ People 32 1.7% 0 0.0% 85.9% 26.7%
Average
3.10 1.19
Size
3.0% 3.6%
Households by Type
In Family Households In Family Households
Householder
Households In Nonfamily Households
26.1% 69.2% Family
with 2+ Spouse
people Households
Households Ins�tu�onalized Popula�on Child
with 1 Non-Family
73.9% Households Nonins�tu�onalized Other rela�ve
4.6%
Popula�on Nonrela�ve
Data Note: Households with children include any households with people under age 18, related or not. Multigenerational households are families with 3 or more parent-child relationships.
Unmarried partner households are usually classified as nonfamily households unless there is another member of the household related to the householder. Multigenerational and unmarried partner
households are reported only to the tract level. Esri estimated block group data, which is used to estimate polygons or non-standard geography. Average family size excludes nonrelatives.
Source: U.S. Census Bureau, Census 2010 Summary File 1.
RICHLAND COMPREHENSIVE PLAN 17Housing Unit Summary
Richland, Mississippi
Total Housing Units
2000 2,538 Housing Units by Race of Householder
2010 2,843
1.14 100.0%
Annual Rate (%)
Total Housing Units by Occupancy Number Percent 90.0%
Occupied Housing Units 2,668 93.84%
Vacant Housing Units 80.0%
For Rent 65 2.29% 70.0%
Rented, not Occupied 4 0.14%
For Sale Only 34 1.20% 60.0%
Sold, not Occupied 4 0.14%
For Seasonal/Recreational/Occasional Use 50.0%
27 0.95%
For Migrant Workers 0 0.00% 40.0%
Other Vacant 41 1.44%
30.0%
Total Vacancy Rate (%) 6.2%
20.0%
Average
Households by Tenure and
Number Percent Household 10.0%
Mortgage Status
Size
Total 2,668 100.0% 0.0%
Owner Occupied 1,799 67.4% 2.57
Owned with a Mortgage/Loan 1,195 44.8%
Owned Free and Clear 604 22.6%
Renter Occupied 869 32.6% 2.63
Housing Units by Race Owner Occupied Renter Occupied
Owner Occupied Renter Occupied
of Householder Number Percent Number Percent
Average Households by Tenure and
Total 1,799 100.0% 869 100.0%
Household Size Mortgage Status
White 1,604 89.2% 540 62.1% 2.55
Black 135 7.5% 242 27.8% 2.63 Renter Owner
Occupied Occupied 44.8%
American Indian 3 0.2% 2 0.2% 2.40
32.6%
Asian 23 1.3% 19 2.2% 2.64 67.4%
22.6%
Pacific Islander 1 0.1% 8 0.9% 1.67
Some Other Race 27 1.5% 39 4.5% 3.79
Owned with a Mortgage/Loan
Two or More Races 6 0.3% 19 2.2% 2.56 Owned Free and Clear
Hispanic 34 1.9% 64 7.4% 3.67
Total Housing Units by Occupancy
0.95% Occupied Housing Units
For Rent
93.84% Rented, not Occupied
1.44%
Vacant For Sale Only
6.16% 1.20%
Occupied Housing
Housing Units Sold, not Occupied
Units 0.14% For Seasonal/Recrea�onal/Occasional Use
2.29%
For Migrant Workers
Other Vacant
Data Note: Hispanic population can be of any race. Census 2010 medians are computed from reported data distributions.
Source: U.S. Census Bureau, Census 2010 Summary File 1. Esri converted Census 2000 data into 2010 geography.
18 RICHLAND COMPREHENSIVE PLANHouseholder Summary
Richland, Mississippi
Households by Age of Householder
Family Non-Family Households by Age of Householder
11.1%
Number Percent Number Percent Inner ring: Family
Total 1,847 100.0% 821 100.0% 5.6% Outer ring: Non-Family
35.9% 13.2%8.9%
16.1%
15 - 44 904 48.9% 295 35.9% 15 - 44 45 - 54
48.9%
45 - 54 377 20.4% 162 19.7%
55 - 64 65 - 74
55 - 64 297 16.1% 165 20.1% 20.1% 20.4%
65 - 74 165 8.9% 108 13.2% 19.7% 75+
75+ 104 5.6% 91 11.1%
Summary by Race of Husband-Wife Other Families (No
Total Households Non-Family
Householder Families Spouse)
Householder is: Number Percent Number Percent Number Percent Number Percent
Total 2,668 100.0% 1,232 100.0% 615 100.0% 821 100.0%
White 2,144 80.4% 1,053 85.5% 437 71.1% 654 79.7%
Black 377 14.1% 108 8.8% 153 24.9% 116 14.1%
American Indian 5 0.2% 2 0.2% 0 0.0% 3 0.4%
Asian 42 1.6% 24 1.9% 6 1.0% 12 1.5%
Pacific Islander 9 0.3% 0 0.0% 1 0.2% 8 1.0%
Some Other Race 66 2.5% 34 2.8% 14 2.3% 18 2.2%
Two or More Races 25 0.9% 11 0.9% 4 0.7% 10 1.2%
Hispanic 98 3.7% 49 4.0% 22 3.6% 27 3.3%
Race of Householder
2,500
2,000
1,500
1,000
500
0
White Black American Asian Pacific Some Other Two or More Hispanic
Indian Islander Race Races
Total Households Husband-Wife Families Other Families (No Spouse) Non-Family
Data Note: Hispanic population can be of any race. Census 2010 medians are computed from reported data distributions.
Source: U.S. Census Bureau, Census 2010 Summary File 1. Esri converted Census 2000 data into 2010 geography.
RICHLAND COMPREHENSIVE PLAN 19CHAPTER 3:
ECONOMIC DEVELOPMENT
GOALS AND OBJECTIVES
GOAL: To make Richland a
healthy, safe and convenient
place to live and work, and to
provide a pleasant and attrac-
tive atmosphere for living, shop-
ping, recreation, civic and cultur-
al, and service functions.
• OBJECTIVE: To ensure that fu-
ture development will be in the
best interest of the City and
its citizens, measures will be
taken which will generally im-
prove the quality of life of the
citizens of Richland.
• OBJECTIVE: To create a unique
and appealing environment
which will encourage and en-
hance development by private
developers consistent with the
culture, heritage, and vision of
the City.
20 RICHLAND COMPREHENSIVE PLANGOAL: To retain and expand existing busi- GOAL: Continue to promote new commer-
nesses located within Richland, and to at- cial and industrial development.
tract new businesses to the City that com- • OBJECTIVE: Continue to provide well-lo-
plement existing businesses and the meet cated sites adequately served by high-
the needs of the community. ways, railroads, utilities and services for
• OBJECTIVE: To partner with existing busi- new industrial development.
ness organizations, such as Chamber of
Commerce and Rankin First, to foster a GOAL: To provide for quality educational
business friendly environment and fa- opportunities for all students.
cilitate the recruitment and retention of • OBJECTIVE: To continue to support the
business and industry in the City. Rankin County School District and all
• OBJECTIVE: To partner with business- schools within the City in the growth of
es and industry to fund necessary infra- educational opportunities for children.
structure improvements through avail- • OBJECTIVE: To encourage the utilization
able grants, loans, or funding strategies of Hinds Community College’s campus
such as Tax Increment Financing. in Rankin County to provide workforce
• OBJECTIVE: To maintain a diverse busi- training.
ness mix to provide services and employ- GOAL: To encourage the provision of an
ment opportunities to all citizens of the adequate housing supply that meets all
City of Richland. needs.
• OBJECTIVE: Encourage the reuse and re- • OBJECTIVE: To provide a mix of residen-
investment in vacant commercial and in- tial densities in the City of Richland to
dustrial facilities to prevent the declining suit different needs and markets, ranging
property values. from multiple family units to large lot es-
GOAL: To accept tourism as an economic tates.
driver. • OBJECTIVE: To maintain and enforce land
• OBJECTIVE: To pursue recreational op- development regulations, specifically the
portunities along the Pearl River to create Land Use Plan, Zoning Ordinance, and
a destination. Subdivision Regulations, to ensure that
• OBJECTIVE: Partner with the Richland the physical growth of the City supports
Chamber of Commerce to encourage vis- the housing needs of all residents.
itors and spectators to dine, shop, and
stay in Richland when participating in or
attending events at the one of the City’s
recreational facilities.
RICHLAND COMPREHENSIVE PLAN 21In a strict, traditional use, the term economic within a community creates growth, income
development means the process and policies that is invested in another community, grows
a government uses to improve the economic, that community.
political, and social well-being of its people. It
creates conditions for economic growth and im-
proved quality of life. Economic development
LABOR FORCE
A community’s labor force is comprised of all
is generally assumed to be the attraction and
individuals over the age of 16 that have or are
retention of employers within a given jurisdic-
actively seeking a job that are not serving in the
tion. However, economic development encom-
military or are not institutionalized. The U.S.
passes significantly more than just commercial
Bureau of Labor Statistics tracks and reports on
and industrial development or jobs. Economic
the labor force on a monthly basis. This data is
development activities in partnership with land
an estimate and does not include the self-em-
development regulations help build a high-qual-
ployed or those working for non-profit or reli-
ity community where citizens can live, work, and
gious organizations. However, this informa-
play. This chapter will first inventory and ana-
tion is the most accurate source of labor data
lyze what is currently within the City, then it will
available. As such, it is noted that Richland’s
set a vision of what is needed and desired for
employed population remained the same from
the future.
2011 to 2016. This indicates retention of em-
Local governments are key players in eco- ployment opportunities and a slight decrease in
nomic development by offering services, infra- the unemployment rate.
structure, and other assistance to help spur job
Table III-1 compares the data for Richland to
growth. To expand visibility and avoid duplica-
that of Rankin County, the Jackson Metropoli-
tion of services, many governments, including
tan Statistical Area (MSA), which accounts for
Richland, partner with private and/or non-profit
Copiah, Hinds, Madison, Rankin and Simpson
economic development groups, such as Rankin
Counties, and the State of Mississippi. The City
First Economic Development Authority, to pro-
of Richland’s labor force has remained one of
vide such services and assistance. In return, a
the most employable in the region. The City’s
healthy economy generates tax revenues that
rate of employment indicates that it is a strong,
allow the local government to provide services.
working labor force. A strong, working labor
The economy of Richland is extremely diverse, force is the foundation to a strong economy.
which allows for a mixture of employment op-
portunities and provides the City with stability
during economic downturns. In recent years,
many local governments and even state and
federal programs have placed a significant im-
portance on “high-quality, high-wage jobs.” This
type of job certainly has the ideal characteristics
that a growing, wealthy community would de-
sire; however, it is important to note the diver-
sity of the City’s population and their needs. A
single-sector economy and one without a ser-
vice or retail sector would cause significant in-
vestments and income to leave the City.
Ideally, residents should be able to find gainful
employment based on their skill or knowledge,
housing that is affordable for their income, and
the services to meet their needs without leaving
the City. Income that is earned and reinvested
22 RICHLAND COMPREHENSIVE PLANTable III-1
2011 2016
City of Rankin Jackson State of City of Rankin Jackson State of
Richland County MSA Mississippi Richland County MSA Mississippi
Labor Force 3,832 72,172 271,910 1,316,500 3,721 75,020 273,200 1,287,300
Employed 3,668 68,292 251,070 1,198,200 3,510 72,050 261,300 1,221,900
Unemployment
3.1 3.6 7.7 9.0 4.1 4.0 4.4 5.1
Rate
SOURCE: U.S. Census Bureau, Mississippi Department of Employment Security
Educational attainment is also important to a 17%, or approximately 586, of the labor force
strong labor force. According to the American in Richland work live and work in the City. The
Community Survey data from 2016, approxi- majority of the labor force that leaves the City
mately 86.1% of City’s population over the age for employment works within Rankin County.
of 25 has at least a high school degree. Further- On average residents travel 24 minutes to their
more, 14% of the same population has a bach- place of work. Based on the out commuter data
elor’s degree or higher. In comparison, 83% of provided by the U.S. Census and employment
the State of Mississippi’s population over the data collected by CMPDD, it can be assumed
age of 25 has at least a high school degree, and that an additional 4,100 workers commute into
21% has a Bachelor’s degree or higher. A la- Richland for employment.
bor force must have diversity in education and
training as well. In this case, the labor force of In the perfect economy, the City’s labor force
Richland is diverse with an adequate range of would be able to provide the labor necessary
educational attainment to meet the needs of to fill all employment opportunities and there
employment opportunities. would be adequate opportunities within the
City to provide employment for all. This would
mean that the economy was so diverse that it
Commute Patterns
provides employment opportunities for ev-
The labor force of a political boundary, i.e.
ery skill level, from entry-level, trade skills to
a municipality, is not limited to the political
high-level, professional skills. Furthermore, the
boundaries that define the area. As such, the
educational attainment of the labor force meets
residents of Richland may commute outside
the needs of the employers.
of the City for employment, while others com-
mute into the City for employment. Commut- However, the City’s labor force is not large
ing patterns as analyzed by the U.S. Census enough to meet the demands of the existing
Bureau address this issue. According to 2012 businesses within City. Furthermore, many res-
– 2016 American Community Survey data, only idents are commuting beyond the City for em-
RICHLAND COMPREHENSIVE PLAN 23ployment. The demand is filled by residents of sified as industries providing transportation of
surrounding areas. This suggests a slight, but passengers and cargo, warehousing and stor-
not significant, imbalance in the labor force. age (not sale of) goods, and support activities
Such an imbalance is expected in a suburban related to the transportation modes. Finally,
community, especially in an area within close the construction sector includes residential and
proximity of a cluster of state and federal gov- commercial contractors in all trades, such as
ernment facilities. general contractors and subcontractors: me-
chanical and electrical.
BUSINESS INVENTORY Table III-3
An inventory of businesses operating in the
Sector Employees
City of Richland was compiled from local data
sources, CMPDD, and a national database, Wholesale Trade 1,603
Hoover’s Inc. The top five sectors for total num- Transportation and
1,322
ber of businesses are listed in TABLE III-2. Warehousing
Retail Trade 1,120
Table III-2
Manufacturing 623
Number of
Sector Construction 616
Businesses
Retail Trade 68 CITY TOTAL 7,639
Wholesale Trade 66 The wholesale sector is reported to have the
Other Non-Public highest number of employees. In Richland, this
55 sector includes numerous heavy equipment
Services
Transportation and and transportation parts suppliers, industrial
42 equipment suppliers, and electrical, plumbing,
Warehousing
and hardware wholesalers. It is followed by the
Construction 41
transportation and warehousing sector then
CITY TOTAL 495 the retail sector. The fourth largest sector is
manufacturing, which includes electronic man-
Businesses within the retail sector account for
ufacturing, food and beverage manufacturing,
the most businesses in the City of Richland. The
and petroleum refining. The construction sector
retail sector represented in this list does include
rounds out the top five sectors by employment.
big-box retailers, grocery stores, clothing, home
goods, etc. but does not include accommoda- According to Hover and CMPDD data, Siemens
tions or food services. These typically have Industry, Inc, an electronic products wholesal-
displays or storefronts for the general public er, is the largest employer in Richland with ap-
to walk-in and purchase products. The whole- proximately 400 employees. Big-box retailer,
sale trade sector is comprised of businesses Walmart, Inc., is the second largest employer
engaged in wholesaling merchandise, or ar- with 300 employees, and the third largest em-
ranging the purchase and sale of goods to oth- ployer in Richland is the KLLM Transport Ser-
er businesses. There is minimal general pub- vices, LLC with 250 employees.
lic access to wholesalers and most are housed
in warehouses. Examples include automobile The City of Richland sits at an intermodal
parts supplier, tire wholesalers, and construc- crossroads, which connects north and south,
tion equipment and supplies. The third largest east and west by rail, air, and land. Furthermore,
sector is the classified as “Other Non-Public Ser- it is approximately 60 miles from the nearest
vices”. This covers personal services, such as Mississippi River port, and a few hours from a
automobile repair and hair salons, non-profits, deep water gulf port. Thus, it is not surprising
and religious organizations. The transportation that the City boasts a significant wholesale and
and warehousing sector accounts for just over transportation sectors. Richland is not, and will
40 businesses in Richland. This sector is clas- likely remain, dependent on a single sector or
24 RICHLAND COMPREHENSIVE PLANsub-sector for employment and investment. There is diversity in the economy of Richland, which
is known to help weather downturns in a given sector. Furthermore, as discussed previously, the
labor force in Richland meets the needs of existing business and industry based on educational
attainment, but must be supplemented in regards to numbers to meet the demands of the local
businesses. An economy that lacks diversity, also lacks the ability to meet the needs of its residents.
EDUCATION
Residents of Richland are served primarily by the Richland Elementary, Richland Upper Elementa-
ry, and Richland High School, all of which are part of the Rankin County School District. There are
numerous other private schools within 30 miles of the Richland that may also serve the residents
of the community.
The three schools are commonly known as the Richland Attendance Zone, and have an enroll-
ment of 1,893 for the 2018 – 2019 school year. The Richland Attendance Zone has seen a gradual
decrease in enrollment since the 2012 school year as noted in Table III-4. According to the Rankin
County School District, the enrollment is projected to continue to decrease slightly through 2027.
Table III-4
2012- 2013- 2014- 2015- 2016- 2017- 2018- 2026-
2013 2014 2015 2016 2017 2018 2019 2027
Richland
517 515 525 501 483 454 439 446
Elementary School
Numerical Change -2 10 -24 -18 -29 -15 7
Percent Change -0.4% 1.9% -4.6% -3.6% -6.0% -3.3% 1.6%
Richland Upper
632 614 581 642 623 612 612 552
Elementary
Numerical Change -18 -33 61 -19 -11 0 -60
Percent Change -0.4% 1.9% -4.6% -3.6% -6.0% 0.0% -9.8%
Richland High
923 906 928 903 852 850 842 788
School
Numerical Change -17 22 -25 -51 -2 -8 -54
Percent Change -1.8% 2.4% -2.7% -5.6% -0.2% -0.9% -6.4%
Richland
Attendance Zone 2,027 2,035 2,034 2,046 1,958 1,916 1,893 1,786
Total
Numerical Change -37 -1 12 -88 -42 -23 -107
Percent Change -1.8% 0.0% -0.6% -4.3% -2.1% -1.2% -5.7%
Source: Rankin County School District
RICHLAND COMPREHENSIVE PLAN 25The Rankin County School District issued bonds, as approved by the citizens of Rankin County, in
2017. Proceeds from these bonds are being utilized to complete campus upgrades related to ad-
ditional classroom space, increased safety, fine arts, career academies, multi-purpose facilities and
general building upgrades. Specifically, within the Richland Attendance Zone, the bond proceeds
will provide additional classrooms to address overcrowding and the use of portable classroom
units, building upgrades including improvements to restrooms, and security cameras and secured
entrances. A complete list of improvements by school is provided in the following table.
26 RICHLAND COMPREHENSIVE PLANTable III-5
School Improvement Total Cost
Add 6 Classrooms
Electrical Upgrade
New Intercom/Fire Alarm
Security Cameras for Doors/Halls
Richland Elementary School Mechanical Upgrades
Grades: Pre-K – 2 Reroof $4,613,148
Built: 1987 Ceilings and Lights, as needed
New Serving Line in Cafeteria
Site Work, Drainage, Fencing, Parking
Special Needs Playground
Add New Toilets
Add 6 Classrooms
Electrical Upgrade
New Intercom/Fire Alarm
Security Cameras for Doors/Halls
Secure Entrance
Richland Upper Elementary Mechanical Upgrades
Grades: 3 – 6 Reroof $4,578,410
Built: 1977 Toilet Renovations
Ceilings, Lights and Flooring, as needed
New Serving Line in Cafeteria
Site Work and Drainage
Special Needs Playground
Add 2 Toilets
Add 7 Classrooms
3 Career Academies
New Intercom
Security Cameras for Doors/Halls
Toilet Renovations
Richland High School Renovate Old Gym for Multi-Purpose
Grades: 7 – 12 Facility $6,544,448
Built: 2004 Dining and Serving Expansion
Ceilings, Lights and Floors, as needed
Add Toilets
Site Work for Drop Off and Parking
Demolition of old Church Property
Fine Arts Facility
Richland Attendance Zone $15,736,005
Source: Rankin County School District
RICHLAND COMPREHENSIVE PLAN 27Hinds Community College, which has a Diesel Technology Academy in Richland, is a frequent part-
ner in workforce training activities in the area and commonly works with businesses and industries
to provide customized workforce training. Specifically, the Diesel Technology Academy works in
partnership with several Richland businesses to provide well-trained employees in the heavy-duty
truck and equipment industries. Hinds has also partnered with KLLM Transport Services to create
a Driving Academy for trainees to earn their Commercial Driver’s License in Richland as well. Hinds
is Mississippi’s largest community college and provides more than 200 academic and technical pro-
grams. Additionally, Hinds’ Rankin County Campus is located in Pearl, which is also within Rankin
County and only 5 miles from Richland.
HOUSING
The City of Richland’s housing market continues to grow and expand, and additional demand is
projected based on the population projections. Utilizing the population projections as discussed in
Chapter Two and historic persons-per-household and occupied housing unit data from Census, a
demand for additional housing units is noted. Based on this assumption, the following table proj-
ects population and housing needs for the City through 2040.
Table III-6
PROJECTED HOUSING UNITS
CITY OF RICHLAND
1990 - 2040
PROJECTED PROJECTED
PERSONS PER
OCCUPIED PERSONS PER HOUSING
OCCUPIED PROJECTED
YEAR HOUSING OCCUPIED NEED (IN
HOUSING POPULATION
UNITS HOUSING DWELLING
UNIT
UNIT UNITS)
2000 2,303 2.62
2010 2,668 2.60
2020 2.61 7,948 3,045
2030 2.61 9,036 3,462
2040 2.61 10,125 3,879
Source: U.S. Census Bureau and Central Mississippi Planning and Development District.
Additionally, according to the 2010 U.S. Cen-
sus, the City’s housing unit vacancy rate was just
over 6 percent. The U.S. Census Bureau’s 2012 –
2016 American Community Survey estimates the
vacancy rate to be 8 percent. As with the 2010
data, the majority of vacancies were in the rent-
al housing market, which may cause the overall
vacancy rate to be inflated at times. However,
it does not indicate an oversaturation of hous-
ing units. Furthermore, the number of new con-
struction permits indicates a demand for new
housing units within the City. In the period from
2010 to 2017, there were 88 building permits
issued for the construction of single family, site
built homes in the City. In 2016 and 2017, the
28 RICHLAND COMPREHENSIVE PLANYou can also read