SES Water Draft Drought Plan
                        2018
←
→
Page content transcription
If your browser does not render page correctly, please read the page content below
SES Water Draft Drought Plan
2018
SES Water                                                                        Draft Drought Plan - February 2018

NON-TECHNICAL SUMMARY ............................................................................................. 2
1.     INTRODUCTION ................................................................................................... 4
1.1.   Overview of process ........................................................................................... 4
1.3.   Baseline water resources situation .................................................................... 5
1.4.   Levels of service ................................................................................................. 7
1.5.   Pre-draft and draft consultation details ............................................................. 7
1.6.   Links with Water Resources Management Plan ................................................ 8
2.     DROUGHT TRIGGERS AND MANAGEMENT ACTIONS..................................... 9
2.1.   Data sources and arrangements ........................................................................ 9
2.2.   Drought triggers .................................................................................................10
2.3.   Forecasting .........................................................................................................13
2.4.   Demand-side actions .........................................................................................14
2.5.   Supply-side actions and triggers ......................................................................22
2.6.   Drought permits .................................................................................................25
2.7.   Sequencing of drought management actions ..................................................30
2.8.   Summary timeline of drought management actions ........................................44
2.9.   Identifying the end of a drought ........................................................................45
3.     ENVIRONMENTAL ASSESSMENT .....................................................................46
3.1.   Scoping ...............................................................................................................46
3.2.   Environmental impacts (including Water Framework Directive) .....................47
3.3.   Mitigation measures, compensation requirements ..........................................47
3.4.   Environmental data provision and monitoring plan ........................................49
3.5.   Post drought actions..........................................................................................49
4.     MANAGEMENT AND COMMUNICATIONS STRATEGY ....................................50
4.1.   Management structure .......................................................................................50
4.2.   Communications plan ........................................................................................50
4.3.   Lessons learned from previous droughts ........................................................52
4.4.   Post drought actions..........................................................................................53
5.     DROUGHT SCENARIOS .....................................................................................53
5.1.   Drought Scenarios and worked examples ........................................................53
5.2.   Seasonal peaks scenario ...................................................................................54
5.3.   Single season drought scenario: 2005/06 (surface water) ..............................54
5.4.   Two dry winter drought scenario: 2004/05 and 2005/06 (groundwater
       sources) ..............................................................................................................58
5.5.   1 in 200 year Groundwater drought scenario ...................................................64
5.6.   Summary of drought scenarios .........................................................................66
6.     GLOSSARY OF DROUGHT PLAN TERMINOLOGY...........................................67
APPENDIX A: DROUGHT OPTIONS TABLES ...................................................................70
APPENDIX B: REVIEW OF BOUGH BEECH OPERATING CURVES AND TRIGGER
       LEVELS ...............................................................................................................84
APPENDIX C: COMMUNICATIONS PLAN .........................................................................86
APPENDIX D: RIVER EDEN DROUGHT PERMIT ENVIRONMENTAL ASSESSMENT
       REPORT ..............................................................................................................90
APPENDIX E: GROUNDWATER ABSTRACTIONS DROUGHT PERMITS
       ENVIRONMENTAL ASSESSMENT REPORT .....................................................91
SES Water                                                                        Draft Drought Plan - February 2018

TABLE OF FIGURES
Figure 2.1: Well House Inn Drought Trigger Curves ........................................................11
Figure 2.2: Bough Beech Reservoir Drought Trigger Curves .........................................12
Figure 5.1: Monthly rainfall totals (January 2000-May 2011) and long term average
(1990-May 2011) rainfall at Bough Beech reservoir .........................................................55
Figure 5.2: Well House Inn: 2003-2007 mean monthly groundwater levels compared to
long-term monthly minima, means and maxima (Oct 1942 – Dec 2010) .........................55
Figure 5.3: River Eden flows at Chiddingstone (April 1996-March 2011) .......................56
Figure 5.4: Bough Beech storage levels and corresponding drought triggers and
action zones (April 2003-March 2007) ...............................................................................58
Figure 5.5: Well House Inn Historic Levels and revised Drought Triggers and Action
Zones from January 2003 to December 2007 ...................................................................63
Figure 5.6: Groundwater Levels - 1 in 200 Year Scenario................................................65
Figure 5.7: Bough Beech Levels - 1 in 200 Year Scenario ...............................................66

TABLE OF TABLES
Table 1.1: Drought Scenarios ............................................................................................. 9
Table 2.1: Summary of estimated savings from demand restrictions ............................22
Table 2.2: Summary of supply-side outputs .....................................................................25
Table 2.3: Summary of key licence conditions for the River Eden abstraction .............26
Table 2.4: Inclusions and exemptions from Phase 1 temporary use restrictions ..........34
Table 2.5: Inclusions and exemptions from Phase 2 temporary use restrictions ..........36
Table 2.6: Inclusions and exemptions from Phase 3 temporary use restrictions ..........39
Table 2.7: Inclusions and exemptions associated with a Drought Order to restrict non-
essential uses of water ......................................................................................................41
Table 2.8: Approximate timescales required for drought management measures ........45
Table 4.1: Potential Audiences ..........................................................................................52
Table 5.1: Actions taken by SESW during the 2004-2006 two dry winter drought .........61

                                                           Page 1
SES Water                                                   Draft Drought Plan - February 2018

      Non-Technical Summary
      This document is a revision of the Drought Plan published in March 2013. This plan is
      intended to be consistent with our next Water Resources Management Plan due to be
      published in 2019.
      This Drought Plan sets out the operational actions we will consider taking in response
      to drought events of different severities, guided by the position at any time of reservoir
      and groundwater levels in relation to specified triggers. The aim of the plan is to
      minimise environmental impacts, but where potential impacts are identified, it presents
      a balance of measures that may include restrictions on customers’ use of water. The
      plan includes an assessment of the environmental impacts that may result from the
      implementation of drought permits on the River Eden and at three groundwater
      sources: Hackbridge/Goatbridge, the Woodmansterne Group and the Kenley Group,
      and the mitigation measures that we could take.
      All droughts vary in terms of their duration and impact on the availability of water
      resources. This variation is caused by a number of factors, in particular the complex
      interactions between climatic variables, customer demand and surface and/or
      groundwater levels during the period leading up to a drought. All water companies must
      manage the impact of droughts to ensure that essential supplies of water to customers
      are maintained. Since it is an operational plan, we consider it important to demonstrate
      the robustness of Plan against real drought scenarios, particularly those we have
      experienced in the recent past when operational conditions were similar to the current
      situation.
      Multi season droughts (comprising two or more dry winters) have a large effect on
      groundwater resources, and as we rely on groundwater for approximately 85% of our
      supply, such droughts present the greatest potential threat to our overall resources.
      In 2004-06, a severe two dry winter drought affected South East England during which
      it was necessary to implement a number of drought management actions; with
      groundwater sources in some cases reaching their lowest recorded water levels. In
      2006, we were the only water company to take the step of introducing both hosepipe
      and non-essential use restrictions. These demand restrictions were in addition to
      leakage reductions and implementing drought permits to abstract water from the River
      Eden outside our licensed winter period, with no significant adverse environmental
      impacts. During this drought, we communicated extensively with customers and other
      stakeholders, highlighting important information about water use and the water
      resources situation at the time. This suite of demand and supply side measures
      collectively contributed to the avoidance of the need to introduce emergency drought
      orders.
      More recently, another two dry winters have been experienced across our supply area.
      Following our Drought Plan, we implemented Phases 1 and 2 of its temporary use
      restrictions in April 2012. This was supported by extensive customer communication
      activities and liaison with regulators and other water companies in South East England,
      to facilitate a co-ordinated approach across the region particularly in respect of the
      implementation of temporary restrictions on water use. We were granted a drought
      permit to abstract water from the River Eden in May 2012. During this permit, we carried
      out an extensive monitoring regime to support future understanding of the potential

                                           Page 2
SES Water                                                     Draft Drought Plan - February 2018

      impacts of this drought permit. Lessons learnt and feedback from customers and
      stakeholders during these drought events where incorporated into the 2013 Drought
      Plan.
      In 2010, a change in legislation led to an expansion of the scope of the temporary water
      use restrictions water companies are able to apply without approval from the Secretary
      of State. Measures to restrict demand are taken seriously by the Company, we
      recognise the potential impacts on our customers; however, demand restrictions have
      been proven an effective means of conserving water supplies and avoiding more
      serious restrictions. Hosepipe bans have been estimated to save up 4% of average
      and 6% of peak demand. Building on experience and consideration of the benefits and
      impacts of restricting certain uses, we propose a phased approach, prioritising water
      saving measures subject to the severity of the drought conditions being experienced,
      the impact on customers, particularly small businesses, and reflecting regional drought
      impact and coordination of measures being implemented by water companies in South
      East England.
      In this revision of the plan, a larger suite of drought permit options is identified as being
      available. We have assessed the mitigation measures needed before and during a
      drought permit so that we minimise and monitor impacts on the environment. This
      means we are now more resilient to drought events more severe than that experienced
      in 2004-06. The plan has also been tested to a severe drought scenario, determined to
      be a frequency of once in every 200 years. This was found to be very challenging to
      manage with more reliance being placed on groundwater storage. We will seek to
      increase resilience to these severe droughts through our WRMP19 and subsequent
      plans.
      We are continuing to address metering, water efficiency and leakage, with an increase
      in demand management planned for the 2020-2025 period. We also operate a fully
      pressure managed network, which would allow phased pressure reduction measures
      to be implemented if a drought event were sufficiently serious to require it.
      The risk of drought continues to be serious and proactive measures, such as those
      taken in the 2004-06 and 2011/12 droughts ensured that supplies were maintained.
      We are committed to continual improvement of our Drought Plan to enable effective
      management any droughts in our supply area.

                                             Page 3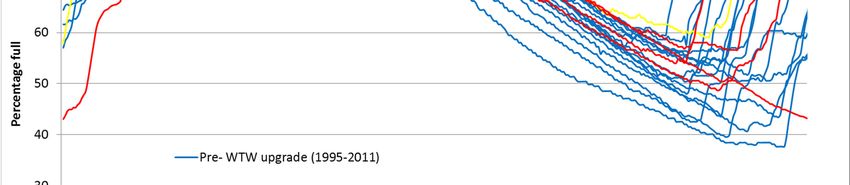
SES Water                                                  Draft Drought Plan - February 2018

1.     Introduction
       This document is a revision of our previous Drought Plan, published in March 2013. It
       sets out the how we will determine when a drought is triggered, how it will respond
       operationally, as well as the measures taken to mitigate the effects and monitor the
       impact of those actions, both during their implementation and afterwards.
       The Drought Plan is linked to the Water Resource Management Plan (WRMP) in that
       both plans have the objective of maintaining a secure and sustainable supply of water
       to customers. The overall aim is to avoid or minimise the impact of a drought on both
       its customers and the environment. In this revision of the Drought Plan, the company
       has considered a wider range of drought scenarios, including those that are at the
       extreme end of the spectrum. This is aligned with the approach being taken with the
       next WRMP, the draft of which was submitted to the Secretary of State in December
       2017.
       This Plan takes into account the guidance documentation issued by the Environment
       Agency (EA) and Defra, recently enacted legislation, and the experiences and lessons
       learnt by the Company and those shared across the Water Industry when managing
       droughts. This includes the 2011/12 drought that resulted in the use of temporary use
       restrictions and a drought permit to abstract from the River Eden. No further droughts
       have occurred since this period.
1.1.   Overview of process
       Water companies in England and Wales are required to prepare and maintain drought
       plans under Sections 39B and 39C of the Water Industry Act 1991, amended by the
       Water Act 2003, and clarified in the Drought Plan Direction 2011, amended in 2016.
       Water companies must prepare and submit an updated draft Plan to the Secretary of
       State no later than 4 years and 3 months after publication of their previous final Plan
       (s4(b)(ii) of the Drought Plan Direction 2016).
       This plan is compliant with the following document published by Defra and the EA:
       •    How to write and publish a drought plan – July 2015
       The following guidance documents issued from the EA have been considered within
       this plan:
       •    Environmental assessment in Water Company Drought Plans – May 2016
       •    Drought Plan and WRMP links – November 2016
       •    Drought Plan guideline extra information (drought permit and order application
            ready) – November 2016
       •    Drought options – November 2016
       •    Exceptional shortage of rain (position statement) – January 2017

1.2.   Water company specific information
       Sources
       We rely on groundwater for approximately 85% of our supply from sources located
       within the North Downs Unconfined Chalk, the North Downs Confined Chalk, the Mole
       Valley Chalk and the Lower Greensand aquifer resource units within our supply area.

                                           Page 4
SES Water Draft Drought Plan - February 2018
We have a single surface water source, Bough Beech reservoir, which provides
approximately 15% of its supply. It is a pumped storage reservoir, which abstracts water
from the River Eden during the winter period, normally September to April. The licence
permits abstraction from the river subject to certain conditions, including the
maintenance of a Minimum Residual Flow (MRF) of 22 Ml/d downstream of the
abstraction.
Winter rainfall is of greatest importance as this normally recharges the aquifers from
which the Company draws its supplies. Summer rainfall events are of limited benefit to
groundwater reserves apart from restricting the demands placed on them due to
reduced outdoor use and garden watering during these periods. Unless sustained over
a long period of time, summer rainfall is evaporated, transpired by plants or absorbed
in the soil and rock pore spaces above the water table and it therefore does not
recharge the aquifers.
Critical drought issues are associated with multi-season droughts rather than a single
dry season. A dry summer serves to increase demand, a condition that is considered
in detail as part of the WRMP. Multi-season droughts have the potential to restrict the
overall resource balance and this issue is reviewed within this Plan.
Demand
In previous plans, we have divided our network into two Water Resource Zones
(WRZs), Sutton WRZ and East Surrey WRZ. In preparation for this Plan, and the draft
WRMP19, we have completed a WRZ integrity assessment. Based on the level of
network connectivity between our Water Treatment Works (WTW), we consider it
appropriate to merge the two zones into one covering the whole Company area.
Support for this approach has been given by the Environment Agency. This aligns with
the focus we have placed on supplying customers from more than one WTW in order
to enhance resilience to drought and also other events including water quality outages,
flooding and bursts on strategic trunk mains.
We supply water to approximately 688,000 consumers in 288,000 properties. The
majority of demand, which was a total of 164 Ml/d in 2016/17, is from domestic
households. Due to various factors, this leads to a high peak effect, with domestic
demand increasing significantly during dry summer periods. Approximately 53% of
household properties and 87% of non-household properties within our supply area are
metered. We are continuing to address increased metering, demand management and
leakage.
1.3. Baseline water resources situation
We developed a Water Resources Management Plan (WRMP) which, following public
consultation, was approved by the EA and the Secretary of State for publication in June
2014 (WRMP14). We are in the process of updating this plan (WRMP19), a draft of
which was submitted to the Secretary of State in December 2017, and will subsequently
be made available for public consultation. The WRMP comprises an assessment of the
supply-demand balance given current stated levels of service (which relate to the
frequency of implementation of demand restrictions), together with a review of the
options available to manage the supply-demand balance, given environmental and
other constraints and projected impacts of climate change.
Page 5SES Water Draft Drought Plan - February 2018
WRMP14 defined the work to be carried out during the five year period commencing
April 2015 (known in the water industry as the AMP6 period) and beyond to 2039/40,
setting out a plan of how to meet the forecast demand for water for this period. The
WRMP14 proposes a twin-track of demand and supply side measures to manage the
supply-demand balance. WRMP19 will propose work to be done during the five-year
period commencing April 2020 (AMP7) but it is significantly more long-term, setting out
a plan through to 2080.
Our demand management programme as set out in WRMP14 for the AMP6 period
included installing a further 32,000 meters to previously unmeasured household
customers, a decrease in leakage of 500,000 litres a day, and a reduction in per capita
consumption to 157 litres per person per day. In our Draft WRMP19, we propose to
continue with an ambitious programme on demand management, with options to
reduce leakage, increase water efficiency programmes and the inclusion of a
compulsory metering programme, in particular in the first 10 years of the plan. Inclusion
of these measures is subject to customer support. When appropriate, additional effort
will be made to influence customers’ behaviour by encouraging them to use water
wisely during dry periods when resources are challenged.
On the supply-side, since the 2013 Drought Plan the peak capacity of Bough Beech
WTW has been increased by 7 Ml/d to 52 Ml/d. We will continue to actively manage its
surface water and groundwater sources to minimise the risk of supply failure, as well
as increase our resilience to outage and flooding. We propose to continue with our
network integration so that all properties can be supplied by more than one water
treatment works as part of our Business Plan for 2020-2025. We have also explored
options for potential bulk supplies with neighbouring companies through the Water
Resources in the South East process.
In WRMP14, two key design demand scenarios were considered, namely:
• Dry year average - representing the average year-round demand in an dry year
• Dry year critical period - representing the peak period demand in a dry year, usually
experienced during summer
These demand scenarios are based on an analysis of historic weather conditions
(temperature and rainfall, including recent drought events experienced in our supply
area) and responses to these droughts in terms of increases/decreases in demand
(distribution input, incorporating customer demand and leakage). This information has
been used to inform the definition of a dry year and the critical period for use in the
WRMP.
In the WRMP, these demands are balanced against groundwater and surface water
yields that would be available under a range of drought conditions. These are called
deployable outputs. As such, in our WRMP we already plan to be able to balance supply
and demand during a drought of such magnitude. However, in any particular drought
event, the actual supply-demand balance may not be exactly as that forecast in the
WRMP and the extent of the drought will not be known until it is over. In these instances,
we will consider implementing one or more drought management measures (including
demand restrictions). These will reflect our levels of service (described more fully in
section 2.4 below). The purpose of this Drought Plan is to mitigate risk of supply-
demand imbalance under more extreme but plausible droughts, to accommodate
Page 6SES Water Draft Drought Plan - February 2018
variations from the design conditions used in the WRMP, and to outline the actions we
would take in such circumstances.
We have a number of options to maintain the supply demand balance during a drought,
which include:
• To appeal to customers to reduce demand
• To introduce restrictions on demand to household and non-household customers
(Temporary Use Bans and Non-Essential Use Bans)
• To implement both long and short term measures to increase available supplies
(including Drought Permits)
• To utilise a bulk supply from a neighbouring water company
These will be discussed in further detail in Section 3 of the Plan.
1.4. Levels of service
Demand restrictions are one of the mechanisms water companies can use to help
manage the severity of a drought event. These restrictions can take different forms,
and their implementation will depend on the particular drought event. Companies plan
to be able to manage supply and demand only having recourse to demand restrictions
according to a certain return period. These return periods are termed ‘Levels of
Service’ and are effectively a standard of service we aim to provide to our customers.
Our levels of service are that sufficient resources will be available so that:
• A ban on the use of hosepipes and unattended watering devices (temporary
use restrictions) occurs no more than once every 10 years on average
• Implementation of a drought order to restrict the non-essential use of water
occurs no more than once every 20 years on average
• Emergency drought order measures (e.g. rota cuts, use of standpipes and phased
pressure management) will only be required in the most extreme droughts or
emergency situations
Demand restrictions are implemented on a precautionary basis as a management
response in preparation for a developing drought of unknown severity and therefore
their frequency will not necessarily reflect the magnitude of the ultimate drought event.
It is important to recognise that the level of service return period is not equivalent to the
drought severity return period. Having said this, demand restrictions would not
generally be expected during drought events with a return period of 1 in 10 years or
less, but this depends on how the drought is defined.
As detailed in Section 3, trigger curves related to groundwater and reservoir levels are
used to inform when it may be appropriate to implement demand restrictions. With a
changing climate, the frequency and magnitude of droughts will change and therefore
the trigger curves that currently define levels of service may be breached more
frequently in the future and will therefore need to be reviewed in order to maintain our
stated levels of service.
1.5. Pre-draft and draft consultation details
For this Drought Plan, we have carried out pre-consultation with the Environment
Agency (EA) since early in 2016. This has been in the form of quarterly review meetings
and, in relation to the draft Drought Plan, specific discussions particularly in reference
Page 7SES Water Draft Drought Plan - February 2018
to the drought scenarios, since the guidance has significantly changed since the 2013
Plan was submitted. The Agency requested further information on the selection of
droughts and whether using one WRZ would have an impact on the drought plan.
During the consultation process for the 2013 Drought Plan, representations were
received from nine organisations, with emphasis on environmental monitoring, testing
against more severe drought scenarios (i.e. a third dry winter) and the potential impacts
of temporary restrictions on water use. These representations were addressed in the
final version of that plan. However, for this plan, the scenarios used now include an
extreme drought of 1 in 200 years, instead of a third dry winter.
The Environmental Assessment Reports (EARs) within this plan includes outcomes
from the National Environment Programme (NEP) schemes (specifically the scheme
relating to the Carshalton Branch of the River Wandle) and the EA’s London Basin
Groundwater model.
We published our draft Drought Plan for public consultation in October 2017, with an
eight-week consultation period. We received feedback from six organisations. Our
Statement of Response to this feedback was submitted to Defra in February 2018. We
made amendments to the draft plan where we considered appropriate to address the
representations received.
1.6. Links with Water Resources Management Plan
Baseline supply availability within the WRMP is based on fixed value deployable
outputs for a range of drought conditions, without the inclusion of contributions from
drought measures. We have not deemed it necessary to include any drought measures
within the WRMP options appraisal to enhance resilience in terms of the system-
demand balance.
It should be noted that actual operational source outputs of groundwater sources will
vary with prevailing groundwater levels. It is therefore not possible to accurately
calculate the impact of demand restrictions upon water availability because the
operational source output reduces as the drought. Deployable output values are based
on annual groundwater level minima. Drought trigger curves are based upon level of
service return periods for Bough Beech reservoir and stochastically generated
groundwater level minima. Temporary use restrictions cannot be directly related to
drought severity as the need for restrictions will depend on the season and other
factors.
The Drought Plan and WRMP include drought scenarios that go beyond the historical
record, by looking at droughts of differing characteristics in terms of duration and
intensity. This required the use of stochastic weather data to generate the probability
of drought that could reasonably occur over the planning period. This is summarised
in Table 1.1.
Page 8SES Water Draft Drought Plan - February 2018
Table 1.1: Drought Scenarios
Example Example
Drought Plan in which
Drought Drought Duration
Scenarios scenario is used
Description Severity
Drought
WRMP
Plan
2004/5 or Worst on
Short Y Y
2012 record
Historic
Droughts 2004/6 or Plausible -
extended approx. 1 in Medium Y Y
2012 100 years
Additional Stochastic
Drought 1 in 200 Severe Drought Long Y Y
Scenarios years
2. Drought triggers and management actions
The actions to be taken can be divided into those related to decreasing demand,
including household and non-household use, leakage and operational use, and those
that increase supplies. In addition, there are operational changes that can be
implemented which can re-distribute resources in order to balance out areas where
supplies are at a higher risk. The resilience work we have undertaken during the current
and previous AMP period improves the transfer of water across our area of supply.
We are mindful of the need to balance measures between those that impact on
consumers and those which may impact negatively on the environment. Discussion of
the sequencing of restrictions is outlined in Section 2.7. Appendix A contains Drought
Options Tables summarising information on each drought management action in the
format required by the EA Drought Plan Guideline, such as the triggers, potential
increases in supply or reductions in demand and the environmental impact of the
proposed options.
2.1. Data sources and arrangements
We continually monitor and record groundwater levels, surface water levels and rainfall
within its supply area. Consequently, the risk of drought and its impact on both water
resources and our customers can be effectively assessed and that appropriate drought
measures can be implemented in good time to maintain supplies and meet Levels of
Service.
We monitor water levels at Bough Beech reservoir, whilst groundwater levels are
monitored at a number of observation boreholes (OBH), including Well House Inn and
the Rose & Crown. The Well House Inn OBH is maintained by the Environment Agency
with whom we have an arrangement to provide this data regularly.
Daily rainfall data is collected from 10 sites across the supply area, including at Bough
Beech WTW, Cheam WTW and the Redhill Head Office. For drought prediction
purposes, we have an arrangement with the EA for the provision of areal rainfall and
Page 9SES Water Draft Drought Plan - February 2018
potential evapotranspiration (PET) data for use with groundwater and surface water
models.
2.2. Drought triggers
In order to manage day-to-day water supply for the WRZ from groundwater and surface
water sources, we regularly monitor water levels in the following two locations:
• Well House Inn OBH;
• Bough Beech Reservoir.
The water level at Well House Inn OBH, located in the North Downs Chalk, provides a
groundwater level considered representative of our groundwater sources (both Chalk
and Lower Greensand). The water level at Bough Beech Reservoir, our only surface
water source, is used to calculate how full the reservoir is. Other OBH are used to
provide supplementary information, although the data is not collected as regularly.
At each of the two locations, trigger levels have been identified that when breached
help us to identify actions that need to be taken to ensure it can maintain its stated
levels of service (Section 2.4). The triggers also assist us to identify when it is in a
drought and when a drought is over. Trigger levels from groundwater and surface water
sources are considered in combination.
The drought trigger levels are intended to support our management decisions as part
of a framework for drought management. It is important to note that the trigger levels
act as guidance to required action but should be seen within the context of the time of
year, water level trends, and a range of other factors.
Well House Inn OBH
Our groundwater sources are located in both the Chalk and the Lower Greensand. The
Well House Inn OBH is located in the Chalk. In WRMP19, we have assessed the use
of an alternative borehole (Riverhead) to represent the Lower Greensand.
There are two observations boreholes which could be used to represent the water
resources in the Chalk, Well House Inn and Chipstead. To date Well House Inn OBH
has been used because it has a longer record, despite its atypical behaviour as water
levels decline. This issue has largely been overcome by developing a lumped
parameter model in which there are changes in storage characteristics based upon the
actual groundwater level. However, the Chipstead OBH record could be hindcast to
produce a long-term record and used in the future to develop an alternative a lumped
model well. For this plan Well House Inn is considered representative of both aquifers.
The charts of trigger levels have been produced by plotting the maximum or minimum
of the average monthly levels (see Figure 2.1).
The method for creating trigger levels in the Drought Plan 2013 used an assumption of
normally distributed data from Well House Inn. Within this plan, a revised method for
trigger levels has been employed which uses the stochastically generated data set for
15,000 years (75 years with 200 scenarios). The output from the lumped parameter
model has been ranked and levels equivalent to the 200, 50, 20, 4 and 2 year return
periods are presented as potential trigger levels. This has added another zone (Zone
4 with a less than 1 in 200 return period).
Page 10SES Water Draft Drought Plan - February 2018
Figure 2.1: Well House Inn Drought Trigger Curves
110
Zone 1 (1 in 4 to Median)
105
Zone 2 (1 in 20 to 1 in 4
ranked stochastic
distribution)
Zone 3a (1 in 50 to 1 in 20
Mean Monthly Groundwater Level (mOD)
100 ranked stochastic
distribution)
Zone 3b (1 in 200 to 1 in 50
ranked stochastic
95 distribution)
Zone 4 (less than 1 in 200
ranked stochastic
distribution)
90
EA Long-term maximum of
average monthly water
levels (1942-2016)
85
EA Long-term minimum of
average monthly water
levels (1942-2016)
80
EA Long-term mean of
Apr May Jun Jul Aug Sep Oct Nov Dec Jan Feb Mar average monthly water
levels (1942-2016)
Note: Data: EA, Oct 1942 to Dec 2016. Exclude Jul-Nov 1944.
Bough Beech Reservoir
Bough Beech is our only surface water resource. We have an agreement with Thames
Water for a bulk supply at Merton Pumping Station of up to 13.6 Ml/d although in recent
years the quantity available for transfer has been limited to approximately 7.5 Ml/d.
Page 11SES Water Draft Drought Plan - February 2018
However, Thames Water has confirmed that this bulk supply cannot be guaranteed
during a drought year and hence we do not include an allowance for bulk supplies from
neighbouring companies in its baseline water resource estimates.
The operating curves for Bough Beech reservoir as shown in Figure 2.2 are used as a
second set of trigger levels for the implementation of drought management measures
across our area. These surface water trigger levels are used in combination with the
groundwater trigger levels from Well House Inn OBH.
Figure 2.2: Bough Beech Reservoir Drought Trigger Curves
100
Normal operating curve
90 Zone 1 actions
80 Zone 2 actions
70
Zone 3a actions
60
Percentage full
Zone 3b actions
50
40
30
Emergency storage level
20
Dead storage level
10 (Minimum possible draw-off)
0
01-Apr 01-May 01-Jun 01-Jul 01-Aug 01-Sep 01-Oct 01-Nov 01-Dec 01-Jan 01-Feb 01-Mar
Month
Long term average (1996 to-date) Emergency storage level Dead storage level
Level 2 trigger curve Level 3a trigger curve Level 3b trigger curve
Figure reproduced from 2013 Drought Plan
The normal operating curve shown above is based on average observed storage levels
at Bough Beech reservoir between 1996 and 2010. The shape of the drought trigger
curves was derived from this average observed normal operating curve. The period
between 1996 and 2010 contained both wet and dry years and is therefore considered
representative of the average behaviour of the reservoir. A review of the average
observed normal operating curve was undertaken for this Drought Plan using data up
to 2016, and concluded that there was no change.
The level of the trigger curves was derived in conjunction with our Aquator model of the
Bough Beech reservoir system. The software Aquator is used to model the
performance of the Bough Beech reservoir system for use in water resources planning,
particularly the WRMP. The Level 3a and 3b trigger curves shown in Figure 5.3 are
incorporated in this model to allow an estimation the number of potential breaches that
may occur over a long period. Level 3a and 3b trigger curves were set to meet our
Levels of Service, consistent with a frequency of trigger curve breaches that may result
in instigation of temporary use restrictions no more than once in every 10 years on
Page 12SES Water Draft Drought Plan - February 2018
average (Level 3a), and non-essential use restrictions no more than once in every 20
years on average (Level 3b). In this way, this Plan is consistent with the ongoing update
of our WRMP.
The observed reservoir level record (from 1996) is not long enough to ensure trigger
curves are set at the appropriate level. Therefore, reservoir levels were simulated in
Aquator based on a modelled River Eden flow series, which was in turn developed from
historic rainfall and potential evapotranspiration (PET) records. The trigger curves
shown in Figure 2.2 were developed for the previous drought plan using 108 years of
data. To ensure that the trigger levels were still appropriate for use in this Drought Plan,
reservoir levels were simulated for an extended period of 99 years of daily flow data
(1918 to 2016). This confirmed that the triggers were set to ensure we continue to meet
our Levels of Service.
In 2011/12, we completed its first upgrade of the Bough Beech WTW, which enabled
the treatment of up to 45 Ml/d of water abstracted from Bough Beech to be put into
supply at peak periods. This is an increase from the previous peak capacity of 36 Ml/d.
In 2012/13, the capacity of the WTW was increased again as a result of Phase 2 of the
Company’s works at Bough Beech.
Since August 2012, the peak capacity of Bough Beech WTW of 52 Ml/d enables
abstraction and treatment of greater volumes of water from Bough Beech, with the
potential to drawdown water in the reservoir at a faster rate than previously. A review
of the storage levels between 2013 and 2016 was undertaken to ensure that there was
no change in the storage levels post-upgrade compared to pre-upgrade storage levels.
The review concluded that there was no significant change to the peak draw down rate
following completion of the works and it was therefore appropriate to continue using the
existing operating curves and trigger levels. This review is detailed further in Appendix
B.
It is recommended that the operating curve and trigger levels are reviewed following
any further significant changes to the WTW capacity, connectivity of Bough Beech
reservoir within the distribution network or capacity of Bough Beech reservoir, all of
which have the potential to affect the Deployable Output of Bough Beech reservoir.
2.3. Forecasting
Managing water resources continually requires consideration of existing supplies along
with future climate and its potential impacts on groundwater and surface water supplied.
For the majority of time, when winter rainfall has been sufficient to replenish
groundwater levels and Bough Beech Reservoir is full, no formal assessment is
required. However, if there has been insufficient rainfall over the winter recharge period,
groundwater levels are below average or there has been insufficient flow in the River
Eden to fill Bough Beech reservoir, a more detailed analysis of potential scenarios and
impacts is required.
In early 2017, following several months of below average rainfall over the winter of
2016/17, such an assessment of water resources for the remaining winter and spring
was required to help anticipate any impacts on operations in 2017. Three scenarios
were selected where rainfall between February and May 2017 was 100%, 80% and
60% of long-term average. Time series of rainfall and PET were run through
Page 13SES Water Draft Drought Plan - February 2018
groundwater and surface water models to identify the impact on groundwater
deployable outputs and reservoir levels. The outputs indicated that groundwater levels
were at risk of breaching trigger levels 3a and even possibly 3b at Well House Inn OBH
but that surface water levels in Bough Beech reservoir were predicted not to breach
either trigger level 3a or 3b. This exercise gave us advanced notice of possible issues
with groundwater resources in 2017.
2.4. Demand-side actions
The demand-side measures taken will depend on the timing and severity of a drought.
Since 2010, the legislation governing the powers available to water companies to
impose water use restrictions to manage demand has been amended.
The following demand management measures are discussed in this section:
• Customer awareness
• Leakage management & Operational Usage
• Temporary water use restrictions (Temporary Use Bans)
• Restrictions on uses of water through a Drought Order (Non-Essential Use Bans)
• Emergency Drought Orders including phased pressure reduction, rota cuts and
standpipes
In line with recommendations made in the EA Drought Plan Guideline and UKWIR
Code of Practice, we engaged in discussions with other water companies in South East
England regarding the potential for taking a joined-up approach to drought
management. The potential benefits of this are recognised, particularly in terms of
consistency of messages to customers regarding the need for water conservation and
introduction of a new scope of demand restrictions. While it has been recognised that
it is not feasible to implement identical drought plans due to the different circumstances
of individual companies, whenever practical we will align its approach to that of
neighbouring water companies.
Customer awareness
Communicating clearly with customers is one of the most important parts of the drought
management process. We recognises that to achieve the required savings during a
drought period it is essential that it gains the full co-operation and engagement of its
customers. Measures to manage demand would be combined with a proactive media
communications campaign to improve customer awareness of the situation and the
details of the actions being taken.
We will utilise different channels of communication including the website, social media,
leaflets with bills, electronic newsletters and printed magazines, as well as media
publicity on a regional level including radio and television. This will build on our existing
water efficiency and consumer education campaigns such as the schools education
programme, Every Drop Counts leaflet, water use calculator and free water-saving
packs.
Information disseminated will be accurate, up to date, transparent, clear and consistent.
Communication methods will be designed to encourage water saving behaviour and
communicate the need for, likely duration and frequency of demand management
measures, as well as the terms of any proposed concessions. Where possible,
Page 14SES Water Draft Drought Plan - February 2018
communications will be designed so that it is relevant and understandable to different
groups of consumers. We will seek assistance from its Customer Scrutiny Panel and
stakeholders including environmental groups and those representing vulnerable groups
to identify the best way to get the information to consumers.
An awareness raising programme normally suppresses peak demand, particularly
indiscriminate garden watering. Average demand is unlikely to be significantly affected.
In the event of a drought which is triggered in the winter period, whether single-season
or multiple-seasons, communications will be focussed on reducing leakage, through
the promotion of campaigns such as Wrap Up For Winter.
For non-households, communications will be directed to the Retailers operating in our
area of supply with the intention that they make their customers aware of the need to
be more water efficient. Specific messages will be directed to different sectors, with
support sought from the relevant organisations. For example, we will communicate with
the National Farmers Union to discuss measures that could be taken in agricultural
properties. Similarly, the Horticultural Trades Association has been partnering with the
water industry to produce an online Water Conservation Certificate which is targeted at
landscapers and those that maintain parklands and sports grounds. It is therefore a key
organisation that we will liaise with during a drought.
Leakage management, Pressure Control and Operational Usage
Our record on leakage is one of the best in the industry and it has consistently met its
performance targets. This has been achieved this by the implementation of a
comprehensive, telemetry linked District Metering system reaching approximately 97%
of properties, optimised pressure management throughout the network, the use of a
data analysis system to provide ‘real time’ estimation of leakage, and the
implementation of an industry leading performance-based leakage detection contract.
Our current target (for 2017/18) is 24.2 Ml/d. Due to our effective and proactive
approach to leakage management, it is not expected that leakage can be reduced
significantly during drought periods. Leakage is however an important issue to
customers and proactive reduction of leakage reinforces the message that water needs
to be conserved, particularly during periods of drought when wetland and river
ecosystems are likely to be under stress.
The options available to reduce demand from leakage and operational usage are:
• Increase resources on leakage detection
• Reduce leak repair ‘run times’ on company apparatus
• Increased focus on leak repairs of customers’ supply pipes
• Increase awareness of the need for customers to repair leaks on internal plumbing
systems
• Additional pressure management within District Metered Areas, to reduce leakage
and customer consumption
• Restrict mains flushing activities to essential operations only (for example as part
of the commissioning of a new water main)
• Restrict service reservoir cleaning operations to essential operations only (for
example due to a sample failure)
Page 15SES Water Draft Drought Plan - February 2018
During the drought year of 2006, we implemented increased active leakage control.
Higher than normal numbers of leak detection staff were employed and the response
time for repairing visible leaks was improved. We estimate that this initiative resulted in
a temporary reduction in total leakage of around 0.3 Ml/d and a record low end of year
leakage figure of 24.01 Ml/d. Our leakage reduction strategy will continue to be
reviewed in the event of the Zone 1 trigger levels being activated, in order to assess
the need for any further leakage reduction measures.
During 2016-2018 we carried out a programme of installing critical pressure point (CPP)
loggers at the extremities of each District Meter area. The pressure at the inlet to a
District Meter area can then be controlled based on the data from these CPP loggers.
This optimises pressure control so that service levels are met but leakage and usage
is minimised. During a drought period the scope for additional controls can be
investigated.
Estimated savings from and the scheduling of leakage, pressure management and
operational usage restrictions is detailed in
Page 16SES Water Draft Drought Plan - February 2018
Table 2.1 and Section 2.1.7 respectively.
Temporary use bans
The Flood and Water Management Act 2010 amended the Water Industry Act 1991 to
update the legislation on temporary use bans (TUBs). Supporting information,
definitions and exemptions for each water use activity covered by the legislation are
detailed by The Water Use (Temporary Bans) Order 2010.
These restrictions cover the outdoor use of water for household purposes. There are
11 categories of use, which we have divided into those implemented in Phase 1 and
those in Phases 2 & 3.
Phase 1:
• Watering a garden using a hosepipe
Phase 2 & 3:
• Cleaning a private motor-vehicle using a hosepipe
• Watering plants on domestic or other non-commercial premises using a hosepipe
• Cleaning a private leisure boat using a hosepipe
• Filling or maintaining a domestic swimming or paddling pool
• Drawing water, using a hosepipe, for domestic recreational use
• Filling or maintaining a domestic pond using a hosepipe
• Filling or maintaining an ornamental fountain
• Cleaning walls, or windows, of domestic premises using a hosepipe
• Cleaning paths or patios using a hosepipe
• Cleaning other artificial outdoor surfaces using a hosepipe
Further details on the exemptions and differentiation of Phase 2 and 3 restrictions, and
how their implementation is related to the Drought Triggers, is given in Section 2.7. It
should be noted that there may be circumstances where we may need to implement
one or more of these phases concurrently.
We recognise from its experiences throughout the 2004-06 and the 2011/12 droughts
the value of publicity around demand restrictions as a communication tool to convey to
consumers the need for reduced water usage.
Savings from Temporary Use Bans
Company specific data regarding water savings achieved by sprinkler and fuller
hosepipe bans was recorded during the implementation of demand restrictions
between 1996 and 2007. It was found that sprinkler bans produced savings at both
average and peak demand when accompanied by an intensive media campaign. A
saving of up to 1.5% at average and 3.5% at peak, i.e. June to September inclusive,
could be expected, based upon the difference between actual demand and that
expected based on the climatic conditions experienced in 2005/06.
However, as stated in UKWIR (2007a), “the magnitude of reduction in any year
depends on the demand that would have been expected in that year had restrictions
and other measures not been imposed”. Therefore, the savings in any particular
drought may not align exactly with those estimated in this Drought Plan, being
dependent on temperatures experienced in the drought year and also factors such as
Page 17SES Water Draft Drought Plan - February 2018
the degree of preceding media attention at a local, regional or national scale, outside
the Company’s own communications strategy.
The activity banned was primarily associated with garden watering by domestic
customers. As customer garden watering is recognised as one of the key drivers of a
summer increase in demand, restricting this activity is generally considered an
appropriate step to take when resources may be insufficient to meet the projected
summer peak.
It was found that the introduction of full hosepipe bans provided a further suppression
of demand, and a saving of up to 4% at average and up to 6% at peak could be
expected, inclusive of savings from sprinkler bans. These estimated savings are
summarised in
Page 18SES Water Draft Drought Plan - February 2018
Table 2.1
Page 19SES Water Draft Drought Plan - February 2018
Table 2.1: Summary of estimated savings from demand restrictions
While these figures may not be directly comparable to the activities defined by the
current legislation, they offer an indicative measure of the effectiveness of certain
restrictions and are taken into account in considering the appropriate phasing of
activities. This is discussed in more detail in Section 2.7.
No additional data on the effect of restrictions could be determined from the drought in
2011/12 since heavy rainfall occurred within days after the introduction of the hosepipe
ban in April 2012, with the ban lifted in July 2012.
Drought Orders (Non-Essential Use Bans)
The activities defined under The Water Use (Temporary Bans) Order 2010 as Drought
Orders are intended not to overlap with the activities covered by TUBs, and are
generally worded to apply to non-domestic purposes. There are 10 categories of use:
• Watering outdoor plants on commercial premises
• Filling or maintaining a non-domestic swimming or paddling pool
• Filling or maintaining a pond
• Operating a mechanical vehicle-washer
• Cleaning any vehicle, boat, aircraft or railway rolling stock
• Cleaning non-domestic premises
• Cleaning a window of a non-domestic building
• Cleaning industrial plant
• Suppressing dust
• Operating cisterns
Non-Essential Use Bans (NEUBs) have the potential to impact on businesses,
particularly those relating to window cleaning and vehicle cleaning. Therefore, the
Company would only apply for a drought order to restriction non-essential uses of water
after implementation of the full suite of temporary water use restrictions (TUBs). A
NEUB will be considered when the resource situation is such that we are uncertain of
achieving the normal deployable output (DO) of our sources.
We will implement any restrictions in a flexible, proportional and transparent manner
that considers all affected users. Partial exemptions may be granted from this ban in
an attempt to save water while minimising the economic and social impact. Further
detail on the sequencing and communication of NEUBs is given in Section 2.7.
Savings from Non-Essential Use Bans
It is estimated that an additional demand saving of approximately 8.5% could be
expected as a result of a full NEUB being implemented (UKWIR, 2007a), over and above
savings achieved by the temporary water use restrictions. This information was calculated as
part of the UKWIR (2007a) study that modelled the effects of demand restrictions during
droughts: SES Water specific data from the 2003-06 drought quoted in this study suggested
that a saving of between 10 and 17% at average and 20% at peak could be expected in the
past with the non-essential use ban, inclusive of hosepipe bans. These estimated savings
are summarised in
Page 20SES Water Draft Drought Plan - February 2018
Table 2.1 but as discussed earlier, should be taken as estimates only due to likely
variance in temperatures and therefore antecedent levels of demand.
Summary of Demand-Side Savings
The savings and area of implementation of the demand-side measures detailed in
Sections 2.4.1 to 2.4.6 are given in Table 2.1. Note that the cumulative savings are
calculated from the savings of each measure added to those previously implemented.
Further details are given in Appendix A.
Page 21SES Water Draft Drought Plan - February 2018
Table 2.1: Summary of estimated savings from demand restrictions
Cumulative Cumulative
Annual Average Peak Period
Restriction Annual Average Peak Period
Saving Saving
Saving Saving
Customer
0.2% 0.4% 0.2% 0.4%
Awareness
Leakage
0.2% 0.2% 0.4% 0.6%
Control
Pressure
0.1% 0.2% 0.5% 0.8%
Management
Operational
Usage 0.01% 0.01% 0.51% 0.81%
Restrictions
Temporary
Use Ban: 1.5% 3.5% 2.01% 4.31%
Phase 1
Temporary
Use Ban: 2.5% 2.5% 4.51% 6.81%
Phase 2 & 3
Non-
Essential 8.5% 13.5% 13.01% 20.31%
Use Ban
2.5. Supply-side actions and triggers
During a drought we have a number of supply side options that can be taken to maintain
the supply-demand balance. These are:
• Lowering of pumps and purchase of borehole licences to increase available
supplies
• Utilise a bulk supply from a neighbouring water company
• Preferential use of peak resources that are more resilient to drought, e.g. sources
abstracting from the Confined Chalk and Lower Greensand
• Use of existing transfers available within our supply network
• Conjunctive use of resources by transferring water from Bough Beech reservoir to
augment groundwater
• A drought permit on the River Eden to supplement the abstraction used to refill
Bough Beech reservoir
• Drought permits for additional abstraction from Hackbridge or G source group, the
Woodmansterne Group and the Kenley Group
The potential benefits of each of the above measures are considered below. Appendix
A contains Drought Options Tables summarising information on each drought
management action in the format required by the Environment Agency in its guidance,
“How to write and publish a drought plan” published July 2015 and updated April 2017,
which can be found at:
https://www.gov.uk/government/collections/how-to-write-and-publish-a-drought-plan.
Page 22You can also read