The condition of rural water and soil in the Waikato region - risks and opportunities
←
→
Page content transcription
If your browser does not render page correctly, please read the page content below
The condition of rural
water and soil in the
Waikato region
risks and opportunities

www.ew.govt.nz
1
Purpose of this publication
This publication summarises the current data from Environment Waikato’s water and soil monitoring activities
and presents trends and possible future scenarios based on these trends. Agriculture is a focus because of its
extent, environmental impact, importance to the region and dependence on continued availability of clean
water and healthy soil. Rural professionals, therefore, will have a particular interest in this document.
Responses from the agricultural sector toward meeting the emerging environmental challenges are included in
this publication.

Environment Waikato’s responsibilities
Environment Waikato is responsible for implementing parts of the Resource Management Act to meet its
purpose of sustainable management. This means ‘managing the use, development and protection of
natural and physical resources in a way, or at a rate, which enables people and communities to provide for
their social, economic, and cultural wellbeing and for their health and safety while:
• sustaining the potential of natural and physical resources to meet the needs of future generations
• safeguarding the life-supporting capacity of air, water, soil and ecosystems and
• avoiding, remedying, or mitigating any adverse effects of activities on the environment.

Under the Resource Management Act Environment Waikato is also required to:

                                                                                                                     The condition of rural water and soil in the Waikato region
• control the use of land for the purpose of maintenance and enhancement of the quality of water in water
  bodies and coastal water
• control discharges of contaminants into or onto land, air or water and discharges of water into water
• not permit an activity if it results in a change in water colour or clarity, water unsuitable for consumption by
  farm animals or significant adverse effects on aquatic life.

The Waikato Regional Policy Statement sets out Environment Waikato’s objectives. These include:
• a net reduction in the destabilisation of the banks of beds and rivers
• a net improvement in water quality across the region
• maintaining the versatility and productive capacity of the region’s soil resources
• the range of existing and foreseeable uses of the soil resource not reduced as a result of the contamination
   of soils.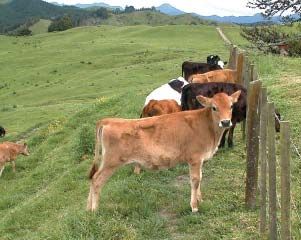
2
                                                              Contents
                                                              Executive summary                                           4

                                                              Introduction                                                5

                                                              What’s the state of our water?                              7
                                                              Trends in water quality indicators                          7
                                                              What is living in the water?                                10
                                                              Bacteria in water                                           12
                                                                 Why bacteria are a problem                               12
                                                                 Bacteria levels in Waikato surface waterways             12
                                                                 Bacteria in Waikato groundwater                          13
                                                                 Bacteria in coastal waters                               13
                                                              Sediment in water                                           14
                                                              Why sediment is a problem                                   14
The condition of rural water and soil in the Waikato region

                                                              Sediment levels in Waikato waterways                        14
                                                              Pesticides in water                                         16
                                                              Nutrients in water                                          16
                                                                 Why nutrients are a problem                              18
                                                                 Nutrient levels in Waikato surface waterways and lakes   19
                                                                 Nutrients levels in lakes                                20
                                                                 Nutrient levels in Waikato groundwater                   20
                                                                 Nutrient levels in coastal water                         23

                                                              What’s the state of our soil?                               24
                                                              Compaction                                                  24
                                                              Excessive soil fertility                                    25
                                                              Soil loss                                                   26
                                                              Soil contamination                                          26
                                                                 DDT                                                      26
                                                                 Cadmium and other contaminants in fertilisers            27
                                                                 Zinc                                                     28
                                                                 Copper                                                   28
                                                              Rural subdivision                                           28

                                                              Links to land type and land use                             29
                                                              Nutrients and land use                                      31
                                                              Trends in intensification                                   33
                                                                 Nitrogen fertiliser use                                  35
                                                                 Implications                                             36

                                                              It’s important                                              37
                                                              Economic value of farming                                   37
                                                              Need for healthy soil and water                             38
                                                              Value of the clean, green image                             38
                                                              Pressure for environmental performance                      38
3
What’s being done                                                     40
What Environment Waikato is doing                                     40
   Protecting Lake Taupo                                              40
   Nutrient management plans                                          40
   Other approaches                                                   41
What others are doing                                                 41
   The Sustainable Water Programme of Action                          42
   The Dairying and Clean Streams Accord                              42
   Dairy Industry Strategy for Sustainable Environmental Management   44
   Primary Sector Water Partnership                                   44
   Cadmium in soils                                                   45
   Research efforts                                                   45

Recommended practice on the farm                                      47
Nutrient management                                                   47
Nutrient budgets                                                      48
Nitrification inhibitors                                              48

                                                                           The condition of rural water and soil in the Waikato region
Fertiliser timing, rates and placement                                48
Feed and supplements                                                  49
Riparian fencing and planting                                         49
Seepage areas and wetlands                                            50
Fenced and grassed drains                                             50
Tracks and raceways                                                   51
Bridges and crossings                                                 51
Wintering strategies                                                  51
   Standing off                                                       51
   Grazing management                                                 52
Cropping practices                                                    52
Effluent irrigation                                                   53
Using soils to their best advantage                                   53
Finding out more                                                      55

Summary                                                               55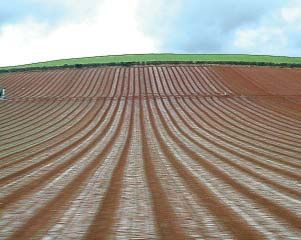
4
                                                              The condition of rural water and soil in the
                                                              Waikato region: risks and opportunities

                                                              Executive summary
                                                              Primary industry leaders, farmers and growers, researchers, rural professionals and the agencies that support
                                                              them are taking steps to improve the environmental performance of the agricultural sector. This is in
                                                              recognition of the increased need for attention to maintaining and enhancing soil and water resources in the
                                                              Waikato region. The need for clean water and healthy soil underpins profitable farming and healthy
                                                               ecosystems. The challenge that industry leaders are recognising is that of increasing profitability without
                                                              compromising environmental quality. This report draws together information from the Waikato region about
                                                              the condition of water and soil resources, providing a picture that clearly underlines the importance of these
                                                              industry efforts. Meeting this challenge will ensure a viable and profitable regional economy into the future.

                                                              Monitoring shows that important aspects of soil and water quality are deteriorating across the intensively
                                                              farmed areas of the region. In particular, nutrient concentrations in water are increasing. Sediment and faecal
                                                              levels remain high in a large number of waterways. There are also indications that soil compaction is a
The condition of rural water and soil in the Waikato region

                                                              common issue under intensive land use and that some contaminants are building up in soils in parts of the
                                                              region.

                                                              Nutrients from the land – the plant fertilisers nitrogen and phosphorus – are seeping into groundwater, flowing
                                                              to streams, rivers and lakes, and leading to increased nutrient concentrations in water. Consequently, many
                                                              of the regions waterways are showing deteriorating trends in water quality. This can ultimately result in lower
                                                              water clarity, choking weed growth, low oxygen levels and blooms of toxic algae in surface waterways.

                                                              Nitrate levels in groundwater do not meet drinking water guidelines in some areas, and further degradation
                                                              can be expected.

                                                              Monitoring of rivers and streams shows that levels of bacteria exceed the Australian and New Zealand guide-
                                                              lines for Fresh and Marine Water Quality 2000 in 75 per cent of sites, and are too high for people to swim
                                                              safely in 70 per cent of sites.

                                                              Trends in turbidity (murkiness mainly due to sediment in water) are showing some improvements over time.
                                                              Turbidity is low in upland parts of the region (Coromandel, Taupo and upland tributaries of the Waikato River).
                                                              However, in the lowland parts of the region more than half of the sites in Environment Waikato’s sampling
                                                              programme are classified as unsatisfactory.

                                                              Phosphate fertiliser contains cadmium and fluorine. Concentrations of cadmium and fluorine in Waikato’s
                                                              agricultural soils have been gradually increasing. In recent sampling, cadmium concentrations in topsoil were
                                                              found to exceed a recommended guideline in 11 per cent of properties sampled; fluorine concentrations on
                                                              some properties may be high enough to require management to prevent a future health risk to animals.

                                                              There are indications that soil structure may be deteriorating as a result of stock trampling and machinery use,
                                                              although seasonal variation can influence the trends shown by monitoring. In the most recent survey only a
                                                              quarter of our region’s dairy farming soils met national soil quality targets.

                                                              There are clear links between declining water and soil quality and the intensification of land use in the region.
                                                              Significant efforts will be needed to reverse the downward trends identified, and to sustain profitable farming
                                                              without compromising water and soil quality for present and future use. There are already many best
                                                              management practices identified that, if widely adopted, could reduce the environmental impacts of land use
                                                              without negatively impacting on the farm business. However, the emerging picture suggests that considerable
                                                              additional effort will be required by agencies and industry leaders to effectively address the issues.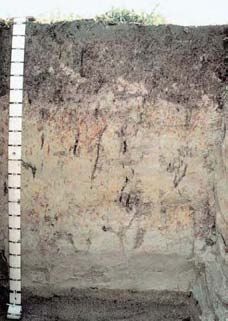
5
Introduction
High quality soil and healthy water underpin the
Waikato economy. Our farming industries depend on
productive soils and clean water. Our drinking water
is sourced from rivers and groundwater. People enjoy
boating, fishing, collecting seafood and swimming
in our lakes, rivers and coastal waters. Visitors are
attracted to our appealing environment, and consumers
are taking an increasing interest in the farm practices
used to produce their food. The well being of both our
own society and future generations ultimately depends
on keeping our soil and water in good condition.

Plants and animals also rely on these resources. Fish
and other aquatic life need clear water to survive in our
rivers, streams and lakes. Plants, including those that form the basis of our rural economy, depend on healthy
soil.

                                                                                                                                       The condition of rural water and soil in the Waikato region
However, in many parts of our region, the quality of our water and soil is getting worse as a direct result of
human activities. What we are doing on the land in the everyday course of earning a living is showing up as
changes in the water and soil. If not addressed, the situation could worsen to the point where many of our
streams and rivers can no longer be used for stock water, farm dairy use or swimming, and the soil will be
unfit for some land uses. Ultimately, because our rivers flow to the sea, our coasts are also affected by what we
do on the land.

There is no question that farming is the key to the economic future of the Waikato region – it is the livelihood
and vitality of the regional economy. However, increasingly there are signs that for farming itself to survive
into future decades, there will need to be some changes. We need to manage our land and water carefully to
sustain our economy and our environment.

People living in the Waikato region also have
expectations that the environment will be well
managed. Water quality is consistently the number one
environmental concern for people in the Waikato region
(see Figure 1). The proportion of people surveyed who
list water quality as their most important issue has risen
in recent years, from just over 25 per cent in 1998 to
nearly 43 per cent in 2006.

The trends in water and soil quality are reflected
nationally, especially where land use is intensifying. A
recent analysis of water quality data from around the
country found that the most common problem was
nutrient levels exceeding guidelines1. The dramatic
increase in fertiliser use and stocking intensity in recent
years has led to a greater focus on nutrient management, which is reflected in this document.

1
    Larned, S. et al. 2005. Nationwide and regional state and trends in river water quality 1996-2002. Ministry for the Environment,
    Wellington.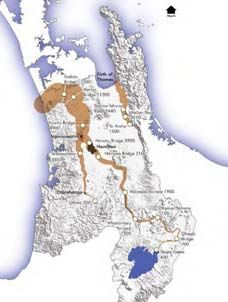
6
                                                                                                         Percent of respondants
                                                                                              0     10       20        30         40   50

                                                                           Water pollution

                                                                           Waste disposal

                                                                              Air pollution

                                                                         General pollution

                                                                                Transport

                                                              Preserve natural environment

                                                                                Pesticides

                                                                            Energy supply

                                                                         Natural hazards

                                                                            Town planning

                                                                        Plant/animal pests

                                                                     Gypsy Moth spraying

                                                                                    Other
The condition of rural water and soil in the Waikato region

                                                                               Don't know

                                                                                                  Most important issue 1998
                                                                                                  Most important issue 2000
                                                                                                  Most important issue 2003

                                                                                                  Most important issue 2006

                                                              Figure 1         Most important environmental issue for
                                                                               Waikato residents (1998, 2000, 2003 and
                                                                               2006 survey results)2

                                                              2
                                                                  Environment Waikato Environmental Awareness, Attitudes and Actions Surveys 1998, 2000, 2003 and 2006. Environment Waikato.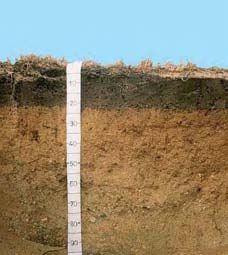
7
What’s the state of our water?
Water quality varies across the Waikato region. This is because of differences in land use, contour and
underlying rock type. Water quality is best in streams in the less developed, elevated parts of the region with
rock or sandy beds. For example, streams in forested Coromandel catchments and those feeding Lake Taupo
are clear and unpolluted. However, in the more developed lowland areas of the region, water quality is poorer
and streams often fail to meet water quality guidelines.

The risk of groundwater contamination depends on land use, soil type and underground rock and water
formations. Shallow groundwater in an area of high intensity land use with a free-draining soil type is most at
risk of contamination.

Trends in water quality indicators
Over time several indicators of water quality have been getting worse. Others are showing improvement
(see Figure 2). For example, water clarity has improved at many locations. Ammonia levels are also improving
and may be the result of increased use of land irrigation to treat dairy shed effluent rather than effluent ponds
and discharge to waterways. In particular, levels of nitrogen, phosphorus and conductivity have increased in
many rivers across the region (see Figure 3 for examples). This reflects nutrient losses from the overall increase
in stock numbers and farming intensity that has occurred in recent years.

                                                                                                                                               The condition of rural water and soil in the Waikato region
Data are being analysed by Environment Waikato for water quality trends from 1987 to 2007. Indications are
that both nitrogen and phosphorus concentrations in our rivers are increasing at an average rate of about 2
per cent a year.

Measuring water quality is complex. Many indicators                                            Percentage of measurements
are needed to satisfy the requirements for                                                0        25        50          75        100

maintaining or improving water quality for protecting                    Visual clarity
endangered species and human health, and
providing water of suitable quality for industry,                               E. coli

farming and drinking.                                                     Enterococci

                                                                            Ammonia
Visual clarity is a measure of how much a water
sample scatters/absorbs light. Visual clarity may be                     Temperature
affected by turbidity and/or dissolved colour.                               Turbidity

                                                                          Dissolved P
E coli are bacteria normally found in the lower
intestine of warm blooded animals. Most are         Dissolved oxygen
harmless, others produce vitamin K, and some are              Nitrate
harmful. E coli can live outside the body for short
periods and indicate contamination of waterways by Dissolved colour
animal waste.                                       Total phosphorus

                                                                        Total nitrogen
Enterococci are bacteria measured as an indicator
of human pathogens (disease causing organisms) in                                  pH
water.                                                                   Conductivity

Ammonia, a form of nitrogen, is produced from                                                 Improving      No change         Deteriorating

rotting animal and vegetative matter and is used as
                                                           Figure 2                 River water quality trends from rivers and
a measure of this activity in water. High levels will kill                          streams (100 sites in the Waikato region,
fish.                                                                               excluding the Waikato River, 1990–2002)3

3
    Vant, B. and Smith P., 2004. Trends in river water quality in the Waikato region 1987-2002. Environment Waikato Technical Report
    2004/02. These data are currently being updated.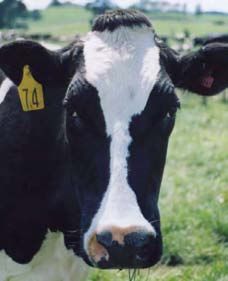
8
                                                              Temperature of waterways and lakes is a good indicator of biological activity and may be used to predict
                                                              outbreaks of unwanted organisms. High water temperatures can also kill sensitive aquatic life.

                                                              Turbidity is a measure of suspended particles in water and is a key measure of water quality. Particles in water
                                                              may carry unwanted nutrients (for example phosphate) and prevent sunlight UV radiation killing bacteria.

                                                              Dissolved P is a measure of the amount of inorganic phosphorus in a water sample after filtration (
9
Over time the Waikato River has shown improvements in water quality but now some of these improving
trends are beginning to worsen. From the 1970s, considerable work has been done to improve the quality of
effluent from industrial and urban sources. The 1970s saw major improvements to urban wastewater
treatment. The longest water quality record for the Waikato River (at Mercer) shows that this was when river
water quality began to improve. The high levels of contaminants evident in the early 1970s fell to levels 10
times lower during the late 1970s and early 1980s.
The 10 year water quality trend for the Waikato River between 1987 and 1996, showed that 22 per cent of
measures improved at individual sites and 7 per cent deteriorated. However, for the second 10 year period
(1997 to 2006), 9 per cent of water quality measures improved at individual sites but 17 per cent had
deteriorated (see Table 1). This deterioration was mainly from increasing nutrient. Amounts of total
phosphorus and nitrate in the water are increasing at many sites along the river.
Table 1 Water quality trends in the Waikato River between 1997 and 20065
Water quality trends in the Waikato River between 1997 and 2006.
Whakamaru
Improving trend
Waipapa
Narrows
Ohakuri
Horotiu
Ohaaki
Tuakau
Mercer
Huntly
Deteriorating trend
Taupo
The condition of rural water and soil in the Waikato region
– No change
Temperature – – – – – – – – –
pH – – – – – – – – – –
Dissolved oxygen
☺ ☺ – – – – – ☺ – –
Biochemical oxygen demand – – – – – – – – – –
Total ammonia – ☺ ☺ ☺– ☺ – – – –
Total phosphorus – – – –
Nitrate – – ☺
Chlorophyll a – – – – – – – – – –
Enterococci – – – ☺ – – – – –
Arsenic
Based on methodsin Environment
– – Waikato Technical–Report 2004/02
– – – –
The largest increases in nitrogen levels have occurred in streams with the most farmland in their catchments.
Nutrient levels are lower in streams with forested catchments (see Figure 4) and have changed little in recent
years.
5
Based on methods in Environment Waikato Technical Report 2004/02.10
10.00
Median total N, (g/m3)
1.00
0.10
0.01
0 25 50 75 100
Percentage of catchment in pasture
Figure 4 Median total nitrogen measured during
2000–2004 at 100 Waikato river and
stream sites versus proportion of each
catchment that is in pasture (note the
log scale)6
The condition of rural water and soil in the Waikato region
In the past, pollution control focused on factories, sewage treatment plants and dairy effluent ponds. These are
called ‘point sources’ because the pollution comes from a known single point (such as a pipe to the river from
a factory). Through environmental regulation and new technology, major reductions in pollution from these
sources have been achieved. For example, the amount of phosphorus entering the Waitoa River from a large
point source dropped 95 per cent in less than 10 years as a result of improvements in wastewater treatment.
Discharges of nitrogen from point sources to the Waikato River have decreased by 63 per cent over a similar
period of time.
However, it is estimated that over the last 10 years, nutrient loads from non-point sources have risen by about
the same amount that inputs from point sources have declined7. Non-point sources now contribute a greater
proportion of contamination to waterways.
What is living in the water?
Another way of telling how healthy streams and
rivers are is to survey the number and variety of
animals that live in them. Some types of animals
(such as the larvae of mayflies, stoneflies and
caddisflies) are much more sensitive to poor water
quality than other stream dwellers. The presence
and abundance of these insects indicates a healthy
stream.
Studies of fish living in Waikato streams show that
stream health is unsatisfactory at many locations
(see Figure 5).
The type of stream life is an
indicator of its water quality.
6
Vant, B. and Smith P., 2004. Trends in river water quality in the Waikato Region 1987-2002. Environment Waikato Technical Report
2004/02.
7
Vant and Davies-Colley, Evidence prepared for Environment Court, EcoLogic Foundation and Fish and Game Council vs Waikato
Regional Council.11
The condition of rural water and soil in the Waikato region
Figure 5 Predicted stream health for fish based on modelling and measurements.8
8
Based on Environment Waikato stream monitoring data 2007.12
Stream health is much poorer in streams flowing 100
through pasture, compared with those in native
forest (see Figure 6).
80
Percentage of sensitive animals
Good water quality is important for supporting
fisheries, including trout. Trout need clear, cool 60
waters with healthy insect populations. Some
species of whitebait are also affected by poor water
40
quality. The presence and abundance of native fish
and trout are used as a measure of water
quality, as are aquatic insects such as the 20
larval stages of mayflies, stoneflies and caddisflies.
Snails and worms are more common in degraded
0
streams.
Forest Pasture
Bacteria in water Figure 6 Percentage of sensitive stream animals
in forest streams, compared with
Disease-causing micro-organisms such as bacteria pasture streams9
which originate from human and animal waste are
The condition of rural water and soil in the Waikato region
present in many of our waterways. Human faecal
material can enter surface waterways, coastal water and
groundwater from malfunctioning sewage treatment
plants or septic tanks. Animal faeces can enter waterways
when stock are moving through streams, when rain
washes dung from the land into water, or from poorly
functioning dairy effluent ponds. Bacteria can also come
from birds (such as ducks) and animal pests (such as
possums).
Why bacteria are a problem
Bacteria from human and animal wastes pose a risk
to human health because they include organisms that
cause disease in humans. When present in high numbers
bacteria can make the water unsafe for contact recreation, food-gathering and the use of water for people or
stock to drink.
Bacteria levels in Waikato surface waterways
Testing of the Waikato region’s rivers and streams shows that levels of bacteria are too high for safe swimming
at nearly 70 per cent of sites sampled. In an even greater proportion of streams sampled (nearly 75 per cent)
levels exceed the Australian and New Zealand Guidelines for Fresh and Marine Water Quality 2000 (see
Figure 7).
Water quality for swimming is worst in lowland tributaries of the Waikato River (see Figure 8). It is also poor in
the lower Waipa, and in rivers along the west coast and Hauraki plains. However, on the Waikato River itself,
the water is suitable for swimming at nine out of the 10 monitoring sites.
Water quality for swimming is best in streams around Taupo and the upper Waikato River.
9
Collier, K. and Kelly, J., 2006. Patterns and trends in the ecological condition of Waikato streams based on the monitoring of aquatic
invertebrates from 1994 to 2005. Environment Waikato Technical Report 2006/04. Values are means + 1 standard error. ‘Forest’ sites
(25 sites monitored) have catchment entirely in native forest. ‘Pasture’ sites (29 sites monitored) have >95 per cent of upstream
catchment in pasture.13
Figure 7 Microbial contamination of waterways10 Figure 8 Bacteria levels in Waikato rivers and
streams: suitability for swimming11
800 Percentage of sites
Waterway specifically for contact recreation
0 25 50 75 100
Upper River
E.Coli (number/100 mls)
600 (Taupo Gates to Waipapa)
Taupo tributaries
400 Lower Waikato River
(Narrows to Tuakau)
Upland Waikato tributaries
200
Contact recreation standard Coromandel
Stock drinking water guideline Waipa and tributaries
0
1 4 7 10 13 16 19 22 25 28 31 34 37 40 43 46 49 52 55 58 61 64 67 70 73 76 Hauraki
Monitoring sites
West coast
Lowland Waikato tributaries
Excellent Satisfactory Unsatisfactory
Bacteria in Waikato groundwater
Despite the load of animal faeces deposited on agricultural land, microbial contamination of groundwater in
The condition of rural water and soil in the Waikato region
the Waikato region is not widespread. This is because sunlight kills these organisms on the soil surface and
long travel times through the soil filters them out before they reach groundwater.
There are exceptions, particularly for wells and bore-heads that are not sufficiently protected from
contamination at the surface. Where there is no protective concrete pad around the well, microbes in animal
waste can enter the groundwater directly via the bore shaft. Microbial contamination of groundwater can
also occur due to poor effluent irrigation practice, or where septic tanks are located in areas of shallow
groundwater.
Bacteria in coastal waters
Disease-causing organisms can enter our estuaries and coastal waters from the land. This contamination
can occur from leaking septic tanks, improperly functioning sewage treatment plants and toilets on boats. It
can also occur when run-off from farms enters the water. This can make beaches unsafe for swimming and
shellfish unsuitable for consumption.
Some shellfish farms around the Coromandel Peninsula are closed to harvesting after heavy rain because the
rain washes bacteria from the land into the sea.
10
Beard, S., 2008. Regional Rivers Water Quality Monitoring Programme: Data Report 2007 Environment Waikato Technical Report
2008/19.
11
Based on Environment Waikato Indicators for River Water Quality for Contact Recreation.14
Sediment in water
Sediment enters waterways when soil and other particles are washed off the land, or when unstable stream
banks slump into waterways. The amount of sediment in waterways depends on the soil type and slope, which
determine its potential to erode and travel to waterways. Land use also makes a big difference, as land that is
protected by mature trees has much lower rates of erosion. Major slips that occur during high rainfall events
contribute large ‘pulses’ of sediment to waterways. However, ‘background’ erosion from stream banks and
run-off from paddocks also contribute significantly to sediment levels in our waterways.
Why sediment is a problem
High levels of sediment result in high turbidity – a measure
of the murkiness of water. High turbidity blocks sunlight
from penetrating the water and can cause bed-dwelling
aquatic plants to die. It also makes it difficult for fish and
other animals to see their prey and there is evidence that
native fish migrating upstream from the sea will avoid
highly turbid streams12.
Sediment can be a particular problem in shallow lakes,
where wind effects constantly stir up the lake bottom,
The condition of rural water and soil in the Waikato region
making the water very murky. This has a compounding
The confluence of the Waikato and Waipa (on
effect since it prevents aquatic vegetation from growing on the right) rivers during flood.
the lake bed and stabilising the sediments.
Sedimentation also affects harbours and estuaries where it
can accumulate and accelerate the in-filling of bays. This
can smother shellfish and other marine organisms and
promote the growth of mangroves, which may impede
navigation.
Sediment levels in Waikato waterways
Trends for the region as a whole are showing some improvements over time. During 2000–2004 turbidity (a
measure of the murkiness caused mainly by sediment in water) was monitored at monthly intervals at 100 sites
in different parts of the region. In upland parts of the region (Coromandel, Taupo and upland tributaries of the
Waikato River) on average about 58 per cent of measurements were classified as excellent and only 15 per
cent of measurements were classified as unsatisfactory.
However, in the lowland parts of the region (areas below 300 metres above sea level) 56 per cent of
measurements were classified as unsatisfactory, and only 15 per cent of measurements were excellent13.
Figure 9 shows the variation in NTU levels (NTU; a measure of turbidity or cloudiness of a water sample) in
Waikato rivers and streams. Drinking water should not be more than 5 NTU, and should ideally be below 1
NTU. NTU levels of less than 25 have little effect on a fishery, while a NTU greater than 80 is unlikely to
support a good freshwater fishery.
12
Rowe, J., et al., 1999. Effects of suspended solids on native fish. NIWA Technical Report. NIWA, Hamilton.
13
Environment Waikato Indicator for River Water Quality.15
Figure 9 Turbidity in Waikato rivers14
The condition of rural water and soil in the Waikato region
14
Environment Waikato Regional River Monitoring Programme data.16
Pesticides in water
Pesticide levels are low in our surface waters but pesticides are sometimes detected in groundwater. Pesticides
are present in a small number of community water supplies at levels above drinking water guidelines (see
Figure 10). In most cases, groundwater contamination by pesticides is a result of historic use (such as sheep
dips). Groundwater can also be contaminated if concentrated pesticides are mixed near the bore-head or well
and spillages occur, allowing pesticides to flow directly into the groundwater.
Figure 10 Pesticide occurrence in monitoring wells in the Waikato region compared with maximum
allowable values (MAVs)15
Percentage of samples
0 25 50 75 100
Community
supplies
Regional
network
Nothing Low Excessive
detected (Maximum Allowable Value)
The condition of rural water and soil in the Waikato region
Nutrients in water
Nutrients in water originate from animal and human waste, soil, plant material and fertilisers.
The nutrients nitrogen and phosphorus enhance the growth of algae causing water quality to deteriorate in
parts of the Waikato region.
The two main problem nutrients (nitrogen and phosphorus) reach water in different ways. Phosphorus travels
attached to particles of soil or dung that wash off the land into streams (see Figure 11).
Nitrogen in the form of dissolved nitrate seeps through the soil to groundwater. This process is known as
leaching. Once in the groundwater, nitrate can move via underground flow into streams, rivers and lakes (see
Figure 12).
Figure 11 Phosphorus movement over the land Figure 12 Nitrogen movement through the land
Pasture P
(fertiliser, Pasture N
soil weathering) (fertiliser, clover)
Urine N
N lost from wet
and boggy areas
P in runoff
(attached to
dung and soil) N leached
from soil
N leached from
urine patches
er
ground wat ground wat
er
15
Environment Waikato Indicator for Pesticides in Groundwater.17
The majority of nitrogen entering water from grazed farmland comes from stock urine (see Figure 13). The
amount of nitrogen in urine patches is far more than plants can take up, so it is prone to leaching out of the
soil. By contrast, most of the nitrogen leached from cropping land is released from soil processes, fertiliser and
crop residues.
Figure 13 Sources of nitrogen loss on a typical dairy farm16
Fertiliser N
(direct) N from
5% applied
sources
5%
Dung and
natural
sources N
8%
Lanes
13%
The condition of rural water and soil in the Waikato region
Urine
69%
Not all nitrogen that has moved below the soil surface will necessarily enter rivers, lakes or streams. If water is
held for long enough in waterlogged soils, seeps or wetlands, bacteria convert the nitrogen into gases, which
then escape to the air rather than entering the water. This process protects water quality but in some conditions
there may be an impact on the atmosphere, as one of the gaseous forms of nitrogen released (nitrous oxide)
is a potent greenhouse gas.
Phosphorus enters waterways in several ways. One is attached to soil or dung washed from the land. Activities
that expose bare soil can contribute to phosphorus runoff during wet weather if the dirty runoff reaches
waterways. This can result from pugged areas, tracks and raceways or cultivated ground. Phosphorus can also
enter waterways from direct application of fertiliser, in effluent, sewage and industrial discharges.
16
AgResearch data (for a dairy farm producing 850 kg milksolids/ha; using 100 kg fertiliser N; effluent applied to land).18
Why nutrients are a problem
Just as they act as a fertiliser on the land, nutrients
promote plant growth in surface water, leading to an
over-abundance of algae, slimes and water weeds.
High levels of algae decrease water clarity, give the
water a green appearance and block up water filters.
Larger water weeds also block pumps and can choke
small waterways. When these water plants die, the dead
material is broken down by bacteria, which consume
large amounts of oxygen. This results in low oxygen levels
in the water that can kill fish and other stream life. Some
waterways are particularly sensitive to nutrient enrichment, Algae growing on rocks.
especially lakes where water spends sufficient time for
algae numbers to build up.
The Waikato region is home to some unique lakes,
including Lake Taupo with its high water clarity and the
peat lakes, a specialised ecosystem. These lakes are
The condition of rural water and soil in the Waikato region
threatened by rising levels of nutrients draining into them
from their catchments. The particular sensitivity of each
lake to higher nutrient inputs varies according to whether
existing nutrient levels are limiting algal growth.
In some circumstances, high nutrient levels trigger the
growth of toxic blue-green algae that are dangerous to
humans and animals. If high numbers of blue-green
An algal bloom on Lake Rotokauri.
algae are in the water, it is not safe for people or animals to
drink, or even make contact with the water. Major algal blooms
have occurred in the Waikato region on several recent occasions. In February 2005, an algal bloom was
linked with the deaths of nine cattle on a Waikato farm.
A Waikato farmer has lost nine cattle after they drank from a lake so contaminated by toxic algae that levels
were 760 times above animal drinking water standards.
The deaths have prompted public health warnings about algal blooms in several lakes in the region, and a
university professor has described Waikato lakes as some of the worst in the country.
NZ Herald, 23 February 2005
Health authorities yesterday warned the public off the river between Orakei Korako, north of Taupo, and Port
Waikato after detecting high levels of potentially toxic algae. People have been advised not to have contact
with untreated water or drink it even if it’s been boiled. Concerns over the quality of the untreated water
extend to livestock and animals. Farmers are being advised not to water stock from the river.
People have been advised not to have any contact with the river including swimming and water sports.
Waikato Times, 10 January 2003
Groundwater can also be affected by nutrients. Nitrogen on land can enter groundwater in the form of nitrate,
which is soluble and travels with rainwater through the soil. Preventing the loss of nitrogen from the soil is
important both for people and for natural ecosystems.19
In rural parts of the Waikato region, groundwater
supplies about half of people’s drinking water.
Groundwater is also used to water stock. Groundwater
nitrate can build up to levels that pose a threat to
people’s health. Many streams, lakes and wetlands are
also sustained by groundwater. In the Hamilton Basin,
up to 85 per cent of the typical flow in small streams
comes from groundwater17. Nitrate in groundwater
can be released into the wider environment as it slowly
seeps into streams and rivers, leading to higher nutrient
concentrations and algal growth.
Streams and rivers ultimately deliver nutrients to the
sea, where the ocean ecology can be disrupted by Harbours are also affected by what we do on the land.
nutrient enrichment. As in freshwater, nutrients in coastal
waters can increase the growth of algae. This is more
likely in partially enclosed water bodies such as Figure 14 Nitrogen loads (t/y) at various points
for the Waikato river and for the
estuaries, which are not as well flushed as the open sea.
combined rivers flowing into the Firth
Blooms of toxic algae can contaminate shellfish, making of Thames19
The condition of rural water and soil in the Waikato region
them unsuitable for gathering.
An over-abundance of algae in seawater decreases
visibility for animals that need to be able to see to locate
their food, making feeding more difficult. Algae also
reduce the amount of light reaching underwater plants
by reducing water clarity and by growing on seagrass
and seaweeds and intercepting the light they need to
survive.
Nutrient levels in Waikato surface waterways
and lakes
Levels of total nitrogen and phosphorus have increased
in many of the region’s rivers in the last 10–15 years.
Concentrations of total nitrogen in streams across the
Waikato region increased by an average of 1.3 per cent
every year between 1990 and 2002. Total phosphorus
also increased by an average of 1.3 per cent per year in
the same period18.
Total phosphorus and total nitrogen concentrations have
tended to increase at a higher rate in streams with more
agricultural land in their catchments, and nutrient
concentrations are higher in the lower reaches of rivers.
This can be seen in our largest river, the Waikato River (see Figure 14). The water leaving Lake Taupo is so
clear that, on average, an object can be seen 14 m away through the lake water. The water quality in the
upper section of the river is generally high. However, downstream conditions deteriorate. By the time the water
leaves Lake Ohakuri, some 75 km downstream from the outlet of Lake Taupo, it appears green and
somewhat murky. Clarity has dropped to 2.5 m. Colour and clarity continue to decline until, in the river’s last
50 km, the water is brownish and murky, and the average clarity is less than 1 m. This is due to a combination
17
Marshall, T., and Petch, R., 1985. A study of groundwater and surface water resources in the Hamilton Basin. Waikato Valley Authority.
18
Based on data in Vant, B. and Smith P., 2004. Trends in river water quality in the Waikato Region 1987-2002. Environment Waikato
Technical Report 2004/02.
19
Updated from Vant, B., 1999. Sources of the nitrogen and phosphorus in several major rivers in the Waikato Region. Environment
Waikato Technical Report 1999/10. These data are currently being updated.20
of sediment and algae in the water column. Algal growth is promoted by nutrient inputs along the river and
the slowing of water flow in the hydro lakes.
Nutrients levels in lakes
Environment Waikato monitors eight shallow lakes in the
region. All these lakes are highly to extremely nutrient
enriched and have poor water quality. Nutrient
enrichment results from runoff and leaching of
contaminants such as effluent, fertiliser and sediment
from land use in a lake’s catchment. Farmland now
surrounds most shallow lakes in the Region. The analysis
of the data available until 2001 showed that the water
quality of three of the shallow lakes had deteriorated,
while that of four others was unchanged. Since then two
lakes (Whangape and Waikare) have deteriorated
markedly. Hautapu school bore.
Nutrient levels in Waikato groundwater
Environment Waikato monitors groundwater at 110 wells around the region. The nitrate concentration in 16
The condition of rural water and soil in the Waikato region
per cent of these general-purpose wells do not meet the drinking water guideline. In two per cent of wells used
for community water supplies, levels do not meet drinking water guideline levels. Nitrate concentrations vary
with land use (Figure 15) and in different parts of the region (Figure 16). Shallow groundwater under free-
draining soils with high intensity land use is most at risk. However, where there are waterlogged areas (such as
the wet soils of the northern Hauraki plains), nitrogen is released by soil bacteria back to the atmosphere and
is less likely to reach groundwater.
Figure 15 Percentage of Waikato groundwater sites
under different land uses that have
excessive, elevated or low nitrate
levels.20
Percentage of samples
0 25 50 75 100
Dairy
Drystock
Horticulture
Urban
Less than half of the drinking water guideline
3
nitrate-N (11.3 g/m3)
20
Environment Waikato groundwater monitoring data.
21
Environment Waikato groundwater monitoring data.21
Figure 16 Nitrate concentrations at groundwater quality monitoring sites21
The condition of rural water and soil in the Waikato region22
Groundwater nitrate levels most commonly exceed the level considered safe for drinking in the Hamilton-
Mangaonua and Pukekohe areas. Up to 40 per cent of shallow groundwater in the Hamilton-Mangaonua
area is unsuitable for drinking. The principal land use in the Hamilton-Mangaouna area is intensive dairy
farming. In Pukekohe, the main land use is commercial vegetable growing.
Commercial vegetable growing is associated with the highest nitrate concentrations in groundwater. Figure 17
shows how nitrate concentrations in groundwater have increased over 10 years of monitoring in a vegetable
growing area near Matamata.
Other intensive land use such as dairy farming can also give rise to elevated nitrate levels (see Figure 18).
Figure 17 Groundwater nitrate concentrations Figure 18 An example of increasing groundwater
from a bore in a commercial vegetable nitrate levels in two shallow
growing area near Matamata22 groundwater bores at a Reporoa dairy
farm23
16 18
16
14
14
12
12 WHO Drinking water standard
Nitrate-N (g/m3)
Nitrate-N (ppm)
10
10
The condition of rural water and soil in the Waikato region
8
8
6
5
4
4
Bore 1
2 2 Bore 2
0 0
Jul-99
Oct-99
Jan-00
Apr-00
Jul-00
Jan-01
Apr-01
Apr-02
Jun Oct Mar Jul Dec Apr Sep Jan May
Oct-00
Jul-01
Oct-01
Jan-02
Jul-02
Oct-02
Jan-03
Apr-03
Jul-03
Oct-03
Jan-04
Apr-04
Jul-04
Oct-04
Jan-05
Apr-05
Jul-05
1994 1995 1997 1998 1999 2001 2002 2004 2005
Date
Date
It can take many years for the groundwater in which nitrogen is dissolved to travel through the land before
emerging in streams, rivers and lakes. In areas where groundwater moves slowly, the nutrient levels we see in
surface water today reflect the activities that took place decades ago. More nitrate has entered groundwater
as land use has intensified in recent years, but this has yet to reach our rivers, streams and lakes and may not
be seen for several decades. This means we can expect to see water quality worsen in some of our rivers and
lakes in the future, even if we make changes today.
22
Environment Waikato groundwater monitoring data.
23
Environment Waikato groundwater monitoring data.23
It can take years for groundwater to reach streams24
Water in the streams around Lake Taupo fell as rain on the surrounding hills between 30 and 80 years ago,
on average. Since then, it has been gradually seeping through the ground.
Farming started increasing around Lake Taupo in the 1950s. In the process of clearing the land, large
quantities of nitrogen were released. The effects of this are only now beginning to be seen in increased nitrate
levels in streams around the lake.
Sampling found that in some streams around Lake Taupo, water has moved very slowly through the ground
and into streams. In these streams, only 30-50 per cent of the water is young enough to show the effects of
increased pasture development in the last 45 years. The remaining water entering these streams is older, and
fell on the catchment before widespread development of farming. Nitrate levels in this water are low.
Other streams have a higher proportion of younger groundwater (70-100 per cent of the stream water is less
than 45 years old). Higher nitrate levels are found in this younger groundwater, as a result of recent changes
in farming. In these streams, nitrate levels have increased.
Nitrate levels in streams around Lake Taupo are predicted to rise in future as the contribution of water
showing the effects of more intensive farming grows. There is a range in predicted increases, from 30-40 per
The condition of rural water and soil in the Waikato region
cent above current levels. While the exact amount of increase to come is not certain, scientists agree that the
amount of nutrients entering the streams – and therefore the lake – will rise.
Nutrient levels in coastal water
In general, the region’s estuaries and harbours do not show excessive nutrient levels.
Blooms of toxic algae do occur in the sea around New Zealand. These are thought to be, at least in part, a
natural phenomenon in the oceans25. However, algal blooms could increase in future in enclosed bays and
estuaries of the Waikato region as a result of increased inputs of nitrogen from the land. A lack of nitrogen
limits the growth of algae in the sea. This is unlike many of the region’s freshwater bodies that are
phosphorus-limited (due to already high nitrogen levels).
Nitrogen inputs to the sea can be high:
• the equivalent of 97 truckloads of urea fertiliser enters the sea at Port Waikato every week
• the equivalent of 32 truckloads of urea fertiliser enters the Firth of Thames every week26.
NIWA has modelled the effects of increasing nitrogen inputs to the Firth of Thames. 50-70 per cent of the
mineral nitrogen in the Firth is from rivers. This modelling also shows that algal blooms are very likely to
occur around the mouth of the Waihou River and extend into the Firth of Thames by 5-10 km if there is a
five-fold increase in nitrogen reaching the Firth27. While this may seem a large rise in nitrogen, it should be
remembered that there is a lag in groundwater nitrate reaching rivers and then the sea. Therefore, current
levels of nitrogen reaching the sea do not yet reflect the large increases in nitrogen use of recent years.
24
Morgenstern, U., 2007. Lake Taupo Streams: Water Age Distribution, Fraction of Land Use Impacted Water, and Future Nitrogen Load.
Environment Waikato Technical Report 2007/26.
25
Chang H. and Mullan B., 2003. Occurrence of major harmful algal blooms in New Zealand: is there a link with climate variations?
The Climate Update, No. 53; Hauraki Gulf Forum 2005, The Hauraki Gulf State of the Environment Report.
26
Based on Vant, B., 1999. Sources of the nitrogen and phosphorus in several major rivers in the Waikato Region. Environment Waikato
Technical Report 1999/10.
27
Broekhuizen, N. and Zeldis, J., 2006. Forecasts of possible phytoplankton responses to elevated riverine nitrogen delivery into the
southern Firth of Thames. Environment Waikato Technical Report 2006/11.24
What’s the state of our soil?
The Waikato region has a wide range of soils, which include some of the most productive soils in New
Zealand. However even high quality soils can be degraded through some land use practices. Compaction (the
loss of spaces within the soil) and excessive fertility are the main soil quality issues in the intensively used areas
of the Waikato region. Soil loss through erosion is also of concern, especially in hill country. The build-up of
contaminants in soils has the potential to be a major issue in the future if current trends continue. Impacts of
increasing stock density and continued subdivision of productive rural land are also important issues.
National soil quality targets have been developed by the Ministry for the Environment28. Of the 133 sites
sampled in the Waikato region, only 34 per cent fully meet the national targets, with compaction and excessive
soil fertility being the most common problems. This figure varies between different land uses (see Table 2).
Table 2 Percentage of Waikato sampling sites under different land uses meeting all national soil quality
targets29
Land use Percentage of Waikato sites sampled that met all
national soil quality targets
Dairy 27
Sheep and beef 36
The condition of rural water and soil in the Waikato region
Plantation forest 44
Horticulture and cropping 54
Compaction
Excessive stocking pressure leads to trampling or
‘pugging’ of soil, breaking up the soil structure and
compressing spaces in the soil (compaction).
A similar effect can occur as a result of excessive
machinery traffic or cultivation of cropping soils.
Damage to the soil is worse when pressure occurs
during wet conditions, as this can cause major
changes to the soil surface and to the structure below
the ground30.
When a soil is compacted, water is no longer able to
easily pass through it. Instead it ponds on the soil
surface or runs off into waterways. This run-off can
contaminate streams and lakes with faeces, nutrients
and sediment.
An uncompacted topsoil on the left contrasts
with the compacted soil on the right.
Pugging and compaction also impact on farm income.
Pasture growth is reduced immediately as plants are
damaged and the area of bare ground increases31.
The effects continue into future seasons, as the lack
of air space in a compacted soil depresses productivity,
leading to lower fertiliser responses and lost production.
Sampling at 133 sites in the Waikato region found that compaction of dairy pastures in 2004 was worse than
when previously surveyed in 1998/9932. However, seasonal variation can have a marked influence on the
incidence and severity of pugging and compaction. Of the dairy farms surveyed in 2003 to 2007, 55 per cent
28
Sparling, G. et al., 2003. Provisional targets for soil quality indicators in New Zealand. Landcare Research.
29
Sparling G., 2005, Environmental indicators for land: overall soil quality in the Waikato Region 1998-2004. Environment Waikato
Technical Report 2005/47.
30
AgResearch, 2003. Managing treading damage on dairy and beef farms in New Zealand.
31
AgResearch, 2003. Managing treading damage on dairy and beef farms in New Zealand.
32
Sparling G., 2005, Environmental indicators for land: overall soil quality in the Waikato Region 1998-2004. Environment Waikato
Technical Report 2005/47.25
did not meet soil structure targets due to compaction. A third of sheep and beef farms and 10 per cent of
horticultural properties also showed evidence of compaction.
Excessive soil fertility
When more fertiliser is added than plants can take up, the excess can leach into groundwater, or wash off the
land when it rains, causing waterway pollution.
Soil samples from Waikato farms show that in some cases more phosphate fertiliser is being added than
plants can absorb. On dairy farms, many soil samples (44 to 50 per cent) from volcanic and sedimentary soils
show excessive phosphorus fertility. This increased markedly between 1996 and 2001 (see Figure 19). About
10 per cent of samples from sheep/beef farms have excess phosphorus fertility.
Environment Waikato’s own soil quality monitoring shows that about one quarter of pastoral soils have
excessive levels of phosphorus. Sampling of horticulture and cropping soils shows that about a third of
samples have excessive phosphorus fertility33.
Figure 19 Soil Olsen P levels for dairy farms34
The condition of rural water and soil in the Waikato region
Percentage of samples
0 25 50 75 100
Volcanic
1997 - 2001
Sedimentary
Volcanic
1988 - 1996
Sedimentary
Low Optimum High
Excessive
Excessive soil fertility comes at a cost to farmers.
• Close to $25 million worth of nitrogen is lost from soil on Waikato farms every year35. This equates to
$2912 per year for an average dairy farm and $3328 for a sheep and beef farm. While N loss per
hectare is lower on sheep and beef farms, total loss is similar due to the much larger size of these farms.
• Nearly $3 million worth of phosphorus is lost in run-off from Waikato farms every year. This equates to
$160 for each dairy farm and $954 for a sheep and beef farm.
• Nutrient budgets could save dairy farmers $6000 in fertiliser costs, on average, every year, without
decreasing productivity36. Some farmers have achieved much greater savings from nutrient budgeting, for
example $15,000 or even as high as $100,00037.
33
Sparling G., 2005, Environmental indicators for land: overall soil quality in the Waikato Region 1998-2004. Environment Waikato
Technical Report 2005/47.
34
Wheeler, D.M., 2004. Trends in Olsen P test over time for the Waikato region: Waikato Regional Council. Environment Waikato
Technical Report TR 2004/09.
35
Environment Waikato, 2004. Economic value of farm nutrient losses and nutrient excess for dairy and sheep and beef farms.
36
Edmeades, D., 2002. Nutrient budgeting: how, when, where and why? Report for Environment Waikato.
37
D. Edmeades, pers. comm.26
Soil loss
Bare or cultivated ground is at risk of topsoil erosion. A recent survey38 using aerial photography indicated that
region wide, bare soil is around 1.4 per cent of total land area, of which:
• soil freshly disturbed by land use is around 1 per cent of the region’s area – mostly either topsoil exposure
by livestock grazing in pasture, or disturbance by farm and forest tracks
• soil freshly disturbed by natural processes is around 0.4 per cent of the region’s area.
When soil is lost from productive areas, it takes valuable nutrients with it. The value of nutrients in Pukekohe
vegetable growing topsoils is estimated at $8000-$26,000 per hectare. Between 7 and 30 tonnes of topsoil
per hectare are lost every year through erosion. This represents losses of topsoil nutrients to the value of
$35-$570 per hectare per year39.
Soil erosion also disrupts farm and district infrastructure and increases the costs of maintenance activity, such
as clearing culverts and drains, and re-fencing eroded areas. Franklin District Council estimates that
damage to infrastructure (such as blocked drains) caused by soil loss from cultivated land costs the district
between $500,000 and $1 million every year to clean-up. Costs to Environment Waikato from the need to
frequently clean soil from drains are estimated at about $100,000 every year.
The condition of rural water and soil in the Waikato region
Soil contamination
Pesticides, animal remedies and residues from some fertilisers can contaminate soil. These can be present as a
result of historic and/or current activities.
Substances that do not naturally break down, or do so only slowly, are most likely to be detected in the soil.
Although these chemicals may be applied in small amounts, they will gradually build up in the soil and can
reach levels that are dangerous to the environment, or to people’s health. In the long-term, it is possible for
some contaminants to rise to levels that are so high that soil can no longer be used for growing crops, or
animals, or for people to live on.
DDT
In the past, highly persistent pesticides such as DDT were used to control plant and animal pests. DDT was
widely used on New Zealand pastoral land for the control of grass grub from the 1950s until the 1970s. DDT
can no longer be used but is still present in soil in many parts of the Waikato region. It takes about 30 years
for half the DDT in soil to break down and up to four times longer for it all to break down.
DDT in soil is a particular problem for the dairy industry because it is taken in by cows from the soil and then
passes into milk.
The New Zealand dairy industry will not accept milk from properties with high DDT levels. Prospective dairy
farmers are required to prove that DDT levels in the soil of proposed dairy conversion properties are low
enough to prevent DDT entering milk.
Although DDT has not been widely used for 30 years, analysis of Waikato farms in 2002 showed that levels
in soil were too high for dairy farming in over 40 per cent of samples submitted by landowners wishing to
convert land to dairy farms40.
38
Hicks, D., 2003. Soil intactness assessment of the Waikato Region. Environment Waikato Technical Report 2003/14.
39
Edmeades Consultants Ltd, 2002. The content and value of nutrients in the topsoils of Franklin District. Environment Waikato Internal
Series IS02/06.
40
Hill Laboratories data, 2002. Note, in May 2006 the Fonterra standard for DDT residue was raised from 0.2 to 0.7 mg/kg soil. Land
that was previously unsuitable for dairy conversion may now comply with the new standard.27
Cadmium and other contaminants in
fertilisers
Cadmium is present in phosphate fertilisers. It occurs
naturally in the rock deposits from which these fertilisers
are made. Cadmium does not break down, so levels in
the soil increase over time as more phosphate fertiliser is
applied.
Cadmium can be harmful to human health and can enter
the food chain by being taken up from the soil in crops
and by grazing animals.41
Since the use of phosphate fertilisers became widespread Vegetable growing can require high fertiliser inputs.
in the 1940s, concentrations of cadmium in Waikato’s agricultural soils have been gradually increasing (see
Figure 20). Environment Waikato’s recent sampling data, indicates that average concentrations of cadmium in
Waikato agricultural topsoils are now about five times higher than their natural levels. Eleven per cent of over
200 Waikato properties sampled exceeded a recommended cadmium guideline level of 1 mg/kg42, 43.
In the Waikato region, phosphate fertilisers are currently applied to approximately 53 per cent of Waikato’s
The condition of rural water and soil in the Waikato region
total land area (this includes sheep, beef and dairy farmland, arable cropping and horticultural land).
Cadmium accumulation rates are highest on dairy land and under some horticultural land uses, like potato
growing. Environment Waikato’s monitoring shows that at current loading rates the average cadmium
concentration in Waikato dairy soils would be at the guideline level in about 15 years time.
While not posing an immediate health threat, cadmium needs to be actively monitored and managed, with a
strategy developed to mitigate and manage the risks.
Fluorine is also present in phosphate fertilisers. Soil Figure 20 Cadmium accumulation in Waikato
monitoring data44 suggests that fluorine build-up agricultural soils45
is an emerging problem in the Waikato region’s
1.2
agricultural soils. The average concentration of
fluorine in Waikato soils is now about twice the A recommended guideline level
1.0
natural level. Recent research suggests that fluorine
on some properties is approaching levels where
0.8
Cadmium (mg/kg)
Current average
grazing and fertiliser management may be required concentration
to prevent a future risk to animal health.
0.6
0.4
0.2
Natural background
0.0
1900 1920 1940 1960 1980 2000 2020 2040
Year
41
U.S. Department of Health and Human Services, 2005. Report on Carcinogens, Eleventh Edition. Public Health Service, National
Toxicology Program.
42
New Zealand Water and Wastes Association (NZWWA), 2003. Guidelines for the Safe Application of Biosolids to Land in New Zealand.
43
UK DEFRA and EA (Department of Environment, Food and Rural Affairs and Environment Agency), 2002. Assessment of Risks to Human
Health from Land Contamination: An overview of the development of soil guideline values and related research. Report CLR 7. Bristol,
UK: Environment Agency. Selected in accordance with Ministry for the Environment, 2003. Contaminated Land Management Guidelines
No.2. Hierarchy and Application in New Zealand of Environmental Guideline Values.
44
Environment Waikato monitoring data.
45
Environment Waikato monitoring data.You can also read