Carbon and Water Footprints 04
←
→
Page content transcription
If your browser does not render page correctly, please read the page content below
SIDE PUBLICATIONS SERIES                                                              :04

                     Carbon and Water
                            Footprints
                           Concepts, Methodologies and Policy Responses

                                               A. Ertug Ercin and Arjen Y. Hoekstra

                                UNITED NATIONS WORLD WATER ASSESSMENT PROGRAMME
Published in 2012 by the United Nations Educational, Scientific and Cultural Organization
7, place de Fontenoy, 75352 Paris 07 SP, France

© UNESCO 2012
All rights reserved

ISBN 978-92-3-001095-9

The designations employed and the presentation of material throughout this publication do not imply the
expression of any opinion whatsoever on the part of UNESCO concerning the legal status of any country,
territory, city or area or of its authorities, or concerning the delimitation of its frontiers or boundaries.

The ideas and opinions expressed in this publication are those of the authors; they are not necessarily those
of UNESCO and do not commit the Organization.

Photographs: Cover: © Shutterstock / Eduard Stelmakh (left), © Shutterstock / E.G.Pors (centre),
© Fernando Weberich (right); p.1: © Shutterstock / yxm2008; p.3: © UN Photo / Guilherme Costa;
  p.5: © Shutterstock / SVLuma; p.8: © WFP / Susannah Nicol; p.11: © Shutterstock / Dudarev Mikhail;
  p.16: © Shutterstock / Steve Mann; p.18–19: © Shutterstock / pick.

Original concept (cover and layout design) of series: MH Design / Maro Haas

Layout: Phoenix Design Aid A/S

Printed by: UNESCO

Printed in France

 2    UNITED NATIONS WORLD WATER ASSESSMENT PROGRAMME
Summary
The objective of this study is to analyse the origins and characteristics of the carbon and water footprints in order
to understand their similarities and differences and to derive lessons on how society and business can adequately
build on the two concepts. We compare the two concepts from a methodological point of view and discuss response
mechanisms that have been developed, with the hope that experiences in one field might be able to benefit the other.

The carbon and water footprint concepts were introduced about a decade ago, simultaneously, but independently
from one another. The ‘carbon footprint’ concept has become popular over the past few years – since, more or
less, 2005 – and is currently widely accepted and used by the public and media despite its lack of scientifically
accepted and universally adopted guidelines: it describes greenhouse gas emission measurement from the narrow-
est to the widest sense. Several calculation methods and approaches for carbon footprint accounting have been
proposed and are being used. Since about 2008, ‘water footprint’ has also become a popular term. Although the
meaning and methodology of the water footprint were well defined in the scientific literature in the early stages
of its inception, there is still an immense potential for less rigorous usage of the term, similar to the fate of the
carbon footprint. The ambiguity around the concept of the carbon footprint could become a problem for the water
footprint concept in the near future. By drawing lessons from the history and progress of the carbon footprint and
understanding the development and mechanisms of carbon footprint assessment (both accounting and response for-
mulation), we can help reduce the risk that the water footprint will lose its strict definition, interpretation and usage.

In response to the increasing concern about climate change and global warming, governments, businesses and
consumers are considering ways to reduce greenhouse gas emissions. The two main response strategies are
reduction and offsetting. Reduction refers to undertaking activities in a less carbon-intensive way; offsetting
refers to taking external actions to compensate for carbon footprints by means of some form of carbon capture
or reduction elsewhere (by others). These strategies are applied and supported widely by business and govern-
ment. However, two issues seriously challenge the effective reduction of humanity’s carbon footprint. The first
is the absence of a unique definition of the carbon footprint, making reduction targets and statements about
carbon neutrality difficult to interpret, and leaving potential for developments to look better than they really are.
The second problem is that existing mechanisms for offsetting leave room for creating externalities and rebound
effects. In the case of the water footprint, the question of how to respond is still under debate, but it has been
recognized that reduction and offsetting strategies can be distinguished here too. The terms ‘water neutral’ and
‘offsetting’ have been considered. The strategy of water offsetting may face the same problem as in carbon offsett-
ing, but there is an additional problem: water footprints impact at specific locations and in specific periods of time,
and offsetting can only be effective if the offsetting efforts relate to them.

Carbon footprint accounting has been promoted by companies, non-governmental organizations and private initiatives
and has not been primarily driven by research. This situation has led to the concept having many definitions, methods
of calculation and response formulations. Some companies are responding rapidly to formulate schemes to tout their

                                                                                        SIDE PUBLICATIONS SERIES      1
carbon neutrality, but the response is often driven by the                   Global warming and reduction of greenhouse gas emis-
interest in brand and image – many businesses see benefits                    sions are at the top of the environmental policy agenda
in using the carbon footprint as a marketing tool rather than                today. However, the way in which the concept of the car-
as a tool to measure their contribution to climate change.                   bon footprint has been embraced and interpreted in all
Carbon accounting, labelling and meeting the require-                        possible directions and the fact that reduction schemes
ments of reduction or offsetting schemes tend to become                      are often ill-defined creates unnecessary additional chal-
goals in themselves rather than supportive instruments to                    lenges in effectively tackling environmental problems.
effectively mitigate climate change. Carbon offsets distract                 We argue in this study that the weakness of offsetting in
attention from the wider, systemic changes and collective                    the case of the carbon footprint shows that applying both
political action required to tackle climate change. These                    offsetting and neutrality in the water footprint cannot be
insights can be helpful in the search for effective instru-                  effective. A more effective tool may well be direct water
ments that can contribute to a more efficient, sustainable                    footprint reduction targets to be adopted by both govern-
and equitable use of the globe’s water resources.                            ment and business.

Table of Contents
    SUMMARY . . . . . . . . . . . . . . . . . . . . . . . . . . . . . . . . . . . . . . . . . . . . . . . . . . . . . . . . .1

    1 INTRODUCTION . . . . . . . . . . . . . . . . . . . . . . . . . . . . . . . . . . . . . . . . . . . . . . . . . . .3

    2 ORIGINS OF THE CARBON AND WATER FOOTPRINT CONCEPTS . . . . . . . . . . . . . . . .4
       2.1 The carbon footprint . . . . . . . . . . . . . . . . . . . . . . . . . . . . . . . . . . . . . . . . . . . . .4
       2.2 The water footprint . . . . . . . . . . . . . . . . . . . . . . . . . . . . . . . . . . . . . . . . . . . . . .6

    3 COMPARISON OF THE CARBON AND WATER FOOTPRINTS
      FROM A METHODOLOGICAL VIEWPOINT . . . . . . . . . . . . . . . . . . . . . . . . . . . . . . . . .6
       3.1 Environmental pressure indicators . . . . . . . . . . . . . . . . . . . . . . . . . . . . . . . . . . .7
       3.2 Units of measurement . . . . . . . . . . . . . . . . . . . . . . . . . . . . . . . . . . . . . . . . . . . .8
       3.3 Spatial and temporal dimensions . . . . . . . . . . . . . . . . . . . . . . . . . . . . . . . . . . . .8
       3.4 Footprint components . . . . . . . . . . . . . . . . . . . . . . . . . . . . . . . . . . . . . . . . . . . .8
       3.5 Entities for which the footprints can be calculated . . . . . . . . . . . . . . . . . . . . . . . .9
       3.6 Calculation methods . . . . . . . . . . . . . . . . . . . . . . . . . . . . . . . . . . . . . . . . . . . .9
       3.7 Scope . . . . . . . . . . . . . . . . . . . . . . . . . . . . . . . . . . . . . . . . . . . . . . . . . . . . . .12
       3.8 Sustainability of the carbon and water footprints . . . . . . . . . . . . . . . . . . . . . . . .12

    4 COMPARISON OF RESPONSES TO THE CARBON AND WATER FOOTPRINTS . . . . . . .12
       4.1 The need for reduction: Maximum sustainable footprint levels . . . . . . . . . . . . . .13
       4.2 Reduction of footprints by increasing carbon and water efficiency . . . . . . . . . . . .14
       4.3 Reduction of footprints by changing production and consumption patterns. . . . . .15
       4.4 Offsetting, neutrality and trading . . . . . . . . . . . . . . . . . . . . . . . . . . . . . . . . . . .15
       4.5 The interplay of actors . . . . . . . . . . . . . . . . . . . . . . . . . . . . . . . . . . . . . . . . . .16
       4.6 The water–energy nexus . . . . . . . . . . . . . . . . . . . . . . . . . . . . . . . . . . . . . . . . .17

    5 LESSONS TO LEARN . . . . . . . . . . . . . . . . . . . . . . . . . . . . . . . . . . . . . . . . . . . . . . .18

    6 CONCLUSION . . . . . . . . . . . . . . . . . . . . . . . . . . . . . . . . . . . . . . . . . . . . . . . . . . . .19

    REFERENCES . . . . . . . . . . . . . . . . . . . . . . . . . . . . . . . . . . . . . . . . . . . . . . . . . . . . .19
Section 1 z Introduction                                                                   Carbon and Water Footprints

1 Introduction                                                 sumption and water use and between global trade and
                                                               water resources management (Hoekstra, 2003). The
                                                               concept helps us understand the relationships between
                                                               production, consumption and trade patterns and water
The Earth’s climate is changing as a result of anthropogenic   use and the global dimension in good water governance
activity since the start of the industrial revolution. There   (Hoekstra, 2011).
is growing scientific evidence that burning fossil fuels
contributes to rising temperatures and extreme weather         The WF and CF concepts have similarities; however, their
events (Mitchell et al., 2006; Rosenzweig et al., 2001;        roots and intended purposes differ. The CF was formu-
Solomon et al., 2007). The public and decision-makers          lated to quantify the contribution of various activities to
have started to recognize the need for action to mitigate      climate change. The history of the WF lies in the explora-
global warming (Goodall, 2007). Governments, policy-           tion of water use along supply chains and in the search
makers and businesses have been urged to seek ways             for a tool to understand the global dimension of water as
to reduce greenhouse gas (GHG) emissions in response           a natural resource. Although each footprint has different
to growing interest and concern about climate change           roots and characteristics and addresses different research
over the past two decades (Bo et al., 2008; Brenton et         and policy questions, there is a tendency among practi-
al., 2009; Courchene and Allan, 2008; Matthews et al.,         tioners in the fields of environmental policy and corpo-
2008). This brings the need to understand what activi-         rate social responsibility to treat the WF in a similar way
ties drive GHG emissions and how they can be effectively       as the CF. For example, popular terms such as ‘carbon
reduced. The ‘carbon footprint’ (CF) concept has become        neutral’ and ‘carbon offsetting’ are immediately adapted
a popular tool to estimate GHG emissions related to            to ‘water neutral’ and ‘water offsetting’ without any par-
human activities (Moss et al., 2008; Wiedmann, 2009;           ticular attention to the appropriateness and applicability
Wiedmann and Minx, 2007).                                      of these ideas to water. Similarly, initiatives are taken to
                                                               develop water labels for products in analogy to carbon
Climate change has received a lot of attention at interna-     labels and to incorporate the WF into Life Cycle Assess-
tional forums among politicians and business leaders in        ment (LCA) for products in the same way as was done
the past decade. Freshwater scarcity has recently become       with the CF. Most notably, people have a tendency to
an important subject on the environmental agendas of           interpret the numbers of the WF without considering
governments and companies as well. Across the media,           their spatial and temporal characteristics as is commonly
decision-makers and the public, there is much talk of a        done in CF analysis. Each footprint needs to be seen
looming ‘water crisis’, which would have impacts on all        within its appropriate context and interpreted with care
sectors of the economy, but would primarily affect food        as it is built around different research questions and tells
security. Freshwater in sufficient quantity and of adequate     a different story.
quality is not only a prerequisite for human societies but
also for natural ecosystems (Costanza and Daly, 1992).         The objective of this study is to analyse the origins and
The unsustainable use of freshwater resources by humans        characteristics of the carbon and water footprints in order
is manifested all around the world in aquifers gradually       to understand their similarities and differences and to
becoming depleted, rivers running dry, and water quality       derive lessons on how society and business can adequately
deteriorating (Postel, 2000). Overexploitation of water        build on the two concepts. We compare the two concepts
resources for human activities affects societies but also      from a methodological point of view and discuss response
jeopardizes the health of ecosystems. Therefore, there         mechanisms that have been developed, with the hope
is a growing demand for new approaches and indicators          that experiences in one field might be able to benefit
in the field of water resources management that can             the other.
help find the main drivers of unsustainability and iden-
tify solutions towards sustainable water use, satisfying
increased demand for food, domestic water supply, and
goods and services, but protecting vital ecosystems.

Understanding the consequences of human appropria-
tion of freshwater resources requires an analysis of how
much water is needed for human use versus how much
is available, where and when (Hoekstra and Chapagain,
2008; Lopez-Gunn and Llamas, 2008). Uncovering
the link between consumption and water use is vital
to formulate better water governance. The term ‘water
footprint’ (WF) was primarily formulated in the research
context, to study the hidden links between human con-

                                                                                          SIDE PUBLICATIONS SERIES     3
Section 2 z Origins of the carbon and water footprint concepts
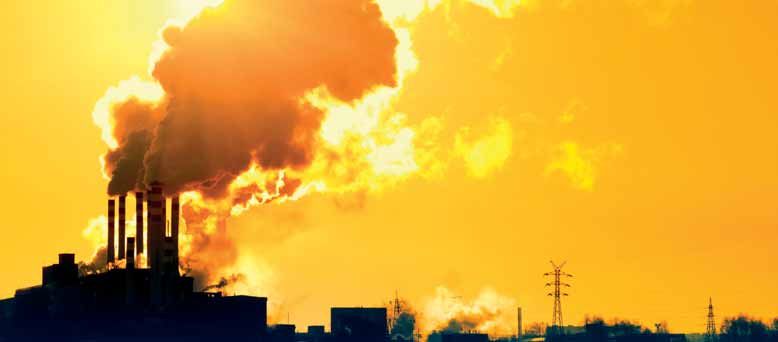
2 Origins of the and global warming. The increasing worldwide interest in
the causes and consequences of climate change, and in
carbon and water exploring ways to respond, resulted in the formation of
the Intergovernmental Panel on Climate Change (IPCC) in
footprint concepts 1988. The IPCC was the first worldwide effort to create
awareness of global warming and to feed scientific insights
on climate change to governments. The IPCC released its
first assessment report in 1990 (Houghton et al., 1990).
The carbon and water footprint concepts were introduced This report played an important role in the establishment
about a decade ago, simultaneously, but independently of the United Nations Framework Convention on Climate
from one another. The CF arose out of the debate on Change (UNFCCC), an international environmental treaty
climate change, as a tool to measure GHG emissions. with the goal of stabilizing GHG concentrations in the
The WF was introduced in the field of water resources atmosphere at a level that prevents dangerous anthro-
management, as a tool to measure water use in relation pogenic interference with the climate system. Efforts
to consumption patterns. In both cases, the terminology under the UNFCCC led to the Kyoto Protocol (UN, 1998),
chosen was inspired by the ecological footprint (EF), an international agreement to cut GHG emissions, with
which had been introduced in the 1990s (Rees, 1992). specific reduction targets by country, signed in December
All footprints measure, in different ways, human appro- 1997 and entered into force in 2005. The overall goal
priation of the planet’s natural resources and carrying was a collective reduction of GHG emissions by 5.2% in
capacity (Galli et al., 2012; Giljum et al., 2011; Hoekstra, 2012 compared to the emission levels of 1990.
2009) (Figure 1). The EF measures the use of bioproduc-
tive space in hectares; the WF measures the consump- To achieve its goal, the Kyoto Protocol installed a system
tion and contamination of freshwater resources in cubic for emissions trading and some mechanisms to allow for
metres per year; and the CF measures the emission of offsetting GHG emissions. The system of emissions trad-
gases that contribute to heating the planet in carbon ing (the ‘carbon market’) allows countries to sell unused
dioxide (CO2)-equivalents per unit of time or product. A emission permits to countries that are over their targets.
common property of all footprints is that they can be In addition to trade in emission permits (so-called
related to specific activities, products and consumption assigned amount units [AAUs]), the Kyoto Protocol also
patterns. Recently, the nitrogen footprint was introduced allows trade in credits that can be obtained through vari-
as a tool to measure the amount of nitrogen released into ous offsetting mechanisms:
the environment in relation to consumption (Leach et al.,
2012). In this report, we focus on the CF and WF. 1. Clean Development Mechanism (CDM): an industrial-
ized country with an emission-reduction or emission-
2.1 The carbon footprint limitation commitment can implement emission-
reduction projects in developing countries. In this
Concern about climate change started with the scientific way, the country earns saleable certified emission
recognition of the relationship between CO2 emissions reduction credits (CERs).
Figure 1
Footprint concepts
Carbon Footprint Water Footprint
Measures the emission of gases that Measures the consumption and
contribute to global warming contamination of freshwater resources
Activities, products and consumption patterns that affect
Earth’s natural resources and carrying capacity
Ecological Footprint Nitrogen Footprint
Measures the use of bio-productive space Measures the amount of nitrogen released into
the environment in relation to consumption
4 UNITED NATIONS WORLD WATER ASSESSMENT PROGRAMME
2. Joint Implementation (JI): an industrialized or in-      concept, expressed in terms of emitted CO2-equivalents
   transition country with an emission-reduction or         (East, 2008; Moss et al., 2008). It is not clear when
   emission-limitation commitment can earn emission         and by whom the term CF was used for the first time,
   reduction units (ERUs) from an emission-reduction        but it is found in newspaper articles as early as the year
   or emission-removal project in another industrialized    2000 (Biddle, 2000; Sorensen, 2000). According to
   country or a country in transition.                      Safire (2008), it was an enormous BP media campaign
                                                            in 2005 that gave a big boost to wider use of the con-
3. A mechanism that allows countries to earn removal
                                                            cept. By then, we can also see the term being used in
   units (RMUs) through projects that sequester CO2,
                                                            the scientific literature (e.g. Haefeli and Telnes, 2005).
   such as reforestation.
                                                            In the library of publications in the Web of Science, the
                                                            CF is mentioned for the first time in January 2007, in a
CERs, ERUs and RMUs are all expressed in CO2-equiv-         letter to Nature (Hammond, 2007).
alents and can all be traded on the carbon market and
counted by a country towards meeting its Kyoto target.      Despite its popularity and use in commerce, there is no
Parallel to the formal carbon market under the Kyoto        universally accepted definition of CF. Today it describes
Protocol, in which companies, governments and other         the narrowest to the widest interpretation of GHG emis-
entities buy emission rights or carbon offsets to comply    sion measurement (East, 2008; Finkbeiner, 2009; Pandey
with caps on the total amount of CO2 they are allowed       et al., 2011; Peters, 2010; Wiedmann and Minx, 2007).
to emit, another, voluntary, carbon market has grown,       Although the Kyoto Protocol does not use the term (the
in which individuals, companies and governments pur-        Protocol was conceived long before the CF), it would
chase carbon offsets to voluntarily mitigate their GHG      make some sense to be able to take this formal inter-
emissions. The CF is increasingly used as the stick by      national agreement as a reference for the definition of
which to measure the volume of GHG emissions related        the CF, because measuring GHG emissions is at the core
to specific activities or products.                          of the Protocol. However, the Kyoto Protocol is primarily
                                                            a political construct, not a scientific effort to define in a
The CF can be seen as an offspring of the EF concept,       comprehensive and systematic manner how to quantify
which was developed by Wackernagel and Rees (1996).         direct and indirect GHG emissions in relation to activi-
The EF, expressed in hectares, includes a component         ties, products and consumption patterns (for example,
that represents the area required to sequester enough       it has openings to discount certain emissions that intui-
carbon emissions to avoid an increase in atmospheric        tively should be counted).
CO2 (Wackernagel et al., 2002). In this sense, the EF
‘includes’ a carbon footprint (expressed in hectares).      The CF concept has been defined mainly by private
However, the focus on land requirement in the EF is         organizations and businesses (Kleiner, 2007; Wiedmann
not very helpful if the interest is not so much in land     and Minx, 2007). The scientific community jumped on
requirement but more directly in the volume of CO2 and      the train in 2007, after the concept had already started
other GHG emissions. Thus, in response to the interest of   to spread in business and commerce. The most extensive
governments and companies in GHG emissions and global       survey on the definition of the CF was done by Wiedmann
warming, the CF has become a modified, independent           and Minx (2007). Their research shows that the avail-

                                                                                      SIDE PUBLICATIONS SERIES      5
Section 3 z Comparison of the carbon and water footprints from a methodological viewpoint
able studies do not offer uniformity in the definitions and which was produced in a process of consultations with
methodology of the CF. They suggest the definition of CF organizations and researchers worldwide and subjected
is ‘a measure of the exclusive total amount of CO2 emis- to scientific peer review, has comprehensive definitions
sions that is directly and indirectly caused by an activ- and methods for WF accounting. It shows how WFs are
ity or is accumulated over the life stages of a product’. calculated for individual processes and products, as
Pandey et al. (2011) describe the CF as ‘the quantity of well as for consumers, nations and businesses. It also
GHGs expressed in terms of CO2-equivalent, emitted into includes methods for WF sustainability assessment and
the atmosphere by an individual, organization, process, a list of WF response options. As could be expected,
product, or event from within a specified boundary’. In the definitions and methods have been challenged
both cases, the definition does not allow for subtractions (Wichelns, 2011), but no alternative methodological
as a result of offsetting. In practice, however, companies framework has been developed (unlike in the case of the
tend to claim that carbon offsetting reduces their CF. CF). The WFN standard contains definitions of the WF,
Furthermore, in practice it is not always clear whether of process steps, products, producers and consumers, as
CFs communicated refer only to direct GHG emissions well as of the WF within a geographically delineated area.
or indirect ones as well – scientists generally define the The WF is, in general, an indicator of freshwater appro-
CF of a product as including both direct and indirect priation, measured in terms of water volumes consumed
emissions. Both in science and in practice, the term is (evaporated or incorporated into a product) and polluted
applied to different entities: single processes, whole sup- per unit of time. The WF concept is further defined more
ply chains (or all life-cycle stages) of products, individual specifically for a particular process or product, and for
consumers, populations, companies, industry sectors, any well-defined group of consumers (e.g. individual,
and all sorts of activities and organizations. family, village, city, province, state, nation) or producers
(e.g. public organization, private enterprise, economic
sector). From a producer and consumer perspective, the
2.2 The water footprint WF is an indicator of both their direct and their indirect
water use. The WF is a geographically and temporally
The WF concept is primarily rooted in the desire to illus- explicit indicator, showing not only volumes of water use
trate the hidden links between human consumption and and pollution, but also their locations.
water use and between global trade and water resources
management (Hoekstra and Chapagain, 2007, 2008).
The WF was developed as an analogy to the EF concept.
It was first introduced by Hoekstra in 2002 to provide
a consumption-based indicator of water use (Hoekstra,
2003). It is an indicator of freshwater use that shows 3 Comparison of the
direct and indirect water use of a producer or consumer.
The first assessment of national WFs was carried out by carbon and water
Hoekstra and Hung (2002). A more extended assessment
was done by Hoekstra and Chapagain (2007, 2008) and footprints from a
a third, even more detailed, assessment was done by
Hoekstra and Mekonnen (2012a). methodological
Unlike the CF, which emerged in practice, the WF was
born in science. The WF started to gain broad inter-
viewpoint
est from about 2008, the year in which the Water
Footprint Network (WFN) was established – a network The carbon and water footprint concepts complement
of academic institutions, governments, non-govern- each other, addressing different environmental issues:
mental organizations, companies, investors and climate change and freshwater scarcity. Although there
UN institutions. One of the aims of the Network are similarities in the way both footprints are defined
is to ensure the establishment of one common and calculated, they differ in important ways as well
language and a coherent and scientifically sound (Table 1). The location and timing within the year of
framework for Water Footprint Assessment (WFA) GHG emissions, for example, are not relevant, whereas
that serves different interests; for example, WFA for location and timing of water consumption and pollution
products and companies, but also national WFA. matter critically. It is important to understand the simi-
larities and differences between the two footprints for
In 2009, about seven years after the first use of the WF formulation of wise policy responses. This understanding
concept, the WFN published the first version of the global can help decision-makers recognize to what extent the
standard for WFA. Two years later the second version type of mitigation policies that have been formulated for
was published (Hoekstra et al., 2011). This standard, one footprint can be applied to the other.
6 UNITED NATIONS WORLD WATER ASSESSMENT PROGRAMMECarbon and Water Footprints
Table 1
Comparison of carbon and water footprints
CARBON FOOTPRINT (CF) WATER FOOTPRINT (WF)
WHAT IS MEASURED The anthropogenic emission of greenhouse The human appropriation of freshwater
gases (GHG). resources in terms of volumes of water
consumed and polluted.
UNIT OF Mass of carbon dioxide (CO2)-equivalents Water volume per unit of time or per unit
MEASUREMENT per unit of time or per unit of product. of product.
SPATIOTEMPORAL Timing within the year and place of WFs are specified in time and by location.
DIMENSION emissions are not specified. It does not It matters where and when a WF occurs;
matter where and when carbon emissions WF units are not interchangeable. For some
occur; carbon emission units are uses, total/average WFs are shown, thus
interchangeable. leaving out spatiotemporal specifications.
FOOTPRINT CF per type of GHG: CO2, CH4, N2O, HFC, Blue, green and grey WF. If added, the three
COMPONENTS PFC, and SF6. Emissions per type of gas are components are added without weighting.
weighted by their global warming potential
before adding.
ENTITIES FOR WHICH Processes, products, companies, industry Processes, products, companies, industry
THE FOOTPRINT CAN sectors, individual consumers, groups sectors, individual consumers, groups
BE CALCULATED of consumers, geographically delineated of consumers, geographically delineated
areas. areas.
CALCULATION Bottom-up approach: Bottom-up approach:
METHODS z For processes, products and small z For processes, products and businesses,
entities but also for sector, national and global
z The method of Life Cycle Assessment studies
(LCA) z The method of bottom-up accounting in
Top-down approach: Water Footprint Assessment (WFA)
z For sector, national and global studies z For products, the accounting along
z The method of Environmentally Extended supply chains in WFA is similar to the
Input-Output Analysis (EE-IOA) accounting in the Life Cycle Inventory
Hybrid approach: stage of LCA studies
z LCA and EE-IOA for products, nations, Top-down approach:
organizations z For sector, national and global studies
z The method of top-down accounting in
WFA, which is based on drawing national
virtual water trade balances
z The method of EE-IOA is used as an
alternative
SCOPE 1. Direct emissions Always includes direct and indirect WF.
2. Indirect emissions from electricity used
3. Other indirect emissions
SUSTAINABILITY OF Additional information is required to Additional information is required to assess
THE FOOTPRINT assess the sustainability of the CF. For the the sustainability of the WF. Per catchment
planet as a whole, a maximum allowable area, freshwater availability and waste
GHG concentration needs to be estimated, assimilation capacity need to be estimated,
which needs to be translated to a CF cap. which form a WF cap for the catchment.
For specific processes and products, CF For specific processes and products, WF
benchmarks can be used. benchmarks can be used.
3.1 Environmental pressure indicators into the environment, but they do not show the resulting
change in the environment. The CF, for instance, shows
Both the CF and the WF are ‘pressure indicators’ (Rotmans GHG emissions, not the resultant higher GHG concentra-
and De Vries, 1997; UNEP, 2012). Environmental tions in the atmosphere or the subsequent changes in
pressure indicators measure the human use of natural temperature, evaporation, precipitation or sea level. The
resources and the anthropogenic emission of compounds WF shows the human consumption and contamination of
SIDE PUBLICATIONS SERIES 7Section 3 z Comparison of the carbon and water footprints from a methodological viewpoint
on the standard followed and the scope and type of the
CF study. Although some studies suggest to include only
CO2 (Wiedmann and Minx, 2007), the common under-
standing and direction in CF calculations is to include
all six Kyoto Protocol gases (Pandey et al., 2011; Peters,
2010).
The WF is measured in terms of water volume (e.g. L
or m3) per unit of time (e.g. day, month, year). A product
WF is expressed as a water volume per unit of product.
The amount of product can be measured in various
ways; for example, in terms of mass, volume, number of
pieces, monetary value or energy content. Mekonnen and
Hoekstra (2012) quantify and compare, for instance, the
water footprint of various crop and animal products in
terms of L per kg, L per kcal, L per g of protein, and L per
g of fat content.
3.3 Spatial and temporal dimensions
freshwater resources, not the resultant changes in runoff When determining CFs, GHG emissions are usually
and water quality in rivers and aquifers. As pressure estimated with the help of emission factors. Emission
indicators, the CF and WF show neither resultant environ- factors are available for a wide range of processes (WRI
mental changes nor final impacts of those environmental and WBCSD, 2004). Most CF studies are based on global
changes on human beings (e.g. health) and ecosystems average data on emissions per unit of good or service.
(e.g. biodiversity), but they are still useful measures of However, national emission factors have also been intro-
pressure that humans put on the environment for policy- duced to reflect divergent local characteristics (Solomon
makers working to address overexploitation of natural et al., 2007). WFs provide spatiotemporally explicit
resources and the planet’s carrying capacity. Reduction information on how water is appropriated for various
strategies concerning CF and WF fit within policy aimed human purposes. In WF accounting, the approach is to
to mitigate the causes of environmental change and use local productivities (Mekonnen and Hoekstra, 2011,
subsequent societal and ecological impacts. CF reduc- 2012). Obviously, at the global level it does not matter
tion, for example, fits within a policy of climate change whether footprint analysis is carried out on the basis of
mitigation. For climate change adaptation, other measures local or global average productivities, because adding
and indicators would need to be used. Similarly, WF the results obtained with local data will yield the same
reduction suits a policy to lessen water scarcity and global result as an analysis based on global average data.
water quality deterioration. For coping with increased But on a national level, the result will differ when local
water scarcity and contaminated water, other measures productivities are used instead of global averages.
and indicators are better suited.
It does not matter where and when carbon emissions
occur; carbon emission units are therefore interchange-
3.2 Units of measurement able. This is fundamentally different for the WF: it mat-
ters where and when a WF occurs. WF units are therefore
The CF is expressed in mass units (e.g. kg or tonnes) per not interchangeable. This is particularly relevant in the
unit of time (generally per year). The CF of a product is discussion about offsetting. For example, the WF in one
expressed in mass units per unit of product. In cases catchment cannot be compensated for by offsetting
in which only CO2 is included in the calculation, the activities to reduce the WF in another catchment.
unit is kg CO2; if other GHGs are included, the unit is
kg CO2-equivalents (CO2-e). CO2-equivalents are calcu-
lated by multiplying the various GHG emissions by their 3.4 Footprint components
100-year global warming potential. In most cases, the
six GHGs identified by the Kyoto Protocol are included The CF comprises as many components as GHGs that
in the analysis: CO2, CH4, N2O, HFC, PFC and SF6. How- have been included in the analysis. The emissions per
ever, there is no common understanding and agreement type of gas are weighted by their global warming poten-
of which gases should be included in CF studies (East, tial. In contrast, the WF always consists of three com-
2008; Kleiner, 2007). The selection of gases depends ponents:
8 UNITED NATIONS WORLD WATER ASSESSMENT PROGRAMMECarbon and Water Footprints
z Blue WF: The consumption of ‘blue’ water resources (i.e. how can you explain that ‘my WF depends on your
(surface water and groundwater). WF’) and does not offer a proper incentive for companies
to reduce their WF – if companies would reduce their
z Green WF: The consumption of ‘green’ water resources
WF, they would reduce the WF of others as well. Unfor-
(rainwater stored in the soil as soil moisture).
tunately, the idea of weighting water volumes based on
z Grey WF: This refers to pollution and is defined as local water scarcity seems to be rather persistent in the
the volume of freshwater that is required to assimilate LCA community (Berger and Finkbeiner, 2010). The con-
the load of pollutants based on existing ambient water fusion is that some researchers in that community treat
quality standards (Hoekstra et al., 2011). the WF as an environmental impact indicator, while in
fact it is an environmental pressure indicator, measuring
‘Consumption’ refers to the loss of water from the avail- the intensity of resource use.
able ground–surface water body in a catchment area,
which happens when water evaporates, is incorporated
into a product, or is transported to another catchment 3.5 Entities for which the footprints
area or the sea. can be calculated
The WF is often presented as one aggregate number; in The CF and WF are similar in that the concepts can
that case, the three WF components are added without be applied to a wide variety of entities. In both cases,
weighting. It has been recognized that although this the basic building block is the footprint of a process.
approach may be sufficient for awareness raising, for the Based on the CF or WF of a process, the CF or WF of
purpose of policy formulation it is essential to clearly a product can be calculated by summing the CFs or
distinguish the three WF components. In its definitive WFs over the steps of its supply chain or life cycle. By
form, the WF is a multidimensional indicator of water summing the CFs or WFs of the products produced or
use, explicitly showing water consumption (green and consumed, the CF or WF of a company, an industrial
blue WF) and pollution (grey WF) as a function of space sector, an individual consumer, or a group of consumers
and time. can be assessed. The total CF or WF occurring within a
certain geographically delineated area (e.g. the territory
Some researchers from the LCA community have pro- of a country) is obtained by summing the CFs or WFs of
posed adding WF components after multiplying each the activities within that area. The WF concept has been
with a local weighting factor to account for differences applied to assess the WF of national consumption from
in local impact, thus obtaining ‘litres water-equivalent’ its inception on (Hoekstra and Hung, 2002), while the
(Pfister and Hellweg, 2009; Ridoutt and Pfister, 2010a; CF concept originally was applied to products and has
Ridoutt et al., 2009). By taking blue water scarcity in a only more recently been applied to national consumption
catchment as the weighting factor, a blue WF in a water- (Hertwich and Peters, 2009).
abundant catchment would count less than a similar
blue WF in a water-scarce area. This idea of weighting
was undoubtedly inspired by the weighting of different 3.6 Calculation methods
GHGs in CF calculations, but this approach is based on
a misunderstanding of the water scarcity issue. The WF Although the CF is widely used as a yardstick, there is
does not aim to reveal the local hydrological impact of little uniformity in its calculation methods. The main
water consumption; it aims to measure the use of fresh- differences are in:
water resources, which is helpful in determining how to
zthe scope of the study (indirect emissions are often
allocate water among competing demands. One litre of
excluded)
water used does not become more or less than one litre
according to the degree of water scarcity in a catchment. zthe gases included
Weighting the WF in two locations based on local water
zthe weighting of these gases to arrive at CO2-equiva-
scarcity is like weighting oil consumption in two loca-
lents
tions based on the scarcity of local oil reserves – it does
not make sense (Hoekstra et al., 2011). Furthermore, if zthe system boundaries chosen to determine how to
the WF of a product or company were to be calculated by truncate the analysis of emissions in the supply chain
multiplying consumed volumes by local water scarcity,
another problem arises: because water scarcity in a catch- There is also no unanimity on whether offsetting is valid
ment is defined as the total WF in the catchment divided as a way to reduce CF, and if so, how certain offsetting
by the water availability, the WF of a product produced activities can be counted.
in a certain catchment would increase (or decrease) if
other users in that catchment increased (or decreased) Alternative calculation methods and standards have
their WF. This way of measurement is counterintuitive been formulated by different organizations (Kenny and
SIDE PUBLICATIONS SERIES 9Section 3 z Comparison of the carbon and water footprints from a methodological viewpoint
Gray, 2009; Padgett et al., 2008; Pandey et al., 2011; transactions between different sectors in an economy.
Wiedmann and Minx, 2007). At the product level, CF A monetary input-output model can be extended with
standardization has been under discussion and several environment-related information for each sector, such as
organizations have published their own guidelines and its emissions and natural resource use, thus allowing for
standards. The Publicly Available Specifications 2050 EE-IOA. At the national level, EE-IOA is based only on
of the British Standards Institution was one of the first national input and output tables, which can bring sig-
standards describing calculation methods for product nificant errors into CF analysis (Minx et al., 2009). The
CFs – they were first published in 2008 and updated introduction of multi-regional input-output models has
three years later (BSI, 2011). This standard describes solved this problem. However, two major challenges
the calculation of GHG emissions of goods and services remain: (i) the relatively coarse schematization of the
based on the LCA approach. Other standards in wide use economy in input-output models (whereby economic
are the GHG Protocol of the World Resources Institute activities with rather different natural resource use and
(WRI) and the World Business Council for Sustainable emission intensities are part of one sector) and (ii) the
Development (WBCSD) (2004) and their recently pub- approximation of (often unknown) physical flows between
lished Product Life Cycle Accounting and Reporting sectors by the (known) inter-sector monetary flows (which
Standard (2011). The International Organization for ignores the fact that traded goods and services between
Standardization (ISO) is currently developing a product sectors are not homogeneous). National CF studies
CF standard known as ISO 14067 (ISO, 2012a). Other based on EE-IOA have been carried out, for example,
ISO standards related to the CF are ISO 14040 on Life for the United Kingdom (Druckman and Jackson, 2009;
Cycle Assessment (ISO, 2006a) and ISO 14064 on Wiedmann et al., 2010), Australia (Wood and Dey,
Greenhouse Gases (ISO, 2006b). The Japanese Indus- 2009), Japan (Nansai et al., 2009), Brazil (Machado
trial Standards Committee published a Basic Guideline et al., 2001), the United States of America (Weber and
of the Carbon Footprint of Products (JISC, 2009). Matthews, 2008) and China (Chen and Chen, 2010;
Zhao et al., 2009). Global assessments of national CFs
The three main approaches used to calculate CFs are the have been carried out by Hertwich and Peters (2009)
bottom-up, top-down and hybrid approaches (Matthews and Wilting and Vringer (2009).
et al., 2008; Peters, 2010; Wiedmann and Minx, 2007).
The bottom-up approach is based on LCA, a method The hybrid approach to CF accounting combines the
that estimates the environmental impact of products by specificity of process analysis (using LCA) with the
‘cradle to grave’ analysis. This method is mainly used system completeness of EE-IOA (Lenzen and Crawford,
for estimation of the CF of products and small entities 2009). This approach retains the detail and accuracy
(Finkbeiner, 2009; Peters, 2010; Schmidt, 2009; of the bottom-up approach (which is especially relevant
SETAC, 2008; Sinden, 2009; Weidema et al., 2008). in carbon-intensive sectors). In the hybrid approach,
There are numerous examples of this method being first- and second-order process data are collected for
applied to the CF calculation of specific products: the product or service and higher order requirements are
computers (O’Connell and Stutz, 2010), newspapers covered by input-output analysis (Wiedmann and Minx,
and magazines (Boguski, 2010), and animal products 2007).
(Edwards-Jones et al., 2009; Flysjö et al., 2011).
Although the bottom-up approach produces results with In WF accounting, there is only one standard: the Global
a relatively high level of precision, it is data-demanding Water Footprint Standard published by the WFN in 2009
and brings system boundary and truncation problems and revised in 2011 (Hoekstra et al., 2011). This stand-
(Wiedmann, 2009). ard covers comprehensive definitions and methods for
WFA. WFA has four stages: (i) setting goals and scope;
The top-down approach is used for calculating the CF (ii) accounting; (iii) assessing sustainability; and (iv) for-
of large entities such as sectors, countries and regions. mulating responses. The standard covers methods for
Environmentally Extended Input-Output Analysis (EE-IOA) the calculation of the WF of processes, products, com-
is the main method for top-down calculations (Minx et al., panies, consumers, and consumer groups (e.g. people
2009; Pandey et al., 2011; Wiedmann, 2009). Such of a nation), and also includes guidelines for sustain-
analysis makes use of an economic input-output model, ability assessment and response formulation. The WFs of
which represents the interdependencies between dif- single process steps form the basic building blocks of all
ferent sectors and final consumption in the national WF accounts. The WF of a product, for example, is the
economy or between the sectors in different national aggregate of the WFs of the relevant process steps. The
economies. An input-output model contains a matrix WF within a geographically delineated area is equal to the
that shows how the output of one industry is an input sum of the WFs of all processes taking place within that
to another. It also includes imports and exports and area (Hoekstra et al., 2011). According to the standard,
final consumption. Inputs and outputs are expressed in offsetting activities cannot be counted as WF reduction.
monetary terms: the model shows the value of economic Furthermore, the term WF can be used only to refer to
10 UNITED NATIONS WORLD WATER ASSESSMENT PROGRAMMEthe sum of direct and indirect WFs, so that no confusion of the country by the respective water needs for those
can arise as to the scope of the term. Companies can goods and services (Hoekstra and Mekonnen, 2012a).
refer to their direct (operational) WF, which excludes
their indirect (supply-chain) WF. The bottom-up approach is generic and precise and can
be applied for all WF calculations. However, it can be
The ISO has taken the initiative, under its Technical data-demanding, especially for large entities (as with the
Committee on Life Cycle Assessment, to develop a CF bottom-up approach). For the calculation of the WF
standard related to the WF: ISO 14046 (ISO, 2012b). of sectors, provinces, nations and regions, the top-down
By its position under the LCA committee, the scope will approach can be used as an alternative. This approach
be limited to processes and products and align to the is based on input data on WF per entity (e.g. sector,
LCA methodology as formulated in other ISO standards province, nation, river basin) and virtual water flows
in the LCA field. By focussing on procedural issues rather between these entities. The classic way in which the top-
than calculation methods, the standard will probably down approach has been applied is based on drawing
(and hopefully) not be in conflict with the Global Water virtual water balances of countries using trade data
Footprint Standard published by the WFN. and data on WFs of traded commodities (Hoekstra and
Chapagain, 2007, 2008). Alternatively, the EE-IOA is
There are two approaches for WFA: bottom-up and top- nowadays also applied for WF studies (Ewing et al., 2012).
down (Hoekstra et al., 2011). No hybrid approach has
been developed, although recently there has been an In the classic top-down approach, the WF of the people
initiative in this direction (Ewing et al., 2012). The living in a province, nation or river basin is calculated as
bottom-up approach can be used for all sorts of WF the total use of water resources in the area under consid-
accounts. When calculating the WF of products with the eration plus the gross virtual water import into the area
bottom-up approach, the accounting over supply chains minus the gross virtual water export. Virtual water import
is done in the same way as in a Life Cycle Inventory in is the volume of water used in other countries to make
LCA studies. There are product WF studies based on the goods and services imported to and consumed within the
bottom-up approach for a large variety of crop products country considered. Virtual water export is the volume
(Mekonnen and Hoekstra, 2011) and farm animal products of water used domestically for making export products
(Mekonnen and Hoekstra, 2012). More specific product which are consumed elsewhere (Hoekstra and Chapagain,
studies have been carried out for cotton (Chapagain et al., 2007, 2008). The bottom-up and top-down calculations
2006), coffee and tea (Chapagain and Hoekstra, 2007; theoretically result in the same figure, provided there
Jefferies et al., 2012), biofuels (Gerbens-Leenes et al., is no product stock change over a year. The advantage
2009), pizza and pasta (Aldaya and Hoekstra, 2010), of the bottom-up approach is its precision. However, as
wheat (Mekonnen and Hoekstra, 2010), soft drinks noted, it is data-intensive and depends on the quality
(Ercin et al., 2011), rice (Chapagain and Hoekstra, of consumption data. The top-down approach does not
2011), soy products (Ercin et al., 2012a) and margarine require consumption data, but it does require trade data
(Jefferies et al., 2012). The bottom-up approach can also and is therefore vulnerable to the quality of that data
be applied for the calculation of the WF of companies, (Van Oel et al., 2009). The top-down approach was used
sectors, nations and regions. The WF of the consumers in in all of the early national WF studies, but recent studies
a country, for example, can be calculated by multiplying tend to use the bottom-up approach (Hoekstra and
all the goods and services consumed by the inhabitants Mekonnen, 2012a; Ercin et al., 2012b).
SIDE PUBLICATIONS SERIES 11Section 4 z Comparison of responses to the carbon and water footprints
Input-output modelling has been used as an alterna- (Solomon et al., 2007). The sustainability of the WF
tive tool for top-down WF calculations for sectors and needs to be evaluated per river basin: the WF in a catch-
nations (Daniels et al., 2011; Duarte and Yang, 2011). ment needs to be seen relative to the maximum sustain-
It has been used mainly for national WF studies – China able WF in the area. This explains why it is relevant to
(Guan and Hubacek, 2007; Hubacek et al., 2009; know where the WF is located. The maximum sustainable
Zhang et al., 2011b; Zhao et al., 2009), Japan (Horie WF in a catchment depends on the runoff and environ-
et al., 2011), Spain (Cazcarro et al., 2011) and Mexico mental flow requirements in the area (Hoekstra et al.,
(López-Morales and Duchin, 2011) – but also for areas 2011, 2012; Ridoutt and Pfister, 2010b). The global
and cities – Andalusia (Velázquez, 2006; Dietzenbacher maximum sustainable WF is equal to the sum of the
and Velázquez, 2007), Beijing (Zhang et al., 2011a), local maximum sustainable WFs. In order to have a more
Zhangye City (Wang et al., 2009) and for the Yellow practical guide for assessing sustainability at the level of
River Basin (Feng et al., 2012). A global study with a individual processes and products, process- and product-
multi-regional input-output model was done by Feng et specific benchmarks for CF and WF can be developed
al. (2011), who compared the top-down approach with (Groenenberg and Blok, 2002; Zwart et al., 2010).
bottom-up techniques.
3.7 Scope
For corporate CF accounting, three scopes have been
defined (WRI and WBCSD, 2004): 4 Comparison of
zScope 1 refers to the accounting of direct GHG emis- responses to
sions, which occur from sources that are owned or
controlled by the company (e.g. the emissions from the carbon and
water footprints
combustion in owned or controlled boilers, furnaces,
vehicles).
zScope 2 refers to accounting of indirect GHG emis-
sions from the generation of purchased electricity
used by the company.
In response to the increasing concern about climate
zScope 3 refers to other indirect GHG emissions, which change, governments, businesses and consumers are
are a consequence of the activities of the company, but considering ways to decrease the CF of activities and
occur from sources not owned or controlled by it (e.g. products. The two main response strategies are reduc-
extraction and production of purchased materials, trans- tion and offsetting. Reduction refers to doing things in a
portation of purchased fuels) (Matthews et al., 2008). less carbon-intensive way – achieved through increasing
carbon efficiency by applying low-carbon technology,
The distinction between direct and indirect is also which has less GHG emission per unit of production – or
made in WF accounting. The total WF of a consumer or ceasing certain activities of production or consumption
producer refers, by definition, to the sum of the direct altogether. Offsetting refers to taking external actions to
(operational) and indirect (supply-chain) WFs of the con- compensate for a certain CF by means of some form of
sumer or producer. Without specification, the term WF carbon capture or reduction elsewhere by others. If the
refers to the sum of direct and indirect WFs. The distinc- CF of a certain activity is offset 100%, it is sometimes
tion between scopes 2 and 3 as applied in CF accounting claimed that the activity is ‘carbon neutral’. The concepts
is not useful in WF accounting. of carbon offsetting and neutrality are applied and sup-
ported widely by business, government and individual
consumers (Kollmuss et al., 2008; Moss et al., 2008;
3.8 Sustainability of the carbon Murray and Dey, 2009).
and water footprints
Whereas various CF reduction and offsetting mecha-
As indicators of pressure on the planet, the CF and WF nisms have already been developed and implemented,
by themselves tell little about impact. They need to be WF response mechanisms are still being explored. The
compared with the planet’s carrying capacity. The global broad public interest in the WF is more recent than
CF needs to be seen relative to the maximum sustain- the interest in the CF. It is not surprising that the same
able global CF (the ‘carbon cap’), which depends on the types of policy response that have been developed for
amount of GHGs that can be assimilated without causing the CF are now proposed for the WF, and there are
more than a certain maximum degree of global warming many analogous terms in the two fields: CF reduction
12 UNITED NATIONS WORLD WATER ASSESSMENT PROGRAMMECarbon and Water Footprints
vs WF reduction; carbon efficiency vs water efficiency; particular levels, such as 550, 450 or even 350 parts per
carbon offsetting vs water offsetting; carbon neutral vs million (p.p.m.) CO2-equivalents.
water neutral; carbon cap vs water footprint cap; carbon
permits vs water footprint permits; and carbon labelling Recently, several researchers have proposed an alterna-
vs water labelling. All of these concepts are new in the tive view, in which the mitigation challenge is framed as
field of water resources management except for ‘water that of putting a cap on total cumulative GHG emissions
efficiency’, which has been applied for decades – but since the start of the industrial revolution (Allen et al.,
even this takes on a new dimension: whereas it generally 2009; Matthews et al., 2009). This proposal is built on
referred to water productivity at field level or within a the insight that the total allowable emissions for climate
factory, a supply-chain perspective is now added. stabilization do not depend on the timing of those emis-
sions. It has been estimated that the peak warming
Cross-fertilization occurs when insights and concepts above pre-industrial temperatures would be limited to
from the sphere of climate change mitigation are trans- two degrees Celsius with a 50% probability of success
lated to the sphere of water. This can be fruitful, but also if cumulative CO2 emissions are capped at 1000 trillion
bears risks. Water is not the same as carbon, so it should tonnes of carbon, more than half of which already has
be questioned whether solutions for carbon can be cop- been emitted (Allen et al., 2009; Raupach, 2009). From
ied for water. Furthermore, not all ‘solutions’ that have this perspective, the maximum sustainable CF cannot
been developed for carbon appear to be effective, so they be formulated as a certain ceiling to the annual CF, but
should be critically evaluated before being applied else- should be seen as a maximum budget we can spend
where. Hoekstra (2008) notes that, undoubtedly, there between today and, say, the end of this century – which
will be a great market for water offsetting and water neu- means that the maximum CF should continually decline
trality, comparable to the market for carbon offsetting and and ultimately reach zero.
neutrality, but the extent to which this market will become
effective in contributing to a more efficient, sustain- But even before this new insight on the required cap to
able and equitable use of the globe’s water resources will humanity’s CF, there was already broad scientific consen-
depend on the rules of the market. Without agreed defini- sus that anthropogenic GHG emissions are currently far
tions and guidelines on what counts as water offsetting beyond the level required to achieve a maximum of two
and neutrality, the terms are most likely to end up as degrees Celsius global warming (Solomon et al., 2007).
catchwords for raising funds for charity projects in the Although the commitments made by governments in the
water sector rather than as effective means to achieve Kyoto Protocol to reduce national GHG emissions by
measurable overall WF reductions. certain percentages are not nearly sufficient in the view
of a two-degree target, the idea of setting a cap to GHG
emissions has been institutionalized, which is probably
4.1 The need for reduction: Maximum the biggest achievement of the Protocol. Future focus
sustainable footprint levels should be on sticking to that idea and further negotiating
the level of national caps (and even reducing caps over
There is a general acknowledgment that humanity’s time), and on the mechanisms to be installed to ensure
CF and WF have surpassed sustainable levels and that that caps are not exceeded.
society must make efforts to reduce them, but it appears
to be quite difficult to establish unambiguous and agreed In contrast, even the idea of a maximum sustainable WF
upon maximum sustainable levels for these footprints. has not yet been politically debated. As in the case of the
Knowing their ceilings is instrumental in formulating CF, it is not easy to define what the maximum sustainable
reduction strategies. The maximum sustainable level for WF of humanity is – and for the WF, another level of
the global anthropogenic CF depends on the maximum complexity is that the maximum sustainable global WF
allowable global temperature increase, which in turn is the sum of the maximum sustainable WFs in all the
depends on the societal and ecological impacts that river basins of the world. Furthermore, timing within the
are expected at different degrees of global warming. At year is a factor. As shown by Hoekstra et al. (2012),
the United Nations Climate Change Conference in unsustainable WFs become manifest during certain
Copenhagen in 2009, note was taken of the scientific periods of the year (generally when water availability
view that the increase in global temperature should be is relatively low while the WF is relatively large), so
below two degrees Celsius. If governments would sign up maximum sustainable WFs have to be established per
to such a target – which they did not do – there would catchment on a monthly rather than an annual basis.
be a basis for establishing a maximum concentration Little research has been done on assessing the maximum
of GHGs in the atmosphere, and then a maximum CF sustainable global WF. Ridoutt and Pfister (2010b) argue
in order to remain below this maximum concentration. that the global WF must be reduced by about half to
This in itself is not an easy task. The challenge has long reach a sustainable level of water utilization and they
been framed as one of stabilizing GHG concentrations at consider such a target realistic given the potential for
SIDE PUBLICATIONS SERIES 13You can also read