Assessing the potential for poverty reduction through investments in agricultural water management
←
→
Page content transcription
If your browser does not render page correctly, please read the page content below
Assessing the potential for poverty
reduction through investments
in agricultural water management
A methodology for countrY level analysis

Developed by
Guido Santini
Livia Peiser
Jean-Marc Faurès

FOOD AND AGRICULTURE ORGANIZATION OF THE UNITED NATIONS
Rome, 2012
The designations employed and the presentation of material in this
information product do not imply the expression of any opinion whatsoever
on the part of the Food and Agriculture Organization of the United Nations
(FAO) concerning the legal or development status of any country, territory, city
or area or of its authorities, or concerning the delimitation of its frontiers or
boundaries. The mention of specific companies or products of manufacturers,
whether or not these have been patented, does not imply that these have
been endorsed or recommended by FAO in preference to others of a similar
nature that are not mentioned.

The views expressed in this information product are those of the author(s) and
do not necessarily reflect the views of FAO.

ISBN 978-92-5-107345-2

All rights reserved. FAO encourages reproduction and dissemination of
material in this information product. Non-commercial uses will be authorized
free of charge, upon request. Reproduction for resale or other commercial
purposes, including educational purposes, may incur fees. Applications for
permission to reproduce or disseminate FAO copyright materials, and all
queries concerning rights and licences, should be addressed by e-mail to
copyright@fao.org or to the Chief, Publishing Policy and Support Branch,
Office of Knowledge Exchange, Research and Extension, FAO,
Viale delle Terme di Caracalla, 00153 Rome, Italy.

© FAO 2012
Assessing the potential for poverty reduction through investments in agricultural water management                                                                         iii

Contents
Abbreviations and acronyms..................................................................................................................................... 5
Acknowledgments..................................................................................................................................................... 6
Summary................................................................................................................................................................... 7
Introduction............................................................................................................................................................... 0
Scope of this report................................................................................................................................................... 1
Concepts and definitions........................................................................................................................................... 2
    The livelihoods perspective................................................................................................................................... 2
    Mapping rural livelihoods..................................................................................................................................... 3
Summary of methodology......................................................................................................................................... 7
Participatory consultations..................................................................................................................................... 10
Inception phase: building the data and information base..................................................................................... 10
    Literature review, identification of mapping criteria and data needed.............................................................. 10
    Data collection..................................................................................................................................................... 12
    Use of proxy data................................................................................................................................................. 13
Mapping and analytical process.............................................................................................................................. 16
    Participatory mapping process........................................................................................................................... 16
          Preparation of a national livelihood zones map........................................................................................... 16
          Preliminary identification of priority areas for AWM interventions and investments.................................. 19
          Preliminary identification of priority areas for AWM interventions and investments.................................. 19
    Processing and consolidation of workshop outputs: integrating quantitative and qualitative information...... 19
          Consolidation of the livelihood zone map..................................................................................................... 20
          Consolidation of the map legend.................................................................................................................. 24
          Development of the livelihood zone profile................................................................................................... 25
    Assessing the role of AWM to improve rural livelihoods.................................................................................... 25
          Mapping potential beneficiaries and opportunities for AWM interventions................................................. 25
          Development of an interactive computer tool for scenario analysis............................................................ 28
    Assessing suitability by type of AWM intervention............................................................................................. 30
          Mapping biophysical suitability by type of intervention................................................................................ 30
          Mapping livelihood-based demand............................................................................................................... 32
          Assessing potential: areas and beneficiaries............................................................................................... 33
          Hydrological constraint................................................................................................................................. 37
    Assessing the investment costs.......................................................................................................................... 40
    Validation process............................................................................................................................................... 40
          Participatory national validation workshop.................................................................................................. 41
          Subnational workshops................................................................................................................................. 42
Conclusions............................................................................................................................................................. 43
Glossary................................................................................................................................................................... 45
References............................................................................................................................................................... 48
Annexes................................................................................................................................................................... 50
   Annex 1 – mapping criteria for livelihood zones.................................................................................................. 50
   Annex 2 – Data used............................................................................................................................................. 52
   Annex 3 – AWM solutions described and analysed.............................................................................................. 58
   Annex 4 – Example of questionnaire on suitability criteria and conditions of specific AWM solutions.............. 60
   Annex 5 - List of biophysical suitability criteria and conditions of specific AWM solutions............................... 62
   Annex 6 – List of livelihood-based demand criteria and conditions of specific AWM solutions......................... 65
   Annex 7 – Investment costs: calculations and assumptions............................................................................... 72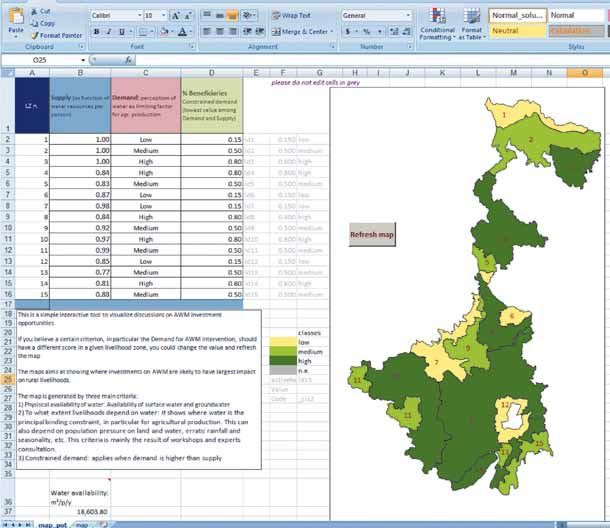
iv Assessing the potential for poverty reduction through investments in agricultural water management
List of figures
Figure 1 Rural livelihood determinants at different scales................................................................................... 4
Figure 2 Rural livelihoods determinants................................................................................................................ 7
Figure 3 Framework methodology......................................................................................................................... 9
Figure 4 Assessing shallow groundwater potential in ethiopia from soil and land cover data........................... 14
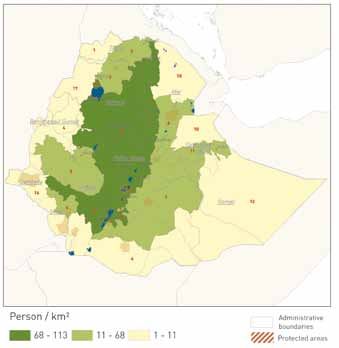
Figure 5 Rural poverty in Ethiopia........................................................................................................................ 15
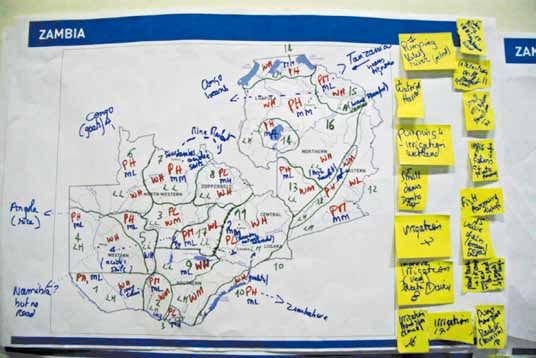
Figure 6 Output of participatory mapping in Zambia........................................................................................... 16
Figure 7 Workshop map processing: matching livelihood zones
with existing natural and administrative boundaries............................................................................ 21
Figure 8 Map of livelihood zones, Ethiopia........................................................................................................... 22
Figure 9 Percentage of population whose water requirements
could be fulfilled as a function of water resources................................................................................ 26
Figure 10 Potential beneficiaries of AWM interventions in Ethiopia...................................................................... 27
Figure 11 Screenshot of the excel-based interactive tool in West Bengal,
before users’ defined parameters are set............................................................................................. 29
Figure 12 Screenshot of the excel-based interactive tool in West Bengal,
after users’ defined parameters are set................................................................................................ 30
Figure 13 Map of biophysical suitability for small motor pumps in Ethiopia........................................................ 32
Figure 14 Livelihood-based demand for soil and water conservation measures in Tanzania.............................. 33
Figure 15 Burkina Faso impact of water scarcity; irrigation water consumption as percentage of IRWR........... 39
List of tables
Table 1 Sources of rural livelihoods associated with major production systems.................................................... 6
Table 2 Examples of livelihood determinants.......................................................................................................... 11
Table 3 Workshop map processing: using existing datasets to consolidate
attributes of livelihood zones....................................................................................................................... 22
Table 4 Attribute table for livelihood zones map of Ethiopia................................................................................... 24
Table 5 Potential beneficiaries of AWM interventions in Ethiopia.......................................................................... 28
Table 6 Biophysical suitability criteria for motor pumps and small reservoirs in Ethiopia................................... 31
Table 7 Average household size by country............................................................................................................. 34
Table 8 AWM solutions land application coefficients.............................................................................................. 35
Table 9 Potential beneficiaries of AWM solutions in Madhya Pradesh (India)....................................................... 36
Table 10 Potential application area for AWM solutions in Madhya Pradesh (India)................................................. 37
Table 11 Example of calculation of hydrological constraint by livelihood zone........................................................ 37
Table 12 Example of validation workshop form: suitability domains for river diversion schemes – Zambia........ 42
Table 13 Example of validation workshop form: suitability domains for low-cost motor pumps – Zambia.......... 42
List of boxes
Box1 A rural population typology.................................................................................................................... 17
Box2 Assessing the livelihood-based demand rate: example for motor pumps........................................... 32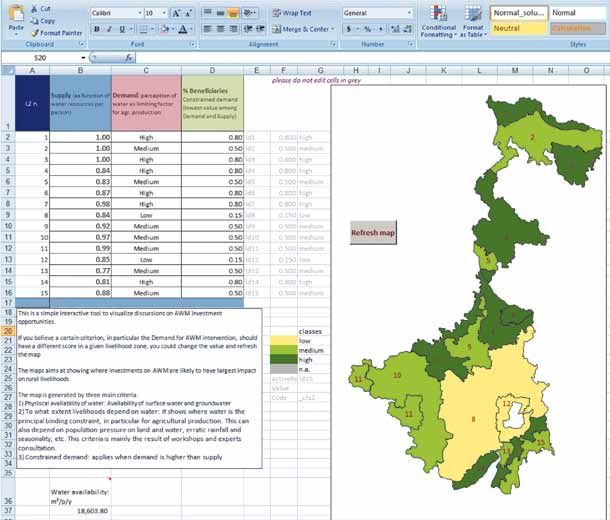
Assessing the potential for poverty reduction through investments in agricultural water management         v

Content of the CD-Rom
1.    Country investment briefs
2.    Mapping outputs of the analysis of opportunities for AWM interventions
3.    Interactive computer tool for AWM scenario analysis (an example is provided for West Bengal State)
4.    Country livelihood zones analysis reports

Abbreviations and acronyms
AEZ        Agro-ecological zone

AgWater Agricultural Water

AWM        Agricultural water management

FAO        Food and Agriculture Organization of the United Nations

GIS        Geographic Information System

GMIA       Global Map of Irrigated Area

IDE        International Development Enterprise

IFPRI      International Food Policy Research Institute

IRWR       Internal renewable water resources

IWMI       International Water Management Institute

NRL        FAO, Land and Water Division

SEI        Stockholm Environmental Institute

SSA        sub-Saharan Africa

TLU        Tropical Livestock Unit
vi                    Assessing the potential for poverty reduction through investments in agricultural water management

Acknowledgments
This present methodology was developed within the framework of the AgWater Solutions Project,

                                              Improved livelihoods for smallholder farmers

which aimed to design agricultural water management (AWM) strategies for smallholder farmers in
sub-Saharan Africa and India. The project was implemented by:

International Water   Food and Agriculture          International                        International Food   Stockholm Environment
Management            Organization of the           Development                          Policy Research      Institute (SEI)
Institute (IWMI)      United Nations (FAO)          Enterprises                          Institute (IFPRI)

The Project was implemented in Burkina Faso, Ethiopia, Ghana, the United Republic of Tanzania,
Zambia and in the States of Madhya Pradesh and West Bengal in India.

The methodology was designed and developed by Guido Santini, Livia Peiser and Jean-Marc Faurès
with the assistance, advice and review provided by Domitille Vallée and Bernardete Neves from the
FAO Land and Water Division (NRL). In addition, it also benefited significantly from the technical advice
provided by Dorit Gross, Luigi Simeone and Jippe Hoogeveen from FAO’s Land and Water Division.

The following people contributed to the development of the methodology at country-level: BURKINA
FASO: Youssouf Dembélé (INERA/Station de Farako-Ba), Seydina Oumar Traore (Développement
de l’Irrigation [DADI]), Moussa Laurent Compaoré (Independent consultant); GHANA: Ben Nyamadi
(Ghana Irrigation Development Authority [GIDA]) and Saa Dittoh (University for Development Studies);
ETHIOPIA: Girma Gebremedhin (Independent Consultant) and Hune Nega (Ministry of Agriculture
and Rural Development); U.R. TANZANIA: Mbogo Futakamba (Ministry of Agriculture, Food Security
and Cooperatives), Henry Mahoo (Sokoine University of Agriculture [SUA]), Amos Majule and Joseph
Perfect (Institute of Resource Assessment [IRA]); ZAMBIA: Mukelabai Ndiyoi (Farming Systems
Association of Zambia [FASAZ]) and George W. Sikuleka (Department of Agriculture); WEST BENGAL
(India): Saikat Pal and Rajeev Sharma (Rajarhat PRASARI); MADHYA PADESH (India): Vivek Sharma
(Centre for Advanced Research and Development [CARD]) and Vijay Shankar (SPS).

The report was edited by Rosemary Allison. Layout design and production were provided by James
Morgan, Gabriele Zanolli and Stefanie Neno.

The authors would like to thank the project partners from IWMI, IFPRI, SEI and IDE, for supporting the
development of this methodology, and the many other organizations and individuals whose comments
contributed to the development improvement of the methodology.

The AgWater Solutions project was funded by a grant from the Bill & Melinda Gates Foundation. The
findings and conclusions contained in this report are those of the authors and do not necessarily
reflect positions or policies of the Bill & Melinda Gates Foundation.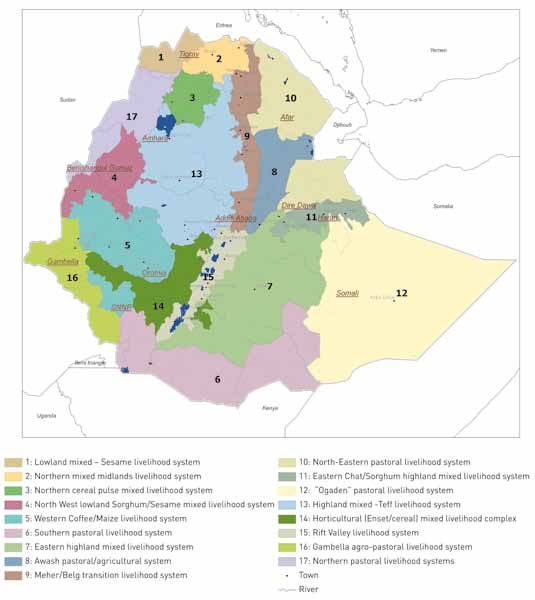
Assessing the potential for poverty reduction through investments in agricultural water management vii
Summary
Several studies have highlighted the potential of AWM for poverty alleviation. In practice, however,
adoption rates of AWM solutions remain low and, where adoption has taken place locally, programmes
to disseminate these solutions are often challenging. The overall goal of the project was to stimulate
and support successful pro-poor; gender–equitable AWM investments, policies and implementation
strategies based on concrete, evidence–based knowledge and decision–making tools.
The AGwater solutions project examined AWM interventions at the farm, community, watershed, and
national levels. It has analysed the opportunities and constraints of a number of small–scale AWM
interventions in several pilot research sites across the different project countries, and assessed their
potential in different agro–climatic, socio–economic and political contexts.
Contrary to classical water investment planning processes, this approach focuses on addressing the
needs of poor rural people, rather than focusing on the development of potentially suitable resources.
In so doing, the demand for investments in water drives the assessment process, and its implications in
terms of resources use (water, land) is checked against available supply. The demand for investments
in water varies according to the needs of the population. In order to capture this demand, the project
has adopted a livelihood mapping approach.
Livelihood zones mapping and analysis divides the country into areas where rural people share
relatively homogeneous living conditions that are based on a combination of biophysical and socio-
economic determinants. It describes the rural population’s main sources of livelihood (by category of
people), their natural resources base, potential and key constraints to development. It analyses the
relation between people and water and assists understanding of the extent and how water can be a
factor in development.
The different steps of this methodology followed for national analysis are:
1. Mapping of the main livelihood zones, responding to the following questions:
What are the different farmer typologies and rural livelihood strategies?
What are the main water-related constraints and needs in the different rural livelihood
contexts?
2. Mapping of the potential and opportunities for improving smallholders’ livelihood through water
interventions:
3. Estimation of the number and percentage of rural households that may benefit from AWM
interventions.
4. Mapping of the suitability and demand for a series of specific AWM solutions, showing where
they have the highest potential impact on rural livelihoods.
5. Estimation of the potential number of beneficiaries, the potential application area and total
investment costs for each AWM solution in each livelihood zone.
FAO conducted and coordinated a participatory AWM mapping process in each project country in
close collaboration with national partners. These products were developed using an approach that
included national level data collection and processing, case study analysis and local consultation.
The livelihood map was developed during a participatory mapping workshop, which gathered a large
number of national experts from different fields (agriculture, water, social sciences, geography, etc.)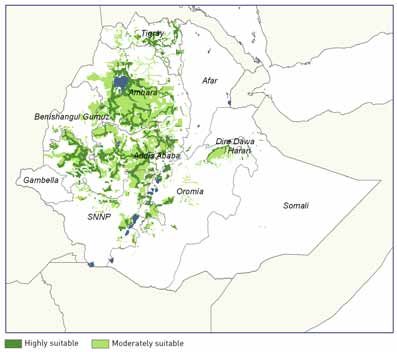
viii Assessing the potential for poverty reduction through investments in agricultural water management
and institutions (government, universities, non-governmental organizations (NGOs), etc.) as well as
farmers’ groups. This process was organized in two phases:
a first workshop established the basis for the analysis and started depiction of the relationships
between rural livelihoods and AWM; and
a second or series of events - both at national and regional levels – were designed to review the
maps and refine the criteria used to define the potential for AWM and the suitability of different
technologies.
The outputs of these consultations were enhanced using secondary data analysis from available
national and subnational datasets, and statistics and further consultation with national and
international experts.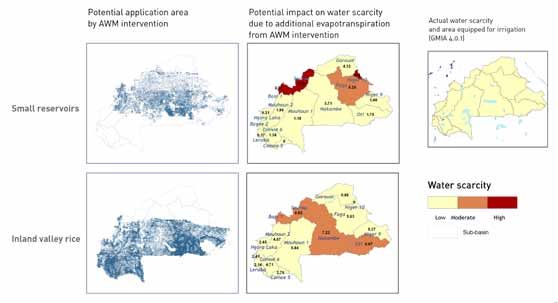
Assessing the potential for poverty reduction through investments in agricultural water management     1

Introduction
Insecure access to water for consumption and productive uses is a major constraint for rural people
in sub-Saharan Africa (SSA) and India. For millions of smallholder farmers, fishers and herders in
SSA, water is one of the most important production assets, and securing access to and control and
management of water is key to enhancing their livelihoods (FAO and IFAD, 2008). Considering that
agriculture remains the main source of living, development strategies need to focus on improving
productivity in this sector.

Agricultural water is fundamental to agriculture-based rural livelihoods and sufficient availability and
reliable access to water is commonly a constraint to production and other activities. In addition, water
provides a centre around which other interventions can be organized. In this respect, increasing and
improving investments in agricultural water management to support smallholders’ livelihoods is still a
priority in SSA and India.

Small-scale irrigation is very promising in developing countries; it can promote rural food security,
poverty alleviation and adaptation to climate change. It enables households to generate more income,
increase their resilience and, in some cases, transform their livelihoods (Tucker, 2010).

Nevertheless, investment decisions concerning AWM are frequently ‘supply-driven’, dictated by the
availability of land and water resources and not by needs and priorities based on farmers’ livelihoods.
Indeed, the likelihood of the success of water-related investments depends on a more comprehensive
analysis of dynamic opportunities and needs that are closely linked to biophysical and socio-economic
contexts (FAO and IFAD, 2008).

Therefore, there is a need to develop new models of planning for AWM investments level, by recognizing
the diversity and complexity of the country contexts and by tailoring interventions to rural population
priorities and livelihood strategies. Any rural water development strategy will need to deal with
multi-local diversified livelihood systems with limited capacities for agricultural investment, and
a predominance of risk-avoiding strategies (IFAD, 2005). This means, “a fundamental shift beyond
considering water as a resource for food production to focusing on people and the role water plays in
their livelihood strategies” (WWAP, 2006); and implies a multiple-use perspective (Molden, 2007).

Starting with these considerations, this document presents a methodology that aims to identify AWM
potential and opportunities in support of smallholders’ livelihoods. Specifically, the methodology shows
how livelihood mapping helps define locations where water constraints are a major factor affecting
farmers and where specific agricultural water management and technologies can have a positive impact
on smallholders’ living conditions, particularly the poorest.

The primary goal of this approach is to define and assess the potential for scaling-up opportunities at
the national level for AWM interventions in support of the livelihoods of smallholder farmers.

This report proposes a method for identifying the locations where water constraints are a major factor
affecting smallholders’ livelihoods and where agricultural water management in general, as well as
specific technologies, can boost the poorest farmers’ livelihoods. This present report builds on previous
studies conducted by the FAO and IFAD (2008) and Sullivan et al. (2009).

The method described relies on a livelihood mapping approach that allows characterizing the main
country livelihood zones geographically and the role of agricultural water access and management in
each domain. The likelihood of a successful adoption of AWM options by smallholders varies according
to the main sources of livelihood, dictated in large part by different biophysical and socio-economic
determinants including agroclimatic conditions, natural resources endowment, socio-political and
cultural context.
2 Assessing the potential for poverty reduction through investments in agricultural water management
Understanding the geographical characterization of rural livelihoods and the distribution of the main
rural population typologies helps in the design of intervention strategies to improve agricultural water
management and increase both the resilience and productivity of agriculture, and more generally to
boost agricultural incomes.
More specifically, the approach consists of four elements or steps:
understanding the link between access to water, water use and rural livelihoods;
defining where AWM is key to ensuring sustainable rural livelihoods and where it can make a
difference;
understanding how AWM can contribute effectively to boost living conditions in rural areas,
identifying which technological options are the most promising, and where the most suitable
conditions exist for their adoption;
defining and locating the target beneficiaries of the proposed AWM approaches and understanding
their main strategies and how they can benefit from AWM.
This approach has been implemented and tested in surveys conducted in Burkina Faso, Ethiopia,
Ghana, Tanzania and Zambia, and in the states of Madhya Pradesh and West Bengal in India. In
each country/state, a number of relevant AWM interventions were identified by desk studies and
consultations with national experts.
Content of the CD-Rom
The report encloses a CD-ROM with additional information, as follows:
1. Country investment briefs
The briefs are summary reports prepared for each project countries (Burkina Faso, Ethiopia,
Ghana, the United Republic of Tanzania, Zambia, Madhya Pradesh and West Bengal States in India)
that describe the results of the analysis at country level and present all the mapping outputs as
well as figures regarding the investment potential.
2. Mapping outputs1 of the analysis of opportunities for AWM interventions
The maps presented include, for each country/state:
i) Maps of livelihood zones
ii) Maps of potential beneficiaries of AWM interventions
iii) Maps of biophysical suitability by type of AWM intervention
iv) Maps of livelihood-based demand by type of AWM intervention.
3. Interactive computer tool for AWM scenario analysis (an example is provided for West Bengal State)
The tool is developed in MS Excel and allows the users to customize the map of potential beneficiaries
of AWM interventions by changing the value of the perceived demand for AWM intervention in the
different livelihood zones.
4. Country livelihood zones analysis reports
These reports, prepared by national partners in each project country/state, provide an in-depth
overview of the country-level livelihood context by describing the different livelihood zone profiles,
their key characteristics as well as their water-livelihood implications.
1
The GIS datasets and metadata are available and can be downloaded in the FAO Geonetwork portal:
http://www.fao.org/geonetwork/srv/en/main.homeAssessing the potential for poverty reduction through investments in agricultural water management 3
Scope of this report
This report is to present the methodology used for mapping and assessment of the potential for
investments in agricultural water management at country level in support of rural livelihoods. More
specifically, the approach aims to:
1. Map and describe the main country livelihood contexts
This is the starting point of the approach. The intent is to identify, characterize and locate the
key livelihood contexts to better understand their main constraints and development needs
their different farmer typologies and the implications for AWM.
2. Map the AWM potential to improve smallholders’ livelihoods
The purpose is to assess the entry point for AWM so as to improve rural livelihoods and, more
specifically, identify where to prioritize investments in AWM in order to have the maximum
impact on rural livelihoods.
3. Map the suitability domains of specific AWM solutions
The purpose is to assess and map the area identified as the most promising for AWM
technologies and investment options so as to generate the highest impact on smallholders’
livelihoods. Specifically, the intent is to define and locate geographical domains where a given
AWM technology or solution will result in highest benefits for livelihoods and where there is
more likelihood for its adoption by smallholder farmers.
4. Estimate the potential number of beneficiaries and costs of investing in AWM
On the basis of the geographical domains of the different AWM investment options, the
approach foresees the estimation of the number of potential beneficiaries and application area
as well as the potential investment costs at national level.4 Assessing the potential for poverty reduction through investments in agricultural water management Concepts and definitions The livelihoods perspective The livelihoods perspective is an approach to determining how people make a living. It incorporates an understanding of how household capabilities, assets, and activities combine within a specified environment to achieve household well-being in the short and long term. Livelihoods analysis assesses the resilience of household strategies in the face of shocks and stresses, and assists in identifying vulnerable areas or groups. The findings generated provide a useful framework for supporting households in improving their living conditions and enhances their resilience to both external (e.g. drought) and internal threats (e.g. family illness) (FAO and IFAD, 2008). According to Chambers and Conway (1992), livelihood comprises the capabilities, assets (stores, resources, claims and access) and activities required for a means of living. It comprises the adequate stocks and flows of food and cash required to meet basic needs. It is made up of a range of farm and off-farm activities that together provide a variety of sources of procurement for food and cash. Thus each household can have several possible sources of entitlement that constitute its livelihood. These entitlements are based on the endowments of a household, and its position in the legal, political and social fabric of society. A livelihood is sustainable when it: i) can cope with and recover from stress and shocks that determine vulnerability; ii) maintain or enhance its capabilities and assets; and iii) provide sustainable livelihood opportunities for the next generation. The vulnerability context refers to seasonality, trends, and shocks that affect people’s livelihoods. The key attribute of these factors is that they are not susceptible to control by local people themselves, at least in the short and medium term (DFID, 2000). Livelihood strategies vary significantly within a country, from rural to urban areas, and across countries. The household is taken as the unit of reference because it is the primary level of aggregation through which people organize production, share income and consumption (FAO, 2006a). Policies and institutions that influence rural household’s access to livelihood assets are also important aspects of the livelihood framework (DFID, 2000). Institutions are the social cement linking stakeholders to access to capital of different kinds to the means of exercising power and so define the gateways through which they pass on the route to positive or negative [livelihood] adaptation (Scoones, 1998). Mapping rural livelihoods Provided that patterns of rural livelihood vary from one area to another, based on local factors such as climate, soil or access to markets, livelihood mapping consists of identifying and mapping areas with relatively homogeneous conditions, where households share similar livelihood patterns and have relatively similar entitlements, which are formed by considering both biophysical and socio- economic determinants. In this case, specific attention is given to the use and management of rural water resources. The analysis, therefore, delineates geographical zones within which people share similar livelihood patterns, such as source of income, access to food, farming practices, including crops, livestock and access to markets. Different livelihood options are available to people depending on where they live (the agro-ecological context) and the resources to which they have access (land, infrastructure, assets, financial resources, labour, social network, etc.). The possibilities are many but not unlimited; in practice, the range of options is typically limited. People produce food, they exchange goods or services for food, or they earn cash with which they can buy food. Once it is evident that a group of people in a certain area share a predominant way of securing their food, then it is possible to characterize the area in terms of the
Assessing the potential for poverty reduction through investments in agricultural water management        5

dominant economic activity: a maize-based farming zone, or pastoral zone based on camel raising
(USAID, 2008).

It is important to recognize that mapping livelihoods at different scales uses different criteria and
parameters. Livelihoods are characterized at the regional level differently than at country or local
levels. For example, at the regional level, given the heterogeneity of large-scale conditions, livelihood
mapping in rural areas will be based predominantly on the agro-climatic conditions that dictate major
farming practices, while such a scale will make it difficult to account for the variety of socio-economic
conditions that influence livelihoods locally. Scaling down to the country and local levels, such socio-
economic conditions, together with political and institutional parameters, can better take into account
the delineation of domains of homogenous livelihoods (FAO and IFAD, 2008).

Figure 1 shows the different variables at different scales that allow the identification, mapping and
characterizing of homogeneous livelihood zones.

 Figure 1    Rural livelihood determinants at different scales (FAO and IFAD, 2008)

                                                                Regional
                                                                Climate,
                                                       agro-ecological conditions,
                                                        natural resources base,
                                                     principal sources of livelihood.

                                                                Country
                                           Land and water, institutions, policies, population,
                                          livelihood patterns, cropping patterns, topography.

                                                                 Local
                                       Power structure, local institutions, infrastructures, soils,
                                               access to resources, sources of income.

Most livelihoods are complex and are shaped by a wide-range of factors. Generally, four primary
categories of determinants can be identified: i) Geography climate and natural resources; ii)
Production; iii) Market and Infrastructure; iv) Socio-economic patters. In addition, as the approach
aims at determining relationship and interaction between livelihoods and water resources, it is
necessary to add a fifth determinant: access to water resources.

 i.   Geography climate and natural resources
      These variables correspond to natural capital in the sustainable livelihood framework (DFID,
      2000) and represent natural resources available to people and the way they are used and the
      prevailing agroclimatic conditions that influence farming activities. People living in a fertile
      highland area have very different options than those living in a semi-arid lowland area. The
      most important natural factors are topography (i.e. the physical features of an area, including
      the relief, coasts, rivers, and plains), soil, climate (i.e. temperature and rainfall) and vegetation.
      These are the variables that most influence the typology of production activities and the livelihood
      strategies.
6 Assessing the potential for poverty reduction through investments in agricultural water management
ii. Production
There are several types of rural production system. Most can be grouped into a few main
categories: agricultural; agro-pastoral; pastoral; fishing; hunting-gathering and, in some
cases, other systems (e.g. labour-based, mining areas, game reserves, etc.). The system of
production is determined by several factors, of which geography, climate and natural resources
are clearly the most significant. Other factors that influence production patterns are markets
and infrastructure as well as the socio-economic context.
Table 1 Sources of rural livelihoods associated with major production systems (adapted from FEG consulting)
Sources of
Main characteristics Additional notes
rural livelihood
Agriculture Example of main types of Agricultural In this type of zone, the main activity is crop
Livelihood zones production, typically supplemented by livestock
Rainfed and/or irrigated keeping but on a small scale (e.g. 1-2 dairy
Food crop and/or cash crop cattle and poultry for most households). We
Crop surplus or crop deficit want to rank the main crops consumed and the
Hand and/or animal/mechanical main crops sold.
traction
Short or long rains dependent
Lowland - highland - mid-highland
High/low potential
In/Fertile soils
Sparsely or densely populated
Pastoral livelihoods are those where the core
or main activity is the raising of livestock. We
Pastoral Agro-ecological zone want to rank the main types of livestock based
on their importance to household food and
income.
Crops more/less important than Livestock
Agro-pastoralists both herd livestock
Agro-pastoral Plus any agricultural or pastoral
and grow crops.
characteristics
Fishing Boats, nets and/or lines source of income.
Plantation - ranch - urban
In this type of zone the majority of people
Local work - seasonal - long-term
Labour-based derive their income from labour and purchase
migration
most of their food
Type of plantation (tea, coffee, etc.)
Hunter-gatherers derive a substantial
proportion of their food from hunting and
Hunting of animals more/less important
Hunter-gatherer gathering (not just income, as for pastoralists
than gathering of wild plants
that may collect and sell charcoal, for
example.)
trading Indicate main characteristics pattern not listed above.
iii. Market and infrastructure
The most important human-made factors are those related to infrastructure (roads, railways,
and telecommunications). People living along major roads may have better access to markets,
food and income options than those living in more remote areas. We can think of these three
factors as linked to consumption as follows: geography affects both the options for production
(climate, soil, etc.) and for marketing/trade (roads, proximity to urban centres, etc.), which in
turn affect household consumption. Household production (of food and other items) may eitherAssessing the potential for poverty reduction through investments in agricultural water management 7
be directly consumed or may be traded/exchanged for other items in the market. Consumption
is critically determined by what is available in these markets, and how people obtain the means
to purchase these commodities.
iv. Socio-economic patterns
The socio-economic context is a crucial element to describe livelihoods, although socio-
economic criteria can hardly be mapped. These elements are often defined by targeted surveys
and the use of subnational statistics. Examples of socio-economic criteria are: population
density and distribution, farmers’ typology, average landholding size, vulnerability to climate
shocks, access to credit, etc.
v. Access to water resources
The main focus of this analysis is to understand the implications and linkages between water
resources and rural livelihoods. As the main objective of this approach is to provide clear
recommendations for AWM interventions in support of livelihoods, these aspects are then
crucially important to the definition of the livelihood zones boundaries and description and are
key livelihood determinants for the mapping process.
Mapping livelihood zones is a challenge as not all livelihood determinants can be mapped, represented
or are relevant at all scales. Mapping livelihoods at national level entails an effort that captures the
most distinguishing characteristics of the zones, while avoiding over-approximation. This process is
particularly challenging in contexts where statistical and spatial datasets are not available or have
significant gaps, particularly in sub-Saharan Africa (SSA).
Livelihood zone mapping involves more than just the drawing of maps. A livelihood zone map is of
little use unless it is accompanied by a detailed description of the patterns of livelihoods in each
zone, and ideally by an analysis of the underlying reasons for differences between zones. This means
analysing in some detail the production and trade/exchange options in each of the zones and the
influence that the underlying geography has on each (FEG, 2011).
Most livelihoods are complex, and are shaped by a wide-range of factors. Generally, when defining
livelihood zones we look at four primary factors (Figure 2):
Figure 2 Rural livelihoods determinants
RURAL LIVELIHOODS
Geography, Climate and
Natural Resources Base
ACCESS TO Production patterns
Market and
WATER RESOURCES (Farming, livestock
infrastructure
AND USE keeping, mining, etc.)
Socioeconomic patterns
(Gender, education,
land tenure, etc.)8 Assessing the potential for poverty reduction through investments in agricultural water management
Summary of methodology
The method is characterized by different phases to be implemented over a period between 3 and
6 months, depending on the complexity and size of the country. The approach foresees a balance
between desk analytical work, field-level data collection and participatory consultations with national
experts and stakeholders.
Specifically, the approach is characterized by:
1. An inception phase to define the mapping criteria and data needed for the analysis and to build
the information and knowledge base as well as to conduct the data and information collection
process
2. A participatory mapping phase to interpret the data and information collected and start depicting
livelihood zones, AWM investment potential and suitability domains for AWM solutions
3. A data and information-processing phase to consolidate and fully describe the map of livelihood
zones and assess the AWM investment priorities, geographical domains for AWM solutions and
estimate and quantify the potential beneficiaries of AWM solutions.
4. A validation phase that is characterized by participatory validation workshops as well as the data
check and comparison using surveys, studies and field sample.
Figure 3 shows the framework of the method proposed.
Figure 3 Framework methodology
INCEPTION PHASE
Building the information and knowledge base
Identification of criteria
and data needed Literature review
Design of Proxy data
Data collection
PARTICIPATORY MAPPING PROCESS
(participatory mapping workshops)
ANALYTICAL PROCESS
FIELD LEVEL CASE STUDIES
(conducted by the project)
ON AWM SOLUTIONS
Consolidation of workshop outputs
AWM KNOWLEDGE
expert knowledge)
(literature review,
Assessing Livelihood zoning and profiling Assessing the
suitability role of AWM to
by type of AWM improve rural
intervention livelihoods
Assessing potential
beneficiaries and costs
for investment
VALIDATION PROCESS
(validation workshops, expert knowledge, field surveys)Assessing the potential for poverty reduction through investments in agricultural water management 9
Participatory consultations
Livelihood mapping is a complex concept that requires a deep knowledge of the country context
and the capacity to integrate and interpret different typologies and sources of information. To cope
with this complexity, and given that relevant data and statistics are often lacking, the analysis builds
significantly on expert knowledge by involving national and local stakeholders. To best capitalize on
expert knowledge, workshops have been designed and conducted in all the project countries. Adopting
a participatory mapping approach, the purpose of the workshop is to establish the basis of the analysis
and start depicting the relationships between rural livelihoods and AWM, trying understanding the
main constraints to development and to define the role of AWM in improving livelihoods. This process
is organized in two phases:
i. Participatory mapping process: the purpose of a first workshop is to set up the basis for
the analysis and begin depicting the relationships between rural livelihoods and AWM. The
participatory mapping process is fully described under the heading: Participatory mapping
process.
i. Participatory validation process: a second workshop or series of events is organized – both
at national and regional levels – to review the maps and refine the criteria used to define the
potential for AWM and the suitability of different technologies. The participatory validation
process is fully described under Validation process.
The workshops gather a group of national/local experts from different fields (agriculture, social
sciences, geography, etc.) and diverse institutions from the public and private sectors as well as
representatives of civil society. They also gather representatives from the different regions to ensure
full knowledge of livelihood aspects throughout the country and to ensure local ownership of the
mapping process. When possible, discussions were held at regional level to get closer to ground
realities.
The workshop is an important link between the assessment of the AWM context and the livelihood
analysis as it allows practitioners to relate the proposed AWM solutions to the livelihood context and
to initiate defining and mapping suitability domains for AWM solutions on the basis of the livelihood
patterns.10 Assessing the potential for poverty reduction through investments in agricultural water management
Inception phase: building the data
and information base
Literature review, identification of mapping criteria and data needed
The first step of the methodology is to conduct a literature review of existing information at global,
regional and country level on rural livelihoods and their implication for water resources. In particular
the review should focus on literature based on various methodologies and approaches concerning
livelihood-zone mapping and water intervention identification available inside and outside the region.
In addition, the review should entail an assessment of the availability of regional and national data and
information, against the requirements for livelihood-zone mapping and description, and identification
of water interventions.
Another important step in this approach is to identify the mapping criteria to feed the Geographic
Information System (GIS) environment and characterize livelihoods zones and the AWM potential for
poverty reduction.
The aim is to identify the key biophysical and socio-economic determinants that best represent a
certain livelihood and AWM context. More precisely, the determinants would allow definition of the
boundaries of the different livelihood domains and describe their main livelihood characteristics.
The determinants selected can be organized into the four different categories (Table 2) that
characterize livelihoods:
geography, climate and natural resources base;
production patterns;
market and infrastructures;
socio-economic patterns.
Table 2 Examples of livelihood determinants
Geography, natural Production Socio-economic
Infrastructures
resources base and climate patterns patterns
Crop distribution Rural population
Landcover patterns Access to markets
and intensity density
Agro-ecological zones Livestock distribution Roads and railroads Rural poverty rates
Topography Water infrastructure Average landholding size
Rainfall pattern Mines
Access to credit
Groundwater levels
institutions
In principle, variables and layers that already represent a natural delineation, boundary or pattern
(e.g. agro-ecological zones, cropping patterns, landcover, topography, population density, etc.) are
used to define livelihood domains boundaries while others, particularly the aggregated statistics, are
used to describe and enrich livelihood domains. Depending on the focus and purpose of livelihood
mapping (monitoring food security, emergency and relief interventions, water-related investments,
etc.), the baseline delineation could start with different layers.Assessing the potential for poverty reduction through investments in agricultural water management 11
The livelihood criteria are defined in each country in consultation with the local partner following the
general framework. Depending on the country, in many cases the agro-climatic determinants are
the main drivers that determine livelihood patterns, while in other cases production and cropping
patterns may be more prominent. These drivers are generally the base layer and delineation of
livelihood domains.
In Annex 1 a comprehensive table is presented showing the criteria framework and depicting
the complexity of information defining livelihood patterns in different countries. The table can be
considered as a general baseline framework to help in the identification and collection of data in the
different countries. Not all the criteria listed can be translated into spatially explicit variables and
many of them, although they can be mapped, may not be available in all countries.
One challenge of drawing livelihood maps is how to combine continuous variables (typically agro-
ecological variables such as rainfall, temperature, topography, or population density, etc.), with socio-
economic data, which is usually available (in the form of statistics) from some level of administrative
boundaries.
In a few cases, agro-climatic conditions play an important role and are the main factors used in
mapping livelihood zones. This is typical for countries where there are clearly contrasting climatic
conditions and where the rural population’s livelihoods are driven mostly by agricultural practices.
In other cases, market or other socio-economic conditions may be the main determinants used to
describe livelihood.
Data collection
The type of data used in the analysis is diverse and available at different scales and from different
sources. The data collected can be organized as follows:
Global and regional level datasets
Certain categories of global datasets, particularly the biophysical, have reached a high level of
detail and resolution and can be used for national level analyses. This is the case of climatic
datasets (e.g. rainfall, temperature, aridity index, length of growing period, topography,
infrastructure (e.g. roads and railroads), as well as some socio-economic data (e.g. population
distribution).
National level datasets
Some key determinants are very much scale-dependent and, although they can be available
at regional and global level, it is preferable to obtain national level datasets that can capture
details and diversity. These are for instance: land cover/land use patterns, river network,
cropping patterns and distribution, livestock distribution, soils and others. The analysis shows
that, while it would be preferable to have access to national level datasets for all data, in most
cases these datasets are not available or not accessible at national level. Clearly, there is a gap
in capacity between well-established and funded global datasets and much poorer GIS data
production capacity and dissemination strategy at national level.
Subnational statistics (cropping patterns, landholding, etc.)
This type of information is very important and its availability varies from country-to-country. The
critical aspect is the size of the administrative units and at which subnational level the information
is available. If the sub-national units (e.g. districts, blocks, etc.) are small and, as a consequence,
the information is sufficiently disaggregated, these data can be relatively easily included in the GIS
analysis and can contribute to the delineation and description of livelihood zones. The common
subnational statistics used in a typical analysis are: crop production and area, livestock production,
level of mechanization, irrigation typology, land-holding size, poverty etc.12 Assessing the potential for poverty reduction through investments in agricultural water management
Expert knowledge: National and local surveys, interviews and participatory consultations
To cope with the complexity of the information needed and the limited availability of data, the
analysis makes use of expert knowledge to be used as qualitative information to complement the
existing data. This knowledge is also used to interpret the data. The following sections describe
in more detail the participatory mapping workshops that are the main source of experts’
information.
See Annex 2 for a detailed list of data used in the analysis.
Use of proxy data
Specific data are important for the analysis both regarding the characterization of the livelihood context
and to spatially characterize the potential for specific AWM interventions. However, in many countries,
these data are not available, and can only be represented by proxy data that best characterizes the
information required. In particular, proxies have been used to define:
i. Shallow groundwater potential
Information on the existence and distribution of shallow groundwater (to a depth of 10 m) is
important in the assessment of the potential for small-scale water management. It is, however,
very scarce, inaccurate and scattered, particularly in SSA where shallow aquifers are usually
small and highly dispersed. In this study, soil maps have been used as a data proxy to ascertain
the potential existence of shallow aquifers. Shallow aquifers have been associated with the
presence of specific soil types, specifically Fluvisols, Gleyisols and Gleyic subunits.
Soil Mapping Units from the Harmonized World Soil Database 2009 (IIASA and FAO, 2009) have
been classified, based on the occurrence of these soils. Non-vegetated areas derived from
Global Landcover 2000 (IES, 2000) dataset have been used to mask out areas where the absence
of vegetation is considered to be an indicator of the lack of water for plant–root systems. Field
samples, when available, and expert knowledge have helped refine the maps obtained. An
example of a map is shown in Figure 4:
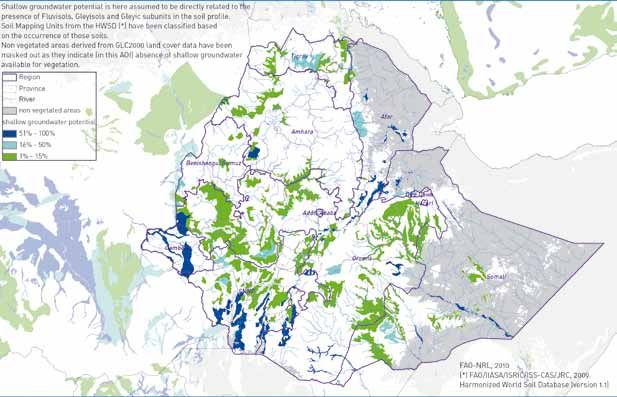
ii. Rural poverty
The level and dimensions of poverty are important in an analysis that claims to support poverty
reduction and it is therefore important to be able to map both the prevalence and absolute number
of rural poor. The analysis has adopted rural child malnutrition – more specifically prevalence
of underweight among children under five-years of age – as a measure of rural poverty. Child
malnutrition represents a good proxy for rural poverty and food insecurity (Setboonsarng,
2005). It is widely accepted that high rates of child malnutrition are found in areas with chronic
widespread poverty (ADB, 2001). Although an income-based or expenditure-based measure
of poverty remains an important indicator, nutrition-based measures were deemed more
appropriate for the analysis in Ethiopia and the other countries. Figure 5 shows an example of a
rural poverty map.You can also read