CoupModel (v6.0): an ecosystem model for coupled phosphorus, nitrogen, and carbon dynamics - evaluated against empirical data from a climatic and ...
←
→
Page content transcription
If your browser does not render page correctly, please read the page content below
Geosci. Model Dev., 14, 735–761, 2021
https://doi.org/10.5194/gmd-14-735-2021
© Author(s) 2021. This work is distributed under
the Creative Commons Attribution 4.0 License.

CoupModel (v6.0): an ecosystem model for coupled phosphorus,
nitrogen, and carbon dynamics – evaluated against empirical
data from a climatic and fertility gradient in Sweden
Hongxing He1 , Per-Erik Jansson2 , and Annemieke I. Gärdenäs1
1 Department   of Biological and Environmental Sciences, University of Gothenburg, P.O. Box 460, Gothenburg 40530, Sweden
2 Department   of Land and Water Resources Engineering, Royal Institute of Technology (KTH), Stockholm 10044, Sweden

Correspondence: Hongxing He (hongxing-he@hotmail.com)
and Annemieke I. Gärdenäs (annemieke.gardenas@bioenv.gu.se)

Received: 2 March 2020 – Discussion started: 14 April 2020
Revised: 2 December 2020 – Accepted: 12 December 2020 – Published: 3 February 2021

Abstract. This study presents the integration of the phos-         the Coup-CNP to account for various feedback mechanisms
phorus (P) cycle into CoupModel (v6.0, referred to as Coup-        that have a significant impact on ecosystem C sequestration
CNP). The extended Coup-CNP, which explicitly considers            and N leaching under climate change and/or elevated N de-
the symbiosis between soil microbes and plant roots, enables       position.
simulations of coupled carbon (C), nitrogen (N), and P dy-
namics for terrestrial ecosystems. The model was evaluated
against observed forest growth and measured leaf C/P, C/N,
and N/P ratios in four managed forest regions in Sweden.           1   Introduction
The four regions form a climatic and fertility gradient from
64◦ N (northern Sweden) to 56◦ N (southern Sweden), with           Phosphorus (P) is an essential element for photosynthetic
mean annual temperature varying from 0.7–7.1 ◦ C and soil          plants in terrestrial ecosystems, with the P cycle coupled to
C/N and C/P ratios varying between 19.8–31.5 and 425–              carbon (C) and nitrogen (N) fluxes through processes such
633, respectively. The growth of the southern forests was          as decomposition of soil organic matter and nutrient uptake
found to be P-limited, with harvested biomass representing         (Lang et al., 2016; Vitousek et al., 2010). A steep increase
the largest P losses over the studied rotation period. The sim-    in the anthropogenic release of C and N to the atmosphere
ulated P budgets revealed that southern forests are losing P,      relative to P release has altered plant and soil nutrient sto-
while northern forests have balanced P budgets. Symbiotic          ichiometry, leading to new forcing conditions (Elser et al.,
fungi accounted for half of total plant P uptake across all four   2007; Penuelas et al., 2013). For instance, numerous moni-
regions, which highlights the importance of fungal-tree inter-     toring studies have revealed increasing N/P ratios in plants
actions in Swedish forests. The results of a sensitivity anal-     and soils, especially in forests from North America (Crow-
ysis demonstrated that optimal forest growth occurs at a soil      ley et al., 2012; Gress et al., 2007; Tessier and Raynal, 2003)
N/P ratio between 15–20. A soil N/P ratio above 15–20 will         and central and northern Europe (Braun et al., 2010; Jonard
result in decreased soil C sequestration and P leaching, along     et al., 2015; Talkner et al., 2015). Such trends are generally
with a significant increase in N leaching. The simulations         assumed to indicate that these ecosystems are shifting from
showed that Coup-CNP could describe shifting from being            being N-limited to either co-limited by both N and P or P-
mostly N-limited to mostly P-limited and vice versa. The           limited (Elser et al., 2007; Saito et al., 2008; Vitousek et
potential P-limitation of terrestrial ecosystems highlights the    al., 2010; Du et al., 2020). Human activities are expected
need for biogeochemical ecosystem models to consider the P         to continue increasing atmospheric N deposition; as such,
cycle. We conclude that the inclusion of the P cycle enabled       P availability and P cycle dynamics will become progres-
                                                                   sively more important in regulating the biogeochemistry of

Published by Copernicus Publications on behalf of the European Geosciences Union.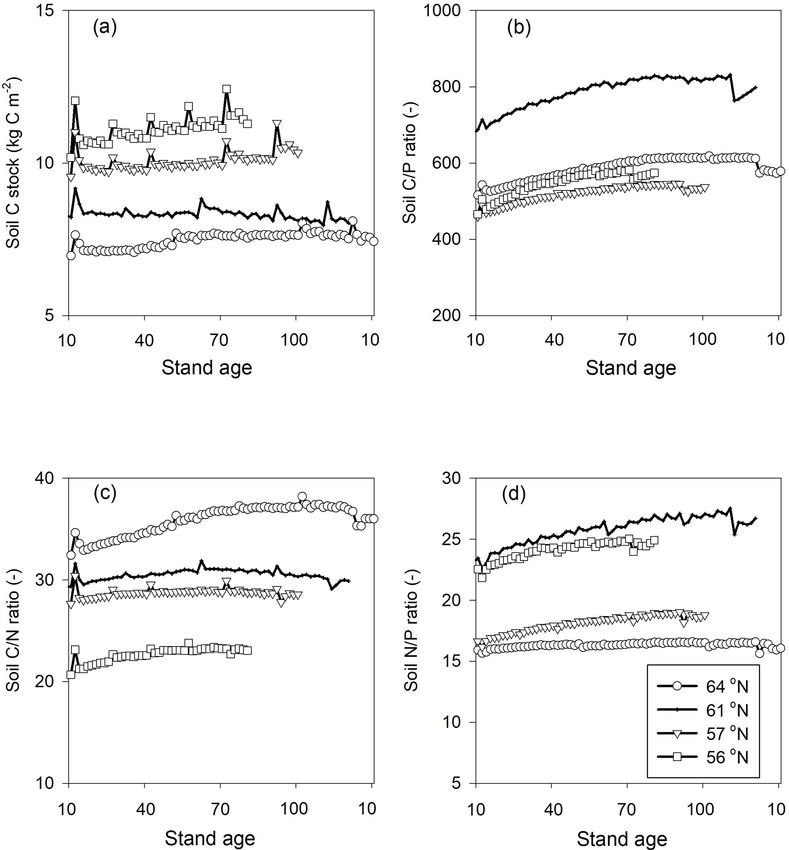
736                                                                                            H. He et al.: CoupModel (v6.0)

terrestrial ecosystems and amplifying feedbacks relevant to       trients (Smith and Read, 2008). Several studies have shown
climate change, e.g. limiting the growth response of plants       that the depletion zone around plant roots, which is caused
to increased temperature (Deng et al., 2017; Fleischer et al.,    by plant uptake and the immobile nature of mineral P, in-
2019; Goll et al., 2017).                                         creases when a plant interacts with mycorrhizal fungi (Bolan,
   Nevertheless, the P cycle is seldom incorporated into          1991; Schnepf and Roose, 2006; Smith, 2003). Global meta-
ecosystem model structures. Incorporating the P cycle is es-      analysis studies have highlighted that the symbiosis between
sential to improving how global models can assess climate–C       plants and soil mycorrhizal fungi strongly influences plant
cycling interactions (Reed et al., 2015). Most of the process-    P availability and subsequently affects plant growth (Terrer
based models that can simulate P cycling were specifically        et al., 2016, 2019). Previous research has shown that my-
developed for agricultural systems and focus on the soil pro-     corrhizal fungi can receive between 1 % and 25 % of plant
cesses, e.g. EPIC (Jones et al., 1984, Gassman et al., 2005),     photosynthates and constitute as much as 70 % of the total
ANIMO (Groenendijk et al., 2005), and GLEAMS (Knisel              soil microbial biomass; thus, it is clear that this symbiont has
and Turtola, 2000). A few catchment-scale models that focus       a major impact on soil C sequestration (Averill et al., 2014;
on surface water quality, e.g. SWAT (Arnold et al., 2012),        Clemmensen et al., 2013; Staddon et al., 2003). Even though
HYPE (Arheimer et al., 2012), and INCA-P (Jackson-Blake           there is a well-established link between mycorrhizal fungi
et al., 2016), aim to simulate how crop management influ-         and plant P nutrition (Bucher, 2007; Read and Perez-Moreno,
ences P leaching and thus consider processes such as nu-          2003; Rosling et al., 2016), this factor is seldom included in
trient retention, leaching, and transport. The C response to      ecosystem models (Smith and Read, 2008). To the best of
P limitation has recently been studied through several em-        our knowledge, only Orwin et al. (2011) have presented an
pirical and field studies (Van Sundert et al., 2020; Du et        ecosystem model that considers C, N, and P together with
al., 2020). For example, Van Sundert et al. (2020) showed         symbiotic fungi. They found that considering organic nutri-
that the productivity of European beech (Fagus sylvestris)        ent uptake by symbiotic fungi in an ecosystem model can sig-
forests is negatively related to soil organic carbon concen-      nificantly increase soil C storage, with this effect being more
trations and mineral C/P ratios. Several global vegetation        pronounced under nutrient-limited conditions. In this model,
models have included the P cycle to study how it affects the      organic nutrient uptake reflects a pathway through which
C cycle (Goll et al., 2012, 2017; Wang et al., 2010; Yang         plants can utilise organic nutrients by biochemical minerali-
et al., 2014; Zhu et al., 2016; Thum et al., 2019). These P-      sation, either in symbiosis with mycorrhizal fungi or via root
enabled models differ in how they describe soil P dynamics,       exudates (e.g. Schachtman et al., 1998; Gärdenäs et al., 2011;
i.e. implicitly or explicitly through symbiotic relationships     Richardson et al., 2009). However, plant growth is static in
with mycorrhiza and other soil microbes, plant P use, and         the model presented by Orwin et al. (2011); as such, plant–
acquisition strategies, ultimately leading to considerable un-    soil or plant–environment interactions are largely ignored.
certainty in the C response (Fleischer et al., 2019; Medlyn et    Our model (Eckersten and Beier, 1998; He et al., 2018) also
al., 2016; Reed et al., 2015). Medlyn et al. (2016) applied six   includes a shortcut for nutrient uptake that relies on rhizo-
global vegetation models – including two coupled Carbon–          sphere processes. The assumption is that nutrients released
Nitrogen–Phosphorus (CNP) models (CABLE and CLM4.0-               by biochemical mineralisation are instantly taken up by sym-
CNP) – to study how the C cycle of the Eucalyptus-Free            biotic microbes and/or the plants, thereby bypassing the soil
Air CO2 Enrichment experiment responds to elevated CO2            matrix solution. He et al. (2018) integrated the MYCOFON
(eCO2 ) levels. The results demonstrated notable variations       model (Meyer et al., 2009) into CoupModel v5 to ensure that
in predicted net primary productivity ranging from 0.5 % to       the symbiosis between plant roots and mycorrhiza would be
25 %. The CNP models that explicitly considered the P de-         sufficiently considered and compared the results with a previ-
pendency of C assimilation predicted the lowest eCO2 re-          ous implicit representation of N uptake in forest ecosystems
sponse. Yu et al. (2018) included the P cycle in the ForSAFE      with limited N availability. CoupModel v5 assumes that car-
field-scale biogeochemical model to study the P budget of         bohydrates provided by plants are the primary driver of my-
a southern Swedish spruce forest site. They concluded that        corrhizal responses to N availability and that fungal uptake
internal turnover from mineralisation of soil organic mat-        of N will influence host plant photosynthesis. We argued that
ter affects the P supply more than weathering. Fleischer et       terrestrial ecosystem models that explicitly consider mycor-
al. (2019) demonstrated that four CNP models, when applied        rhizal interactions should also take into account P cycling due
to the Amazon forest, provide up to 50 % lower estimates          to the significant role of symbiont mycorrhiza for P uptake in
of the eCO2 -induced biomass increment than the 10 coupled        P-limited environments. For this reason, we developed a new
C–N models. They suggested that the inclusion of flexible         version of CoupModel that includes the P cycle.
tissue stoichiometry and enhanced plant P acquisition could          The overall objective of this study was to improve the cur-
improve the ability of terrestrial ecosystem models to simu-      rent understanding of C, N, and P cycle interactions in for-
late C-P cycle coupling.                                          est ecosystems by presenting a new scheme for modelling
   Most terrestrial plants live in symbiosis with mycorrhizal     P dynamics. More specifically, the study had the following
fungi to increase the uptake capacity of P, among other nu-       aims: (1) to present the new CoupModel v6.0, which explic-

Geosci. Model Dev., 14, 735–761, 2021                                               https://doi.org/10.5194/gmd-14-735-2021
H. He et al.: CoupModel (v6.0)                                                                                                     737

itly includes the P cycle and interactions between the N and
P cycles; (2) to estimate the regional C, N, and P budgets of
Swedish forests along a climatic and fertility gradient; and
(3) to demonstrate how soil N and P availability influence
growth, soil C, and nutrient leaching. Hence, we present a
new version of CoupModel (v6.0), hereafter referred to as
Coup-CNP, which explicitly simulates the P cycle. The key
features of the new Coup-CNP model are (1) coupled C,
N, and P dynamics; (2) explicit representations of symbio-
sis between plant roots and mycorrhiza, along with implicit
routes through which non-symbiotic microbes contribute to
N and P uptake from the soil; (3) flexible CNP stoichiometry
for plant components, soil organic matter, and symbiotic mi-
crobes; (4) dynamic nutrient demand and uptake, as well as
photosynthesis and growth rates, all of which are regulated
by N and P availability; and (5) simultaneous uptake of nu-
trients to roots or symbiotic mycorrhizae from both inorganic
and organic pools. The Coup-CNP model was evaluated us-
                                                                   Figure 1. Conceptual figure of the simplified Coup-CNP and its re-
ing four forest regions situated along a climatic and fertility    lationship to the N cycle. The green pools represent plant-symbiotic
gradient in Sweden that has been considered previously by          microbes (e.g. mycorrhiza fungi), while brown pools represent soil
He et al. (2018) and Svensson et al. (2008).                       organic matter, grayish-yellow pools represent water solutions, and
                                                                   blue pools represent soil inorganic P. Within the pools, Croot stands
                                                                   for coarse roots and Froot stands for fine roots.
2     Description of model structure and phosphorus
      model
                                                                   tion, water uptake, and soil N (Jansson and Karlberg, 2011).
2.1    Brief description of CoupModel (v5)                         The model and technical description (Jansson and Karlberg,
                                                                   2011) is freely available at http://www.coupmodel.com (last
The CoupModel platform (coupled heat and mass trans-               access: 2 December 2020). Furthermore, Jansson (2012) has
fer model for soil–plant–atmosphere systems) is a process-         previously presented CoupModel use, calibration, and vali-
based model designed to simulate water and heat fluxes,            dation, while He et al. (2018) introduced an explicit plant–
along with C and N cycles, in terrestrial ecosystems (Jans-        mycorrhizal representation (CoupModel v5).
son, 2012). The main model structure is a one-dimensional,
vertical model, with one or two layers of vegetation (e.g. a       2.2   Phosphorus cycle representation in CoupModel
tree and field layer, as in this application) on a multi-layered         (v6.0)
soil profile. The core of the model consists of five sets of
coupled partial differential equations that cover water; heat;     Coup-CNP was extended with P cycle representation to en-
and C, N, and P cycles (the latter is only included in v6.0).      able simulations of coupled C, N, and P dynamics for terres-
They are numerically solved using an explicit forward dif-         trial ecosystems while explicitly considering the symbiosis
ference model scheme (Euler integration; for more details,         between soil microbes and plant roots. Coup-CNP has P state
see p. 400–401 in Jansson and Karlberg, 2011), which means         variables and fluxes representing different plant parts, sym-
that the current size of a state variable is calculated based on   biotic microbes, soil organic P forms (Po , P that is bound to
fluxes to and from the state variable during the previous time     organic C in the soil), and soil inorganic P forms (Pi ) (Fig. 1).
step. In this application, we used a daily time step for each      To clarify the coupling between C, N, and P cycles, the C and
equation, although a smaller time step was applied for the         N state variables and major N and N+P fluxes are given in
water and heat calculations during specific events represent-      Fig. 1.
ing peaks in water and/or heat flow, e.g. snow melting, to            P within plants is partitioned into grain, leaf, stem, coarse
ensure numerical stability and accuracy. The model is driven       root, and fine root, in addition to P in symbiotic microbes,
by climatic data – precipitation, air temperature, relative hu-    which is analogous to how C and N are represented in Coup-
midity, wind speed, and global radiation, i.e. the sum of di-      Model v5.0 (Fig. 1). In this paper, we use mycorrhizal fungi
rect and diffuse shortwave incoming radiation – and can sim-       as the main representation of plant–microbe symbiosis; the
ulate ecosystem dynamics with daily resolution. Vegetation         same concept is also applicable for other symbiosis mi-
is described using the “multiple big leaves” concept, i.e. two     crobes. Soil organic P is divided into three state variables
vegetation layers (trees and understorey plants) are simulated     in every soil layer – litter (PLitter ), humus (PHumus ), and dis-
taking into account mutual competition for light intercep-         solved organic (PDOP ) – which is analogous to how C and N

https://doi.org/10.5194/gmd-14-735-2021                                                  Geosci. Model Dev., 14, 735–761, 2021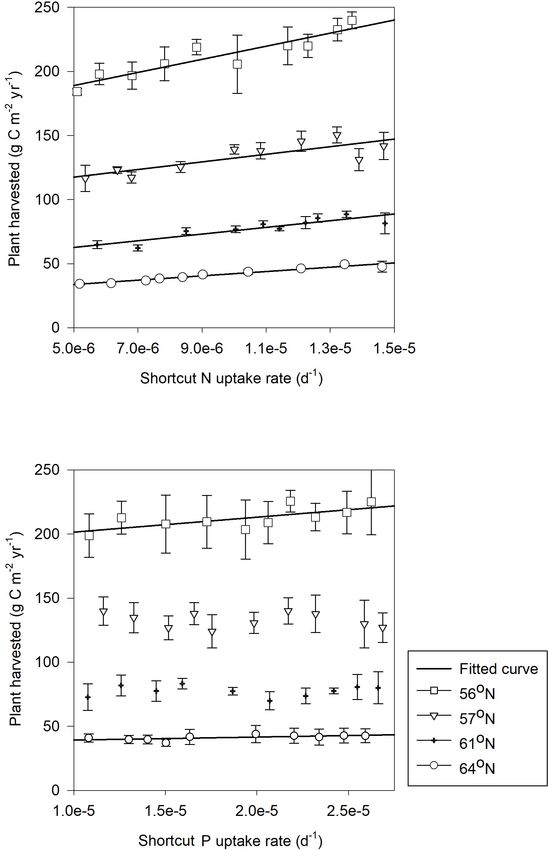
738                                                                                               H. He et al.: CoupModel (v6.0)

are represented in CoupModel v2.0 (Fig. 1). Non-symbiosis         bulk density of each soil layer (g cm−3 ), and 1zlayer is the
microbes are implicitly included in litter. Soil inorganic P      thickness of the simulated soil layer (m).
is represented by both new and renewed state variables. A            The temperature effect can be expressed as an Arrhenius
new state variable is soil solid inorganic P, Psolid , which is   function (3), where Ea,wea is the activation energy parameter
a lumped pool containing primary and secondary mineral            (J mol−1 ) for minerals (i.e. apatite; available from empirical
compounds containing P, such as apatite (and occluded P)          studies), R is the gas constant (J K−1 mol−1 ), Ts is the simu-
(Smeck, 1985; Wang et al., 2007). Pilab is the sum of phos-       lated soil temperature in ◦ C, Ts,0 is a parameter (◦ C) that nor-
phate ions absorbed by soil and those in soil solution, which     malizes the function f (Ts ) = 1, and Tabszero is −273.15 ◦ C.
follows how the mineral pool is represented in the salt tracer
                                                                                 E

module of CoupModel (Gärdenäs et al., 2006). Instantaneous                      − a,wea
                                                                                   R × Ts +T
                                                                                             1
                                                                                                       −T         1
                                                                  f (T ) = e                 abszero        s,0 +Tabszero         (3)
equilibrium between adsorbed and soil solution P is assumed.
Plants and microbes take up phosphate ions from the Pilab         Alternatively, the existing Ratkowsky function, O’Neill func-
pool. Pisol , which is an intrinsic part of Pilab , can be com-   tion, or Q10 method can be used to determine the temperature
pared with the sum of the N state variables NH+      4 and NO3
                                                              −
                                                                  response in CoupModel.
(Fig. 1).                                                            The effect of soil pH on weathering can be calculated as
   We developed the P model in a way that (1) focuses on          follows:
the P processes that are most relevant to biogeochemical cy-
cling, e.g. dynamic plant growth and P leaching, and (2) fol-     f (pH) = 10nH ×|pHopt −pH| ,                                    (4)
lows the conceptual structure of CoupModel as closely as          where nH is a parameter that describes the sensitivity of the
possible. The P processes that are relevant to biogeochemi-       soil to pH changes when it deviates from pHopt , an optimal
cal cycling are described in more detail below. Appendix A        pH value for weathering (Table 3).
further describes processes that are analogous to those of the
N cycle, e.g. atmospheric deposition, fertilisation (Sect. A1),   2.2.2   Inorganic soluble phosphorus dynamics
mineralisation–immobilisation (Sect. A2), plant growth and
uptake (Sect. A3), litterfall (Sect. A4), leaching and surface    When Pi is added to a soil ecosystem, the soluble (Pisol ) and
runoff (Sect. A5), and removal of plant harvest (Sect. A6).       adsorbed P pools reach equilibrium in less than 1 h (Cole et
For simplicity, the equations are given in a form that reflects   al., 1977; Olander and Vitousek, 2005). As a daily time step
one time step and one of the layers of the entire soil profile.   is applied to this model, we assume that Pisol and the ad-
This paper has been formatted in a way that conforms to the       sorbed part of Pilab are always in equilibrium (Eq. 5). The
CoupModel nomenclature; more specifically, a capitalised P        modified Langmuir isotherm (Barrow, 1979) was used to
refers to state variables while a lower case p refers to param-   model the fast and reversible sorption process within Pilab .
eters that are related to P processes.
                                                                                                Pisol
                                                                  Pilab,con = pmax,ads ×                                          (5)
2.2.1   Weathering                                                                         c50,ads + Pisol

During weathering soil solid inorganic P (Psolid ) is trans-      Here Pilab,con is the concentration of labile pool
formed into labile P (Pilab ) (Fig. 1; Eq. 1). The weather-       (g P g soil−1 ), pmax,ads is the maximum sorption capac-
ing rate depends on soil pH and temperature (Guidry and           ity of the labile pool (g P g soil−1 ), and c50,ads is an
Machenzie, 2000) and is calculated as follows:                    empirical parameter corresponding to 50 % of P sat-
                                                                  uration (g P m−2 ) (Table 3). It should be noted that
Psolid → ilab = kw × f (Ts ) × f (pH) × Psolid ,           (1)    Pilab,con can also be calculated using Eq. (2) as follows:
                                                                  Pilab,con = Pilab /(ρbulk × 1zlayer × 106 ).
where Psolid → ilab is the flux rate of weathering
(g P m−2 d−1 ), and kw is a first-order integrated weath-         2.2.3   Soil inorganic phosphorus dynamics and nutrient
ering rate coefficient (d−1 ) that depends on lithology, rates            shortcut uptake
of physical erosion, and soil properties (Table 3). The
erosion affects the weathering rate by reducing the pool size     Atmospheric P deposition is assumed to directly flow into
of Psolid (Eq. A14). f (Ts ) and f (pH) are response functions    the labile inorganic P pool (Pilab ) in the uppermost soil layer
of soil temperature and pH, respectively, while Psolid is the     (Eq. A1 in Appendix A). If mineral Pi fertiliser is applied at
size of the Psolid pool (g P m−2 ), determined by                 the soil surface, the Pi first enters an undissolved fertiliser
                                                                  pool, after which Pi from this pool gradually dissolves into
Psolid = δP × ρbulk × 1zlayer × 106 ,                      (2)    the labile P pool following a decay-type function (Eq. A1). P
                                                                  can also be added as an external organic substrate (faeces or
where δP is the prescribed Psolid content for each soil layer     manure). In this case, P moves to the surface faeces (Pofae ),
(g P g dry soil−1 ), with reported ranges from 1 × 10⁻⁴ to        litter (PLitter ), and labile (Pilab ) P pools according to the com-
1.5 × 10⁻³ g P g soil−1 (Yang et al., 2014), ρbulk is the dry     position of the manure. Pi within Pisol and dissolved organic

Geosci. Model Dev., 14, 735–761, 2021                                                 https://doi.org/10.5194/gmd-14-735-2021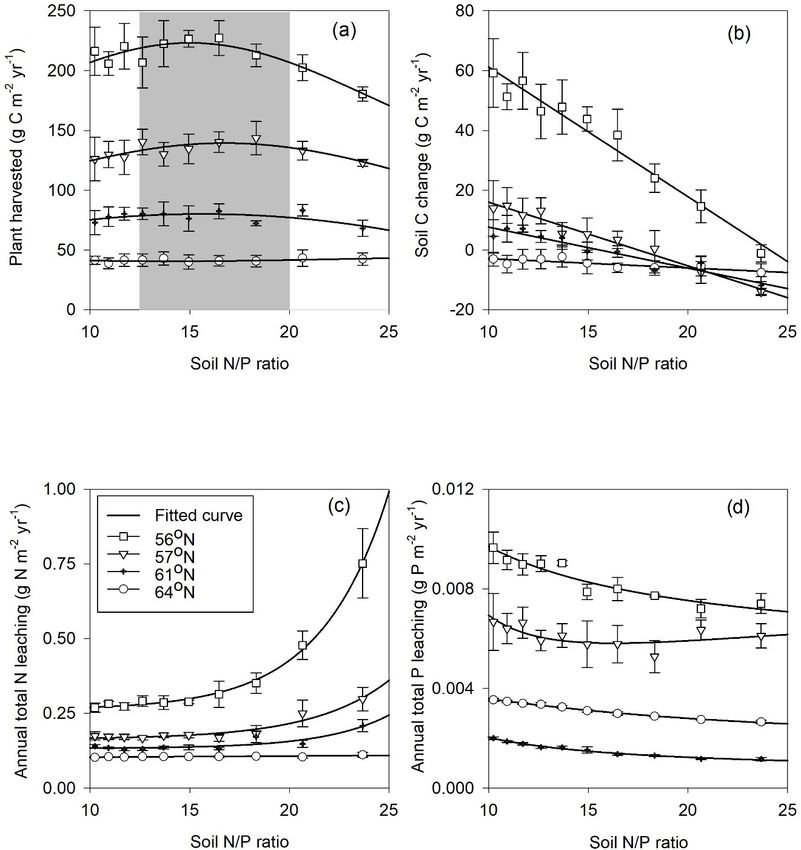
H. He et al.: CoupModel (v6.0) 739
P (PDOP ) can be transported by water flows between layers or linearly until it reaches zero.
from a layer to a drainage outlet (Eqs. A12–13). The soil sur-
f (C/Pleaf ) =
face layer may also lose solid inorganic P (Psolid ) by erosion,
which is driven by surface runoff (Eq. A14). 1 C/Pleaf < pCP,opt
C/Pleaf −pCP,opt
P mineralisation is conceptually divided into biologi- 1 + ( pCP,opt −pCP,th )
pCP,th ≤ C/Pleaf ≥ pCP,opt (8)
0 C/Pleaf > pCP,th
cal and biochemical mineralisation (Eqs. A2–A6) following
McGill and Cole (1981). Biological mineralisation, which Here C/Pleaf is the actual leaf C/P ratio and pCP,opt and
is regulated by temperature and moisture, represents the pCP,th are parameters that vary between plant species (Ta-
microbe-mediated oxidation of organic matter, during which ble 3). The leaf C/P ratio is calculated at each time step using
nutrients (P and N) are immobilised by non-symbiotic mi- the leaf state variables C and P.
crobes or transferred from litter to humus (Fig. 1; Eq. A2).
Biochemical mineralisation, on the other hand, describes the 2.2.5 Symbiotic mycorrhizal fungal growth and
release of Pi through extracellular enzymatic action (e.g. phosphorus dynamics
phosphatases from root exudates), which is driven by plant
demand for nutrients (Richardson and Simpson, 2011). In The following section describes the fungal processes that are
Coup-CNP, biochemical mineralisation is conceptually in- specific to P. Plant C allocation to mycorrhizal fungi is influ-
cluded in the shortcut uptake of nutrients (called organic up- enced by soil Pi concentrations. We thus introduce a response
take in earlier CoupModel publications) and assumed to be function fa→fungi (Pi ) to account for reductions in plant C al-
driven by the unfulfilled plant P demand after Pilab root up- location to mycorrhizal fungi when soil Pi concentrations are
take (Eq. A8) but is regulated by the availability in other P high, which is analogous to the N response function in He et
pools (i.e. shortcut uptake coefficients in Eq. A4). The as- al. (2018),
sumption is that under P-limited conditions, plant roots and 2 3
symbiotic fungi bypass Pilab and obtain mineralised Pi di- fa→fungi (Pi ) = e(−pavail ×Pisol ) , (9)
rectly from organic PLitter and PHumus (Fig. 1; Eq. A4).
where Pisol is the total soluble Pi in the soil (g P m−2 ) (Eq. 5),
2.2.4 Plant growth under phosphorus and nitrogen and pavail is a reduction parameter (m4 g−2 P) (Table 3). Ac-
limitation cording to Bahr et al. (2015), mycorrhizal fungal biomass
decreases when either N or P is added to the system, while
Plant photosynthesis is modelled by a “light use efficiency” the addition of both N and P leads to the most significant
approach (Monteith, 1965, Eq. 6). We adopted Liebig’s law decrease. These multiple responses were integrated into the
of the minimum to simulate how plants respond to multiple model so that potential fungal growth would decline as a re-
nutrient stress (Liebig, 1840). This approach assumes that sult of either increasing soil N or P.
the nutrient (N, P) that has the smallest supply relative to the
corresponding plant demand will limit growth (Eq. 7). Ca→fungi,max = Ca→root × pfmax
× (fa→fungi (Pi ) × fa→fungi (N )) (10)
Eta
Ca→plant = εL × f (Tleaf ) × f (nutrient) × f × RS (6)
Etp Here Ca→fungi,max is the defined maximum C flow that plants
f (nutrient) = min (f (C/Nleaf ) ; f (C/Pleaf )) , (7) allocate to fungi (g C m−2 d−1 ), Ca→root is the total C allo-
cated to both root and mycorrhiza (g C m−2 d−1 ) (Eq. A10),
where Ca→plant is the plant carbon assimilation rate pfmax is a parameter that defines the maximum C fraction
(g C m−2 d−1 ); εL is the coefficient for radiation use effi- allocated to mycorrhiza from the total root and mycorrhiza
ciency (g C J−1 ); f (Tleaf ), f (nutrient), and f (Eta /Etp ) are C pool (Table 3), and fa→fungi (Pi ), and fa→fungi (N ) are re-
response functions of leaf temperature, leaf nutrient status sponse functions that describe how soil N and P availability
(Nleaf , Pleaf ) in proportion to its C content, and water, respec- regulates maximum mycorrhizal fungal growth (Eq. 9).
tively; and Rs represents radiation absorbed by the canopy The actual growth of mycorrhizal fungi, Ca→fungi
(J m−2 d−1 ). Details concerning f (Tleaf ), f (Eta /Etp ), as (g C m−2 d−1 ), is limited by the defined maximum growth,
well as growth and maintenance respiration, can be found Ca→fungi,max (Eq. 10) calculated as follows:
in Jansson and Karlberg (2011). Plant demand for nutrients
was estimated through defined optimum ratios (Eq. A9). The Ca→fungi = min ((Croot × pfopt ) − Cfungi )
nutrient response function f (nutrient), which includes P, is
×min(f (Nsupply ); f (Psupply )) ; Ca→fungi,max , (11)
described below.
As is the case with N, the photosynthetic process responds where Croot is the total root C content (g C m−2 ), pfopt is the
to the leaf C/P ratio, a dynamic which has been modelled defined optimum ratio parameter between fungal and root
by Ingestad and Ågren (1992). Hence, photosynthesis is not C content (Table 3), Cfungi is the total C content of fungi
limited by P below an optimum C/P ratio (pCP,opt ), while (g C m−2 ), and f (Nsupply ) and f (Psupply ) are response func-
between pCP,opt and pCP,th the response function decreases tions of fungal growth to the amount of N and P (both uptake
https://doi.org/10.5194/gmd-14-735-2021 Geosci. Model Dev., 14, 735–761, 2021740 H. He et al.: CoupModel (v6.0)
from inorganic pools and shortcut uptake from organic pools) 2.2.6 Phosphorus uptake by mycorrhizal fungi
transferred from fungi to plants (Eq. 12). In this way, mycor-
rhizal fungal growth is also influenced by how efficiently the The total and partial uptake of P by mycorrhizal fungi is cal-
fungi transfer nutrients to the host plant (Eq. 11). The model culated in a way that is analogous to how He et al. (2018)
follows the assumption that plants provide fungi with C as calculated N uptake by mycorrhizal fungi,
long as their investment is outweighed by the benefits (i.e.
acquired N or P) (Nasholm et al., 2013; Nehls, 2008). We Psoil→fungi = Pilab→fungi +PLitter→fungi +PHumus→fungi . (18)
further assume the C investment will be limited by the mini- The mycorrhiza is further distinguished into the mycelia, re-
mum nutrient supply efficiency provided by fungi. f (Psupply ) sponsible for N and P uptake (both in inorganic forms and
is calculated as follows: nutrient shortcut from organic pools), and the fungal mantle,
f (Psupply ) = which covers the fine-root tips (He et al., 2018). Pilab up-
(
1 take is first limited by the potential uptake rate Pilabpot→fungi
Pfungi→plant,th ≤ Pfungi→plant
Pfungi→plant
Pfungi→plant,th > Pfungi→plant (12) (g P m−2 d−1 ), which is determined by the biomass of fungal
Pfungi→plant +Pilab→root
mycelia,
Pfungi→plant,th = pfth × (Pfungi→plant + Pilab→root ), (13)
Pilabpot→fungi = pi,rate × Cfungi × pfmyc , (19)
where Pfungi→plant,th is the defined threshold rate of fungal
P supply (g P m−2 d−1 ), below which plant C investment is where Pilabpot→fungi describes the potential fungal Pi uptake
limited, and pfth is a threshold fraction determined by fungal rate (g P m−2 d−1 ), pi,rate is a parameter that describes the
and plant species (Table 3). Pfungi→plant is the actual myc- potential mycorrhizal fungal uptake rate of Pi per unit Cfungi
orrhizal fungal P supply to the plant (g P m−2 d−1 ) (Eq. 16), (g P g C−1 d−1 ) (Table 3), and pfmyc is the fraction of fungal
and Pilab→root describes plant uptake by roots (g P m−2 d−1 ) mycelia in total fungal biomass (Table 3).
(Eq. A8). The actual fungal uptake of Pilab , Pilab→fungi
P in the fungal biomass, Pfungi (g P m−2 ), is calculated as (g P m−2 d−1 ), is calculated based on the potential up-
follows: take rate (Eq. 19), which is further regulated by soil Pilab
availability,
Pfungi = Psoil→fungi − Pfungi→litter − Pfungi→plant , (14)
If Pilabpot→fungi ≤ Pilab × f (Pfungiavail ),
where fungal P litter production (Pfungi→litter , g P m−2 d−1 ) is
Pilab→fungi = Pilabpot→fungi × f (Pfungidef )
estimated from a first-order rate equation,
If Pilabpot→fungi > Pilab × f (Pfungiavail ,
Pfungi→litter = Pfungi × plrate × (1 − pfret ), (15) Pilab→fungi = Pilab × f (Pfungiavail ) (20)
where Pfungi stands for fungal P content (g P m−2 ), plrate is where f (Pfungiavail ) is an availability function determining
the litterfall rate parameter (d−1 ) (Table 3), and pfret is a pa- the fraction of Pilab that fungi can directly obtain (Eq. 21)
rameter describing the fraction of P retained in fungal tissue and f (Pfungidef ) is the function determining the deficiency
during senescence (Table 3). fraction that fungi can possibly uptake, which is determined
P transfer from mycorrhizal fungi to plants, Pfungi→plant by the fungal C/P ratio (Eq. 22),
(g P m−2 d−1 ), is driven by plant P demand (Eq. A9) after
root uptake (Eq. A8) but is regulated by P availability to f (Pfungiavail ) = piavail × uptf,enh , (21)
fungi,
where piavail defines the fraction of Pilab that can be directly
Pfungi→plant = obtained by roots (Table 3; see also Eq. A8), uptf,enh is an
PDemand − Pilab→root PDemand − Pilab→root ≤ Pfungiavail
(16) enhanced uptake coefficient that accounts for the fact that
Pfungiavail PDemand − Pilab→root > Pfungiavail , fungal mycelia have higher uptake efficiency than roots (He
et al., 2018).
wherePfungiavail is the P that can be acquired by fungi and
The function of uptake deficiency fraction, f (Pfungidef ),
transferred to the plant (g P m−2 ), calculated as follows:
scales the unfulfilled capacity of fungi for P uptake and is
Cfungi calculated as follows:
Pfungiavail = Pfungi − , (17)
pcpfungimax pcpfungimax
f (Pfungidef ) = 1 − , (22)
Cfungi /Pfungi
where Pfungi is fungal P content (g P m-2) and pcpfungimax is a
parameter describing the predefined maximum C/P ratio of where pcpfungimin is the defined minimum fungal C/P ratio
fungal tissue (Table 3). This is based on the assumption that parameter (Table 3).
mycorrhizal fungi will only supply the plant with P as long In our model, we assume that Pi derived from the enzy-
as fungal C demand is fulfilled (Nehls, 2008). matic hydrolysis of organic Po is directly taken up by fungi
Geosci. Model Dev., 14, 735–761, 2021 https://doi.org/10.5194/gmd-14-735-2021H. He et al.: CoupModel (v6.0) 741
(termed nutrient shortcut uptake in this study). Similar to (57◦ N), and Skåne (56◦ N) – situated along a climatic, N
Pilab→fungi (Eq. 20), fungal uptake of PLitter is first limited by and P deposition, and fertility gradient across Sweden. These
the potential uptake rate PLitterpot→fungi (g P m−2 d−1 ), which are the same four regions that were investigated by Svens-
is determined by the biomass of fungal mycelia. son et al. (2008) and He et al. (2018). An overview of
the climatic, geological, plant, and soil characteristics of
PLitterpot→fungi = pLitter,rate × Cfungi × pfmyc (23) the four regions is provided in Table 1. In general, the
Here pLitter,rate is a parameter that describes the poten- four regions represent a north–south transect characterised
tial rate at which fungal mycelia acquire P from soil litter by increasing mean air temperature (from 0.7 to 7.1 ◦ C),
(g P g C−1 d−1 ) (Table 3). The actual uptake from PLitter to precipitation (613–838 mm), and atmospheric N deposition
fungi, PLitter→fungi (g P m−2 d−1 ), is calculated by (1.5–12.5 kg N ha−1 yr−1 ). The measured annual P deposi-
tion ranges from 0.06 to 0.28 kg P ha−1 , with the lowest and
If PLitterpot→fungi < pLitterf × PLitter , highest deposition rates observed in the 61 and 57◦ N re-
gions, respectively. To ensure comparability, all sites selected
PLitter→fungi = PLitterpot→fungi × f (Pfungidef ) × fracP,lit
in the four regions are characterised by podzol soil (Jahn et
If PLitterpot→fungi ≥ pLitterf × PLitter , al., 2006) and dominated by Scots pine (Pinus sylvestris)
PLitter→fungi = pLitterf × PLitter × fracP,lit (24) and/or Norway spruce (Picea abies) (Table 1). Soil fertil-
ity, indicated by C-to-nutrient ratios, exhibited an increasing
where pLitterf is the nutrient shortcut uptake parameter that trend from north to south; however, the highest soil organic
describes the uptake rate of soil litter PLitter that can be C/P ratio (thus the poorest P content) was measured in the
hydrolysed and directly acquired by fungi (d−1 ) (Table 3), 61◦ N region (Table 1). Soil mineral P content varied with
fracP,lit is introduced to ensure that fungal nutrient shortcut geology (Table 1). The aqua regia extraction method was
uptake is less than the missing plant demand after Pilab up- used to determine total soil mineral P content from regional
take, as well as to avoid uptake from only one organic pool, till samples collected by the Geological Survey of Sweden
calculated as follows: (SGU) (Andersson et al., 2014). Samples were taken from the
Pof,max = PLitter C horizon at a depth of approximately 0.8 m, where the till is
n × pLitterf + PHumus × pHumusfo
PDemand −Pilab→plant PLitter ×pLitterf (25) generally not disturbed by weathering. In general, Swedish
fracP,lit = min Pof,max ; Pof,max ,
till soils belong to the youngest and least weathered soils in
where pHumusf is the fungal nutrient shortcut uptake param- Europe. High total mineral P contents can be found in the
eter that describes the uptake rate of soil humus PHumus that southern (i.e. 57 and 56◦ N) and northern parts of the coun-
can be hydrolysed and directly acquired by fungi (d−1 ). The try (i.e. 64◦ N), which include apatite and iron ore districts
same approach can be used to quantify fungal P uptake from (Table 1). Total mineral P content in central Sweden (e.g.
the humus pool by replacing terms that include the litter P 61◦ N) is much lower than in other parts due to the occur-
pool with the humus P pool in Eqs. (23), (24), and (25). rence of marine and postglacial clays that cover, for example,
The fungal mantle prevents contact between roots and the the Mälaren region.
soil and thereby limits the rate at which roots can directly
acquire nutrients from the soil. The plant root Pi uptake re- 3.2 Datasets for model evaluation
sponse to P availability and the fungal mantle is calculated as
follows Literature data concerning tree biomass, leaf nutrient con-
tent, water flow and P leaching were compiled from sites rep-
f (Piavail ) = piavail × e(−fm×m) , (26) resenting coniferous forests on Podzol soil within the major
moisture classes (mesic and moist), according to the Swedish
where piavail is a parameter that describes the maximum National Forest Soil Inventory (NFSI) (Olsson et al., 2009;
fraction of Pilab that is available for uptake by plant roots, Stendahl et al., 2010). The corresponding forest biomass data
(Eq. A8) (i.e. not covered by the fungal mantle), fm is an were based on measured standing stock volumes of different
uptake reduction parameter that describes cover by the fun- age classes presented in the Swedish Forest Inventory (SFI)
gal mantle, and m is the mycorrhisation degree; see He et (SLU, 2003); for more details, see Svensson et al. (2008).
al. (2018). The leaf nutrient data used in the evaluation were based on
measurements from forest monitoring sites of the Swedish
3 Description of the region used for simulation and Forest Agency (Wijk, 1997; Akselsson et al., 2015) that rep-
model setup resented the studied regions (some forest sites are also part
of the ICP FOREST LEVEL II monitoring programme, http:
3.1 Description of the region //www.icp-forests.org, last access: 20 June 2019). The data
representing the northern 64◦ N region include two Scots
The Coup-CNP model was tested on four managed forest pine stand sites: Gransjö (64◦ 300 N, 17◦ 240 E) and Brattfors
regions – Västerbotten (64◦ N), Dalarna (61◦ N), Jönköping (64◦ 290 N, 18◦ 280 E). The 61◦ N region was represented by
https://doi.org/10.5194/gmd-14-735-2021 Geosci. Model Dev., 14, 735–761, 2021742 H. He et al.: CoupModel (v6.0) Table 1. Overview of climatic, geological, plant, and soil characteristics of the four forest regions. Regional characteristics Västerbotten Dalarna Jönköping Skåne Latitude 64◦ N 61◦ N 57◦ N 56◦ N Mean annual air temperature (◦ C)a 0.7 3.3 5.2 7.1 Mean annual precipitation (mm)a 613 630 712 838 Annual N deposition (kg N ha−1 )b 1.5 3.5 7.5 12.5 Annual P deposition (kg P ha−1 )b 0.13 0.06 0.28 0.23 Studied soil type Podzol Podzol Podzol Podzol Quaternary deposit, SGUc Glacial till Glacial till Glacial till Glacial till Bedrock geology, SGUc Gneiss Sandstone, Rhyolite Gneiss Gneiss Solid inorganic P content of till (mg kg−1 )d 881 428 859 773 Major tree species: pine/spruce/broadleaved trees (%)f 45/37/16 49/40/9 31/54/13 12/46/41 Rotation period (years) 120 110 90 70 Years in which thinning is performed (first/second/third thinning)h 50/100 40/90 25/40/70 25/40/55 Measured plant biomass for the 100-year age class (g C m−2 )f 5371 7815 10443 11501 Soil organic matter C/N (–)e 31.5 29.1 27.2 19.8 C/N humusb 43 40 31 25 Soil organic matter C/P (–)b 494 633 425 425 C/P humusb 325 400 410 550 Soil organic matter N/P (–) 15.7 21.8 15.6 21.5 Initial soil C (g C m−2 )f 7006 8567 9995 10 666 Litter C (g C m−2 )f 350 428 500 533 Humus C (g C m−2 )f 6655 8139 9495 10 133 Initial soil N (g N m−2 ) 223 295 367 539 Litter N (g N m−2 )f 11 15 18 27 Humus N (g N m−2 )f 212 280 349 512 Initial soil P (g P m−2 ) 14.2 13.5 23.5 25.1 Litter P (g P m−2 )g 0.7 0.7 1.2 1.3 Humus P (g P m−2 )g 13.5 12.8 22.3 23.8 Soil pHe 5.1 5.1 5.1 4.9 a The 30-year (1961 to 1991) annual average from regional SMHI stations. b N and P deposition data were obtained from the SWETHTRO project, while the soil organic C/P ratio was estimated with available Swedish Forest Agency data, and data of C/N and C/P humus were from the additional survey of Swedish Forest Agency. c Geological Survey of Sweden (SGU), https://apps.sgu.se/kartvisare/ (last access: 21 September 2019). d According to Geochemical Atlas of Sweden (2014), measured till samples from the C horizon, ca. 0.8 m below the soil surface. e Calculated based on Swedish Forest Soil Inventory data (SFSI, https://www.slu.se/en/Collaborative-Centres-and-Projects/Swedish-Forest-Soil-Inventory/, last access: 12 September 2019). f Svensson et al. (2008). g Assumption that 5 % of the total organic pool is litter and 95 % is humus, as reported for N in Svensson et al. (2008). h https://pub.epsilon.slu.se/9266/1/SkogsData2012_webb.pdf (last access: 12 September 2019). two sites with Scots pine stands: Kansbo (61◦ 70 N, 14◦ 210 E) PO4 . This means that the “measured DOP” may contain both and Furudalsbruk (61◦ 120 N, 15◦ 110 E). The 57◦ N region our simulated DOP fractions and particular phosphorus. We was represented by the Fagerhult (57◦ 300 N, 15◦ 200 E) site, used measured water outflow rates from the regional out- which is dominated by Norway spruce, and the Gynge Scots let from the Swedish Meteorological and Hydrological Insti- pine stand (57◦ 520 N, 14◦ 440 E). The data representing the tute (SMHI, https://vattenwebb.smhi.se/station/, last access: 56◦ N region comprised a Scots pine stand in Bjärsgård 2 October 2019) to convert the concentrations into fluxes. (56◦ 100 N, 13◦ 80 E), a Norway spruce stand in Västra Torup (56◦ 80 N, 13◦ 300 E), and a European Beech stand in Kam- 3.3 Model design and setup pholma (56◦ 60 N, 13◦ 300 E). To compare the model outputs with empirical measures The results were based on simulated forest development with of P leaching, PO4 and total P data in stream water were daily resolution over a rotation period from a stand age of obtained from the open database of environmental mon- 10 years to 10 years after final harvesting. The 10 years af- itoring data (MVM, https://miljodata.slu.se/mvm/, lsat ac- ter final harvesting, as per recommendations from Gärdenäs cess: 2 October 2019). Thus, the observations of P leach- et al. (2003), were included to cover potential nutrient leach- ing also contain P leaching from upstream sources. DOP ing during the regeneration phase. The trees across all of the was not measured for the regions; instead, DOP was cal- investigated regions were assumed to have been planted in culated as the difference between the measured total P and 1961; thus, the period from 1961 to 1970 was used as a spin- Geosci. Model Dev., 14, 735–761, 2021 https://doi.org/10.5194/gmd-14-735-2021
H. He et al.: CoupModel (v6.0)                                                                                                   743

up period. The harvesting intensities and rotation lengths         Fransson and Bergkvist, 2000). Soil pH was set according to
were specified for each region following recommendations           the NSFI data and kept constant over the simulation period
from SLU (2012). The simulated rotational period was 120,          (Table 1). The initial value of soil organic P for the soil profile
110, 90, and 70 years from the northern to southern regions,       was estimated based on measurements of soil organic mat-
respectively. Two thinnings were conducted in the two north-       ter N/P ratios from the same forest monitoring sites of the
ern regions, while three thinnings were conducted in the two       Swedish Forest Agency (Wijk, 1995; Akselsson et al., 2015)
southern regions (Table 1). Following general forest manage-       at which leaf nutrient content had been sampled. However,
ment guidelines, it was assumed that 20 % of the stems are         only the organic N/P ratio at the O horizon was measured
removed and that 5 % is transformed into litter during thin-       at most sites (Table 1). Thus, in our calculations of the total
ning (Swedish Forest Agency, 2005). For leaves and roots, it       stock of soil organic P, we assumed that the mean N/P ratio
was assumed that 25 % is transformed into litter. For all of       measured for the O horizon also extends to the other horizons
the regions, one clearance – during which 60 % of the stand        in the default model run. Model uncertainties associated with
is removed – was applied at the end of the spin-up period,         this assumption were assessed by including various soil N/P
i.e. when the stand is 10 years old. During final felling, 5 %     ratios (10–25) in the sensitivity analysis (e.g. Fig. 5).
of trees remain intact, and it was assumed that 90 % of the
stems are harvested – with 5 % becoming litter – and that all      3.5   Sensitivity analysis
of the leaves and roots become litter.
                                                                   The C and N parameters for these regions have been cali-
3.4   Model forcing and initial and boundary conditions            brated in previous versions of CoupModel (Svensson et al.,
                                                                   2008), while the parameters describing fungal processes, hu-
Historical weather data were derived from the nearby SMHI          mus decomposition rate, and shortcut N uptake rate from the
weather station data through spatial interpolation for each        humus pool were calibrated by He et al. (2018) (Table 2).
region. Projections of future weather data were generated          The surface cover parameters and litterfall rates of under-
by the climate change and environmental objective (CLEO)           storey vegetation were modified from Svensson et al. (2008)
project, using ECHAM5 projections and bias correction of           to achieve more realistic understorey dynamics for the anal-
regional climatic data (Thomas Bosshard, SMHI, personal            ysed regions (Table 3). Most of the default values of the
communication, 2019). Concerning P deposition, the P de-           newly introduced P parameters were derived from the lit-
position rate from each region (Table 1) was kept constant         erature (Table 3). For instance, the optimal leaf C/P ratios
over the simulation period, as was also the case for N depo-       for forest growth and the C/P ratios of individual plant com-
sition.                                                            ponents were obtained from empirical measurements from
   As was performed by Svensson et al. (2008), an 11.3 m           Swedish forests (e.g. Thelin et al., 1998, 2002). The weath-
deep soil profile containing 20 layers was simulated for all       ering and surface runoff parameters were defined according
four regions. An assumed constant heat flow was used to de-        to data from laboratory experiments (Guidry and Machenzie,
fine the lower boundary condition for heat, and no water flow      2000).
was assumed at the bottom soil layer. Part of the model setup         We conducted a global sensitivity analysis of vari-
and initial conditions, e.g. soil physical properties, drainage,   ous parameterisation schemes (n = 34) for the new Coup-
initial soil C content, and C/N ratio, followed what was re-       CNP model using a Monte Carlo-based sensitivity analysis
ported by Svensson et al. (2008), who also relied on National      method to assess the stability and robustness of the model
Swedish Forest Inventory (NSFI) data. He et al. (2018) ad-         with respect to its parameter values. The sampled parame-
ditionally described explicit mycorrhizal fungi settings. The      ters and their ranges (Table S1), model design, and global
following section will only describe the initial conditions for    sensitivity results (Tables S2, S3, S4) are reported in detail
the newly developed P model.                                       in the Supplement. Based on these simulations and parame-
   The two vegetation layers were initialised as bare ground       ter sensitivity rankings, we selected the three parameters that
with small amounts of C, N and P from the seedling phase           had the strongest effect on the model outcome to serve as the
to the start of vegetation growth. The initial solid inorganic     basis for a new set of model runs – which underlie the sensi-
P content, soil organic matter content, and soil stoichiom-        tivity analysis results discussed in this paper. These three pa-
etry conditions are reported in Table 1. The initial soil or-      rameters are initial soil humus P, the shortcut N uptake rate,
ganic P pool (Table 1) was partitioned between the soil lit-       and the shortcut P uptake rate (Tables S2, S3, Table 2), all of
ter (5 %) and humus pools (95 %), which is analogous to N          which strongly regulate soil N and P availability. The sensi-
partition in Svensson et al. (2008). The total amount of soil      tivity of plant growth, soil C, and leaching losses in response
organic P decreased exponentially with depth (Fransson and         to soil N and P availability was then assessed by varying the
Bergkvist, 2000). Litter and humus were assumed to be dis-         soil N/P ratio from 10 to 25 for the study regions (see Table 2
tributed down to depths of 0.5 and 1 m, respectively. The ini-     and Fig. 5). These ranges were set according to previously
tial labile Pi concentrations were set according to previous       published Swedish forest soil data (Lagerström et al., 2009;
data from similar Swedish forest sites (Kronnäs et al., 2019;      Giesler et al., 2002; Kronnäs et al., 2019) and additional soil

https://doi.org/10.5194/gmd-14-735-2021                                                  Geosci. Model Dev., 14, 735–761, 2021
744 H. He et al.: CoupModel (v6.0)
Table 2. Parameters with specific values for different regions.
Region Humus decomposition Shortcut P uptake rate Shortcut N uptake rate
rate, kh from humus pool from humus pool
(d−1 )a (d−1 )b (d−1 )a
Västerbotten 64◦ N 0.00048 1.5 × 10⁻⁵ 1.5 × 10⁻⁵
Dalarnas 61◦ N 0.00042 2.75 × 10⁻⁵ 1.2 × 10⁻⁵
Jönköpings 57◦ N 0.0004 1.0 × 10⁻⁵ 1.0 × 10⁻⁵
Skåne 56◦ N 0.00038 1.5 × 10⁻⁵ 0.5 × 10⁻⁵
a From He et al. (2018). b A high shortcut P uptake rate was assumed for regions with high soil organic matter C/P ratios
humus P data from the Swedish Forestry Agency inventory as the latitude decreases (Fig. 2). In terms of the climatic
(Table 1). The ranges of the shortcut uptake coefficients for variables, the radiation absorbed by the tree canopy increased
N and P were based on regional minima and maxima for N from north to south, while the temperature and water limita-
and P shortcut uptake rates (Table 2). tion of gross primary production (GPP) declined from north
to south (Table 4). Forest growth in the 64 and 57◦ N regions
were primarily limited by N, while forest growth in the 61
4 Results and 56◦ N regions was predominantly limited by P (Table 4).
The limiting effect of P availability could be seen in the rel-
4.1 Model assessment atively high predicted N/P ratios, as the 56◦ N region – and
to a lesser extent the 61◦ N region – showed high N/P ratios
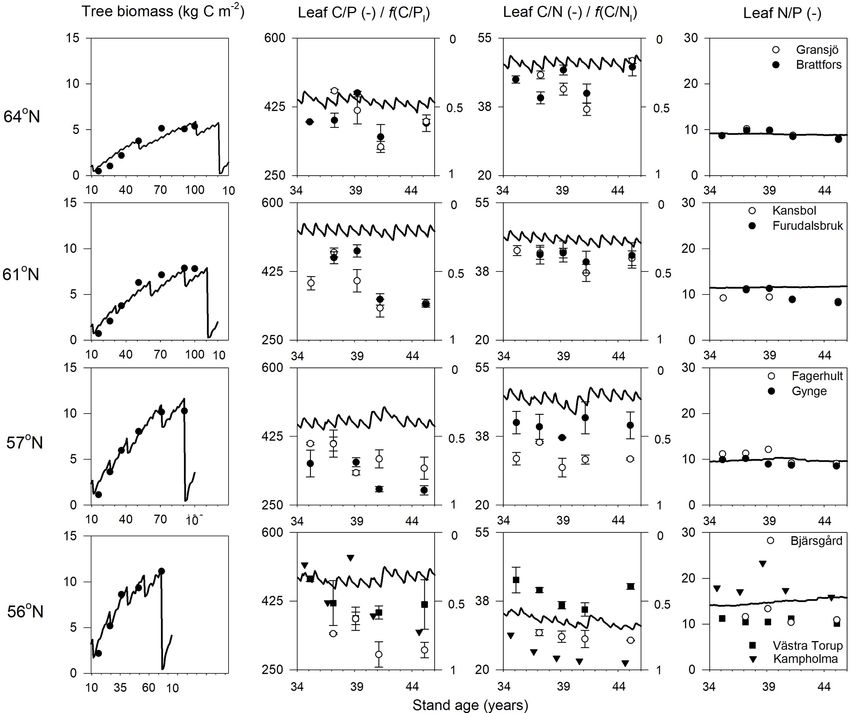
The new Coup-CNP model was able to reproduce the ob- (Fig. 2).
served development of forest tree biomass (SLU, 2003) over Total annual plant N and P uptake rates in the north-
the rotation period well (Fig. 2). It should be noted that the ernmost region were modelled to be 3.7 g N m−2 yr−1 and
dips in the simulated biomass are related to the timing of 0.4 g P m−2 yr−1 . The southernmost region demonstrated N
forestry operations in the model that are not represented in and P uptake rates that were 3 and 2 times higher, respec-
the empirical measurements. The regional biomass data show tively, than what was modelled for the northernmost region
an increasing trend from north to south, which the model cap- (Table 4). Total N uptake via shortcut uptake from the organic
tured clearly (Fig. 2). However, when the predictions were N pools decreased from north to south (Table 4). The mod-
compared with observed plant biomass prior to final harvest- elling results also indicated that shortcut uptake of P is nec-
ing, the model showed a slight underestimation (12 %) for essary to satisfy the demands of the plant. However, the frac-
the northern 61◦ N region and slight overestimations for the tion of total P uptake from the shortcut pathway was found
other regions (7 %, 13 %, and 1 % for the 64, 57, and 56◦ N to be associated with neither latitude nor C/N ratio. Instead,
regions, respectively). it is regulated by soil C/P ratio and geology (Tables 1 and
The simulated leaf C/P ratios agree fairly well with the 5). The contribution of fungi to total N litter production de-
available Swedish Forest Agency data (Wijk, 1997; Aksels- creased from north to south, but this was not the case for P, as
son et al., 2015), despite a general overestimation of 10 %, fungi contributed a stable amount to the P litter pool across
32 %, 30 %, and 21 % from north to south. The average mea- all four regions (Table 4).
sured leaf C/P ratio across the four regions was 396 (standard The simulated annual soil C sequestration rates were 2,
deviation 48), 398 (59), 355 (45), and 396 (72) from north to −2, 9, and 15 g C m−2 yr−1 from north to south, respectively
south. The model found that the 56 and 61◦ N regions have (Figs. 3a, 4a, Table 5). Thus, the soil C stock was generally
higher C/P ratios than the other regions, which can also be in a steady state over the forest rotation period, with slightly
seen from the observational data (Fig. 2). The average mea- higher C sequestration rates predicted for the southern re-
sured leaf C/N ratios across the four regions were 44 (4), gions (Figs. 3a, 4a). The soil C/N ratios of all of the regions
41 (3), 36 (5), and 31 (7) from north to south. As such, the were in a steady state over the forest rotation period. In con-
model provided accurate simulations of leaf C/N ratios and trast, the C/P ratios and N/P ratios showed a slightly increas-
captured a decreasing leaf C/N trend from north to south. ing trend over the rotation period, with the exception of the
The exception was a slight leaf C/N overestimation for the soil N/P ratio in the 64◦ N region (Fig. 3b, c, d).
57◦ N region (Fig. 2). Regarding leaf N/P ratios, the average The modelled P leaching generally reflected the observa-
values across the regions – from north to south – were 9.1 (1), tional data; however, the mean estimated concentrations were
9.6 (1.3), 9.9 (1.4), and 13.4 (3.8), respectively. As such, the often lower than the measurements available for each re-
Coup-CNP model was also able to accurately reproduce the gion (MVM, https://miljodata.slu.se/mvm/, last access: 2 Oc-
measured leaf N/P ratios, revealing that leaf N/P increases tober 2019, Table 6). It should be noted that the observed
Geosci. Model Dev., 14, 735–761, 2021 https://doi.org/10.5194/gmd-14-735-2021H. He et al.: CoupModel (v6.0) 745
Table 3. Parameters used for the default model run for the P processes with common values across all four studied regions. Note that the
same parameter values were applied for tree and understorey layers unless otherwise specified.
Symbol Parameter Equation Value Unit Reference
kw Integrated weathering rate (1) 8 × 10⁻⁷ d−1 Guidry and Machenzie, (2000);
Sverdrup and Warfvinge, (1993)
nH Weathering pH response coefficient (4) 0.27 –
pHopt Weathering pH response base coefficient (4) 7 –
pmax,ads Langmuir max sorption capacity (5) 0.0002 g P g soil−1 Adjusted from Wang et al. (2007)
c50,ads Langmuir half saturation coefficient (5) 5 × 10⁻⁵ g P m−2
pcp,opt C/P optimal (leaf) (8) 250 gC gP−1 Thelin et al. (1998, 2002)
pcp,th C/P threshold (leaf) (8) 600 gC gP−1
pavail Coefficient describing reduced C allocation (9) 0.0009 – Assumed
under P availability
pfopt The optimum ratio between C allocation be- (11) 0.22 – He et al. (2018); Orwin et al. (2011)
tween fungi and root
krm Fungal respiration coefficient 0.01 d−1
plrate Fungal litterfall rate (15) 0.0045 d−1
navail Coefficient describing reduced C allocation 0.00039 –
under N availability
pi,rate Potential unit fungal mycelia uptake rate for (19) 0.0001 g P g C−1 m−2 d−1 Smith and Read (2008)
PO4
nNH4 rate /nNO3 rate Potential unit fungal mycelia uptake rate for 0.0004 g N g C−1 m−2 d−1 He et al. (2018)
NH4 /NO3
nLitter,rate /nHumus,rate Potential unit fungal mycelia uptake rate for 0.00002 g N g C−1 m−2 d−1
organic N
pcpfungimax Fungal maximum C/P (17) 200 gC gP−1 Wallander et al. (2003); Zhang and
Elser, (2017)
piavail Maximum PO4 uptake fraction for roots (21) 0.008 –
pcpfungimin Fungal minimum C/P (22) 100 –
pLitter,rate /pHumus,rate Potential unit fungal mycelia uptake rate for (23) 0.00002 g P g C−1 m−2 d−1 Assumed to be the same as N
organic P
Soil organic P processes
cpm C/P of non-symbiotic microbes (A3) 350 gC gP−1 Manzoni et al. (2010)
Uptake demand of P
cpleaf,min Minimum C/P (leaf) (A9) 220 – Bell et al. (2014); Tang et al. (2018)
cpstem,min /cpcroot, min Minimum C/P for stem and coarse roots (A9) 4000/800 –
cproot, min Minimum C/P ratio (fine roots) (A9) 400 –
Plant litterfall processes
Leaf litterfall rate for understorey 0.0015 d−1 Calibrated
Plant surface cover
Maximum canopy cover, forest 0.8 m2 m−2 Assumed
Maximum canopy cover, understorey 1 m2 m−2 Assumed
Erosion
pbase P concentration scaling coefficient for sur- (A14) 2.7 × 10⁻⁶ mg L−1 Assumed
face erosion 1
p1 P concentration scaling coefficient for sur- (A14) 7 × 10⁻⁶ mg L−1
face erosion 2
qthr Critical surface flow rate for erosion (A14) 10 mm d−1
https://doi.org/10.5194/gmd-14-735-2021 Geosci. Model Dev., 14, 735–761, 2021746 H. He et al.: CoupModel (v6.0)
Figure 2. Simulated (lines) and measured (symbols) plant biomass and leaf C/P, C/N, and N/P ratios over the rotation period across the
four regions. The x axis denotes the stand age in years. The right axis of charts showing leaf C/P and C/N ratios shows the minimum
(f (nutrient)= 0) and optimum (f (nutrient)= 1) values in terms of nutrient response to gross primary production, respectively. Biomass data
and leaf nutrient data were from SFI (SLU, 2003) and the Swedish Forest Agency.
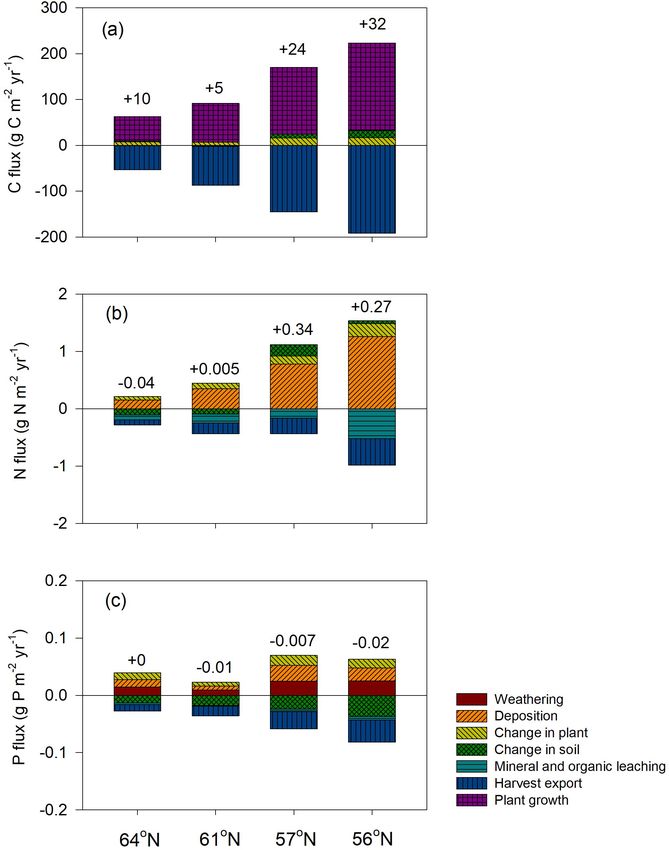
stream P concentrations include P from the entire watershed, 10 years after they had been harvested. Regarding the N bud-
whereas our model only includes upstream P sources. The get, the northernmost ecosystem showed a slight loss, while
data show that P losses through leaching were small com- the southern ecosystems showed N gains. The N seques-
pared to the internal fluxes, i.e. they account for approxi- tration rates generally increased towards the southern lati-
mately one-third of the annual deposition input, while DOP tudes (Fig. 4b). The P budget showed an opposite pattern, as
losses were more dominant in the northern systems (Table 6). the northernmost ecosystem was in balance while the other
However, the simulated proportion of DOP in total losses three ecosystems showed P losses, with total losses increas-
through leaching was much lower than what had been mea- ing from north to south (Fig. 4c).
sured, and the decreasing trend from north to south identified Most of the C captured from the atmosphere was stored
in the simulations was not supported by the observational in the harvested plants (Fig. 4a). Our model predicted small
data (Table 6). losses of dissolved organic carbon (DOC) through leaching,
and the forest soil in all of the regions was found to be in a
4.2 Modelled forest C, N, and P budgets quasi-steady state with generally low sequestration. An ex-
ception was the region with the lowest P-availability (61◦ N),
Regarding C assimilation, average plant growth over the ro- which showed soil C losses (Tables 1, 5).
tation period in the southernmost region was predicted to be Our results identified atmospheric deposition as the main
3 times higher than that of the northernmost region (Fig. 4a). N input. When accounting only for harvested N, 60 %, 53 %,
As most of the forest productivity was transformed into har- 35 %, and 36 % of the deposited N was removed from the 64,
vested products, the change in plant C was small, as the sim- 61, 57, and 56◦ N regions, respectively (Fig. 4b). The N ac-
ulation started when the plants were 10 years old and ended
Geosci. Model Dev., 14, 735–761, 2021 https://doi.org/10.5194/gmd-14-735-2021You can also read


