Mechanistic representation of soil nitrogen emissions in the Community Multiscale Air Quality (CMAQ) model v 5.1 - GMD
←
→
Page content transcription
If your browser does not render page correctly, please read the page content below
Geosci. Model Dev., 12, 849–878, 2019
https://doi.org/10.5194/gmd-12-849-2019
© Author(s) 2019. This work is distributed under
the Creative Commons Attribution 4.0 License.

Mechanistic representation of soil nitrogen emissions in the
Community Multiscale Air Quality (CMAQ) model v 5.1
Quazi Z. Rasool1,a , Jesse O. Bash2 , and Daniel S. Cohan1
1 Department    of Civil and Environmental Engineering, Rice University, Houston, Texas, USA
2 Computational    Exposure Division, National Exposure Research Laboratory, Office of Research and Development,
US Environmental Protection Agency, RTP, NC, USA
a currently at: Department of Environmental Science and Engineering, UNC-Chapel Hill, NC, USA

Correspondence: Quazi Z. Rasool (qzr1@email.unc.edu)

Received: 31 October 2018 – Discussion started: 13 November 2018
Revised: 7 February 2019 – Accepted: 11 February 2019 – Published: 27 February 2019

Abstract. Soils are important sources of emissions of              are the dominant source of NO emissions. We also assess
nitrogen-containing (N-containing) gases such as nitric ox-        how the new scheme affects model performance for NOx
ide (NO), nitrous acid (HONO), nitrous oxide (N2 O), and           (NO+NO2 ), fine nitrate (NO3 ) particulate matter, and ozone
ammonia (NH3 ). However, most contemporary air quality             observed by various ground-based monitoring networks. Soil
models lack a mechanistic representation of the biogeo-            NO emissions in the new mechanistic scheme tend to fall
chemical processes that form these gases. They typically           between the magnitudes of the previous parametric schemes
use heavily parameterized equations to simulate emissions          and display much more spatial heterogeneity. The new mech-
of NO independently from NH3 and do not quantify emis-             anistic scheme also accounts for soil HONO, which had been
sions of HONO or N2 O. This study introduces a mecha-              ignored by parametric schemes.
nistic, process-oriented representation of soil emissions of
N species (NO, HONO, N2 O, and NH3 ) that we have re-
cently implemented in the Community Multiscale Air Qual-
ity (CMAQ) model. The mechanistic scheme accounts for              1   Introduction
biogeochemical processes for soil N transformations such
as mineralization, volatilization, nitrification, and denitrifi-   Global food production and fertilizer use are projected to
cation. The rates of these processes are influenced by soil        double in this half-century in order to meet the demand from
parameters, meteorology, land use, and mineral N availabil-        growing populations (Frink et al., 1999; Tilman et al., 2001).
ity. We account for spatial heterogeneity in soil conditions       Increasing nitrogen (N) fertilization to meet food demand
and biome types by using a global dataset for soil carbon          has been accompanied by increasing soil N emissions across
(C) and N across terrestrial ecosystems to estimate daily          the globe, including in the United States (Davidson et al.,
mineral N availability in nonagricultural soils, which was         2012). N fertilizer consumption globally increased from 0.9
not accounted for in earlier parameterizations for soil NO.        to 7.4 g N per m−2 cropland yr−1 between 1961 and 2013,
Our mechanistic scheme also uses daily year-specific fertil-       with the US still among the top five N fertilizer users in
izer use estimates from the Environmental Policy Integrated        the world (Lu and Tian, 2017). US N fertilizer use increased
Climate (EPIC v0509) agricultural model. A soil map with           from 0.28 to 9.54 g N m−2 yr−1 during 1940 to 2015. In the
sub-grid biome definitions was used to represent conditions        past century, hotspots of N fertilizer use have shifted from the
over the continental United States. CMAQ modeling for May          southeastern and eastern US to the Midwest and the Great
and July 2011 shows improvement in model performance in            Plains comprising the Corn Belt region (Cao et al., 2017).
simulated NO2 columns compared to Ozone Monitoring In-             Recent studies have pointed to soils as a significant source
strument (OMI) satellite retrievals for regions where soils        of NOx emissions, contributing ∼ 20 % to the total budget
                                                                   globally and larger fractions over heavily fertilized agricul-

Published by Copernicus Publications on behalf of the European Geosciences Union.
850                                                Q. Z. Rasool et al.: Mechanistic representation of soil nitrogen emissions

tural regions (Jaeglé et al., 2005; Vinken et al., 2014; Wang      soil, vegetative, and environmental conditions (Cooter et al.,
et al., 2017).                                                     2012; Bash et al., 2013; Zhu et al., 2015).
   Despite the significance of NOx emissions generated by             NOx , NH3 , HONO, and N2 O are produced from both mi-
soil microbes, policies both globally and for the continental      crobial and physicochemical processes in soil N cycling, pre-
US (CONUS) have focused largely on limiting mobile and             dominantly nitrification and denitrification (Medinets et al.,
point fossil fuel sources of NOx (Li et al., 2016). Hence, it      2015; Parton et al., 2001; Pilegaard, 2013; Su et al., 2011).
is incumbent to strategize for the reduction of non-point soil     Nitrification is the oxidation of NH+           −
                                                                                                         4 to NO3 whereby inter-
sources of NOx emissions, especially in agricultural areas.        mediate species such as NO and HONO are emitted along
Recent studies have shown higher soil NOx , even in nona-          with relatively small amounts of N2 O as byproducts. Den-
gricultural areas like forests, to significantly impact sum-       itrification is the reduction of soil NO−  3 ; it produces some
mertime ozone in CONUS (Hickman et al., 2010; Travis et            NO, but predominantly produces N2 O and N2 (Firestone and
al., 2016). Consequently, it is increasingly important to esti-    Davidson, 1989; Gödde and Conrad, 2000; Laville et al.,
mate both N-fertilizer-induced and nonagricultural NH3 and         2011; Medinets et al., 2015). The fraction of N emitted as NO
NOx emissions in air quality models.                               and HONO relative to N2 O throughout nitrification and den-
   Soil NO emissions tend to peak in the summertime, when          itrification depends on several factors: soil temperature; wa-
they can contribute 15 %–40 % of the total tropospheric NO2        ter filled pore space (WFPS), which in turn depends on soil
column in the continental CONUS (Williams et al., 1992;            texture and soil water content; gas diffusivity; and soil pH.
Hudman et al., 2012; Rasool et al., 2016). Summer is also the      HONO is produced during nitrification only and is a source
peak season for ozone concentrations (Cooper et al., 2014;         of NO and OH after undergoing photolysis (Butterbach-Bahl
Strode et al., 2015) and the time when photochemistry is           et al., 2013; Conrad, 2002; Ludwig et al., 2001; Oswald et
most sensitive to NOx (Simon et al., 2014). N oxides (NOx          al., 2013; Parton et al., 2001; Venterea and Rolston, 2000).
= NO + NO2 ) worsen air quality and threaten human health             Whether N2 O or N2 becomes dominant during denitrifica-
directly and by contributing to the formation of other pollu-      tion depends on the availability of soil NO−  3 relative to avail-
tants. NOx drives the formation of tropospheric ozone and          able carbon (C), WFPS, soil gas diffusivity, and bulk density
contributes to a significant fraction of both inorganic and or-    (i.e., dry weight of soil divided by its volume, indicating soil
ganic particulate matter (PM) (Seinfeld and Pandis, 2012;          compaction and/or aeration by O2 ). Denitrification rates are
Wang et al., 2013). Global emissions of NOx are responsi-          quite low even at high soil N concentrations if available soil
ble for one in eight premature deaths worldwide as reported        C is absent. However, the presence of high NO3 concentra-
by the World Health Organization (Neira, 2014). The prema-         tions with sufficient available C is the inhibiting factor for
ture deaths are a result of the link of these pollutants to car-   the conversion of N2 O to N2 , keeping N2 O emissions dom-
diovascular and chronically obstructive pulmonary (COPD)           inant during denitrification (Weier et al., 1993; Del Grosso
diseases, asthma, cancer, birth defects, and sudden infant         et al., 2000). Denitrification N2 O emissions are also found
death syndrome. These adverse health impacts have been             to increase with a decrease in soil pH in the range of 4.0 to
shown to worsen with the rising rate of reactive N emissions       8.0 generally (Liu et al., 2010). Fertilizer application and wet
from soil N cycling (Kampa and Castanas, 2008; Townsend            and dry deposition add to the soil NH4 and NO3 pools, which
et al., 2003). NOx indirectly impacts Earth’s radiative bal-       undergo transformation to emit soil N as intermediates of ni-
ance by modulating concentrations of OH radicals, the dom-         trification and denitrification (Kesik et al., 2006; Liu et al.,
inant oxidant of certain greenhouse gases such as methane          2006; Redding et al., 2016; Schindlbacher et al., 2004).
(IPCC, 2013; Steinkamp and Lawrence, 2011). Nitrous acid              Soil moisture content is the strongest determinant of ni-
(HONO) upon photolysis releases OH radicals along with             trification and denitrification rates and the relative propor-
NO, driving tropospheric ozone and secondary aerosol for-          tions of various N gases emitted by each. Increasing soil wa-
mation (Pusede et al., 2012). Soils and agriculture are the        ter content due to wetting events such as irrigation and rain-
leading emitters of N2 O, a potent greenhouse gas (IPCC,           fall can stimulate nitrification and denitrification. Nitrifica-
2013).                                                             tion rates peak 2–3 days after wetting, when excess water
   Ammonia (NH3 ) also contributes to a large fraction of air-     has drained away and the rate of downward water movement
borne fine particulate matter (PM2.5 ) (Kwok et al., 2013). El-    has decreased. Denitrification rates substantially increase and
evated levels of PM2.5 are linked to various adverse cardio-       nitrification rates become much slower in wetter soils. This
vascular ailments, such as irregular heartbeat and aggravated      is also influenced by soil texture; for instance, denitrifica-
asthma, that cause premature death (Pope et al., 2009) and         tion is favored in poorly drained clay soils and nitrification
contribute to visibility impairment through haze (Wang et al.,     is favored in freely draining sandy soils (Barton et al., 1999;
2012). NH3 gaseous emissions also influence the nucleation         Parton et al., 2001).
of new particles (Holmes, 2007). Air quality models such as           WFPS is a metric that incorporates the above factors. The
the Community Multiscale Air Quality (CMAQ) model and              relative proportions of NO, HONO, and N2 O emitted vary
GEOS-Chem represent bidirectional NH3 exchange between             with WFPS. Dry aerobic conditions (WFPS ∼ 0 %–55 %)
the atmosphere and soil–vegetation, analyzed under varied          are optimal for nitrification, with soil NO dominating soil

Geosci. Model Dev., 12, 849–878, 2019                                                  www.geosci-model-dev.net/12/849/2019/
Q. Z. Rasool et al.: Mechanistic representation of soil nitrogen emissions                                                      851

N gas emissions at WFPS ∼ 30 %–55 % (Davidson and Ver-                 The U.S. Environmental Protection Agency (EPA) Air
chot, 2000; Parton et al., 2001). HONO emissions have been          Pollutant Emissions Trends Data show that anthropogenic
observed up to WFPS of 40 % and dominate N gas emis-                sources of NOx (excluding fertilizers) fell by 60 % in the
sions under very dry and acidic soil conditions (Maljanen et        US since 1980, heightening the relative importance of soils.
al., 2013; Mamtimin et al., 2016; Oswald et al., 2013; Su           Area sources of NOx like soils, along with less than expected
et al., 2011). Nitrification influences N2 O production within      reduction in off-road anthropogenic sources, are believed to
the range of 30 %–70 % WFPS, whereas denitrification dom-           have contributed to a slowdown in US NOx reductions from
inates N2 O production in wetter soils. Denitrification N2 O is     2011–2016 (Jiang et al., 2018). Hence, accurate and consis-
limited by lower WFPS in spite of sufficient available NO−     3    tent representation of soil N is needed to address uncertain-
and C (Butterbach-Bahl et al., 2013; Del Grosso et al., 2000;       ties in their estimates.
Hu et al., 2015; Medinets et al., 2015; Weier et al., 1993).           The parameterized schemes currently implemented in
As a result, NO and HONO emissions tend to decrease with            CMAQ for CONUS, like Yienger–Levy (YL) and the
increasing water content, whereas N2 O emissions increase           Berkeley–Dalhousie Soil NOx Parameterization (BDSNP),
subject to available NO−  3 and C (Parton et al., 2001; Oswald      consider only NO expressed as a fraction of total soil N avail-
et al., 2013).                                                      able, without differentiating the fraction of soil N that occurs
   Extended dry periods also suppress soil NO emissions by          as organic N, NH4 , or NO3 (Hudman et al., 2012; Rasool
limiting substrate diffusion while water-stressed nitrifying        et al., 2016; Yienger and Levy, 1995). Moreover, these para-
bacteria remain dormant, allowing N substrate (NH+      4 or or-    metric schemes classify soil NO emissions as constant fac-
ganic N) to accumulate (Davidson, 1992; Jaeglé et al., 2004;        tors for different nonagricultural biomes or ecosystems com-
Hudman et al., 2010; Scholes et al., 1997). Rewetting of soil       piled from reported literature and field estimates worldwide
by rain reactivates these microbes, enabling them to metab-         (Davidson and Kingerlee, 1997; Steinkamp and Lawrence,
olize accumulated N substrate (Homyak et al., 2016). The            2011; Yienger and Levy, 1995). These emission factors ac-
resulting NO pulses can be 10–100 times background emis-            count for the baseline biogenic NOx emissions in addition to
sion rates and typically last for 1–2 days (Yienger and Levy,       sources from deposition (all biomes) and fertilizer (agricul-
1995; Hudman et al., 2012; Leitner et al., 2017).                   tural land cover only) in the latest BDSNP parameterization
   Higher soil temperature is critical in increasing NO emis-       (Hudman et al., 2012; Rasool et al., 2016). Despite their limi-
sion during nitrification under dry conditions. However, N2 O       tations, parameterized schemes do distinguish which biomes
generated in denitrification positively correlates with soil        exhibit low NO emissions (wetlands, tundra, and temper-
temperature only when WFPS and N substrate availability             ate or boreal forests) from those producing high soil NO
in soil are not the limiting factors (Machefert et al., 2002;       (grasslands, tropical savanna or woodland, and agricultural
Robertson and Groffman, 2007). Recently, a nearly 38 % in-          fields) (Kottek et al., 2006; Rasool et al., 2016; Steinkamp
crease in NO emitted was observed under dry conditions              and Lawrence, 2011).
(∼ 25 %–35 % WFPS) in California agricultural soils when               The EPA recently coupled CMAQ with the U.S. Depart-
soil temperatures rose from 30–35 to 35–40 ◦ C (Oikawa et           ment of Agriculture (USDA) Environmental Policy Inte-
al., 2015). Temperature-dependent soil NOx emissions may            grated Climate (EPIC) agroecosystem model. This integrated
strongly contribute to the sensitivity of ozone to rising tem-      EPIC–CMAQ framework accounts for a process-based ap-
peratures (Romer et al., 2018). Also, some soil NO is con-          proach for NH3 by modeling its bidirectional exchange (Ne-
verted to NO2 and deposited to the plant canopy, reducing           mitz et al., 2001; Cooter et al., 2010; Pleim et al., 2013).
the amount of NOx entering the atmosphere (Ludwig et al.,           The coupled model uses EPIC to simulate fertilizer appli-
2001).                                                              cation rate, timing, and composition. Then, CMAQ esti-
   Mechanistic models of soil N emissions already exist and         mates the spatial and temporal trends of the soil ammo-
are used in the Earth science and soil biogeochemical mod-          nium (NH+   4 ) pool by tracking the ammonium mass balance
eling community (Del Grosso et al., 2000; Manzoni and Por-          throughout processes like fertilization, volatilization, deposi-
porato, 2009; Parton et al., 2001). However, photochemical          tion, and nitrification (Bash et al., 2013). Using the EPIC-
models like CMAQ have been using a mechanistic approach             derived soil N pool better represents the seasonal dynam-
only for NH3 , while using simpler parametric approaches            ics of fertilizer-induced N emissions across CONUS (Cooter
for NO (Bash et al., 2013; Rasool et al., 2016). Other N            et al., 2012). The coupling with EPIC reduces CMAQ’s er-
oxide emissions like HONO and N2 O are absent from the              ror and bias in simulating total NH3 + NH+    4 wet deposition
parametric schemes used in CMAQ (Butterbach-Bahl et al.,            flux and ammonium-related aerosol concentrations (Bash et
2013; Heil et al., 2016; Su et al., 2011). Variability in soil      al., 2013). The BDSNP parametric scheme implemented in
physicochemical properties like pH, temperature, and mois-          CMAQ also uses the daily soil N pool from EPIC (Rasool et
ture, along with nutrient availability, strongly control the spa-   al., 2016).
tial and temporal trends of soil N compounds (Medinets et              Our work builds a new mechanistic approach for modeling
al., 2015; Pilegaard, 2013).                                        soil N emissions in CMAQ based on the DayCENT (Daily
                                                                    version of CENTURY model) biogeochemical scheme (Del

www.geosci-model-dev.net/12/849/2019/                                                    Geosci. Model Dev., 12, 849–878, 2019
852                                                Q. Z. Rasool et al.: Mechanistic representation of soil nitrogen emissions

Grosso et al., 2000; Parton et al., 2001), integrating nitrifi-    tinguishes between agricultural and nonagricultural land use
cation and denitrification mechanistic processes that gener-       types (Pouliot and Pierce, 2009). Adjustments due to tem-
ate NO, HONO, N2 O, and N2 under different soil conditions         perature, precipitation (pulsing), fertilizer application, and
and meteorology. We compare the NO and HONO emissions              canopy uptake are limited to the growing season, assumed
estimates and associated estimates of tropospheric NO2 col-        as 1 April to 31 October, and are restricted to agricultural ar-
umn, ozone, and PM2.5 with those obtained from CMAQ us-            eas as defined by the Biogenic Emissions Landuse Database
ing the YL and BDSNP parametric schemes. For agricultural          (BELD). Unlike the original YL, the implementation of YL
biomes, our mechanistic scheme uses daily soil N pools from        in CMAQ (CMAQ-YL) interpolates between wet and dry
the same EPIC simulations as in Rasool et al. (2016). Unlike       conditions based on soil moisture in the top layer (1 cm). In
BDSNP, which uses a total weighted soil N, the new mech-           this study, we use the Pleim–Xiu Land Surface Model (PX-
anistic model tracks different forms of soil N as NH4 , NO3 ,      LSM) in CMAQ to compute soil temperature (Tsoil ) and soil
and organic N for different soil layers and vegetation types so    moisture (θsoil ).
that nitrification and denitrification can be represented. For        Agricultural soil NO emissions are based on the baseline
nonagricultural biomes, our new mechanistic scheme uses a          grassland NO emission (Agrassland ) plus an additional fac-
global soil nutrient dataset in an updated C and N mineral-        tor (fertilizer(t)) that starts at its peak value during the first
ization framework. This enables the model to track the con-        month of the growing season and declines linearly to zero at
version of organic soil N to NH4 and NO3 pools on a daily          the end of the growing season. The growing season is defined
scale for nonagricultural soils.                                   as April–October in CMAQ-YL, rather than being allowed to
                                                                   vary by latitude (original YL) or by a satellite-driven analysis
                                                                   of vegetation (original BDSNP). A summary of the modified
2     Methodology                                                  YL algorithm is presented below for growing season agricul-
                                                                   tural emissions (Eq. 2).
2.1    Overview of soil N schemes
                                                                   SNOCMAQ−YL , agricultural growing season =
Key features of the YL and BDSNP parametric soil NO
schemes and our new mechanistic scheme for soil NO,                f Agrassland + fertilizer (t) , Tsoil , θsoil
HONO, and N2 O are illustrated in Fig. 1 and Table 1.                P (precipitation) CRF (LAI, SAI)                            (2)
  The YL scheme, based on Yienger and Levy (1995), pa-
rameterizes soil NO emission (SNOYL , in ng N m−2 s−1 ) in            For the nongrowing season or nonagricultural areas
Eq. (1) as a function of biome-specific emission factors           throughout the year, soil NO emissions are assumed to de-
(Abiome ) and soil temperature (Tsoil ).                           pend only on temperature and the base emissions for differ-
                                                                  ent biomes (Abiome ) as provided in BEIS. CMAQ still uses
SNOYL = f wd Abiome(w/d) , Tsoil                                   the base emission for both agricultural and nonagricultural
    P (precipitation) CRF (LAI, SAI)                        (1)    land types with adjustments based solely on air temperature
                                                                   (Tair, in K ) as done in BEIS (Eq. 3). However, for the sake of
The emissions factor depends on whether the soil is wet            simplicity we refer to “CMAQ-YL” merely as “YL”.
(Abiome(w) ) or dry (Abiome(d) ), with the wet factor used when
rainfall exceeds 1 cm in the prior 2 weeks. For dry soils, YL      SNOCMAQ−YL , nonagricultural or nongrowing season
assumes NO emissions exhibit a small and linear response              = (Abiome ) e(0.04686· Tair −14.30579)                     (3)
to increasing soil temperatures. For wet soils, soil NO is
zero for frozen conditions, increases linearly from 0 to 10 ◦ C,   The original implementation of the BDSNP scheme in
and increases exponentially from 10 to 30 ◦ C, after which it      CMAQ v5.0.2 was described by Rasool et al. (2016). Here,
is constant. In agricultural regions, YL assumes wet condi-        we update that code for CMAQv5.1, but the formulation
tions throughout the growing season (May–September) and            remains the same. Soil NO emissions, SNO , are computed
assumes 2.5 % of the fertilizer applied N is emitted as NO, in     in Eq. (4) as the product of biome-specific emission rates
addition to a baseline NO emissions rate based on grasslands.      (Abiome (Navail )) and adjustment factors to represent the in-
The pulsing term (P (precipitation)) is applied if precipitation   fluence of ambient conditions. The biome-specific emission
follows at least two dry weeks. The canopy reduction factor        rates have background soil NO for 24 MODIS biome types
(CRF) is set as a function of leaf area index (LAI) and stom-      from the literature (Stehfest and Bouwman, 2006; Steinkamp
atal area index (SAI).                                             and Lawrence, 2011). Fertilizer and deposition emission
   The Biogenic Emissions Inventory System (BEIS v3.61             rates based on an exponential decay after the input of fer-
used in current versions of CMAQ v5.0.2 or higher) esti-           tilizer and deposition N are added to background soil NO
mates NO emissions from soils essentially using the same           emission rates for respective biomes. BDSNP accounts for
original YL algorithm as in Eq. (1), with slight updates ac-       total N from fertilizer and deposition obtained from EPIC.
counting for soil moisture, crop canopy coverage, and fertil-      EPIC provides the N available from the crop-specific fertil-
izer application. The YL soil NO algorithm in CMAQ dis-            izer soil N pool in different forms as NH4 , NO3 , and organic

Geosci. Model Dev., 12, 849–878, 2019                                                  www.geosci-model-dev.net/12/849/2019/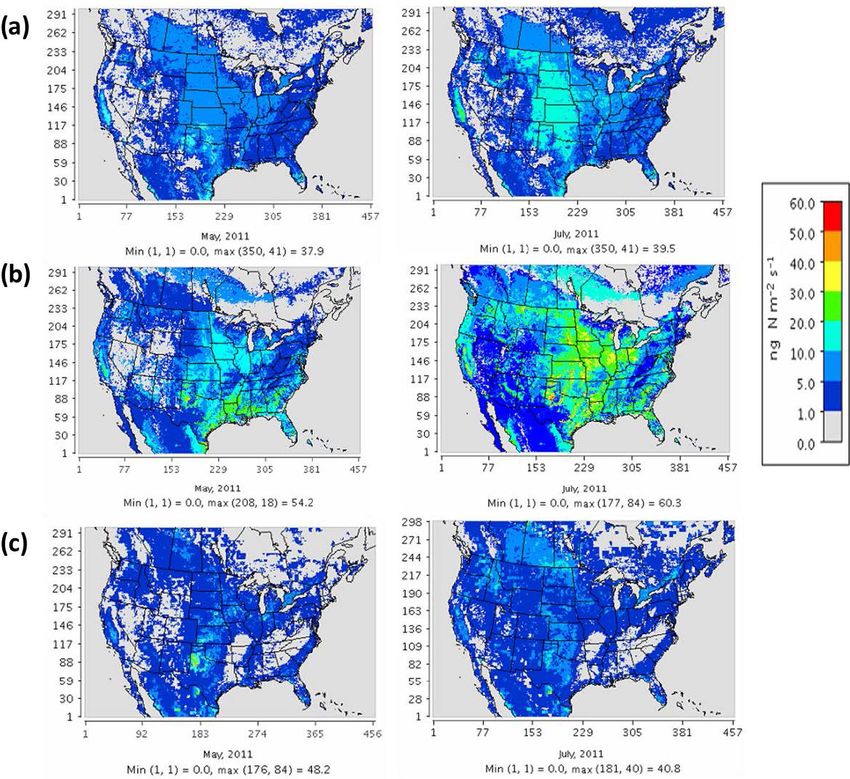
Q. Z. Rasool et al.: Mechanistic representation of soil nitrogen emissions                                                      853

Figure 1. Flowchart of the (a) Yienger and Levy (1995) (YL), (b) Berkley–Dalhousie Soil NOx Parameterization (BDSNP), and (c) mecha-
nistic schemes for soil nitrogen (N) emissions as implemented in CMAQ.

www.geosci-model-dev.net/12/849/2019/                                                    Geosci. Model Dev., 12, 849–878, 2019
854                                                     Q. Z. Rasool et al.: Mechanistic representation of soil nitrogen emissions

Table 1. Comparison of approaches of the parametric and mechanistic soil N emissions models.

                                    YL parametric model                 BDSNP parametric model              Mechanistic model
 Approach                           Yienger and Levy equations for      Hudman et al. (2012) equations      DayCENT sub-model repre-
                                    NO                                  for NO                              senting nitrification, denitrifi-
                                                                                                            cation, and mineralization for
                                                                                                            NO, HONO, and N2 O
 Species emitted or output          NO                                  NO                                  NO, HONO, NH3 , N2 O
 Biome or land use classification   CMAQ default NLCD40                 Sub-grid biome classification;      Sub-grid biome classification
                                                                        MODIS 24 mapped from                from NLCD40
                                                                        NLCD40
 Soil N data source                 Fertilizer N in growing season      EPIC (fertilizer N +                EPIC (fertilizer N +
                                    wet emission factor                 deposition (wet and dry) N          deposition (wet and dry) N
                                                                        from CMAQ)                          from CMAQ); Xu et al. (2015)
                                                                                                            for nonagricultural soil
 Agricultural biome                 Biome-specific NO emission          NO emissions derived from to-       EPIC C and N pools used in
                                    factors                             tal EPIC N                          DayCENT scheme nitrification
                                                                                                            NO, HONO, and N2 O;
                                                                                                            denitrification NO and N2 O
 Nonagricultural biome              Biome-specific NO emission          Biome-specific NO emission          Schimel and Weintraub equa-
                                    factors                             factors                             tions for N and C pools used
                                                                                                            in DayCENT to derive nitrifi-
                                                                                                            cation and denitrification emis-
                                                                                                            sions
 Variables considered               Soil T , rainfall, and biome type   Total soil N, soil T , soil mois-   Soil water content (irrigated
                                                                        ture, rainfall, and biome type      and unirrigated), T , NH+     4,
                                                                                                               −
                                                                                                            NO3 , gas diffusivity, and labile
                                                                                                            C by soil layer

 Pulsing                            f (precipitation)                   f ldry , with exponential de-       Same as BDSNP
                                                                        cay with change in soil mois-
                                                                        ture
 CRF                                f (LAI, SAI)                        f (LAI, meteorology, biome)         Same as BDSNP

N. A final weighted total soil N pool is used by weighting               tions are described in greater detail in Sect. 2.6.4. In the
the different N forms by the fraction of each crop type in               equations, the pulsing factor P ldry follows the formula-
each modeling grid. The soil temperature response f (Tsoil )             tion of Rasool et al. (2016). The canopy reduction fac-
is an exponential function of temperature (in K). Unlike YL              tor CRF (LAI, meteorology, biome) is described in Sect. 2.5.
that depends solely on rainfall, BDSNP has a Poisson func-               Briefly, we note that nitrification rates (RN in Eq. 24,
tion g (θ ) based on soil moisture (θ ) that increases smoothly          kg-N ha−1 s−1 ) depend on the available NH4 pool, soil tem-
first until a maximum and then decreases when soil becomes               perature (Tsoil ), soil moisture (θsoil ), gas diffusivity (Dr), and
water-saturated. BDSNP also differentiates between wet and               pH adjustment factors. Meanwhile, denitrification rates (RD
dry soil conditions and provides a more detailed represen-               in Eq. (25), kg N ha−1 s−1 ) depend on the available NO3
tation than YL of pulsing following precipitation and of the             pool, relative availability of NO3 to C, soil temperature, gas
CRF (described in Sect. 2.5).

SNOBDSNP = Abiome (Navail ) f (T ) g (θ ) P ldry
  CRF (LAI, meteorology, biome)                                 (4)
Our new mechanistic scheme computes soil emissions of
NO, HONO, and N2 O by specifically representing both
nitrification and denitrification. Equations (5)–(7) provide
an overview of the mechanistic formulation. All func-

Geosci. Model Dev., 12, 849–878, 2019                                                         www.geosci-model-dev.net/12/849/2019/
Q. Z. Rasool et al.: Mechanistic representation of soil nitrogen emissions 855
diffusivity, and soil moisture adjustment factors. generated at 1 km resolution to provide fractional crop
and vegetation cover. US land use categories are based
on the 2011 NLCD40 categories. FEST-C provides tree
NNOx − SHONO and crop percentage coverage for 194 tree classes and 42
SNO = CRF (LAI, meteorology, biome) ≡
+
DNO crops (https://www.cmascenter.org/sa-tools/documentation/
4.2/Raster_Users_Guide_4_2.pdf, last access: 22 February
f (NH4 , Tsoil , θsoil , Dr, pH) P ldry 2019). For determining fractional crop cover, the 2011
+
NLCD–MODIS data were used for Canada and the US in the
f (NO3 : C, Tsoil , θsoil , Dr) BELD4 data generation tool of FEST-C. Tree species frac-
CRF (LAI, meteorology, biome) (5) tional coverage is based on 2011 Forest Inventory and Anal-
SHONO = (HONOf )(NNOx )(fSWC ) ysis (FIA) version 5.1. MODIS satellite products are used
CRF (LAI, meteorology, biome) ≡ (HONOf ) where detailed data are unavailable outside of the US.
f (NH4 , Tsoil , θsoil , Dr, pH) P ldry 2.3 N fertilizer
(fSWC )CRF (LAI, meteorology, biome) (6)
The YL scheme set fertilizer-driven soil NO emissions to
NN2 O be proportional to fertilizer application during a prescribed
SN 2 O =
+
≡
growing season: May–August for the Northern Hemi-
sphere and November–February for the Southern Hemi-
DN2 O sphere (Yienger and Levy, 1995) or April–October for
f (NH4 , Tsoil , θsoil , Dr, pH) CMAQ-YL. Our implementations of both the BDSNP pa-
+ (7) rameterization and mechanistic soil N schemes into CMAQ
f (NO3 : C, Tsoil , θsoil , Dr) are designed to enable the use of year- and location-specific
fertilizer data with daily resolution. We use FEST-C to incor-
In all our simulations, soil NH3 emission is calculated based porate EPIC fertilizer application data into our CMAQ runs.
on the bidirectional exchange scheme (Bash et al., 2013) in EPIC estimates daily fertilizer application based entirely on
CMAQ. simulated idealized plant demand, with N stress and limita-
tions in response to local soil and weather conditions, using
2.2 Biome classification over CONUS
linkages with WRF via FEST-C. The FEST-C interface also
CMAQ uses the National Land Cover Database with 40 ensures that EPIC simulations are spatially consistent with
classifications (NLCD40; https://www.mrlc.gov/, last ac- CMAQ’s CONUS domain and resolution through the Spatial
cess: 22 February 2019) to represent land cover, which is Allocator (SA) Raster Tools system (http://www.cmascenter.
used by the YL parametric scheme. However, Steinkamp org/sa-tools/, last access: 22 February 2019).
and Lawrence (2011) provide soil NO emission factors Because EPIC covers only the US, outside the US BDSNP
(A0biome (Navail )) for only 24 MODIS biomes in the BDSNP uses fertilizer data regridded from Hudman et al. (2012),
parametric scheme. Thus, the initial implementation of BD- which scaled Potter et al. (2010) data for fertilizer N from
SNP in CMAQ by Rasool et al. (2016) introduced a map- 1994–2001 to global fertilizer levels in 2006. Our mechanis-
ping between the MODIS 24 and NLCD40 biomes to set an tic scheme uses a more recently compiled and speciated soil
emission factor for each NLCD40 biome type (see Appendix N and C dataset for non-US agricultural regions, regridded
Table A2). Factors were then adjusted using Köppen climate from Xu et al. (2015).
zone classifications (Kottek et al., 2006). Whereas the origi-
2.4 N deposition
nal implementation of BDSNP by Rasool et al. (2016) treated
each grid cell based on its most prevalent biome type, our up- N deposition serves as a significant addition to the soil min-
date of BDSNP for CMAQv5.1 and our mechanistic model eral N (inorganic N : NH+ −
4 and NO3 ) pool and hence influ-
use sub-grid biome classification, accounting for the fraction ences soil N emissions. The YL scheme does not explicitly
of each biome type in each cell. represent N deposition but instead sets soil emissions based
The latest Biogenic Emissions Landcover Database ver- on biome type. In our implementation of both the updated
sion 4 (BELD4), generated using the BELD4 tool in the SA BDSNP and new mechanistic soil N schemes, hourly wet and
Raster Tools system, is used to represent land cover types dry deposition rates for both reduced and oxidized forms of
consistently across both the Fertilizer Emission Scenario N, computed within the CMAQ simulation, are added to the
Tool for CMAQ (FEST-C v1.2; https://www.cmascenter.org/ NH+ −
4 and NO3 soil pools.
fest-c/, last access: 22 February 2019) and the Weather
Research and Forecast (WRF) meteorological model (Ska-
marock et al., 2008) and CMAQ framework. BEIS v3.61
within CMAQ integrates BELD4 with other data sources
www.geosci-model-dev.net/12/849/2019/ Geosci. Model Dev., 12, 849–878, 2019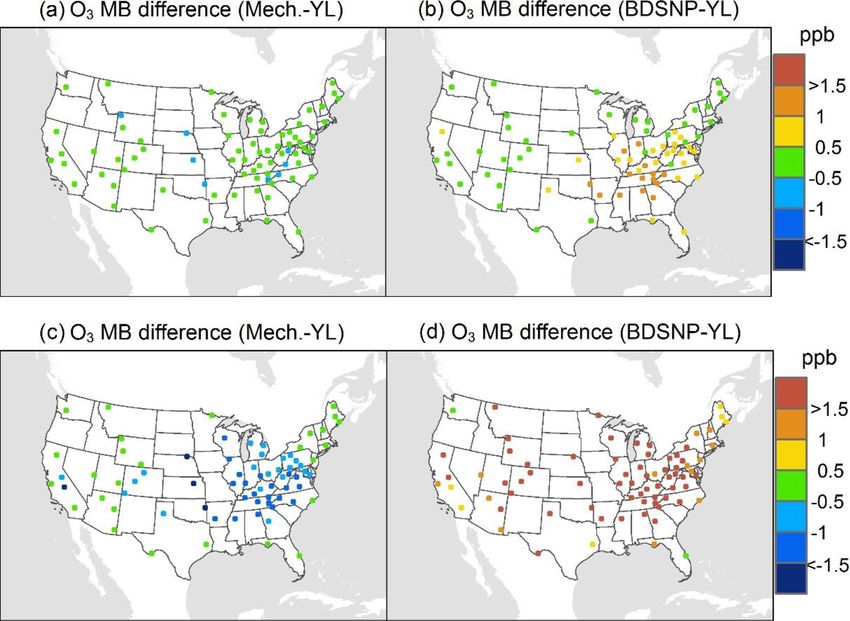
856                                                 Q. Z. Rasool et al.: Mechanistic representation of soil nitrogen emissions

2.5   Canopy reduction factor (CRF)                                  itory (canopy_nox_mod.F) for the purpose of reproducibil-
                                                                     ity (available at https://daac.ornl.gov/cgi-bin/dsviewer.pl?
CRF is used to calculate above-canopy NO and HONO, as-               ds_id=_1351, last access: 22 February 2019).
suming that some fraction of each is converted to NO2 and
absorbed by leaves. Earlier global-scale GEOS-Chem simu-             2.6     Detailed description of the mechanistic soil N
lations with BDSNP had a monthly averaged CRF that re-                       scheme
duced total soil NOx by an average of 16 % (Hudman et al.,
2012).                                                               2.6.1    Overview
   The original YL soil NO scheme (Yienger and Levy, 1995)
and the in-line BEIS in CMAQ set CRF as a function of LAI            Our new mechanistic soil N model tracks the NH4 , NO3 ,
and SAI. Recently, implementations of BDSNP in CMAQ                  and organic C and N pools in soil separately, in contrast to
and GEOS-Chem implemented CRF as a function of wind                  the total N pool of BDSNP, and estimates NO, HONO, and
speed, turbulence, and canopy structure (Geddes et al., 2016;        N2 O rather than just NO (Fig. 2). It uses DayCENT to rep-
Rasool et al., 2016; Wang et al., 1998).                             resent both nitrification and denitrification. For agricultural
   Here, we compute CRF using equations from Wang et                 biomes, we use speciated N and C pools from EPIC to drive
al. (1998) for both the BDSNP and new mechanistic scheme             DayCENT. For nonagricultural biomes, we use a C–N min-
using spatially and temporally variable land-surface parame-         eralization framework (Manzoni and Porporato, 2009) to es-
ters: surface (2 m) temperature, solar radiation (W m−2 ), sur-      timate the inorganic N and C pools for DayCENT.
face pressure, snow cover, wind speed (vwind ), cloud fraction,         One of the advantages of using DayCENT is its ability to
canopy structure, vegetation coverage (LAI and canopy re-            simulate all types of terrestrial ecosystems. DayCENT is one
sistances), gas diffusivity, and deposition coefficients. The        of the only biogeochemical models that not only provides
final reduction factor (CRF(LAI, meteorology, biome)) for            a process-based representation of soil N emissions, but has
primary biogenic soil NO emissions is based on two main              also been calibrated and validated across an array of condi-
factors: bulk stomatal resistance (RBulk ) and the land-use-         tions for crop productivity, soil C, soil temperature and wa-
specific ventilation velocity of NO (vvent,NO ), calculated          ter content, N2 O, and soil NO−    3 (Necpálová et al., 2015).
based on the parameters mentioned above (Eq. 8).                     Hence, mechanistic models like DayCENT yield more re-
                                                                     liable results by applying validated controls of soil proper-
                                           RBulk
CRF (LAI, meteorology, biome) =                               (8)    ties like soil temperature and moisture, which are the key
                                      RBulk + vvent,NO               process controls to nitrification and denitrification. More re-
                                                                     cent mechanistic models like DNDC, MicNit, ECOSYS, and
The ventilation velocity of NO (vvent,NO ) is calculated
                                                                     COUPMODEL are quite similar to DayCENT in their rep-
by adjusting a normalized day- and night-specific veloc-
                                                                     resentation of the nitrification and denitrification process.
ity from Wang et al. (1998): 10−2 and 0.2 × 10⁻² m s−1 ,
                                                                     However, these models have not been as widely evaluated
respectively. The adjustments are based on biome-specific
                                                                     and impose greater computational costs (Butterbach-Bahl
LAI and canopy wind extinction coefficients (CBiome ).
                                                                     et al., 2013). DayCENT also enhances consistency in our
Ctropical rainforest is the canopy wind extinction coefficient for
                                                                     mechanistic model by utilizing the same C–N mineraliza-
tropical rainforests, the biome on which most canopy uptake
                                                                     tion scheme (taken from the CENTURY model; Parton et al.,
studies for NOx are based (Eq. 9).
                                                                     2001) that is used in EPIC.
                                 s
                                    v        7                      Most stand-alone applications of DayCENT and other
                                        wind 2                       mechanistic models have focused on the biogeochemical, cli-
vvent,NO = vvent,NOday/night
                                         3     LAI                   mate, and agricultural impacts of soil emissions. Our linkage
                                                                     of DayCENT with CMAQ provides an opportunity for the

                    Ctropical rainforest
                                                               (9)   first time to estimate emissions of multiple soil N species
                         CBiome
                                                                     through a process-based approach and then assess their im-
RBulk is a combination of various canopy resistances in              pact on atmospheric chemistry in a regional photochemical
series and parallel: internal stomatal resistance, cuticle re-       model.
sistance, and aerodynamic resistance, which have biome-
specific normalized values for the MODIS 24 biomes also              2.6.2    Agricultural regions
available in the dry deposition scheme of CMAQ. These nor-
malized values of individual resistances are subsequently ad-        In agricultural regions, we use EPIC to derive organic N,
justed and dependent on multiple conditions for solar radia-         NH4 , NO3 , and C pools updated on a daily scale. EPIC fol-
tion, surface temperature, pressure, deposition coefficients,        lows the same approach used in the CENTURY model (Par-
and the molecular diffusivity of NO2 in air. The calcula-            ton et al., 1994), but uses an updated crop growth model and
tion of RBulk based on Wang et al. (1998) has been docu-             better represents the effects of sorption on soil water content
mented and shared in the open-source BDSNP code repos-               that affect leaching losses and the surface-to-subsurface flow

Geosci. Model Dev., 12, 849–878, 2019                                                    www.geosci-model-dev.net/12/849/2019/
Q. Z. Rasool et al.: Mechanistic representation of soil nitrogen emissions                                                          857

Figure 2. Schematic for N transformation to estimate soil pools of ammonium (NH4 ) and nitrate (NO3 ) and the resultant nitrification and
denitrification N emissions in the mechanistic model.

of N. In contrast, CENTURY used monthly water leached                  N can also be leached or lost in gaseous forms (Izaurralde et
below 30 cm of soil depth, annual precipitation, and the silt          al., 2012).
and clay content of soil (Izaurralde et al., 2006).                       We then estimate gaseous N emissions by using the or-
    In EPIC, organic N residues added to the agricultural              ganic N, NH4 , NO3 , and C pools provided from EPIC/FEST-
soil surface or belowground from plant or crop residues,               C along with relevant soil properties for agricultural biomes
roots, fertilizer, deposition, and manure are split into two           from the DayCENT nitrification and denitrification sub-
broad compartments: microbial or active biomass and slow               model, as described in Sect. 2.6.4 and illustrated in Fig. 2.
or passive humus. Slow or passive humus is essentially re-
calcitrant and nonliving in nature with very slow turnover             2.6.3   Nonagricultural regions
rates ranging from centuries to even thousands of years and
makes up most of the organic matter. N uptake by soil mi-              We adapt the framework for linked C and N cycling from
crobes from organic matter, also called “microbial biomass”            Schimel and Weintraub (2003) for nonagricultural regions,
or “microbial–active N”, is the living portion of the soil or-         where EPIC is not applicable. This framework accounts for
ganic matter, excluding plant roots and soil animals larger            the mineralization of organic N by considering which ele-
than 5 × 10⁻³ µm3 . Although microbial biomass constitutes             ment is limiting based on the relative C-to-N content in mi-
a small portion of organic matter (∼ 2 %), it is central in mi-        crobial biomass. If N is in excess, then the mineralization
crobial activity: in other words, the conversion of organic N          of organic N producing NH+    4 is favored. If C is in excess,
to inorganic N (Cameron et al., 2013; Manzoni and Porpo-               it results in overflow metabolism that results in elevated C
rato, 2009). The transformation rate of organic N to micro-            respiration rates not associated with microbial growth. The
bial N is controlled by the relative C and N content in mi-            resultant inorganic N and C respiration rates are then applied
crobial biomass, soil temperature and water content, soil silt         on a temporal and spatial scale consistent with those for the
and clay content, organic residue composition enhanced by              EPIC agricultural pool.
tillage in agricultural soil, bulk density, oxygen content, and           To ensure mass balance, enzyme production (Eqs. 11–13)
inorganic N availability. Microbial N has quicker turnover             and recycling mechanisms (Eqs. 14–15) to replenish micro-
times ranging from days to weeks compared to hundreds                  bial biomass C are crucial. Similarly, net immobilization is
of years for slow or passive organic matter (Izaurralde et             assumed as was done in EPIC when we approach C-saturated
al., 2006; Schimel and Weintraub, 2003). Hence, microbial              conditions with time to replenish microbial N. Without such
biomass is the main clearinghouse and driver of C and N cy-            mechanisms, there is a danger to always incorrectly predict
cling in EPIC. Whether net mineralization of organic N to              the N- or C-limited state for microbes. Also, some proportion
NH+                                           −
     4 occurs or net immobilization of NO3 to microbial N
                                                                       of the microbial biomass is utilized for the maintenance of
depends strongly on the relative C and N contents in micro-            living cells (only C demand) (Eq. 14), while the rest accounts
bial biomass. Higher N content supports net mineralization,            for decay and regrowth (both C and N demands) (Eqs. 16–17,
whereas higher C content supports net immobilization. C and            18–19) (Schimel and Weintraub, 2003; Manzoni and Porpo-
                                                                       rato, 2009). Fractions of C and N in dying microbial biomass

www.geosci-model-dev.net/12/849/2019/                                                        Geosci. Model Dev., 12, 849–878, 2019
858                                              Q. Z. Rasool et al.: Mechanistic representation of soil nitrogen emissions

are recycled into the available microbial C and N pools.         MODIS 24 biome-specific microbial / organic C and N frac-
Schimel and Weintraub (2003) provide values for parame-          tions to NLCD 40 (Cmicbiome and Nmicbiome ; biome rep-
ters that quantify these growth and decay processes: fraction    resents the 40 NLCD categories) with the mappings shown
of biome C to exoenzymes (Ke ) = 0.05; microbial mainte-         in Tables A2 and A3. We calculate area-weighted micro-
nance rate (Km ) = 0.01 d−1 ; substrate use efficiency (SUE)     bial C and N pools (SMC and SMN) using Cmicbiome and
= 0.5; proportion of microbial biomass that dies per day (Kt )   Nmicbiome that account for the inter-biome variability in the
= 0.012 d−1 ; proportion of microbial biomass (C or N) for       availability of soil microbial biomass. Also, spatial hetero-
microbial use (Kr ) = 0.85.                                      geneity in terms of vertical stratification is crucial as emis-
                                                                 sion losses from N cycling primarily happen in the top 30 cm
Rm (respiration from maintenance) = Km (SMC)             (10)    layer. Hence, we incorporate the Xu et al. (2015) data for the
Re (respiration from enzyme production) =                        top 30 cm for the organic nutrient pool and microbial C : N
  ((1 − SUE)(EPC )/SUE)                                  (11)    ratio (Cm : Nm ) along with other soil properties such as soil
                                                                 pH, θsoil , and Tsoil . This framework (Fig. 2) enables us to esti-
EPC (enzyme production as, C loss/sink) =                        mate soil NH4 , NO3 , and C pools from area-weighted micro-
  Ke (SMC)                                               (12)    bial biomass as consistently as possible with the pools that
EPN (enzyme production as N loss/sink) = EPC /3                  EPIC provides in agricultural regions.
   (where 3 is the approximate C : N ratio for protein) (13)
                                                                 2.6.4   DayCENT representation of soil N emissions
CYC (recycle from C microbial biomass) =
  Kt Kr (SMC)                                            (14)    The final part of the mechanistic framework is formed by us-
CYN (recycle from N microbial biomass) =                         ing a nitrification and denitrification N emissions sub-model
  CYC /Cm : Nm                                           (15)    adapted from DayCENT along with nitrification and deni-
                                                                 trification rate calculations adapted from EPIC. Nitrification
HC (C death/decay) = Kt (1 − Kr ) (SMC)                  (16)    and denitrification rates are adapted from EPIC to maintain
HN (N death/decay) = HC /Cm : Nm                         (17)    consistency with the NH3 bidirectional scheme in CMAQ,
If C is limited or N in excess:                                  which uses the same. It should be noted that the coupled
SMC < Rm + (EPC /SUE)                                            C–N decomposition module in the EPIC terrestrial ecosys-
                                                                 tem model is similar to that of DayCENT (Izaurralde et al.,
   + ((SMN − EPN ) (Cm : Nm /SUE))                       (18)    2012, 2017; Gaillard et al., 2018). EPIC-simulated agricul-
Rg (respiration from growth, C limited) =                        tural NH4 and NO3 soil pools are generated as described
  (1 − SUE) (SMC − (EPC /SUE) − Rm )                     (19)    in Sect. 2.6.2, whereas the nonagricultural NH4 and NO3
RO (respiration from overflow mechanism) = 0             (20)    soil pools are calculated by using the methods described in
                                                                 Sect. 2.6.3 (Eqs. 22–23). NH4 and NO3 soil pools drive nitri-
NH4 (from net mineralization after mass balance) =               fication and denitrification as shown in Eqs. (24)–(25). Vari-
  (SMN − EPN − ((SMC − (EPC /SUE) − Rm )                         ability in terms of the soil conditions influencing N emissions
  (SUE/Cm : Nm )))                                       (21)    in nitrification and denitrification is introduced through the
                                                                 rates at which NH4 is nitrified (RN ) and NO3 is denitrified
We represent spatial heterogeneity in soil C and N by using      (RD ) (Eqs. 24–25).
the Schimel and Weintraub (2003) algorithm with sub-grid            The nitrification rate (KN ) (Eq. 26) is estimated based
land use fractions from NLCD40 to estimate the different         on regulators from the soil water content, soil pH, and soil
parameters for specific nonagricultural biomes in Eqs. (10)–     temperature (Tsoil ), following the approach of Williams et
(20). That allows us to account for inter-biome variability in   al. (2008), consistent with the bidirectional NH3 scheme in
soil properties and organic and/or microbial biomass.            CMAQ (Bash et al., 2013). The nitrification soil tempera-
   Mineralized N pools generated as NH+   4 in this framework    ture regulator (fT ) accounts for frozen soil with no evasive
are calculated eventually as a function of microbial biomass     N fluxes (Eq. 27). The nitrification soil water content reg-
and the aforementioned parameters driving the net mineral-       ulator (fSW ) accounts for soil water content at the wilting
ization (Eqs. 18 and 21).                                        point and field capacity (Eqs. 28–29). The regulator terms fT
   We map a global organic C and N pool dataset (Xu et           and fSW both get their dependent variables from land-surface
al., 2015) onto our CONUS domain using biome-specific            outputs derived from the Meteorology–Chemistry Interface
fractions from 12 different biome types for the conversion       Processor (MCIP) (Otte and Pleim, 2010). However, the ni-
of these organic pools into microbial biomass pools (Xu et       trification soil pH regulator (fpH ) takes soil pH for agricul-
al., 2013). We map these 12 broader biome types to the           ture soil from EPIC and for nonagricultural soil from a sep-
24 MODIS biome types with the mapping shown in Ta-               arate global dataset (Xu et al., 2015), available at both 0.01
ble A1. To ensure consistency with the sub-grid biome frac-      and 1 m depths to maintain consistency with MCIP (Eq. 30).
tions for the 40 NLCD biome types (Sect. 2.2), we map the        The denitrification rate (KD ) (Eq. 31) is regulated by soil

Geosci. Model Dev., 12, 849–878, 2019                                                www.geosci-model-dev.net/12/849/2019/
Q. Z. Rasool et al.: Mechanistic representation of soil nitrogen emissions 859
temperature (Eq. 34), with WFPS (Eq. 33) acting as a proxy are expressed on a g N h−1 basis. These emissions are sus-
for O2 availability and soil moisture (θsoil ) and the relative ceptible to pulsingafter rewetting of soil in arid or semiarid
availability of NO3 and C (Eq. 32) determining N2 O or N2 conditions (P ldry ), as explained in Sect. 2.1 (Eq. 37). Den-
emissions during denitrification (Williams et al., 2008). Note itrification NO is also calculated using the overall rNOx /N2 O
that Eqs. (26) and (31) set upper limits for KN and KD , re- ratio (Eq. 38) but does not experience pulsing (Parton et al.,
spectively. 2001). Equation (35) does quantify rNOx /N2 O as a function of
Dr, but as a unitless ratio as expected.
NO3 (kg-N ha−1 , after nitrification) =
NH4 (1.0 − e−(KN dt) ) (22) rNOx /N2 O = 15.2
NH4 (kg-N ha −1
, after nitrification) = 35.5 arctan (0.68 π ((10.0 Dr) − 1.86))
+ (35)
NH4 e −(KN dt)
(23) π
RN (kg-N ha−1 s−1 ) = NH4 (1.0 − e−(KN dt) )/dt (24) NN2 O nitrification N2 O, g-N h−1 =
RD (kg-N ha−1 s−1 ) = NO3 (1.0 − e−(KD dt) )/dt (25) 0.02(RN )(grid cell area) (36)
KN (s−1 ) = min 0.69, (fT ) (fSW )(fpH )
(26)
NNOx nitrification NOx , g-N h−1 =
fT (nitrification soil temperature regulator) =
max (0.041 ( Tsoil − 278.15 ) , 0.0) (27) rNOx /N2 O (NN2 O ) P ldry (37)
−1
fSW (nitrification soil water content regulator) = DNO (denitrification NO, g-N h )=
rNOx /N2 O (DN2 O ) (38)
0.1, if (θsoil ≤ wiltings point)
(θsoil − wilting point)
max 0.1, 0.1 + 0.9 (field capacity-wilting point) , N2 O from denitrified NO3 (RD ) is calculated using the parti-
( θsoil − wilting point)
tioning function derived by Del Grosso et al. (2000) (Eq. 39).
,
0.25 (field capacity–wilting point) (28) The ratio of N2 to N2 O emitted as an intermediate dur-
if (wg25 > θsoil > wilting point) ing denitrification (rN2 /N2 O ) is dependent on WFPS (Eq. 42)
1.0, if (field capacity > θsoil ≥ wg25 )
and the relative availability of NO3 substrate and C for het-
(θsoil − field capacity)
max 0.1, 1.0 − ,
(θsoil (at saturation) − field capacity) erotrophic respiration (Eqs. 40–41). The C available for het-
if (θsoil > field capacity)
erotrophic respiration in the surface soil layer (labile C)
wg25 = wilting point + 0.25 (field capacity–wilting point) (29) (Eq. 41) is taken from EPIC for agricultural biomes and from
Xu et al. (2015) for nonagricultural biomes. f (NO3 : C) is
fpH (nitrification soil pH regulator) =
controlled by variability in soil texture, accounted for by a
0.307 (pH) − 1.269, acidic soil (pH < 7) factor k, which depends on soil diffusivity at field capac-
1.0, neutral soil (7.4 > pH ≥ 7 ) (30) ity as estimated in Del Grosso et al. (2000). Also, the NO3
5.367 − 0.599 (pH) , alkaline soil (pH ≥ 7.4) ,
pool is updated at each time step when denitrification hap-
pens (Eq. 43). Equations (40)–(42) also quantify rN2 /N2 O as
KD s−1 = min (0.01, f (WFPS, Tsoil , NO3 : C)) (31)
a unitless ratio, while still accounting for the variables influ-
f (WFPS, Tsoil , NO3 : C) , denitrification regulators = encing these ratios.
(1.4 (labile C) (NO3 ))
(fT,D )(fWFPS,D ) (32) DN2 O (denitrification N2 O, g-N h−1 ) =
((labile C + 17 ) (NO3 + 83))
RD
4.82 ( )(grid cell area) (39)
fWFPS,D = min 1.0, (33) 1.0 + rN2 /N2 O
(16/(121.39(WFPS)) )
14 rN2 /N2 O = f (NO3 : C) (40)
1 1
308.56 68.02 − T (in K)−227.13
fT,D = min 1.0, e soil (34) f (NO3 : C) =
( NO
−0.8 labile3C
DayCENT partitions N emissions as NOx and N2 O based on max 0.16 (k), (k)e if labile C > 0 (41)
relative gas diffusivity in soil compared to air (Dr) (Eq. 35). 0.16 (k) if labile C ∼ 0
Dr is calculated based on the algorithm from Moldrup et f (WFPS) =
al. (2004), which accounts for soil water content, soil air max ( 0.1, (0.015 (WFPS(as fraction) − 0.32))) (42)
porosity, and soil type. Dr, and hence the ratio of NOx to N2 O
emissions (rNOx /N2 O ) being a function of Dr, also accounts NO3 kg-N ha−1 , after denitrification =
for soil texture by quantifying pore space, which is highest RN
RN
in coarse soil (Parton et al., 2001; Moldrup et al., 2004). + NO3 − (e−(KD dt) ) (43)
KD KD
DayCENT assumes 2 % of nitrified N (RN ) is lost as N2 O
(Eq. 36). rNOx /N2 O is the ratio of NOx (both NO and HONO, HONO is emitted as an intermediate during nitrification and
which photolyze rapidly to NO) to N2 O, in which emissions has been reported in terms of a ratio relative to NO for each
www.geosci-model-dev.net/12/849/2019/ Geosci. Model Dev., 12, 849–878, 2019860 Q. Z. Rasool et al.: Mechanistic representation of soil nitrogen emissions
of 17 ecosystems by Oswald et al. (2013). In the mechanistic orological conditions were converted to CMAQ inputs using
scheme, the proportions of HONO relative to total NOx for MCIP version 4.2 (https://www.cmascenter.org, last access:
these 17 biomes were mapped to the closest 24 MODIS-type 22 February 2019). Gridded speciated hourly model-ready
biome categories (Table A1) and then to the NLCD 40 types emission inputs were generated using the Sparse Matrix Op-
(HONOf ) with the mappings in Tables A2 and A3. This al- erator Kernel Emissions (SMOKE; https://www.cmascenter.
lows for consistency with sub-grid land use fractions from org/smoke/, last access: 22 February 2019) version 3.5 pro-
NLCD40. HONO emissions are further adjusted to reflect gram and the 2011 National Emissions Inventory v1. Bio-
their dependence on WFPS (Oswald et al., 2013). The adjust- genic emissions were processed in-line in CMAQ v5.1 us-
ment factor fSWC reflects observations that HONO emissions ing BEIS version 3.61 (Bash et al., 2016). All the simula-
rise linearly up to 10 % WFPS and then decrease until they tions employed the bidirectional option for estimating the
are negligible around ∼ 40 % (Su et al., 2011; Oswald et al., air–surface exchange of ammonia. We applied CMAQ with
2013) (Eq. 45). Subsequently, total NO emission is a sum of three sets of soil NO emissions: (a) standard YL soil NO
nitrification NO emission, which is a difference of NNOx and scheme in BEIS; (b) updated BDSNP scheme for NO (Ra-
SHONO , and denitrification NO (Eq. 46). Similarly, total N2 O sool et al., 2016) with new sub-grid biome classification; and
is a sum of NN2 O (Eq. 36) and DN2 O (Eq. 39). The canopy (c) mechanistic soil N scheme for NO and HONO.
reduction factor (Sect. 2.1) is then applied to both SHONO and
SNO (Eqs. 44 and 46). Finally, sub-grid-scale emission rates 2.8 Observational data for model evaluation
are aggregated for each grid cell.
To evaluate model performance for each of the three soil
N cases, we employed regional and national networks: the
SHONO = HONOf (NNOx )
EPA’s Air Quality System (AQS; 2086 sites; https://www.
(fSWC )CRF (LAI, meteorology, biome) (44)
epa.gov/aqs, last access: 22 February 2019) for hourly NOx
fSWC (soil water content adjustment factor to compute HONO) = and O3 ; the Interagency Monitoring of Protected Visual En-
HONOf (WFPS) vironments (IMPROVE; 157 sites; http://vista.cira.colostate.
, if (WFPS ≤ 0.10) edu/improve/, last access: 22 February 2019) and Chemi-
0.1
(assuminglinear increase up to 10 % WFPS) cal Speciation Network (CSN; 171 sites; https://www3.epa.
(45)
HONOf (0.4 − WFPS) gov/ttnamti1/speciepg.html, last access: 22 February 2019)
if 0.40)
, (WFPS ≤ for PM2.5 nitrate (measured every third or sixth day); the
(0.4 − 0.1)
0, if (WFPS > 0.40 ) Clean Air Status and Trends Network (CASTNET; 82 sites;
SNO = NNOx − HONOf (NNOx ) (fSWC ) + DNO
http://www.epa.gov/castnet/, last access: 22 February 2019)
for hourly O3 and weekly aerosol PM species; and SEARCH
CRF (LAI, meteorology, biome) (46) network measurements (http://www.atmospheric-research.
com/studies/SEARCH/index.html, last access: 22 February
2.7 Model configurations
2019) of NOx concentrations in remote areas. NO2 was also
We obtained from the U.S. EPA a base case WRFv3.7- evaluated against tropospheric columns observed by the OMI
CMAQv5.1 simulation for 2011 with the settings and aboard NASA’s Aura satellite (Bucsela et al., 2013; Lamsal
CONUS modeling domain described by Appel et al. (2017), et al., 2014).
who thoroughly evaluated its performance against observa-
tions. Here, we simulate only May and July to test the sen- 3 Results and discussion
sitivity of air pollution to soil N emissions during the be-
ginning and middle of the growing season. Each episode is 3.1 Spatial distribution of soil NO, HONO, and N2 O
preceded by a 10-day spin-up period. emissions
Table 2 summarizes the WRF-CMAQ modeling configura-
tions settings. The simulations use the Pleim–Xiu Land Sur- Figure 3 compares the spatial distribution of soil N ox-
face Model (PX-LSM) (Pleim and Xiu, 2003) and the Asym- ide emissions from the three schemes. The incorporation of
metric Convective Mixing v2 (ACM2) planetary boundary EPIC fertilizer in BDSNP results in soil NO emission rates
layer (PBL) model. The modeling domain for CMAQ v5.1 up to a factor of 1.5 higher than in YL, consistent with the
covers the entire CONUS including portions of northern findings of Rasool et al. (2016). Hudman et al. (2012) found
Mexico and southern Canada with 12 km resolution and a nearly twice as large of a gap between BDSNP and YL in
Lambert conformal projection. Vertically, we use 35 vertical GEOS-Chem; the narrower gap here likely results from our
layers of increasing thickness extending up to 50 hPa. Bound- use of sub-grid biome classification and EPIC fertilizer data
ary conditions are provided by a 2011 global GEOS-Chem (Rasool et al., 2016). The mechanistic scheme (Fig. 3c) gen-
simulation (Bey et al., 2001). erates emission estimates that are closer to the YL scheme
WRF simulations employed the same options as Appel et but with greater spatial and temporal heterogeneity, reflect-
al. (2017) (summarized in Table 2). WRF outputs for mete- ing its use of more dynamic soil N and C pools. The agri-
Geosci. Model Dev., 12, 849–878, 2019 www.geosci-model-dev.net/12/849/2019/Q. Z. Rasool et al.: Mechanistic representation of soil nitrogen emissions 861
Table 2. Modeling configuration used for the WRF-CMAQ simulations.
WRF/MCIP
Version: ARW V3.7 Shortwave radiation: RRTMG scheme
Horizontal resolution: CONUS (12 km × 12 km) Surface layer physic: PX LSM
Vertical resolution: 35 layer PBL scheme: ACM2
Boundary condition: NARR 32 km Microphysics: Morrison double-moment
scheme
Initial condition: NCEP-ADP Cumulus parameterization: Kain–Fritsch scheme
Longwave radiation: Rapid Radiation Transfer Assimilation: Analysis nudging above PBL
Model Global (RRTMG) for temperature, moisture, and
scheme wind speed
BDSNP
Horizontal resolution: Same as WRF/MCIP Emission factor: Steinkamp and Lawrence
(2011)
Soil biome type: Sub-grid biome fractions from Fertilizer database: EPIC 2011 based from FEST-
WRFv3.7 C v1.2
CMAQ
Version: 5.1 Anthropogenic emission: NEI 2011 v1
Horizontal resolution: Same as WRF/MCIP Biogenic emission: BEIS v3.61 in-line
Initial condition: Pleim–Xiu (MET) Boundary condition: Pleim–Xiu (MET)
GEOS-Chem (CHEM) GEOS-Chem (CHEM)
Aerosol module: AE6 Gas-phase mechanism: CB-05
Simulation case arrangement (in-line with CMAQ)
1. YL: WRF/MCIP-CMAQ with standard YL soil NO scheme
2. BDSNP (EPIC with new biome): WRF/MCIP-BDSNP-CMAQ with EPIC and new sub-grid biome fractions
3. Mechanistic scheme: WRF/MCIP–mechanistic soil N-CMAQ with EPIC (agricultural US) and Xu
et al. (2015) (non-US agricultural and all nonagricultural in CONUS), new
sub-grid biome fractions
Simulation time period
1–31 May and 10–31 July 2011 (10-day spin-up for each) for CMAQ
simulation with in-line YL, updated BDSNP, and mechanistic modules
Model performance evaluation
USEPA Clean Air Status and Trends Network (CASTNET) and Air Quality System (AQS) data for ozone
Interagency Monitoring of Protected Visual Environments (IMPROVE) and Chemical Speciation Network (CSN) (Malm et
al., 1994) for PM2.5 nitrate
AQS and South Eastern Aerosol Research and CHaracterization (SEARCH) for NOx concentrations
NASA’s OMI satellite retrieval product as derived in Lamsal et al. (2014) for the tropospheric NO2 column
cultural plains extending from Iowa to Texas with high fer- aggregated across the CONUS domain varied for May–July
tilizer application rates have the highest biogenic NO and from 15 %–20 % for YL, 20 %–33 % for updated BDSNP,
HONO emission rate, with obvious temporal variability be- and 10 %–13 % for the mechanistic scheme.
tween May and July (Fig. 3). In all of the schemes, soil N Direct observations of soil emissions are sparse and most
represents a substantial fraction of total NOx emissions over were reported decades ago. While the meteorological con-
many rural regions, especially in the western half of the coun- ditions will differ, these observations give us the best avail-
try (Fig. S1 in the Supplement). However, the aggregated able indicator of the ranges of magnitudes of emission rates
budget of soil NO is much less than anthropogenic NOx from actually observed in the field. The sites encompass a vari-
non-soil-related sources because fossil fuel use is concen- ety of fertilized agricultural fields and fertilized and unfertil-
trated in a limited number of urbanized and industrial loca- ized grasslands (Bertram et al., 2005; Hutchinson and Brams,
tions. The percentage contribution of soil NO to total NOx 1992; Parrish et al., 1987; Williams and Fehsenfeld, 1991,
www.geosci-model-dev.net/12/849/2019/ Geosci. Model Dev., 12, 849–878, 2019You can also read