Plan to improve air quality in Barcelona 2015-2018 - Ajuntament de ...
←
→
Page content transcription
If your browser does not render page correctly, please read the page content below
PMQAB
Plan to improve air quality in Barcelona 2015-2018
Ajuntament de Barcelona
Hàbitat Urbà - Medi Ambient i Serveis Urbans
Gerència Adjunta de Medi Ambient i Serveis urbans

Roman Llagostera, gerent-adjunt de Medi Ambient i Serveis Urbans, Ajuntament de Barcelona

Management:
Ricard Alsina, director d’Intervenció, Innovació i Qualitat Mediambiental, Medi Ambient i Serveis Urbans,
Hàbitat Urbà, Ajuntament de Barcelona
Josep M. Selvas, cap del Departament d’Intervenció Ambiental, Ajuntament de Barcelona
Joan Marc Craviotto, Departament d’Intervenció Ambiental, Ajuntament de Barcelona

Drafted by:
Barcelona Regional. Agència Desenvolupament Urbà
Gerència Adjunta de Medi Ambient i Serveis Urbans

Co-ordination:
Jose Lao, cap d’estratègies energètiques, Barcelona Regional
Josep M. Selvas, cap del Departament d’Intervenció Ambiental, Ajuntament de Barcelona
Joan Marc Craviotto, Departament d’Intervenció Ambiental, Ajuntament de Barcelona

Collaborators:
Oriol Teixidó, enginyer químic, Barcelona Regional
Albert Carbonell, biòleg i tècnic de SIG, Barcelona Regional
i l’equip tècnic i administratiu de Barcelona Regional

Special thanks to:
Pilar Rodríguez, Direcció d’Intervenció, Innovació i Qualitat Mediambiental, Ajuntament de Barcelona
Fermí Vallbé, Direcció d’Intervenció, Innovació i Qualitat Mediambiental, Ajuntament de Barcelona
Adrià Gomila, Direcció de Serveis de Mobilitat, Ajuntament de Barcelona
Carlos López, Direcció de Serveis de Mobilitat, Ajuntament de Barcelona
Victòria Plumed, Direcció de Serveis de Mobilitat, Ajuntament de Barcelona
Roberto Ríos, Direcció de Serveis de Mobilitat, Ajuntament de Barcelona
Isabel Montané, Direcció de Serveis de Mobilitat, Ajuntament de Barcelona
Maria Simeón, Direcció de Serveis de Mobilitat, Ajuntament de Barcelona
Carlos Vázquez, Direcció de Serveis de Neteja i Gestió de Residus, Ajuntament de Barcelona
Cristina Castells, Agència d’Energia de Barcelona, Ajuntament de Barcelona
Manel Torrent, Agència d’Energia de Barcelona, Ajuntament de Barcelona
Irma Soldevilla, Agència d’Energia de Barcelona, Ajuntament de Barcelona
Elisabet Gallardo, Agència d’Energia de Barcelona, Ajuntament de Barcelona
Xavier Llebaria, Agència de Salut Pública de Barcelona, Ajuntament de Barcelona
Víctor Peracho, Agència de Salut Pública de Barcelona, Ajuntament de Barcelona
Marc Rico, Agència de Salut Pública de Barcelona, Ajuntament de Barcelona
Carles Chico, Departament de Coordinació d’Obres a l’Espai Públic - Hàbitat Urbà, Ajuntament de Barcelona
Carolina Puig, Departament de Coordinació d’Obres a l’Espai Públic - Hàbitat Urbà, Ajuntament de Barcelona
Àngel López, Departament Vehicle Elèctric, Hàbitat Urbà, Ajuntament de Barcelona
Isabel Hernàndez, Generalitat de Catalunya
Xavier Guinart, Generalitat de Catalunya
Meritxell Margarit, Generalitat de Catalunya
Susana Gil, Generalitat de Catalunya
Jordi Vila, Port de Barcelona
Joaquim Cortés, Port de Barcelona
Santiago Alonso, AENA
Manuel Casas, AENA
Programa Escoles + Sostenibles

APRIL 2015
PMQAB

Pla de millora de la qualitat de l’aire de Barcelona 2015-2018

                                                            English

                                                                         3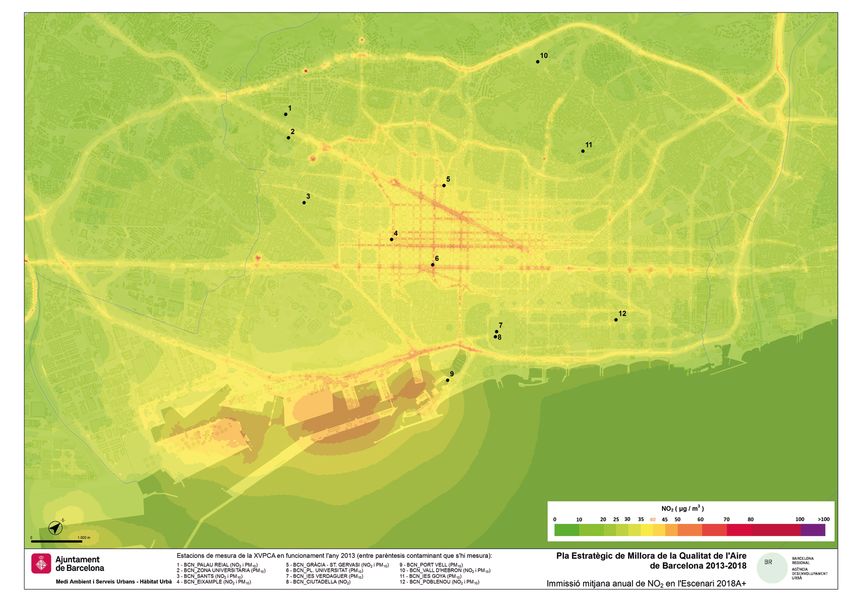
PMQAB
INDEX
1. Introduction 6
2. Aims 6
3. Legislation 7
4. Air quality in Europe: 2003-2012 8
5. Air quality in Barcelona: 2004-2013 13
5.1. Nitrogen oxides: NOX 14
5.2. Particulate matter smaller than 10µ: PM10 18
6. Method and model 25
7. Main results of the modelling: 2013 27
8. Plans and initiatives for improving air quality 31
8.1. Measures relating to urban services:
Barcelona City Council 31
8.2. Measures relating to communication and
environmental education.Barcelona City Council 32
8.3. Measures for local entities established in the PAMQA action plan 33
8.4. Barcelona’s urban mobility plan (PMU) for 2013-2018:
Barcelona City Council 38
8.4.1. PMU scenario: 2018 trend 39
8.4.2. PMU scenario: Action in 2018 40
8.4.3. PMU initiative areas 41
8.4.4. Results of the PMU E-S3 scenario 43
8.5. The Barcelona Self-Sufficiency Strategy
for 2015-2024: Barcelona City Council 44
8.6. Barcelona Port 46
8.7. Barcelona Airport 49
9. Trend scenario: 2018-T 51
10. Action scenario: 2018-A 59
11. Additional action scenario: 2018-A+ 57
11.1. Results of the concentrations model: 2018-A+ scenario 59
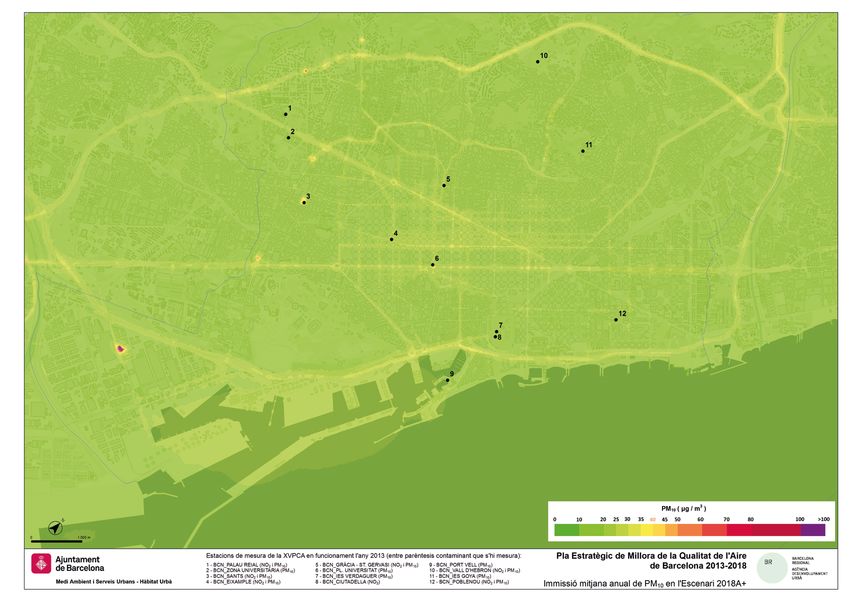
11.2. Maps: 2018-A+ scenario 61
12. Conclusions 66
13. Annexe 67
13.1. Considerations adopted in the
modelling of the 2018 scenario 67
13.2. DMI of vehicles 2013 and 2018-PMU
around the Eixample station 68
5
Plan to improve air quality in Barcelona 2015-2018

    1. INTRODUCTION                                                                                       2. AIMS

    One of the problems of large urban ag-               PM10 in Barcelona kept within the limits         The main aim of this plan is to establish a
    glomerations involves local concentrations           in 2013, but it exceeded them in previous        few strategic guidelines that cross-cut the
    of specific airborne pollutants, such as             years, so it is a pollutant that requires con-   various spheres influencing air quality, to
    nitrous oxides (NOx) and suspended parti-            tinual monitoring. Such emissions are gen-       direct efforts for improving this quality in
    cles (principally PM10 and PM2.5). Generally,        erated by the combustion of hydrocarbons,        the most effective way.
    these contaminants are found in the air              but they can also be released into the air
    due to emissions from road traffic, indus-           through the effect of physical factors, such     To achieve this objective, a strategic plan
    trial centres, domestic discharge and other          as the rolling of vehicle tyres over asphalt,    for 2015-2018 has been developed for im-
    sources. Once released into the air, these           the abrasion of the asphalt itself, the use      proving the air quality in Barcelona and
    pollutants are subject to the various ef-            of brakes in vehicles, dust from building        quantitatively assessing the progress that
    fects of transport and chemical changes,             work or demolitions and the re-suspension        can be made in this parameter by 2018, ta-
    together with other substances also pre-             of road dust. Particulate matter is classed      king into account the plans and measures
    sent in the atmosphere.                              as total suspended particles (TSP; aerody-       to be implemented over the next few years,
                                                         namic diameter ≥ 100μm) and PM, which in-        which may affect, directly or indirectly, air
    As in other urban agglomerations such as             cludes various size categories; for example,     quality in the city of Barcelona.
    Paris, London, Berlin and Rotterdam, NO2             PM10 corresponds to particles up to 10µm in
    concentrations in Barcelona and its metro-           diameter and PM2.5 encompasses particles         Furthermore, the purpose of this document
    politan area have been exceeding the limits          under 2.5µm in diameter.                         is to determine the adequacy of the action
    established by the EU for the protection of                                                           taken when it comes to compliance with
    human health. That means measures need                                                                European regulations on NO2 and PM10 con-
    to be adopted at all levels to improve air                                                            centration levels in all parts of the city.
    quality, from legislators to the business
    sector, not to mention the citizens them-                                                             This document is meant to serve as a tool for
    selves.                                                                                               strategic planning in Barcelona that allows
                                                                                                          the City Council to take a step forwards in
    One of the main emissions sources is the                                                              managing and improving air quality in the
    combustion of hydrocarbon fuels: petrol,                                                              city.
    diesel, liquefied petroleum gas and natu-
    ral gas. These hydrocarbons react with the
    oxygen and nitrogen in the air to generate
    greenhouse gases (CO2, CH4 and N2O) and
    are responsible for pollutants with local ef-
    fects, such as NOx, particulate matter, car-
    bon monoxide (CO), volatile organic com-
    pounds (VOCs) and sulphur dioxide (SO2).

6
PMQAB

3. LEGISLACIÓN

Act 22/1983, of 21 November, on the pro-       EC, Directive 2002/3/EC and Council Deci-
tection of the atmospheric environment,        sion 97/101/EC), with the exception of Di-                   Table 1: Limit values for the pollutants NO2 and PM10.
establishes guidelines that must be fol-       rective 2004/107/EC, on arsenic, cadmium,
lowed to improve environmental quality. In     nickel, mercury and polycyclic aromatic                       Pollutant              EU limit values                            Alert threshold
this context, there arose the subsequent       hydrocarbons (PAHs). This regulation also
Decree 226/2006, declaring several mu-         introduces the measurement of suspended
nicipalities in the counties of Barcelonès,    particles of under 25 microns in diameter
Vallès Oriental, Vallès Occidental and Baix    (PM2.5) and its air quality objectives.
                                                                                                             NO2                    Hourly:                     Annual mean:   Hourly:
Llobregat as areas with special protection
                                                                                                                                    200 µg/m3                   40 µg/m3       400 µg/m3
for the atmospheric environment. Later,        EU Directive 2008/50/EC on ambient air                        (RD 102/2011)
the then Department of Environment and         quality and cleaner air for Europe was im-                                           (Allowed exceedance                        (over three consecutive
                                                                                                                                    limit: 18 times per year)                  hours)
Housing (now the Department of Territory       plemented in Spain through Royal Decree
and Sustainability) approved, on 10 July       102/2011, on improving air quality which,
2007, the action plan to improve air quality   for its part, consolidated Royal Decrees
in those municipalities declared as areas      1073/2002, 1796/2003, 812/2007 and Act
with special protection for the atmospheric    37/2007. Therefore, the current reference
environment by Decree 226/2006 of 23 May.      legislation for assessing air quality con-
                                               sists of EU Directive 2008/50/EC and Royal
Therefore, the metropolitan zone has been      Decree 102/2011. The concentration limits                     PM10                   Daily (24h):                Annual mean:
declared an area with special protection       established by the EU and implemented in                                             50 µg/m3                    40 µg/m3
                                                                                                             (RD 102/2011)
for the atmospheric environment by Decree      its member states are as follows:
                                                                                                                                    (The limit value of 50
226/2006 of 23 May for pollutant nitrogen                                                                                           µg/m3 must not be
dioxide and for suspended particulates                                                                                              exceeded more than 35
                                                                                                                                    times a year or the 90.4
under 10 microns in diameter. This is the                                                                                           percentile must be equal
result of having repeatedly exceeded the                                                                                            to or under the limit
                                                                                                                                    value* of 50 µg/m3)
concentrations of these contaminants in
levels greater than those admissible under
current legislation.

In 2008, the European Parliament and Coun-
cil approved Directive 2008/50/EC, of 21
May, on ambient air quality and cleaner air
                                               Source: DTES, Department of Territory and Sustainabi-
for Europe. This directive consolidates the    lity at the Generalitat of Catalonia. [*] The 90.4 percen-
previous legislation (Directive 96/62/EC,      tile has to be applied to sampling stations with fewer
                                               than 90% of valid measurements.
Directive 1999/30/EC, Directive 2000/69/

                                                                                                                                                                                                          7
Plan to improve air quality in Barcelona 2015-2018

    4. AIR QUALITY IN EUROPE: 2003-2012
                                                                                                                                                                     Nitrogen dioxide

    The reduction in terms of NOX emissions                                                                                                                          There has been a clear downward trend in
    in Europe, according to the latest report            Figure 1: PM2.5, PM10, NOX, SOX, NH3, NMVOC, CO and CH4 emissions trends in the EU                          airborne NO2 concentrations over the last
    on air quality in the region (Air Quality in         from 2003 to 2012.                                                                                          decade in most European countries and at
    Europe - 2014 report, European Environ-                                                                                                                          all types of measuring stations. The reduc-
    mental Agency), is still far from reaching                                                                                                                       tion in terms of NOX emission (30% betwe-
    acceptable air quality levels. The report             Index % 2003                                                                                               en 2003 and 2012) is more pronounced than
    reviews trends in local pollutants in Euro-                                                                                                                      the decrease in annual mean NO2 concen-
    pean cities, from 2003 to 2012, based on                                                                                                                         trations (of 18%) in the EU-28.This differen-
    actual concentration measurements, along                                                                                                                         ce is mainly attributed to the higher per-
    with data on anthropogenic emissions, in             100                                                                                                         centage of NO2 emitted directly from diesel
    an area comprising 38 European countries,                                                                                                                        vehicles.
                                                           90
    including 28 EU member states and certain
    other countries that are members of the                80                                                                                                        In the period 2003-2012 and in the avera-
    European Environmental Agency.                         70                                                                                                        ge for the EU-28, it can be seen that there
                                                                                                                                                                     has been a fall in the annual mean NO2 va-
    The main conclusion of the report is that              60                                                                                                        lue of -0.5 µg/m3/year in urban background
    the most problematic pollutants for human              50                                                                                                        and industrial stations, -0.7 µg/m3/year
    health present in the EU are particle matter                                                                                                                     in traffic areas and -0.2 µg/m3/year in the
    and ground-level ozone, followed by BaP                40                                                                                                        background level.
    and NO2. On the other hand, from the point             30
    of view of ecosystem protection, the most
                                                           20
    harmful contaminants are O3, NH3 and NOX.
                                                           10
    Note that the most problematic pollutant
                                                            0
    in Barcelona is currently NO2, having been
                                                            2003        2004        2005       2006        2007        2008        2009    2010        2011   2012
    PM10 in the recent past. For this reason, the
    Strategic Plan for Improving Air Quality in
                                                                     SOx        NOx           NH3          PM10         PM2,5          NMVOC      CO          CH4
    Barcelona for 2015-2018 focuses exclusi-
    vely on these two contaminants.

                                                         Source: Air Quality in Europe – 2014 report, European Environmental Agency.

8
PMQAB

Figure 2: PM10 and NOX emissions trends by sector for the EU-28 members from 2003                Figure 3: Box plot of the annual mean NO2 levels in Europe (EU-28). Period 2003-2012.
to 2012.

 NOx                                                      PM10

                                                                                                 Source: Air Quality in Europe - 2014 report, European Environmental Agency box plot: upper and lower whiskers:
                                                                                                 upper and lower data limits; bottom line of the box: first quartile (25% of the data); top line of the box: third quartile
       Transport          Commercial, institutional and domestic combustion                      (75% of the data); point: arithmetic mean; red line: legislated value.
       Industry           Use of solvents and products
       Other              Energy ex. industry
                          Agriculture

Source: Air Quality in Europe – 2014 report, European Environmental Agency [Gg = 1.000 tones].

                                                                                                                                                                                                                              9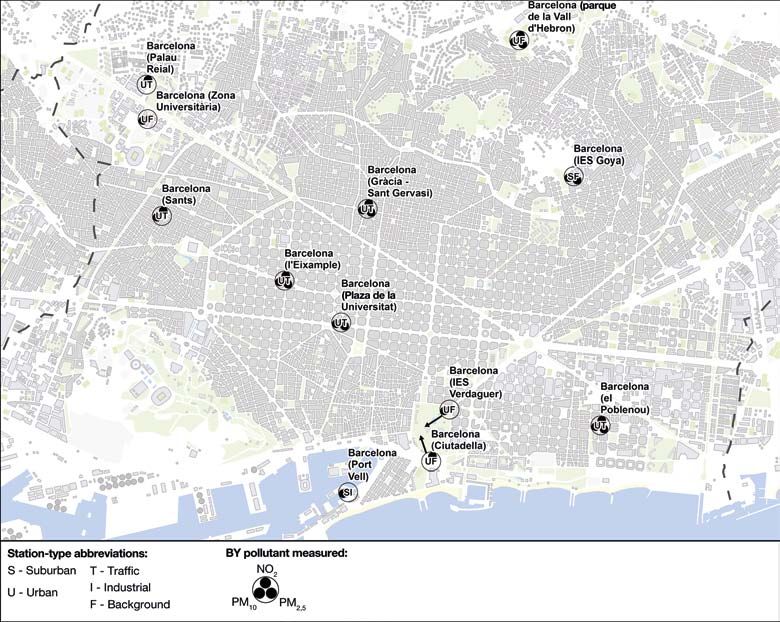
Plan to improve air quality in Barcelona 2015-2018
Figure 4: Box plot of the annual mean NO2 levels in Europe (EU-28). 2012. Figure
Gràfic 55:/ Mean
Gráfico 5 / Graphic
annual 5: Concentracions
NO2 concentrations in Europe.en
2012.
mitjana anual d’NO2 a Europa.
Any 2012 / Concentracions en mitjana anual d’NO2 a Europa. Any 2012 / Concentracions
en mitjana anual d’NO2 a Europa. Any 2012
Annual mean nitrogen
dioxide values for 2012,
based on daily means with
≥ 75% in µg/m3
≤ 20
20-30
30-40
40-50
> 50
No data available
Countries/regions
not included in the
data-exchange process
Source: Air Quality in Europe - 2014 report, European Environmental Agency Box plot: upper and lower whiskers:
upper and lower data limits; bottom line of the box: first quartile (25% of the data); top line of the box: third quartile
(75% of the data); point: arithmetic mean; red line: legislated value.
Font / Fuente
Source: / Source:
Air Quality Air Quality
in Europe – 2014in report,
EuropeEuropean
– 2014 report, European Environmental
Environmental Agency. Agency / Air Quality in Europe
– 2014 report, European Environmental Agency / Air Quality in Europe – 2014 report, European Environmental
Agency
10PMQAB
Particulate matter
A general downward trend can be seen in Gràfic 6 / Gráfico 6 / Graphic 6: Diagrama de caixes de les mitjanes anuals de Font / Fuente / Source: Air Quality in Europe – 2014
report, European Environmental Agency. Diagrama de
the airborne PM10 concentrations in the pe- Figure 6: Box(EU-28).
PM10 a Europa Període
plot of PM 10
2003-2012
annual / Diagrama
means in de caixes
Europe (EU-28). de les
Period mitjanes anuals
2003-2012. caixes: puntes superior i inferior: extrems superior i
de PM10 a Europa (EU-28). Període 2003-2012 / Diagrama de caixes de les mitjanes inferior de les dades, caixa línia inferior: primer quartil
riod 2003-2012, as well as a reduction in PM (25% dades), caixa línia superior: tercer quartil (75%
emissions. Most stations recorded a decre- anuals de PM10 a Europa (EU-28). Període 2003-2012. de les dades), punt: mitjana aritmètica; línia vermella:
valor legislat / Air Quality in Europe – 2014 report,
ase of -1 µg/m3/year or more in the period European Environmental Agency. Diagrama de caixes:
2003-2012 and only 2% of stations recorded puntes superior i inferior: extrems superior i inferior
de les dades, caixa línia inferior: primer quartil (25%
an increase. dades), caixa línia superior: tercer quartil (75% de les
dades), punt: mitjana aritmètica; línia vermella: valor
legislat / Air Quality in Europe – 2014 report, European
On average, the urban background stations Environmental Agency. Diagrama de caixes: puntes su-
recorded a drop of -0.7 µg/m3/year in annual perior i inferior: extrems superior i inferior de les dades,
caixa línia inferior: primer quartil (25% dades), caixa
mean and -0.9 µg/m3/year in the 90.4 per- línia superior: tercer quartil (75% de les dades), punt:
centile, whereas the traffic stations recor- mitjana aritmètica; línia vermella: valor legislat.
ded decreases of -1.0 and -1.5 µg/m3/year,
respectively.
Source: Air Quality in Europe - 2014 report, European Environmental Agency Box plot: upper and lower whiskers:
upper and lower data limits; bottom line of the box: first quartile (25% of the data); top line of the box: third quartile
(75% of the data); point: arithmetic mean; red line: legislated value.
11Plan to improve air quality in Barcelona 2015-2018
Figure 7: Box plot of the 90.4 percentile of PM10 daily means in Europe (EU-28). 2012. Figure 8: Percentil
Gràfic 8: 90.4 percentile
90,4 deofles
PM daily means
mitjanes
10 diàriesinde
Europe.
PM10 a2012.
Europa. Any 2012.
90.4 percentile of the PM10
concentration in 2012,
based on the daily mean
with valid measurements of
≥ 75% in µg/m3
≤ 20
20-40
40-50
50-75
> 75
No data available
Countries/regions
not included in the
data-exchange process
Source: Air Quality in Europe - 2014 report, European Environmental Agency Box plot: upper and lower whiskers:
upper and lower data limits; bottom line of the box: first quartile (25% of the data); top line of the box: third quartile
(75% of the data); point: arithmetic mean; red line: legislated value.
Source:
Font: AirAir Quality
Quality in Europe
in Europe - 2014
– 2014 report,
report, European
European Environmental
Environmental Agency.
Agency.
12PMQAB
5. AIR QUALITY IN BARCELONA: 2004-2013
In Barcelona in 2013, the annual mean NO2 November and defined by the Order of 20 as one of the systems for evaluating the The location of the various monitoring sta-
concentrations at both of the city’s sam- June, 1986. It has a pyramidal structure atmospheric environment. tions in Barcelona is shown below accord-
pling stations in areas of intense traffic with the base formed by the measuring • Locating air-pollutant emission sources ing to the pollutants measured (NO2, PM10,
exceeded the European threshold .Even points and the apex being the receiving and having information available for as- PM2.5) and whether they are traffic, indus-
so, in recent years there has been a down- and data coordination centre. A measuring sessing any potential impact. trial or background measurement stations:
ward trend in the recorded concentrations point is the zone in the region that houses
of this pollutant. the sampling and pollutant analysis equip-
ment, manual and automatic alike. Figure 9: Location map of XVPCA stations in Barcelona.
2013 was the first year when the PM10 con-
centration levels recorded at all sampling The main aim of this network is to moni-
stations were below the European thresh- tor air quality, i.e. record the concentration
olds. Although it could be argued that Bar- levels of major atmospheric pollutants and
celona already complies with the regu- from the results of these measurements,
lations, measures still need to continue determine whether corrective measures
being taken, to prevent the pollutant from are necessary. The network, therefore, is
exceeding its established limits once again. extremely useful for:
This strategic plan focuses on NO2 and PM10 • Understanding temporal trends in air
because these are the only contaminants quality levels in the region.
that are or have been recorded at levels • Informing citizens of the state of air
above the European limit values in recent quality and its trends.
years. They are therefore the only ones that • Taking action in areas where health pro-
have to be the subject of any plans drawn tection limit values are exceeded or at
up under the applicable regulations. risk of being exceeded.
• Drawing up maps of territorial vulner-
The main tool for assessing air quality is ability and capacity (as an instrument to
the XVPCA (Network for Monitoring and guide regional planning).
Forecasting Air Pollution), co-managed • Complying with current regulations re-
in Barcelona by the city’s Public Health garding the protection of the atmospher-
Agency and the Generalitat of Catalonia. ic environment. The standards regulat-
ing air quality establish the measuring
The XVPCA is a system for detecting the of atmospheric pollutant concentrations
concentration levels of major pollutants.
It was set up following Act 22/1983, of 21 Source: Barcelona Regional Only fixed measuring stations (F) have been considered; indicative measuring stations
(i) have not been included.
13Plan to improve air quality in Barcelona 2015-2018
Below is a review of the concentration lev- indicate that the annual mean European
el trends of nitrogen oxides and particles threshold was only exceeded at two sta- Figure 10: Location of the NO2 measuring stations in Barcelona, indicating those sta-
of under 10 microns in diameter, measured tions: Eixample and Gràcia - Sant Gervasi tions that exceeded the annual mean European threshold in 2013.
at Barcelona’s XVPCA stations. (in 2012 there were four). This represents
an important improvement. On the other
5.1. NITROGEN OXIDES: NOX hand, the maximum hourly limit was not ex-
ceeded at any station.
65% of the nitrogen oxides emitted in Cata-
Below are the two stations that in 2013
lonia come from motor vehicles, though
exceeded the maximum annual mean con-
transport may represent as much as 70% of
centration.
all emissions in urban areas. Nitrogen ox-
ides (NOx = NO + NO2) are generated at high
temperatures (for example, during hydro-
carbon combustion) as oxygen and nitro-
gen in the air react with one another. Part
of this reaction produces NO and another
results in NO2. After combustion, some of
the NO, once released into the air, can be
transformed into NO2 through a process
known as oxidation. This process is caused
by certain chemical reactions involving the
NO present in the air and sunlight, as well
as other external factors.
The EU has established mean annual and
hourly concentration limits for NO2. The
first states that mean annual NO2 values
must not exceed 40 μg/m3 and the second NO2 concentration measuring stations
states that the fixed NO2 hourly limit of 200 Within the European threshold
µg/m3 must not be exceeded more than 18 Exceeding the European threshold (40 μg/m3)
times per year.
Source: Barcelona Regional Only fixed measuring stations (F) have been considered; indicative measuring stations
The NO2 measurements recorded in 2013 (i) have not been included.
for the various XVPCA stations in Barcelona
14PMQAB
Table2: Number of stations in Barcelona in 2013 by type and municipality.NO2 measurement. Figure 11: Annual mean concentrations of NO2 [2012 and 2013].
Suburban- Suburban- Suburban- Urban-bac- Urban- Total
background industrial traffic kground traffic Annual mean concentrations of NO2 [2012 and 2013]
Barcelona
Barcelona (Eixample)
2 5 7 70
60
Source: DTES. Only fixed measuring stations (F) have been considered; indicative measuring stations (i) have not been
included. 50
Barcelona (Parc de la Barcelona (Gràcia - Sant
Vall d'Hebron) Gervasi)
40
The following figure shows the annual mean that all the stations recorded improved 30
NO2 concentration levels recorded at the concentrations in 2013 (blue) with respect 20
seven stations in 2013. If the blue and green to 2012 (green). The figure also shows the 10
lines are compared, it can be generally seen annual mean legislated limit (red line).
0
Barcelona (Palau Reial) Barcelona (Poblenou)
Barcelona (Sants) Barcelona (Ciutadella)
EU limit (40 ug/m3) XVPCA-NO2 (2012) XVPCA-NO2 (2013) [variable arranged from highest to lowest]
Source: Barcelona Regional with data from the DTES. Only fixed measuring stations (F) have been considered; indica-
tive measuring stations (i) have not been included.
15Plan to improve air quality in Barcelona 2015-2018
Below are the details of the levels record-
ed by the stations in Barcelona since 2005. Figure 12: Annual mean NO2 concentrations in Barcelona, 2013-2005.
Mitjana
anual
de
la
immissió
de
NO2
a
Barcelona
[2012]
Immissió
Concentration <
Límit
< EUElimit
Mitjana
anual
de
la
immissió
de
NO2
a
Barcelona
[2012]
U Immissió
>
Limit
Concentration > EUElimit
U Limit
EU limitEU
Mitjana
anual
de
la
immissió
de
NO2
a
Barcelona
[2013] Mitjana
anual
de
la
immissió
de
NO2
a
Barcelona
[2010]
Mitjana
anual
de
la
immissió
de
NO2
a
Barcelona
[2011]
Immissió
<
Límit
EU Immissió
>
Limit
EU Immissió
Limit
EU <
Límit
EU Immissió
>PROMIG
Limit
EUBARCELONA
Limit
EU Immissió
<
Límit
EU Immissió
>
Limit
EU Limit
EU
Immissió
<
Límit
EU Immissió
>
Limit
EU Limit
EU
PROMIG
MEAN
BARCELONA BARCELONA
VALUE PROMIG
BARCELONA PROMIG
BARCELONA
PROMIG
BARCELONA
Barcelona
(Ciutadella)
Barcelona
(Ciutadella) Barcelona
(Ciutadella) Barcelona
(Ciutadella)
Barcelona
(Ciutadella)
Barcelona
(Eixample) Barcelona
(Eixample) Barcelona
(Eixample) Barcelona
(Eixample)
Barcelona
(Eixample)
Barcelona
(Gràcia
-‐
Sant
Gervasi) Barcelona
(Gràcia
-‐
Sant
Gervasi) Barcelona
(Gràcia
-‐
Sant
Gervasi)
Barcelona
(Gràcia
-‐ Barcelona
Sant
Gervasi)
(Gràcia
-‐
Sant
Gervasi)
Barcelona
(Palau
Reial) Barcelona
(Palau
Reial) Barcelona
(Palau
Reial) Barcelona
(Palau
Reial)
Barcelona
(Palau
Reial)
Barcelona
(Parc
Vall
d'Hebron) Barcelona
(Parc
Vall
d'Hebron) Barcelona
(Parc
Vall
d'Hebron) Barcelona
(Parc
Vall
d'Hebron)
Barcelona
(Poblenou) Barcelona
(Poblenou) Barcelona
(Parc
Vall
d'Hebron)
Barcelona
(Poblenou) Barcelona
(Poblenou)
Barcelona
(Sants) ug/m3
[Barcelona
2013] (Sants) Barcelona
ug/m3
(Poblenou)[2012]
Barcelona
(Sants) ug/m3
[Barcelona
2011] (Sants) ug/m3
[2010]
0 10 20 30 40 50 60 70 80 90
0 10 20 30 40 50 60
Barcelona
(Sants)
70 80 90
0 10 20 30 40 50 60 70 80 90
0 10 20 30 40 50 60 70 80 90
ug/m3
[2012]
Mitjana
anual
de
la
immissió
de
NO2
a
Barcelona
[2009]
2013] Mitjana
anual
de
la
immissió
de
NO2
a
Barcelona
[2008] Mitjana
anual
de
la
immissió
de
NO2
a
Barcelona
[2007] Mitjana
anual
de
la
immissió
de
NO2
a
Barcelona
[2006]
Mitjana
anual
de
la
immissió
de
NO2
a
Barcelona
[2005]
Immissió
<
Límit
EU Immissió
>
Limit
EU Limit
EU <
Límit
EU
Immissió
Immissió
>
Limit
EU Limit
EU 0 <
Límit
Immissió
10 EU20 30 40 >
Limit
Immissió
50 EU 60 70 EU80 <
Límit
Immissió
Limit
90 EU Immissió
>
Limit
EU Immissió
Limit
EU<
Límit
EU Immissió
>
Limit
EU Limit
EU
PROMIG
MEAN
BARCELONA BARCELONA
VALUE PROMIG
BARCELONA PROMIG
BARCELONA PROMIG
BARCELONA PROMIG
BARCELONA
Barcelona
(Ciutadella) Barcelona
(Ciutadella) Barcelona
(Ciutadella) Barcelona
(Ciutadella) Barcelona
(Ciutadella)
Barcelona
(Eixample) Barcelona
(Eixample) Barcelona
(Eixample) Barcelona
(Eixample) Barcelona
(Eixample)
Barcelona
(Gràcia
-‐
Sant
Gervasi) Barcelona
(Gràcia
-‐
Sant
Gervasi) Barcelona
(Gràcia
-‐
Sant
Gervasi) Barcelona
(Gràcia
-‐
Sant
Gervasi) Barcelona
(Gràcia
-‐
Sant
Gervasi)
Barcelona
(Palau
Reial) Barcelona
(Palau
Reial) Barcelona
(Palau
Reial) Barcelona
(Palau
Reial) Barcelona
(Palau
Reial)
Barcelona
(Parc
Vall
d'Hebron) Barcelona
(Parc
Vall
d'Hebron) Barcelona
(Parc
Vall
d'Hebron) Barcelona
(Parc
Vall
d'Hebron) Barcelona
(Parc
Vall
d'Hebron)
Barcelona
(Poblenou) Barcelona
(Poblenou) Barcelona
(Poblenou) Barcelona
(Poblenou) Barcelona
(Poblenou)
Barcelona
(Sants) ug/m3
[2009]
2013]
Barcelona
(Sants) ug/m3
[2008]
Barcelona
(Sants) ug/m3
[2007]
Barcelona
(Sants) ug/m3
[2006]
Barcelona
(Sants) ug/m3
[2005]
0 10 20 30 40 50 60 70 80 90
0 10 20 30 40 50 60 70 80 90
0 10 20 30 40 50 60 70 80 90
0 10 20 30 40 50 60 70 80 90
0 10 20 30 40 50 60 70 80 90
Source: Barcelona Regional with data from the DTES (Department of Territory and Sustainability of the Generalitat of Catalonia). Only fixed measuring stations (F) have been considered; indicative measuring stations (i) have not been included.
16PMQAB
Table 3: Annual mean NO2 concentrations at Barcelona’s XVPCA stations. Data in μg/m3.
2004 2005 2006 2007 2008 2009 2010 2011 2012 2013
EU limit → 52 50 48 46 44 μg/m3 42 Màxim de mitjana anual 40 40 40 40
μg/m3 Mitjana anual
Name of XVPCA station [∆] 2004 2005 2006 2007 2008 2009Mínim de mitjana anual2010
μg/m3 2011 2012 2013
Sants-Montjuïc UT 36 49 31 47 45 41 41 40 37 33
Poblenou UT 40 43 47 42 47 51 45 2004 2005 43
2006 2007 2008 2009 42 2010 2011 2012 402013
μg/m3 Màxim de mitjana anual
Parc de la Vall d'Hebron UF -- -- -- -- 36 μg/m3 40 Mitjana anual 37 33 31 27
μg/m3 Mínim de mitjana anual
Palau Reial UT -- -- -- -- -- -- -- 32 36 32
Gràcia - Sant Gervasi UT 67 83 74 63 63 63 64 66 61 54
2004 2005 2006 2007 2008 2009 2010 2011 2012 2013
Eixample UT 60 68 68 66 65 μg/m3 62 Màxim de mitjana anual -- 65 61 56
μg/m3 Mitjana anual
La Ciutadella UF 43 48 47 46 42 μg/m3
46 Mínim de mitjana anual
46 40 42 35
Source: DTES. Department of Territory and Sustainability of the Generalitat of Catalonia [Δ] UT = Urban-traffic, UB =
Urban-background. Exceedance of the European threshold is indicated in red. Figure 13: Trends in average NO2 concentrations at the stations in Barcelona.
Number of station NO2 [Maximum value of the annual mean] NO2 [Annual mean] NO2 [Minimum value of the annual mean] Nu
Annual rate
If we take the average of the mean annual -2.39% in annual values since 2004, a fig-
concentrations at Barcelona’s seven NO2 ure that represents an average reduction
measuring stations, it can be seen that of -1.0 µg/m3 per year. This mainly ongo-
the mean concentration was 39.6 µg/m3 ing trend can be seen from the following
in 2013, revealing a downward trend of figure.
Source: Barcelona Regional Only fixed measuring stations (F) have been considered; indicative measuring stations
(i) have not been included.
17Plan to improve air quality in Barcelona 2015-2018
The maximum levels of the annual means 5.2. PARTICULATE MATTER SMALLER
shown in the previous figure (red line) are Figure 14: Percentage of stations in Barcelona that exceeded EU limits (NO2). THAN 10µM: PM10
the maximum values reached in the con-
sidered stations each year. In the case of Particulate matter is usually generated
NO2, the red line shows the annual mean by traffic, as a result of the combustion of
concentrations in the stations of Gràcia - 100% certain fuels, but it may also be present
NO2:
Sant Gervasi and Eixample (they alternate 90% % stations that exceeded
in the air from activities that have noth-
according to the year), while the minimum the limits / total stations
80% ing to do with combustion, such as public
80%
annual mean levels mainly correspond to works or re-suspension of particles previ-
70% 67% 67%
the station in Parc de la Vall d’Hebron. 60% ously deposited on the ground (e.g. when
60% 57%
vehicles circulate on the road); this latter
Note that it is the red line that indicates 50%
43%
phenomenon is more intense during in
compliance or non-compliance with Eu- 40% 40% 40% periods with little rain.
40%
ropean air quality threshold and this line 29%
30%
reflects a reduction of -1.97% per year, Note however that there is a significant
data that shows the improving trend of 20% contribution of particulate matter from
recent years. 10% outside the city; this is input from the re-
0% gional background. The particles may be
In general, 29% of the fixed XVPCA meas- 2004 2005 2006 2007 2008 2009 2010 2011 2012 2013
uring stations in Barcelona in 2013 ex-
ceeded the maximum levels admitted by
legislation. The following figure shows the Source: Barcelona Regional Only fixed measuring stations (F) have been considered; indicative measuring stations (i)
have not been included.
drop in this percentage since 2010. It also
shows the increase from 2004 to 2010,
principally because the European an-
nual mean threshold for NO2 has become
much stricter since 2004; the threshold
decreased from 52 µg/m3 in 2004 to 40 µg/
m3 in 2010.
18PMQAB
solid or liquid and include dust, metals, ual measurements), then the above-men-
ash, cement and pollen. The definition of tioned daily exceedance threshold will Figure 15: Location of the PM10 measuring stations in Barcelona; it can also be seen
PM10 implies that the particles have a di- not be applied and the 90.4 percentile will that no station exceeded the average mean PM10 threshold in 2013.
ameter of under 10 µm. be evaluated instead and it will have to be
under or equal to 50 µg/m3. This means
European legislation sets an annual mean that some particulate-matter measuring
concentration level as well as a daily stations exceed the percentile levels set
mean. The first establishes that an annu- out under the new decree, where they are
al mean value of 40 μg/m3 must not be ex- not in exceedance under the regulations
ceeded. The second states that the daily and the calculation method of the previ-
mean of 50 µg/m3 must not be exceeded ous decree.
more than 35 times in a year.
Below is a location map for the PM10
Note too, that, under Royal Decree measuring stations.
102/2011, where the number of valid daily
particulate matter readings is under 90%
(a typical situation in stations with man-
Table 4: Number of stations per type in Barcelona in 2013. PM10 measurement.
Suburban- Suburban- Suburban- Urban- Urban- Total PM10 concentration measuring stations PM10
background industrial traffic background traffic Within the European threshold
Barcelona
1 4 5 10 Exceeding the European threshold (40 μg/m3)
Source: DTES. Only fixed measuring stations (F) have been considered; indicative measuring stations (i) have not been Source: Barcelona Regional Only fixed measuring stations (F) have been considered; indicative measuring stations
included. (i) have not been included.
19Plan to improve air quality in Barcelona 2015-2018
In Barcelona in 2013, ten fixed PM10 meas- The following figure details the levels re-
uring points were installed and none re- Figure 16: Annual mean PM10 concentrations [2012 and 2013]. corded by the stations since 2005. In ad-
M10 corded values
XVPCA-
tablished
riable exceeding the threshold es-
d'ordenació de dition, the symbol
* shows the stations
PM10 for annual mean Límit concentrations
EU (40 Immissió de PM10 en mitjana anual [2012 i 2013] which complied with the European annual
(this(2012)
has been true since 2010). In addition,
ug/m3) Barcelona (Plaça de la mean levels but failed to meet the daily
de la Universitat) 40 Universitat)
ple)
none of these recorded values exceeded
40 50 mean exceedance thresholds.
rdaguer) the corresponding daily mean threshold 40 Barcelona (Parc de la 45
- Sant Gervasi) (this threshold was exceeded in 40 Barcelona (Eixample)
2012 by Vall d'Hebron) 40
40 35
ou)
two stations and in 2011 by three). 40
30
ell) 40
Universitària) 25
The following figure shows the annual
40 mean
oya) 40 20
PM10 concentration levels recorded
e la Vall d'Hebron) 40
in Barcelona (IES Goya) 15 Barcelona (IES Verdaguer)
2012 and 2013 at the XVPCA stations in Bar- 10
celona. Also shown on the figure, marked by 5
*
a , are those stations that, although com-
plying with the European average mean
0
concentration threshold, did not meet the
Barcelona (Zona Barcelona (Gràcia - Sant
daily mean exceedance thresholds. Universitària) Gervasi)
Barcelona (Port Vell) Barcelona (Sants)
Barcelona (Poblenou)
EU limit (40 ug/m )
3
XVPCA-PM10 (2012) XVPCA-PM10 (2013) [variable arranged from highest to lowest]
Source: Barcelona Regional with data from the DTES. Only fixed measuring stations (F) have been considered; indica-
tive measuring stations (i) have not been included.
Note for PM10: The asterisk * indicates sampling stations that did not comply with the maximum limits established for
daily PM10 concentration measurements, even though their annual concentrations were below the maximum stipulated
mean.
20PMQAB
Figure 17: Annual mean PM10 concentrations at the stations in Barcelona, 2013-2005.
Mitjana
anual
de
la
immissió
de
NO2
a
Barcelona
[2012]
Mitjana
anual
de
la
immissió
de
PM10
a
Barcelona
Mitjana
Immissió
Mitjana
Concentration
Limit
Concentration > EUE UEU
limit Limit
EU
anual
de
la
immissió
de
PM10
a
Barcelona
[2011]
limitEUE
U
Mitjana
anual
de
la
immissió
de
PM10
a
Barcelona
[2010]
Immissió
limit
EUImmissió
Limit
limit
EU Immissió
Limit
limit
EU Limit
EU
PROMIG
MITJANA
BARCELONA MEANBarcelona
VALUE PROMIG
Barcelona PROMIG
Barcelona PROMIG
Barcelona
Barcelona
(Ciutadella)
Barcelona
(c/
Lluís
Solé
i
Sabaris) Barcelona
(c/
Lluís
Solé
i
Sabaris) Barcelona
(c/
Lluís
Solé
i
Sabaris) Barcelona
(c/
Lluís
Solé
i
Sabaris)
Barcelona
(Eixample) Barcelona
(Eixample) Barcelona
(Eixample)
Barcelona
(Eixample) Barcelona
(Eixample)
Barcelona
(Gràcia
-‐
Sant
Gervasi)
Barcelona
(IES
Goya)
Barcelona
(Gràcia
-‐
Sant
Gervasi)
Barcelona
(IES
Goya)
*
Barcelona
(Gràcia
-‐
Sant
Gervasi)
Barcelona
(Gràcia
-‐ Sant
Gervasi)
Barcelona
(IES
Goya)
*
Barcelona
(Gràcia
-‐
Sant
Gervasi)
Barcelona
(IES
Goya)
Barcelona
(IES
Vergader) Barcelona
(IES
Vergader) Barcelona
Reial)(IES
Vergader)
Barcelona
(Palau
Barcelona
(IES
Vergader)
Barcelona
(Parc
Vall
d'Hebron) Barcelona
(Parc
Vall
d'Hebron) Barcelona
(Parc
Vall
d'Hebron) Barcelona
(Parc
Vall
d'Hebron)
Barcelona
(Parc
Vall
d'Hebron)
Barcelona
(Plaça
Universitat)
Barcelona
(Poblenou)
Barcelona
(Plaça
Universitat)
Barcelona
(Poblenou)
Barcelona
(Plaça
Universitat)
Barcelona
(Poblenou)
Barcelona
(Poblenou)
*Barcelona
(Plaça
Universitat)
Barcelona
(Poblenou)
Barcelona
(Port
Vell) Barcelona
(Port
Vell) Barcelona
(Port
Vell) Barcelona
(Port
Vell)
Barcelona
(Sants) ug/m3
[2012]
Barcelona
(Sants)
Barcelona
(Zona
Universitària) Barcelona
Barcelona
(Sants)
(Zona
Universitària)
* Barcelona
(Sants)
Barcelona
(Zona
Universitària)
*50 60 (Zona
Barcelona
(Sants)
*
ug/m3
[2013] ug/m3
[2012] 0 10 20 30 40 ug/m3
[2011]
Barcelona
70Universitària)
80 90 ug/m3
[2010]
0 10 20 30 40 50 60 70 80 90
0 10 20 30 40 50 60 70 80 90
0 10 20 30 40 50 60 70 80 90
0 10 20 30 40 50 60 70 80 90
Mitjana
Mitjana
anual
de
la
immissió
de
PM10
a
Barcelona
[2010]
Mitjana
2009]anual
de
la
immissió
de
PM10
a
Barcelona
[2008] anual
de
la
immissió
de
PM10
a
Barcelona
Mitjana
Mitjana
[2007]anual
de
la
immissió
de
PM10
a
Barcelona
[2006]anual
de
la
immissió
de
PM10
a
Barcelona
[2005]
Immissió
limit
EUImmissió
Limit
limit
EU Immissió
Limit
E
limit
EUImmissió
Limit
limit
EUImmissió
Limit
limit
EU Limit
EU
PROMIG
MITJANA
BARCELONA MEANBarcelona
VALUE PROMIG
Barcelona PROMIG
Barcelona PROMIG
Barcelona PROMIG
Barcelona
Barcelona
(c/
Lluís
Solé
i
Sabaris)
Barcelona
(Eixample)
Barcelona
(c/
Lluís
Solé
i
Sabaris)
Barcelona
(Eixample)
*
Barcelona
(c/
Lluís
Solé
i
Sabaris)
*
Barcelona
(c/
Lluís
Solé
i
Sabaris)
Barcelona
(Eixample)
Barcelona
(c/
Lluís
Solé
i
Sabaris)
Barcelona
(Eixample)
*
Barcelona
(Eixample)
Barcelona
(Gràcia
-‐
Sant
Gervasi)
Barcelona
(IES
Goya)
*
Barcelona
(Gràcia
-‐
Sant
Gervasi)
Barcelona
(IES
Goya)
Barcelona
(Gràcia
-‐
Sant
Gervasi)
Barcelona
(IES
Goya)
Barcelona
(Gràcia
-‐
Sant
Gervasi)
Barcelona
(IES
Goya)
Barcelona
(Gràcia
-‐
Sant
Gervasi)
Barcelona
(IES
Goya)
Barcelona
(IES
Vergader) Barcelona
(IES
Vergader) Barcelona
(IES
Vergader) Barcelona
(IES
Vergader) Barcelona
(IES
Vergader)
Barcelona
(Parc
Vall
d'Hebron)
*Barcelona
(Plaça
Universitat)
Barcelona
(Parc
Vall
d'Hebron)
*Barcelona
(Plaça
Universitat)
Barcelona
(Parc
Vall
d'Hebron) Barcelona
(Parc
Vall
d'Hebron) Barcelona
(Parc
Vall
d'Hebron)
Barcelona
(Plaça
Universitat)
Barcelona
(Poblenou)
* Barcelona
(Poblenou) Barcelona
(Poblenou)
Barcelona
(Plaça
Universitat)
Barcelona
(Poblenou)
Barcelona
(Plaça
Universitat)
Barcelona
(Poblenou)
Barcelona
(Port
Vell)
* Barcelona
(Port
Vell)
* Barcelona
(Port
Vell)
* Barcelona
(Port
Vell) Barcelona
(Port
Vell)
Barcelona
(Sants)
Barcelona
(Zona
Universitària)
* Barcelona
(Sants) Barcelona
(Sants) Barcelona
(Sants)
Barcelona
Barcelona
(Sants)
(Zona
Universitària)
ug/m3
[2010]
Barcelona
(Zona
Universitària)
2009] ug/m3
Barcelona
[2008]
(Zona
Universitària) Barcelona
ug/m3
(Zona
Universitària)
[2007] ug/m3
[2006] ug/m3
[2005]
0 10 20 30 40 50 60 70 80 90
0 10 20 30 40 50 60 70 80 90
0 10 20 30 40 50 60 70 80 90
0 10 20 30 40 50 60 70 80 90
0 10 20 30 40 50 60 70 80 90
Source: Barcelona Regional with data from the DTES: Department of Territory and Sustainability of the Generalitat of Catalonia Only fixed measuring stations (F) have been considered; indicative measuring stations (i) have not been included.
21Plan to improve air quality in Barcelona 2015-2018
Table 5: Annual mean PM10 concentrations at Barcelona’s XVPCA stations. Data in μg/m3.
EU limit → 40 40 40 40 40 40 40 40 40 40
Name of XVPCA station [∆] 2004 2005 2006 2007 2008 2009 2010 2011 2012 2013
Zona Universitària UF 34 33 34 33 31 34 27 29 28 20
Sants-Montjuïc UT 52 49 62 54 44 48 34(*) 39(*) 38(*) 25
El Port Vell SI -- -- -- 40(*) 36(*) 34(*) 28 29 32 24
Poblenou UT -- -- -- 54 45 46 32 32 31 25
Plaça de la Universitat UT 46 47 52 43 43 40(*) 34 37(*) 33 27
Parc de la Vall d'Hebron UF -- -- -- -- 33(*) 34(*) 25 25 24 19
IES Verdaguer UF -- -- -- -- -- 33 29 32 31 26
IES Goya SF -- -- -- 33 30 -- 29 30 27 20
Gràcia - Sant Gervasi UT 50 48 49 46 39 40(*) 33 37(*) 38(*) 26
L'Eixample UT 55 55 59 49 43 41 -- 34 33 27
C. Lluís Solé i Sabarís UF -- 39(*) 42 38(*) 38(*) -- -- -- -- --
Source: DTES, Department of Territory and Sustainability of the Generalitat of Catalonia [Δ] UT = Urban-traffic, If we consider the PM10 measuring stati- sents an average reduction -2.6 µg/m3 per
UB = Urban-background, SB = Suburban-background, SI = Suburban-industrial In red are the values exceeding
the European annual mean threshold; stations marked with an asterisk (*) are those that exceeded the daily limit ons in Barcelona, in 2013 the mean con- year. The maximum annual mean values
values: LVd or P90.4, even though the annual means were below the EU limit. centration was 23.9 µg/m3, a drop of -7.3% (red line) also fell at a similar rate.
with respect to the 2004 value. This repre-
22PMQAB
12 2013
12 2013
Figure 18: PM10 concentration trends averaged over the XVPCA stations in Barcelona. Figure 19: Percentage of XVPCA stations in Barcelona that exceeded the EU limits
(PM10).
nual mean] Number of station PM10 [Maximum value of the annual mean] PM10 [Annual mean] PM10 [Minimum value of the annual mean]
100%
Annual rate
PM10:
90% 83% 83% % stations that exceeded
80% 78% 78%
80% the limits / total stations
70%
70%
60%
50%
40%
*
*
30%
30%
20%
*
11%
20%
10%
0%
0%
2004 2005 2006 2007 2008 2009 2010 2011 2012 2013
Source: Barcelona Regional Only fixed measuring stations (F) are considered; indicative measuring stations (i) have Source: Barcelona Regional Only fixed measuring stations (F) have been considered; indicative measuring stations
not been considered. (i) have not been included.
As can be seen in the two following figu- since 2009 and in 2013 it was 0%, a per- Note: 2010, 2011 and 2012 (marked with *): Although none of the stations exceeded the average EU limit, they did
exceed the daily limit values: LVd or P90.4 (this latter value is only considered at stations registering under 90%
res, the percentage of stations exceeding centage indicating that no station excee- valid measurements).
the PM10 limits has dropped drastically ded the European threshold.
23Plan to improve air quality in Barcelona 2015-2018
Climate has also had an effect on these fi-
gures, particularly in recent years, as this Figure 20: Trend of annual mean wind speeds recorded at Barcelona Fabra
pollutant is heavily influenced by meteo- Observatory.
rological conditions. The following figure
shows how from 2009 to 2010 the concen-
tration of PM10 dropped significantly, whi-
5
le average wind speed increased. This is Wind speed (m/s)
exactly the opposite of what happened in 4.8
4.63
2010 to 2011. 4.6
4.4 4.32
4.27
4.17 4.17 4.21 4.20
4.2 4.05
3.99 4.01
4
3.8
3.6
3.4
3.2
3
2004 2005 2006 2007 2008 2009 2010 2011 2012 2013
Source: Meteocat.
24PMQAB
6. METHOD AND MODEL
For the purposes of regionally modelling air at street scale. It calculates the dispersion
quality levels, a detailed inventory had to be and concentration of pollutants from any Image 1: Diagram of emission layers introduced using ADMS-Urban by means of ArcGIS.
made of the pollutant-emission sources dis- emission source, including traffic, indus-
tributed throughout the region and not just trial, domestic, commercial, airport and boat
within the studied municipality, as the con- emissions and enables the calculation of
taminants may travel long distances from the hour-by-hour, daily and annual mean con-
places they are emitted from. It was through centrations, as well as exceedances of pol-
this inventory and all the environmental vari- lutants such as NOx, NO2, O3, PM10 and PM2.5. Road
traffic
ables (e.g. wind regime, precipitation, relief,
ADMS-Urban is a specific tool to help in de-
building configuration and source concentra-
cision making for medium- and long-term
tion) that the NO2 and PM10 contamination lev-
policies aimed at improving air quality in cit- s
els were calculated on an hour-by-hour basis. Buse
ies and metropolitan areas.
The work was conducted under the frame-
The model is used by many cities and re-
work of the 2013 Barcelona Local Pollution gions, including London, Beijing, Shanghai, Airpo
rt
Evaluation study, using data collected and Hong Kong, Budapest, Strasbourg, Rome
processed for developing an inventory of and California. It also has been used in the
ort
regional-scale geo-referenced emissions Generalitat of Catalonia’s action plan for im- The p
with information broken down by sector to a proving air quality, as well as in the prepara-
scale suitable for working on a contaminant tion of documents on air quality in Catalonia ial,
merc
dispersion model. Com nd
delivered to the European Commission by d o m e stic a r
secto
s trial
The emissions inventories in most of the sec- the Catalan government. in d u
tors were drawn up using EMEP/EEA GB2013. The model is based on current dispersion Emissions
trial
map Indus es
COPERT software was used alongside real models, including the following: sourc
vehicle emissions measurements for drawing n activ
ities
tractio
up the road traffic emissions inventory. • Advanced Gaussian concentration model- Other
servic
es: ex
ling.
To model the dispersion of the pollutants NOX, • Street canyon effect modelling based on Concentrations
map
NO2 and PM10 the ArcGIS software was used, the Danish OSPM model.
in addition to the ADMS-Urban modelling pro- • Chemical reaction modelling according to
gramme. ArcGIS is a GIS (geographic informa- the CBM IV mechanism.
tion software) tool that allows databases to
be linked with geographic information. The following figure provides an example
of the emission layers implemented using
ADMS-Urban programme is a pollutant dis- ADMS-Urban by means of GIS tools and the
persal model that can be used for urban Source: Barcelona Regional.
subsequent result presented in the form of a
and metropolitan environments, as well as concentrations map.
25Plan to improve air quality in Barcelona 2015-2018
Contaminant dispersion model
Current situation
The method used to calculate concentra- • It uses an hourly processing module of ous sources. It also considers the photo- A considerable quantity of regional data ne-
tions is based on the ADMS-Urban contam- flow and turbulence across the zone de- chemical reactions resulting from inci- eds to be known before the reality can be
inant dispersion model and offers the pos- rived from the relief. The module utilised dent solar radiation. simulated. On the one hand, there are the
sibility of modelling the chemical reactions is Flowstar, which incorporates a specific • It has a system of smart virtual receptors. intrinsic features of the region and, on the ot-
that occur between various chemical spe- OSPM for assessing the street canyon In addition to a regular grid of points dis- her, the composition and behaviour of the va-
cies present in the atmosphere, together effect produced by the network of roads tributed throughout the region, it allows rious emission sources scattered throughout
with the effect of solar radiation. between buildings, derived from the re- the automatic assignment of measuring the zone need to be known. Note that in the
circulation of air and turbulence caused points on roads and motorways to im- annual pollutant dispersion simulation, the
The model also uses algorithms to assess by traffic in that built-up area. prove the level of detail. hourly, daily and monthly emissions produ-
the wind speed at various altitudes, the tur- • It takes into account the reactions be- ced by the various sources have also been
bulences which are created using the vari- tween the various chemical present in The diagram in the following figure shows the introduced.
ous configurations of the land and the air the atmosphere and emissions from vari- method to follow for modelling air quality: To calibrate and validate the model, real data
currents generated in the streets. Moreo-
from the XVPCA measuring stations are com-
ver, it allows you to add hourly, weekly and pared hour by hour using the virtual mea-
monthly pollutant emissions timetables surements introduced into the model at the
from several sources, a variable that ena- Image 2: Method diagram for modeling air quality.
same geo-referenced locations. This analysis
bles the study of emissions trends over allows the modelling parameters to be ad-
time, as well as their impact on concentra- justed for obtaining concentration results as
tions. close to the reality as possible.
BASELINE DISPERSION VALIDATION AND RESULTS
INFORMATION MODEL CALIBRATION
This model is directly linked to a geographic Note that the reality is not a mathematical
information system (GIS) and an emissions model and that there are variables outsi-
STRUCTURAL
database that allows you to quantify and INPUT
•GAUSSIAN
MODEL VALIDATION MAP OF POLLUTANT de configurable behaviour patterns, which
DISPERSION MODEL CONCENTRATIONS
geographically locate the pollutant emis- AND CALIBRATION include situations such as traffic jams on
EMISSIONS •CHEMICAL FROM REAL AND AN ANALYSIS
sions sources even more accurately. REACTIONS CONCENTRATION OF POLLUTANTS atypical days, fires and demolition.
INVENTORY
DATA ACCORDING TO
BACKGROUND
•STREET CANYON THEIR SOURCES Pollutant dispersion model
The main features of the model are: MODELLING
CONTAMINATION Future scenarios
• It is specific for analysing pollutant con- REAL With the model calibrated and validated for
CONCENTRATION
centrations in urban and metropolitan DATA 2013, as explained in the 2013 Barcelona Lo-
environments with a resolution down to cal Pollution Evaluation document, air qua-
street-scale. lity was modelled for the year 2018, for both
Source: Barcelona Regional.
• It is based on an advanced Gaussian pol- trend and action scenarios, including measu-
lutant dispersion model. rements from the various plans and program-
• It incorporates a meteorological preproc- mes that have an effect on local pollution in
essor. Barcelona.
26You can also read