Real time large scale in vivo observations by light-sheet microscopy reveal intrinsic synchrony, plasticity and growth cone dy- namics of ...
←
→
Page content transcription
If your browser does not render page correctly, please read the page content below
Real time large scale in vivo observations by light-sheet micro-
                                            scopy reveal intrinsic synchrony, plasticity and growth cone dy-
                                            namics of midline crossing axons at the ventral floor plate of the
                                            zebrafish spinal cord
                                            Søren S. L. Andersen1,∗

                                            Abstract
                                            Axonal growth and guidance at the ventral floor plate is here followed in vivo in real time
                                            at high resolution by light-sheet microscopy along several hundred micrometers of the
                                            zebrafish spinal cord. The recordings show the strikingly stereotyped spatio-temporal
                                            control that governs midline crossing. Commissural axons are observed crossing the ven-
arXiv:2107.05242v1 [q-bio.NC] 12 Jul 2021

                                            tral floor plate midline perpendicularly at about 20 microns/h, in a manner dependent
                                            on the Robo3 receptor and with a growth rate minimum around the midline, confirming
                                            previous observations. At guidance points, commissural axons are seen to decrease their
                                            growth rate and growth cones increase in size. Commissural filopodia appear to interact
                                            with the nascent neural network, and thereby trigger immediate plastic and reversible
                                            sinusoidal-shaped bending movements of neighboring commissural shafts. Ipsilateral
                                            axons extend concurrently, but straight and without bends, at three to six times higher
                                            growth rates than commissurals, indicating they project their path on a substrate-bound
                                            surface rather than relying on diffusible guidance cues. Growing axons appeared to be
                                            under stretch, an observation that is of relevance for tension-based models of cortical
                                            morphogenesis. The in vivo observations provide for a discussion of the current dis-
                                            tinction between substrate-bound and diffusible guidance cues. The study applies the
                                            transparent zebrafish model that provides an experimental model system to explore fur-
                                            ther the cellular, molecular and physical mechanisms involved during axonal growth,
                                            guidance and midline crossing through a combination of in vivo and in vitro approaches.

                                            Key words: light-sheet, commissural, guidance, model axon, extracellular matrix, filopodia, dy-
                                            namics, live, real time, network, midline. Research Resource Identifiers: RRID: Danio rerio;
                                            RRID: SCR_013672; RRID: SCR_007370; RRID: SCR_000325; RRID: SCR_003070; RRID: SCR_002285;
                                            RRID: SCR_014237; RRID: SCR_005894.

                                            1 Theresearch herein was 2015-2016 carried out by S. Andersen at Uppsala University of Sweden
                                            (UU, https://www.UU.se/) at the Swedish Science for Life Laboratory (https://www.SciLifeLab.se/)
                                            BioVis Facility. S. Andersen is not an affiliate of UU or SciLifeLab.

                                            *Correspondence: andersen.ssla@gmail.com. ORCID: https://orcid.org/0000-0002-3625-1640.

                                                                                          1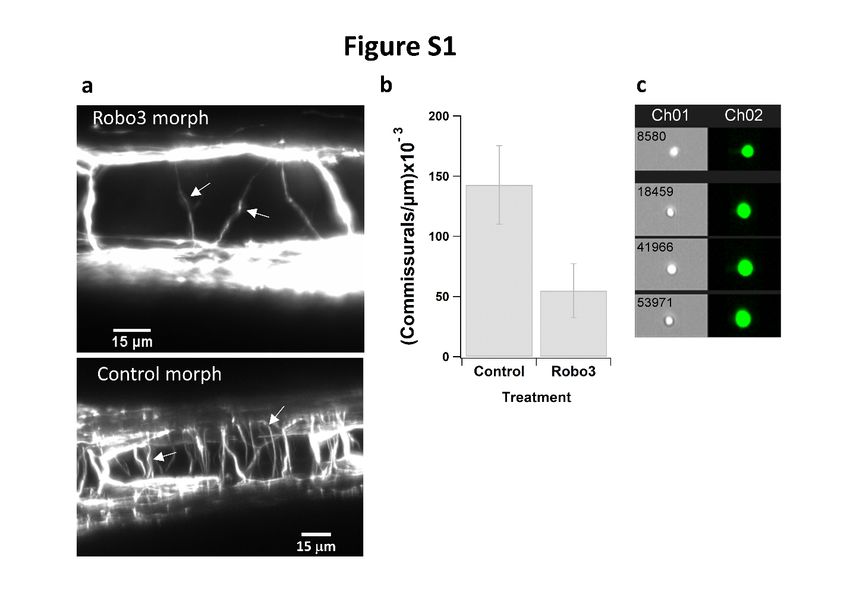
1. Introduction
How axons are wired up in an organism is an open and interesting question. In the
spinal cord, axons specified as ipsilateral are found on either side of the midline (ipsi-
lateral, contralateral), whereas the commissural axons cross the midline and connect the
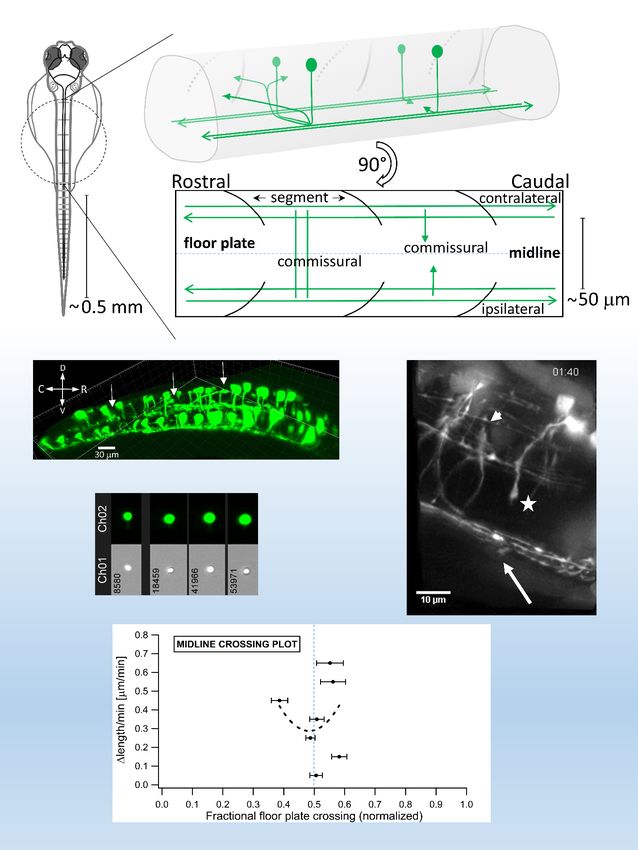
two body halves (de Ramon Francàs et al., 2017; Sakai and Kaprielian, 2012; Graphi-
cal Abstract in the accompanying Supporting Information). The midline separates the
right and left body halves and represents a crucial guidance point for the growing ax-
ons. Errors of midline guidance can have deleterious effects on further development of
the organism (Comer et al., 2019; Comer et al., 2015; de Ramon Francàs et al., 2017;
Tessier-Lavigne and Goodman, 1996). In light hereof, it is not surprising that many of
the known axonal guidance receptor-ligand pairs have been characterized in conjunction
with studies of axons crossing the midline; including the classical four sets of receptor-
ligand molecules: Robos-Slits, DCCs-Netrins, Plexins-Semaphorins and Ephs-Ephrins
(Chédotal, 2019; de Ramon Francàs et al., 2017; Kolodkin and Tessier-Lavigne, 2011;
Short et al., 2021; Stoeckli, 2018; Tessier-Lavigne and Goodman, 1996).
Technically, neuronal wiring at the cellular scale has until now mostly been studied
with various widefield, confocal and two photon microscopy techniques and often using
discretely fixed samples. Live high-resolution real time studies of axonal outgrowth in
vivo have particularly been done on individual axons during pathfinding in the visual
system. With its anatomically distinct and well localized axonal pathways, contained
in small narrow volumes, confocal and two photon microscopy studies are facilitated
(Akin and Zipursky, 2016; Bak and Fraser, 2003; Gaynes et al., 2015; Hutson and Chien,
2002; Mason and Wang, 1997; Nagel et al., 2015; Pittman et al., 2008; Sretavan and
Reichardt, 1993). In the spinal cord, individual sensory Rohon-Beard axonal growth
has been followed live in vivo by widefield and confocal microscopy in the zebrafish
(Andersen and Halloran, 2012; Lee et al., 2017; Liu and Halloran, 2005), and individual
motoneurons by confocal microscopy in the zebrafish and Xenopus (Bremer and Granato,
2016; Plazas et al., 2013) and widefield in Drosophila (Murray and Whitington, 1999). Ex
vivo cultures of chicken spinal cord (Dumoulin et al., 2021), a refinement of the open-
book preparation (Bovolenta and Dodd, 1990; Yaginuma et al., 1991), have provided
live data on axonal growth and guidance, but live in vivo studies of axonal growth and
guidance in the chicken model system remain unfeasible with current technology and
both genetic and molecular perturbation possibilities are also limited. Though there
are compelling reasons to study axon guidance with the Xenopus model (reviewed by
Erdogan et al., 2021; Erdogan et al., 2016), a live imaging study of Xenopus spinal cord
floor plate commissurals was based mostly on fixed samples (Moon and Gomez, 2005)
because the closely apposed notochord obscured live imaging, just as mouse commissural
axon studies also rely on fixed samples (e.g. studies by Brose et al., 1999; Comer et al.,
2015; Jaworski et al., 2015).
Direct real time live in vivo recordings showing how the many commissural spinal
cord axons simultaneously are crossing the midline are missing. Having such informa-
tion would potentially give new spatio-temporal insights about development as well as
the dynamics and mechanisms of axonal wiring on an organismal scale. This study was
initiated in an attempt to fill this gap by using the zebrafish model system (Andersen,
2003; Key and Devine, 2003).
The embryonic zebrafish spinal cord is long, curved and transparent, and grows rel-
atively rapidly in all three dimensions during early development. Therefore, to contain
physically and image simultaneously several segments of the spinal cord in real time, a
large live image acquisition volume is necessary. Recently, the light-sheet technique has
2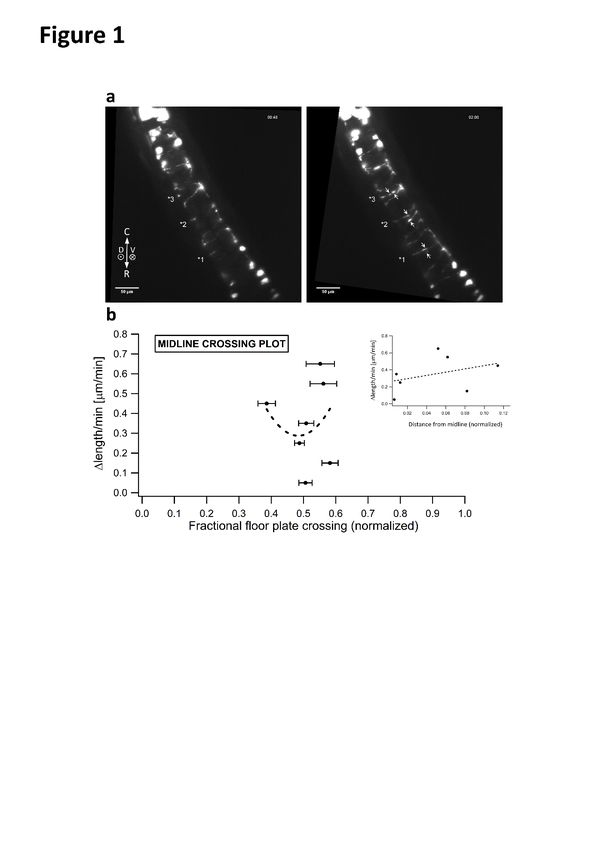
rendered such large scale image acquisition possible (Kaufmann et al., 2012; Keller and
Ahrens, 2015; Keller et al., 2008; Wan et al., 2019), and one recent real time in vivo study
has applied a light-sheet microscope, built by the researchers, to investigate angiogenesis
in in the zebrafish (Qin et al., 2021), a process that in many ways resembles axon guid-
ance (Fischer et al., 2019). While light-sheet microscopy so far mostly in zebrafish has
been used for technically advanced custom-built purposes (e.g.: Wan et al., 2019; Qin et
al., 2021; de Vito et al., 2021), with the advent of commercially available light-sheet mi-
croscopes and software for live imaging, it has now become doable, straightforward and
worth-while to apply this technique to the study of ordinary live in vivo cellular biolog-
ical processes as exemplified in this study. Moreover, data processing and storage is no
longer an issue due to available standard software as well as the continuously increasing
inexpensive computer storage and processing capacity.
     In this light-sheet study, in few seconds, at least hundred micrometers deep areas
of around 500 by 500 microns were routinely imaged every 0.2 micron in depth and
with a resolution in the range of a few hundred nanometers. Such large high-resolution
image volumes are not attainable with confocal or two photon techniques because of
the time involved to scan each layer (each z-stack plane) of large volumes. Moreover,
the prolonged acquisition times with these techniques, at larger sampling volumes, aug-
ment both phototoxicity and may render time lapse imaging prohibitive on a meaningful
time scale. Yet, for smaller volumes, confocal and two photon approaches have provided
many high-resolution real-time image studies of neuronal dynamics. These techniques
have also been used to demonstrate that similar resolution can be reached by light-sheet
microscopy (Akin and Zipursky, 2016; Kaufmann et al., 2012; Keller and Ahrens, 2015;
Keller et al., 2008; Portera-Cailliau et al., 2005; Weinger et al., 2015).
     In the zebrafish spinal cord, outgrowth of axons starts at about 16 hours post fertiliza-
tion (hpf). In the literature, extensive zebrafish spinal cord nomenclature, electrophysio-
logical studies, and static neuronal mapping of both unidentified, based on morphology
and growth patterns, and identified neurons exists (Bernhardt, 1994; Bernhardt et al.,
1990; Bernhardt et al., 1992; Drapeau et al., 2002; Hale et al., 2001; Higashijima et al.,
2004; Kuwada et al., 1990a; Kuwada et al., 1990b; Lewis and Eisen, 2003). Immedi-
ately preceding spinal cord axonal outgrowth, dynamic cell movements during neuru-
lation and neurocoel formation occur and was therefore occasionally also observed in
this study due to the developmental spatio-temporal intertwined proximity to commis-
sural outgrowth (Buckley et al., 2013; Cearns et al., 2016; Geldmacher-Voss et al., 2003;
Kimmel et al., 1994; Papan and Campos-Ortega, 1994).
     The model-axon imaged here to study midline crossing in vivo, are interneurons
expressing GFP from transcription factor promotor dmrt3, previously described in ze-
brafish as belonging to the dorsal interneuron 6 (dI6) progenitor domain (Satou et al.,
2013; Satou et al., 2020; Kishore et al., 2020). This particular type of interneuron has
also been studied in mice and horses, indicating a largely uncharacterized both ipsilat-
eral and commissural population (Griener et al., 2017; Staiger et al., 2017).
     Here, a striking spatio-temporal synchrony of commissural axons performing similar
simultaneous stereotyped guidance steps in different spinal cord segments is reported.
Observing this synchrony required real-time imaging on an organismal scale, and may
not be achieved looking at single growing axons by conventional microscopy techniques.
The live observations give renewed perspective on the mechanisms of axonal guidance in
the spinal cord that provide for a discussion of the current distinction between diffusible
long-range versus substrate-bound short-range guidance cues.

                                              3
2. Materials and methods

2.1 Reagents
Zebrafish (RRID: Danio rerio) were maintained at 28.5◦ C by the SciLifeLab Zebrafish Fa-
cility at UU according to approved institutional methods. Dr. Higashijima, Japan, kindly
in 2014 supplied UU with the transgenic Tg(dmrt3:GFP) zebrafish used in this study,
expressing GFP under control (GAL4-UAS) of the dmrt3 promotor (Satou et al., 2013;
Satou et al., 2020; Kishore et al., 2020 and S. Kishore, C. Satou, K. Ogino, H. Hirata,
S.-I. Higashijima, D. Mclean (2015) SfN 421.29/Q1). Embryos were staged according
to (Kimmel et al., 1995). Morpholino antisense oligos were translation blocking and
produced and designed by Gene Toolsr (Oregon). 0.25% trypsin-EDTA (#25200056),
defined trypsin inhibitor (#R007100) and foetal calf serum (#10270098) were from Ther-
mofischer Scientificr. Tricaine, Phenylthiourea (PTU) and low melt agarose were from
Sigmar.

2.2 Summary procedure for recording live from the embryos, larvae and zebrafish
For microscopy, the same batch of eggs was used for wild-type and microinjection stud-
ies. Eggs were kept at 28.5◦ C; occasionally at 30-32◦ C the first 12 hours to accelerate
development (Kimmel et al., 1995). With a stereomicroscope, signs of GFP expression
in the spinal cord were routinely monitored from about 12 hpf. About 14-16 hpf, GFP-
expressing embryos were mounted in 1% low-melt agarose dissolved in zebrafish sys-
tem water with 200 mg/l Tricaine (Kaufmann et al., 2012). The entire embryo, with
chorion, was mounted. This was done to give these early embryos the best survival con-
ditions; they are fragile to mechanical handling at this stage and embryos with strong
GFP expression in the spinal cord were scarce. The green labelled glass capillaries and
plugs for the Carl Zeissr light-sheet microscope were used. Up to four embryos were
mounted at one time, on top of each other, and inserted in the light-sheet microscope
chamber filled with regular zebrafish systems water and 200 mg/l Tricaine. Using phase
contrast, the GFP expressing embryos were then turned so the dorsal side of the spinal
cord faced the microscope objective directly; this was not always possible, because even
though the round sample is immobilized in the agarose, the embryo is freely floating
inside the chorion. Zebrafish already develops significant pigmentation on the dorsal
side by around 24 hpf. Hence, if the purpose was to watch stages past around 24 hpf,
0.1-0.2 mM PTU (Li et al., 2012) final was added to the growth medium about 12 hpf
to prevent pigment formation and thereby keeping the zebrafish transparent; 0.1-0.2
mM PTU final was also added to mounting solutions and the observation chamber fluid
during light-sheet microscopy. Embryos older than 24 hpf were dechorionated, if not
already hatched, and mounted in either 1-1.5% agarose or in an uncoated FEP (Fluori-
nated Ethylene Propylene) tube with regular zebrafish system water. FEP having about
the same refractive index as water (Weber et al., 2014). The FEP tube was briefly pre-
cleaned with 70% ethanol and water prior to use. The same piece of FEP tube was used
multiple times, minimizing material and cleansing needs. The zebrafish can grow and
extend in the FEP-tube and was used for imaging zebrafish up to 40 hours continuously;
placing the fish head upwards improved survival. Adjustment of significant drift caused
by the soft FEP tube was sometimes necessary; in comparison, little or no drift occurs for
agarose mounted samples.

                                            4
2.3 Microscopy
The SciLifeLab BioVis Zeiss Z.1 Light-Sheet microscope equipped with standard cham-
ber (30 ml) for use with a 20 x observation objective (NA=1) and 10x illumination objec-
tive was used (Zeiss). Image acquisition was every 8th minute, typically x,y 1920x1920
pixels, or about 500 μmx500 μm, zoom 0.8-1.4. GFP was visualized at 488 nm at approx-
imately 2-8% laser power, with pivot scanning, at 26-29◦ C. The early spinal cord is not
more than about 100x100 μm (widthxdepth) but the x,y,z image field was chosen big to
accommodate for drift, movement and growth during the long term recordings. Deep
z-stacks of the spinal cord, typically 200-700 slices with each slice having a thickness of
0.19 μm, were made to cover both above and below the region of interest (ROI) during
growth. To increase data amounts acquired per recording sessions, several larvae were
frequently mounted at the same time in the microscope; also because the curved form
of the larval spinal cord limits the field of observation and the larvae may change po-
sition significantly (due to growth inside the chorion) at this stage of development. For
such multi-embryo mounting, the Multiview menu in the microscope operating software
was used to fix the x,y,z imaging coordinates for each embryo for each loop of the time
lapse. Only one view was taken for each embryo. Multiview was, hence, not used in
attempt to improve the point spread function (PSF), and thereby resolution by imaging
the same volume of the specimen from several angles; Multiview applied this was did
not seem to improve resolution in this transparent zebrafish specimen; moreover, it gives
more files to process, becoming impracticable for long term acquisitions. Adjustment
of the light-sheet was best done manually, using a few days old zebrafish with fluores-
cent structures of the kind to observe; alternatively, the light-sheet adjustment wizard
was used. Frequently, a narrower light-sheet (manually adjustable in Advanced settings)
was used, than set by the software, as it gave sharper images of the submicron structures
observed in this study.
2.4 Micro injections
Needles with a tip opening of about 10-15 μm were freshly made by manually break-
ing with forceps (Dumontr, size 5) a drawn-out glass capillary with filament (1 mm
diameter, Harvard Apparatusr #BS430-0032). Ejection pressure calibrated to give a
roughly 1 nl drop at each ejection prompt. Embryos at the 1- to 2- cell stage were immo-
bilized by letting them adhere to the long edge of a standard microscope slide positioned
in a 15 cm petri dish and excess water sucked away (holding about 50 embryos). The
needle mounted on a micromanipulator and approached to the chorion, poked through
the chorion and, once inside the yolk, pressure ejection activated and the needle im-
mediately withdrawn. Morpholino stocks were at 1 mM in Milliporer water, about 8
ng/nl, and if diluted this was done just prior to the experiments. 5’-3’ sequences for the
two zRobo3, Robo3var1 AAAGTCCTGCGAAACTCCATCAGCC, Robo3var2 CGTCTT-
TATCAGGTAACGCAGCATC, based on the Genebank sequence data AF337036 and
AF304131, respectively (Challa et al., 2005); the Gene Tools standard control morpholino
was used as control.
2.5 Single cell analysis
From 2 dpf GFP expressing zebrafish, the yolk bag was removed manually with forceps
(Dumont 5). The zebrafish head was cut off with forceps at the junction between the
spinal cord and the hind brain. The remaining full length spinal cord cut in half, giv-
ing rise to two pieces of about equal length. The top (rostral) part was with a pipette
transferred to a drop of 0.25% trypsin-EDTA solution and with forceps teared briefly
5somewhat apart; then transferred to a 1.5 ml Eppendorf tube filled with 0.25% trypsin-
EDTA, which had been preheated in a heating block at 31◦ C with water-filled sample
holders. 2 to 3 spinal cord pieces/tube were used. Digestion was for about 30 minutes
and the tubes were manually shaken gently every second minute or so, both to monitor
the digestion and to improve the exposure of the spinal cord to the digestion mix. To stop
the reaction, one volume defined trypsin inhibitor with 4 % final Fetal Calf Serum added
was added at room temperature; each digestion mix tube hence doubled in volume to 3
ml (2% final FCS); if several digestions were carried out, they were pooled at this stage.
The pooled mix was then promptly poured over first a 40 and then a 20 μm filter to re-
move large debris. The mix then transferred to 1.5 ml tubes and centrifuged at 380 g, 5
min at 10-20◦ C. The supernatant removed, and the pellets one by one resuspended in the
same 100 μl PBS at room temperature and analyzed by FlowSightr (amnisr) at medium
to high flow rate.
2.6 Data analysis and calculations
Light-sheet files were typically 0.1-1 terabytes (tb) and were manually trimmed using
the Subset function in the used Zeiss Zen (black edition) software (RRID: SCR_013672);
if possible, cutting away parts of the x coordinate and the z-coordinate, when contain-
ing no information. The z-coordinate was further trimmed so only slices containing the
commissural axons (without the cell bodies) were left, as the strong emission from the
cell bodies disturbed subsequent processing. For commissural midline studies, a max-
imum intensity projection (MIP) was then performed, a step that reduces the file size
significantly; given that the floor plate is flat and the specimen is transparent there was
virtually no visual difference between the MIP projected and the fully trimmed z-stack
image file. The obtained MIP file was then used for manual measurement of axonal
growth; however, if a specific structure is studied, even higher image quality may be ob-
tained by selecting, at each time point, the best slice of the ROI (exemplified in Figure
4); if necessary, analysis of the full z-stack slice by slice was used similarly to ascertain
that the same axon was followed over time. For three dimensional (3D) display and ren-
dering, files were trimmed further in Imarisr (RRID: SCR_007370; Bitplaner), which
was also used to render the live recordings as rotatable 3D live recordings when nec-
essary to ascertain that the same axon was followed over time (e.g. Movie 2 and 3).
Igor Pro (RRID: SCR_000325; WaveMetricsr) and Excel (Microsoftr) were used to an-
alyze and plot the neuronal growth data. Movies were made with ImageJ or Fiji (RRID:
SCR_003070, RRID: SCR_002285) open-source software (directly on the Zeiss light-sheet
czi-format image files, or after first having exported each time point as a full resolution
16 bit Tif file) or Imaris (czi files of the z-stack converted to ims files); motion correction
with Stack Reg (ImageJ or Fiji) or drift correction (Imaris). Deconvolution was done on
the raw z-stack using the Huygens Software (RRID: SCR_014237) of Scientific Volume
Imagingr with their light-sheet (SPIM) software module and auto-wizard generated set-
tings. Stitching of the spinal cord was made using Arivisr or the open-source XuvStitch
(RRID: SCR_005894; www.xuvtools.org), giving comparable results; each portion of the
spinal cord consisted of about 600 images in a z-stack (both Arivis and XuvStich re-
quire the stacks to be stitched to have the same number of z-slices). The stitched image
was subsequently reconstructed and analyzed in Imaris using clipping plane and sur-
face reconstruction tools. The FlowSight data were analyzed with the IDEASr software
(amnis). In the morpholino microinjection experiments, the number of midline crossing
commissurals was counted manually and the number of midline crossing commissur-
als/μm length spinal cord used in the statistical test. The angle of growth cone wander-
6ing was measured frame by frame using the Graphics options in the Zeiss Zen (black
edition) freeware. Statistical tests were two-tailed t-test for two independent popula-
tion means. Error bars are standard deviations (sdev) except in the midline crossing plot
where standard errors of the mean (sem) are displayed.
For the midline crossing plot (Figure 1b), each axon’s length was measured at each
time point (as previously described for microtubules (Andersen et al., 1994)) and the
instantaneous growth rate (y) calculated by comparison with the axon’s length at the
immediate previous time point, i.e. Δlength/Δtime=(t2 length - t1 length)/(t2-t1) mea-
sured in μm/min, and the physical position (x) of the growth cone on the floor plate at
that time point noted. The purpose of using the instantaneous growth rate is to look for
variations in the commissural growth rate at as high as possible temporal resolution and
then correlate that information with the physical position of the growth cone on the floor
plate at that time. The time resolution on the instantaneous growth rate is 60/8 or 7.5
measurement points/hour, given that an image frame was taken every 8th minutes (i.e.
Δtime=t2-t1=8 min). For each calculated instantaneous growth rate (Δlength/8min),
the physical position of the growth cone was expressed by the fraction of the floor plate
crossed at the given time. A number between 0 and 1, and the exact midline has then
the value of 1/2. The fraction arises by measuring how far the commissural growth cone
has grown at the given time point and dividing it by the total distance to cross the floor
plate. Hence, a normalization of the total distance grown compared to the total distance
to grow, and calculated independently for each neuron. Thus, the N=11 axons (those
shown in Figure 1a, Movie 1) were analyzed at each 8th minute time point, giving rise to
a total of ntot =101 measurements of instantaneous growth rate (Δlength/8min), and for
each of these 101 time points there was then a corresponding fraction of the floor plate
crossed, giving ntot =101 (x,y)= (fractional crossing, Δlength/8min) coordinate sets. Re-
gardless of from which axons the growth rates were derived, the 101 (x,y) coordinate sets
were sorted according to their growth rate (y) into growth rate bins with a width of 0.1
μm/min (thus with the bins representing growth rate intervals of 0-0.1, 0.1-0.2, 0.2.-0.3,
0.3-0.4, 0.4-0.5, 0.5-0.6, 0.6-0.7, 0.7-0.8, 0.8-0.9 μm/min). The 101 Δlength/8min growth
rate measurements were distributed into the following bins: 0.05(n=22), 0.15(n=14),
0.25(n=22), 0.35(n=16), 0.45(n=10), 0.55(n=9), 0.65(n=6), 0.75(n=1), 0.85(n=1) μm/min
(the two bins ‘0.75’ and ‘0.85’ were not used subsequently as these instantaneous growth
rates were only observed n=1 times). For example, if at a particular time a commissural
could be observed growing at an instantaneous growth rate (y) of Δlength/8min=0.33
μm/min at a normalized fractional midline crossing position (x) of 0.47, this coordinate
set would be placed into the y=‘0.35 μm/min’-bin, used for all coordinate sets having
growth rates in the interval between 0.3-0.4 μm/min, and since the bin’s midpoint-value
((0.3+0.4)/2=0.35) is used for averaging of the bins growth rate-interval value for the
subsequent graphical display (Figure 1b); here, n=16 of the total 101 growth rate points
were observed to be in this 0.3-0.4 interval. Another example could be a growth rate
of y=0.62 m/μmin at a crossing of x=0.58 which would then be placed in the y=’0.65
μm/min’-bin that represents all growth rates observed to be in the interval from 0.6-
0.7 μm/min; here, n=6 of the total 101 growth rate points were observed to be in this
0.6-0.7 interval. Regardless of which of the N=11 axons the growth rates were derived
from, all the 101 (x,y) measurements were this way distributed into their corresponding
growth rate bin. Hence, all points in each growth rate bin had an associated normal-
ized fractional midline crossing point (given mentioned 101 (x,y)=(fractional crossing,
Δlength/8min) coordinate sets).
Then, in principle, it were possible that growth rates in a given growth rate bin could
7stem from any fractional midline crossing point, i.e. from any position (x) during the
crossing of the floor plate. To test this, for each growth rate bin the average normal-
ized fractional crossing value with sem was then calculated and plotted against the bin
Δlength/min growth rate value (y) (see Figure 1b); it is seen from the plot that slow
growth rates cluster close to the midline, which has the normalized fractional floor plate
crossing value (x) of 1/2 (illustrated in the Graphical Abstract in Supporting Informa-
tion, stippled blue line). Hence, growth rates on the floor plate do not vary randomly
but tend to be lower near the midline. A quadratic curve fit of the plotted data rendered
a fitting polynomial (y = 3.57 – 13.59x + 14.05x2 ), used to draw the stippled curve in
Figure 1b. Extrema of a defined function can be found by differentiation. Thus, by dif-
ferentiating the fitting polynomial, it is seen that there is an average minimum in the
growth rate Δlength/min (y) at the normalized fractional floor plate crossing point of x
= 0.484, where the midline is at the exact midpoint with a value of 1/2.
In the plot inserted in Figure 1b, the location of the midline is now at 0.0. This has
been obtained by subtracting 0.5 from the x-values values. Plotted is then the growth
rate value (y) versus the absolute x-value, such that this graphical representation does
not distinguish whether the growth cone still has a distance left to reach the midline
(negative x) or has already crossed the midline and is at a distance away from the midline
(positive x).
83. RESULTS
3.1 Dynamics of commissural axons crossing the ventral floor plate in real time
To obtain live real time in vivo recordings of axons crossing the midline in the zebrafish
spinal cord by light-sheet microscopy, a transgenic Tg(dmrt3:GFP) zebrafish that express
GFP under control of the dmrt3 promotor was used in this study (Satou et al., 2013).
The first observable GFP signal was 10 hours post fertilization (hpf) in the nostral region
of the forebrain (Satou et al., 2013), and 13-16 hpf was the earliest time points where a
strong GFP signal in the spinal cord could be observed with a regular stereomicroscope
and which is just prior to the outgrowth of pioneer axons in the spinal cord (Geldmacher-
Voss et al., 2003; Kimmel et al., 1994; Papan and Campos-Ortega, 1994; data not shown).
The strong GFP expression made it likely that it would be possible to follow early com-
missural axonal wiring in the spinal cord that begins around 16 hpf (Bernhardt et al.,
1990; Drapeau et al., 2002; Kimmel et al., 1994; Kuwada et al., 1990a).
When embryos aged 16-28 hpf were imaged, commissural axons could be observed to
cross the floor plate at a growth rate of about 18.1 + 6.4 μm/h (N=12 axons in 4 different
zebrafish, representing 20.8 h of total axonal growth). It was therefore endeavored to
observe the first commissural axons that start crossing the floor plate around 16 hpf.
Looking at the ventral midline of the rostral half of the spinal cord, in one embryo and
starting about 18 hpf, commissural axons could be observed to utilize around 2 to 4
hours to cross the 55 + 6 μm wide ventral floor-plate and reach the contralateral side; the
average growth rate during this journey was 0.35 + 0.14 μm/min or about 21 + 8.4 μm/h
(N=11 axons in 1 zebrafish, representing 18.5 h of total axonal growth; Movie 1, Figure
1; Supporting Information Movie S1).
9Figure_1 Legend. Real-time observations showing commissural axons crossing the midline in
temporal and spatial synchrony (see accompanying Movie 1, 2 and 3). a) Left, commissural axons
at three different points (each (1-3) marked by an asterisk (*), t = 48 min) start crossing simul-
taneously at 18 hpf from either side of the floor plate (Movie 1); right, the commissurals have
reached the midline (growth cones of the three commissural pairs are marked by six arrows, t
= 2 hr); the compass shows spatial directions and Rostral (R) is towards the bottom, Caudal (C)
top, Dorsal (D) is above ( ) and Ventral (V) below ( ) the field of view, bar 50 μm. (Movie 1). b)
Midline crossing plot (derived in section 2.6), quantifying that the midline crossing commissural
axons (shown in (a), Movie 1) tend to grow slower in the area close to the midline (N=11 axons
in 1 zebrafish, errors are sem); this is illustrated by the stippled quadratic trendline, indicated as
a guide for the eye, suggesting a minimum growth rate very close to the exact floor plate midline
(located in the plot at the fractional floor plate crossing point of 0.5). Insert: the same data, here
plotted as the growth cone speed against the absolute fractional distance to the midline - thus,
the midline is here located at x = 0; the stippled linear trendline is indicated as a guide for the
eye, and this representation also illustrates that the commissural axons tend to grow slower in
the vicinity of the midline. (Movie 1).
Moreover, along the length of the spinal cord, a striking synchrony of commissural
axonal pairs crossing the midline with bilateral symmetry in adjacent segments was ob-
served. Hence, on either side of the midline, three pairs of commissurals are seen cross-
ing in temporal synchrony at a rostral-caudal interval of approximately 100 μm (labelled
with asterisks in Movie 1, Figure 1a, starting at t = 48 min). At this early developmental
stage, 100 μm is approximately the length of a segment in the rostral spinal cord. To ad-
10dress whether the growth rate of these early commissurals vary during the passage of the
floor plate, the growth rate data were analyzed graphically in the Midline crossing plot
that reveals an experimental average minimum in the growth rate at a fractional-crossing
close to the exact midline crossing point of 1/2 (Figure 1b, derived in section 2.6; Movie
1). In the vicinity of the midline choice point, growth cones appear to become bigger in
cross sectional area as compared to before the midline. The decreased growth rate and
increase in size are seen to be reversible (Figure 1b, Movie 1).
Movie_1 Legend. (See Supporting Information). Commissural axons crossing the floor plate
(about 18 hpf). Viewing the movies by scrolling back and forth frame by frame is most informa-
tive (possible e.g. with Windows’ ‘Movies & TV’ application). The spinal cord in a maximum
intensity projection, viewed from the dorsal side (from straight above). Three marks indicate
pairs of commissural axons that are crossing simultaneously (*1, *2, *3; starting at t=48 min)
from either side and at the same time (notice the slight rostral-caudal temporal shift in axonal
advancement, reflecting the rostral-to-caudal gradient in developmental progression). Rostral is
towards the bottom in the Movie (Figure 1). In *2, a clearly visible enlargement and slowing down
of the growth cones near the midline are seen. Caudally, notice an axon is taking a sharp turn
caudally after crossing (clearly visible at t=6h08min-7h04min). The small arrows appearing in
different locations in Movie 1 (e.g. at t=3h20min-3h52min, middle) are explained in the legend
to Figure 4d’. This particular movie was used for the quantification in the Midline crossing plot
(Figure 1b). The apparent rotation of the image field is due to sample drift during acquisition
that is corrected prior to the display and causing the rotation. Length 7 hours 4 minutes in real
time (see also Movie 2 and 3), bar is 50 μm.
After crossing the floor plate, some commissural axons could be followed further
(Movie 2 and 3; Figure 2). At the contralateral site, these axons could be observed as-
cending with spatio-temporal synchrony at an oblique asymptotic angle in three adja-
cent segments of the spinal cord, most likely toward the dorsal longitudinal fasciculus
(DLF) (Movie 2; Figure 2a1-a3, three arrows). These same three commissurals may be
distinguished during growth on the floor plate itself (Movie 3; Figure 2b, three arrow-
heads). The noticeable rostral-caudal temporal shift in the synchrony is consistent with
the rostral-to-caudal gradient of developmental progression (Movie 2, Figure 2; a slight
rostral-caudal temporal shift is also noticeable for the commissurals in Movie 1).
11Movie_2 Legend. (See Supporting Information). Axons growing in spatio-temporal synchrony
at an obliquely ascending angle after crossing the floor plate (about 28 hpf). Same sequence as
Movie 3. After having crossed the floor plate, three commissural axons in three different segments
are growing in spatio-temporal synchrony at an obliquely ascending asymptotic angle most likely
to join the DLF (Figure 2a; rostral is right). The cell bodies are clearly visible at the dorsal side,
rostrally. Notice the slight rostral-caudal temporal shift in axonal advancement, reflecting the
rostral-caudal gradient in developmental progression. Length 4 hours 48 minutes in real time,
bar is 30 μm.
Movie_3 Legend. (See Supporting Information). Commissural axons crossing the floor plate
(about 28 hpf). This recording is the same as shown in Movie 2, where the view is tilted onto
its side, here seen looking down from straight above the dorsal side (rostral is right). In this
perspective, apart from many commissurals having already crossed or still crossing the floor
plate, the three axons ascending in Movie 2 at an oblique asymptotic angle once the floor plate
crossed (Figure 2a, arrows 1-3), can here be observed crossing the floor plate from right to left
(Figure 2b, arrowheads 1-3; correspondence was ascertained by rotatable 3D live rendering).
Length 4 hours 48 minutes in real time, bar is 30 μm.
12Figure_2 Legend. After crossing the floor plate, obliquely ascending axonal growth contralater-
ally (28 hpf; see accompanying Movie 2 and 3). a1-a3) Having crossed the floor plate, three com-
missurals (indicated by arrows 1-3) are seen ascending at an oblique asymptotic angle in three
different segments and with both spatial and temporal synchrony, most likely to join the dorsal
longitudinal fasciculus (DLF), compass shows rostral (R) is to the right, time in hours:min in right
corner, bar 30 μm, (Movie 2). b) Same recording as in a1-a3 (dorsal (D) is above ( ) the field of
view), where these 3 axons (arrows 1-3) are seen having crossed the floor plate (their shafts are
indicated by the tip of arrowheads 1-3, all pointing to the right; correspondence was ascertained
by rotatable 3D live rendering), compass shows directions, bar 30 μm, (Movie 3). (Movie 2 and
3).
In the presented movies, the dorsal GFP-expressing cell bodies have been removed
from the display because their intense GFP staining interferes with observations of the
growing axons on the ventral floor plate. To illustrate this, Movie S2 (Supporting In-
formation, Movie S2) shows an example with cell bodies. The axon starts growing out
from the dorsally located cell body down in the ventral direction toward the ventral floor
plate. Then crosses the ventral floor plate and on the contralateral side turns to join most
likely the DLF (Movie S2).
Interestingly, almost no guidance errors were observed in the recordings in this study
13from more than 10 different zebrafish, representing more than 100 axons. An error is
here defined as a growth cone straying at least 10 μm off, measured orthogonally, the
normal pathway (Hutson and Chien, 2002). Hence, in the recordings in this study it was
never observed that a commissural axon would commence an ipsilateral path, for then to
correct it as an error, and continue with a midline crossing growth path across the ventral
floor plate. In converse, but only on one occasion and that in the future hindbrain, an ip-
silateral axon was observed growing towards the floor plate midline as if a commissural
(Movie S3a and S3b), for then to correct its path by rapidly shrinking back upon reach-
ing the midline and continue the correct caudally directed ipsilateral path, most likely
towards the medial longitudinal fasciculus (MLF; Bernhardt et al., 1990; Drapeau et al.,
2002; Kimmel et al., 1994; Kuwada et al., 1990a). These observations suggest that axonal
guidance errors of this magnitude (Hutson and Chien, 2002) are extremely rare events
during the observed stereotyped spinal cord wiring in vivo, that is, spinal cord wiring
seems error-free.
3.2 Growth cone wandering and bilateral filopodia and neurite shaft interactions
The light-sheet technique enables high resolution acquisition along many hundred mi-
crons long regions that may then be viewed at variable zoom rates to display different
information, such as the spatio-temporal synchrony at moderate zoom shown in Movie
1, 2 and 3. At higher zoom (Movie 4, 5 and 6; unlabeled Movie S4, S5 and S6, Movie
S7; Figure 3 and 4), transiently slowing down and increasing the growth cone size was
observed to be a generic guidance response of the commissurals. Not just as observed at
the midline guidance point of the ventral floor plate (Movie 1, Figure 1b) but also at the
contralateral guidance point (Movie 4 labels N1 (midline) and N2 (contralateral); Figure
3).
14Figure_3 Legend. Filopodia dynamics and growth paths of three midline commisurals and one
ipsilateral axon (see accompanying Movie 4). Here, the already high-resolution raw light-sheet
image recordings have been deconvolved, improving the resolution from about 800 to 600 nm,
estimated by a full-width half maximum (FWHM) measurement of the Gaussian signal, as well
as the signal-to-noise ratio. a-d) N1, cross from the contralateral side toward the viewer, then
turns right (caudally); N2, cross the floor plate, then bifurcates on the contralateral side (at N2
in d it has already bifurcated); N3, this axon wraps around the ipsilateral axonal bundle (on the
ipsilateral side) on the outside, for then to make a sharp turn onto the floor plate and cross to the
contralateral side; *, marks the growth cone of an ipsilateral axon that in Movie 4, at t=4h19min,
can be seen extending fast rostral to caudal at the level of the contralateral ventral floor plate.
Time in hours:min in right corner, compass shows directions, bar 10 μm. (Movie 4).
15Movie_4 Legend. (See Supporting Information). High resolution deconvolved sequence shows
filopodia dynamics and growth paths of three commissural and one ipsilateral axons (Figure 3).
Viewing the movies by scrolling back and forth frame by frame is most informative (possible e.g.
with Windows’ ‘Movies & TV’ application). N1, grows down from the dorsally located cell body
towards the floor plate, cross then from the contralateral side towards the viewer, slows down
noticeably at the midline, then turns right (caudally) while extending multiple filopodia; N2,
cross the floor plate and then bifurcates on the contralateral side (commencing at t=2h28min);
N3, this axon wraps around the ipsilateral axonal bundle (on the ipsilateral side) for then to make
a sharp turn onto the floor plate and cross to the contralateral side, where it stalls as its growth
cone enlarges and searches, and which likely is causing the shaft bends seen close to the growth
cone at t=7h21min-8h00min; *, on the contralateral side, an ipsilateral axon extending fast rostral
to caudal at the level of the ventral floor plate (in this Movie, other ipsilateral axons may also be
seen extending). Movie S4 is an unlabeled version of this movie. Length 8 hours in real time, bar
is 10 μm.
When axons are growing, the path of their growth cones often deviate slightly from
that of a straight line which was also observed clearly in this study at the higher zoom.
To quantify this wandering, or searching, the absolute angle made, at each time point,
between a commissural growth cone and the straight line connecting the growth cone’s
starting to its ending position (the straight path) was measured. This gave a wander-
ing variation of (7.23◦ + 6.17◦ )/8 min that appeared random (n=268 time points of 8
minutes, measured on N=18 axons in 4 different zebrafish, representing 34 h of com-
missural growth). The investigator induced error on this angle measurement was esti-
mated empirically to around 1.22+0.75◦ (n=14). Because all labelling is monochromatic
green (GFP) in this study, the ipsilateral population of axons was not evident to follow at
low magnification. At the higher zoom, they could be observed to grow at around 69.6
+ 20.7 μm/h (N=13 axons in 6 different zebrafish, representing 28.3 h of total axonal
growth) and some were even observed to grow as fast as 120 μm/h (Movie S8). Hence,
ipsilateral axons appear to extend about three to six times faster than the commissural
axons (Movie 4, 5, S8; Figure 3 and 4). The ipsilateral axonal growth cones, in com-
parison with the commissurals, grow straight with little wandering of (3.71◦ + 3.83◦ )/8
min (n=136 points, measured on N=8 axons in 4 zebrafish, representing 21.4 h of total
axonal growth), also considering their three to six times higher growth rates. The few
abrupt changes observed in the ipsilateral growth cone direction seemed not random but
caused by encountered obstacles (e.g. shafts of axons growing from the dorsal cell body
towards the ventral floor plate). The wandering behavior is an intrinsic property of ad-
vancing growth cones (due to the ongoing molecular dynamic events inside the growth
cone (Andersen and Bi, 2000)) and a read-out of the growth cone angle is obtainable at
16each time point. Thus, even if the image acquisition frequency was increased, giving
higher time resolution, these growth cone wandering angle estimates would likely not
change.
Interestingly, the commissural shafts could often be observed making localized
sinusoidal-shaped bending movements on the floor plate, both during and after crossing
(Movie 5 and 6, Figure 4). They appear from the recordings to be mostly caused by the
stochastic transient actions of filopodia emanating from neighboring growth cones that
are visible at higher zoom and having lengths of up to more than 10 μm and which are
very responsive to the environment; the filopodia seems to collide transiently with shafts
in the vicinity, and appear thereby to cause a local and reversible displacement of the
shaft in the direction of the growth cone of the colliding filopodia, and appear thereby
to cause the observed transient shaft bends (Movie 5 and 6, Figure 4), as also proposed
by Moon and Gomez (2005). These transient bends are not, unlike growth cone wander-
ing, caused by intrinsic properties of the axons. Therefore, quantifying the occurrence of
shaft bends is strongly dependent on the image acquisition frequency. A higher image
acquisition rate will increase the probability of observing the bends. At the used acqui-
sition rate, an estimate of (0.13+0.14)/8 min axonal shaft bends was obtained (n = 235
time points, N=16 axons in 3 different zebrafish). Representing about 1+1 commissural
axonal shaft bends per hour per commissural axon. Looking at the complementary sce-
nario of a filopodia from an observed growth cone making contact with and apparently
causing the bend of a neighboring commissural shaft, an occurrence of (0.044+0.081)/8
min contact-bending events were measured (Movie 5 and 6, labels 2, 3 and f; Figure
4d,d’); or approximately 1 contact-bending event every 3 hours + 1.7 hours. This is a
three times lower frequency than aforementioned axonal shaft-bending frequency. That
is to be expected because the GFP-labelled neurons are a minor fraction of all growing
commissural and ipsilateral axons. Hence, only GFP-labelled filopodia are visible in this
study whereas all growth cone filopodia may potentially cause bending of neighboring
shafts.
While the ipsilateral growth cones also had long filopodia, they appeared more col-
lected than their commissural counterparts. From the obtained recordings, the ipsilateral
shafts did not seem to display noticeable sinusoidal-shaped bending movements (Movie
2, 3, 4, 5, 6 and S8).
17Figure_4 Legend. Commissural axonal shafts and filopodia display bidirectional dynamics dur-
ing floor plate crossing (see accompanying Movie 5 and 6). a-b) 1, an ipsilateral axon is here fol-
lowed for 40 min showing no shaft bends; c-e) four examples of commissural sinusoidal-shaped
shaft bends (labels 2-5; 4 occurs on the same shaft as 2 and is only marked in the accompanying
Movie 5, starting at t=5h44min; Movie 5); d’) This is the same area and recording as image d),
showing how the filopodia (f ) from the growth cone of 2 collides with a neighboring shaft 3 and
appears to cause it to bend. Right corner: time in hours:min, compass shows directions, bar 15
μm. The difference in resolution between d) and d’) is caused by different image handling. Hence,
18image (d) is a MIP of stacks (just as Movie 5) whereas (d’) (Movie 6) only shows the one single
slice-plane (0.2 μm thick) of the stack where the object to observe (label 3) was clearest. As can be
seen, the latter display option, while having better resolution by removing unwanted signal, has
the drawback that the usable field of view is significantly decreased. The small arrows inserted
in Movie 1 (e.g. at t=3h20min-3h52min, middle) are pointing at other examples of occurrences
of sinusoidal-shaped shaft bends; they look smaller in magnitude than in Movie 5 and 6 because
the zoom magnification is smaller in Movie 1. In actual size, the small arrows inserted in Movie
1 are twice as big as the arrows used in Movie 5 and 6. (Movie 5 and 6).
Movie_5 Legend. (See Supporting Information). Commissural axonal shafts bend and wobble on
the floor plate (Figure 4). 1, an ipsilateral axon extending straight and fast (other ipsilaterals can
be observed in this movie); 2-5, examples of commissural axonal sinusoidal-shaped shaft bends
on the floor plate; Movie 6 is more focused on commissural 3 only, and where a sinusoidal-shaft
bend can clearly be observed and apparently caused by the collision of a filopodia emanating
from the growth cone of the neighboring axon 2. Movie S5 is an unlabeled version of this movie.
Length 8 hours 16 minutes in real time, bar is 15 μm.
Movie_6 Legend. (See Supporting Information). Commissural neurite shafts respond with
sinusoidal-shaped bends upon contact by filopodia tips (Figure 4). Focused view of axon 2 and 3
in Movie 5. From t=1h20min to 1h44min, a filopodia of commissural 2 appears to collide with the
shaft of commissural 3, the shaft of 3 appears then to be pulled in the direction of axon 2’s growth
cone and this lateral displacement in turn appears to cause 3 to make a reversible sinusoidal-
shaped bend (Figure 4 d, d’ at t=1h28min) that is resolved shortly thereafter (no longer observed
at t=1h44min). Movie S6 is an unlabeled version of this movie. Length 2 hours 48 minutes in real
time, bar is 15 μm.
193.3 Probing factors regulating commissural midline crossing and single cell analysis Obtaining in vivo recordings by light-sheet microscopy of commissural axons crossing the spinal cord midline at the floor plate was the primary rationale for this study. However, the accompanying important questions of molecules regulating guidance were consid- ered, also to probe technically, whether it would be feasible to use molecularly perturbed zebrafish for the in vivo light-sheet experiments. Robo3 receptors were knocked down by conventional translation blocking morpholino-antisense techniques. Morpholinos were chosen because they have already been applied to knock down Robo3 in zebrafish. Phe- notypes for both Robo3 mutant zebrafish and translation blocking morpholino treated zebrafish have been reported (Burgess et al., 2009; Challa et al., 2005). In the Robo3 morpholino treated spinal cords, the number of commissurals per micrometer spinal cord that were observed to cross the floor plate was significantly reduced compared with the control (Figure S1b, p
4. Discussion
Finally seeing both in vivo and in real time the simultaneous commissural midline cross-
ing events over extended lengths of the spinal cord is illuminating. In particular no-
ticeable is the stereotyped spatio-temporal commissural growth synchrony (Movie 1, 2
and 3). The movies show the type of live organismal scale data that can be obtained by
applying light-sheet microscopy and the zebrafish model system to the study of cellular
developmental neurobiology.

4.1 Crossing the midline and wiring the spinal cord
     A minimum in commissural growth rate was observed very close to the midline (Fig-
ure 1b; Graphical Abstract in Supporting Information (stippled blue line); Movie 1, 2 and
3). A decrease in growth rate is expected at a choice point (Andersen, 2005; Bonner et
al., 2012; Goodhill, 2016; Michalski et al., 2013; Rosoff et al., 2004). At the midline, both
a decrease in growth rate and an increase in growth cone size have been reported pre-
viously (Bak and Fraser, 2003; Mason and Wang, 1997; Moon and Gomez, 2005; Myers
and Bastiani, 1993b). Confirming previous reports, Robo3 is shown here to be a positive
guidance factor for commissural axons; ipsilateral axons, as expected, appear guided in-
dependently of Robo3 (Figure S1b, Movie S9). How ipsilateral axons are guided remains
an open question that is considerably less studied than commissural guidance. A plausi-
ble role for diffusible ipsilateral cues derives from recent data (Kastenhuber et al., 2009;
Kim et al., 2014; Paixão et al., 2013; Sakai and Kaprielian, 2012; Schweitzer et al., 2013).
     Earlier static wiring studies classified the commissurals based on morphology. Thus,
the CoPA (Commissural Primary Ascending) are here the commissural axons observed
crossing perpendicular to the midline (Movie 1 and 2), and continuing an ascending
growth at an oblique angle toward the DLF on the contralateral side (Movie 2). The
CoSA (Commissural Secondary Ascending) are seen crossing the floor plate later (Movie
2 and Move 3). In Movie 4, axon N2 bifurcates upon reaching the contralateral side,
identifying it as a commissural bifurcating longitudinal (CoBL (Hale et al., 2001); Figure
3a-d). A minor population crossing the midline obliquely at 1-1.5 dpf, and slightly more
dorsally, may likely be identified as Commissural Local (CoLo) interneurons (data not
shown; Satou et al., 2009; Shah et al., 2015).
     An elucidation of the full wiring paths and origins (e.g. some axons may originate
from the developing brain (Movie S3a and S3b) and not the spinal cord), synaptic part-
ners and functions of the axons studied here require more experiments. A combined in
vitro and in vivo approach will be required to characterize both the molecular and cel-
lular properties of the different neurons observed in the spinal cord (Andersen, 2001).
A significant step forward in that characterization will be the establishment of specific
molecular neuronal markers. This may be accomplished by applying single cell analysis
(Zeisel et al., 2015) of the FP-labelled neurons as illustrated and initiated here by the
single cell FlowSightr experiments (Figure S1c). A number of FP-spinal cord neuronal
transgenic zebrafish lines have been described already (Satou et al., 2013), and the single
cell approach may be applied to all spinal cord neurons to gain further knowledge about
their specific localization, properties and functions. In comparison, for example, a fixed
number of three primary motoneurons per hemisegment have been described (CaP, MiP,
RoP; Lewis and Eisen, 2003).

                                             21
4.2 Spatial and temporal synchrony: corridors of growth or gradients of diffusible
cues?
The mechanism of axonal pathfinding is commonly described by growth cones’ ability to
sense gradients of diffusible guidance cues in the environment. At the midline, a switch
in growth cone responsiveness to gradients is explained by a change in growth cone sur-
face receptor expression. Earlier, though, axonal pathfinding was described mediated
by substrate-bound molecules, which are a common guidance mechanism for migrating
cells (reviewed and investigated by Akin and Zipursky, 2016; Batlle and Wilkinson, 2012;
Bernhardt et al., 1992; Bovolenta and Dodd, 1990; Brose et al., 1999; Chédotal, 2019; de
Ramon Francàs et al., 2017; Kidd et al., 1999; Kolodkin and Tessier-Lavigne, 2011; Lentz
et al., 1997; Mai et al., 2009; Moore et al., 2012; Stoeckli and Landmesser, 1995; Tanaka
and Kirschner, 1995; Tessier-Lavigne and Goodman, 1996).
In this study, the striking stereotyped spatio-temporal wiring suggests, without pro-
viding direct evidence, that growth cones in the zebrafish spinal cord find their path
by following predetermined substrate-bound tracks in the environment. Hence, though
disregarding that there perhaps occur corrections of guidance errors of a smaller magni-
tude than the here defined 10 μm type (Hutson and Chien, 2002), the very fast stereo-
typed and error-free wiring in many segments would from a mechanistic point of view
seem easiest, or simplest, to accomplish if the growth cones were following corridors of
substrate-bound cues (i.e. short-range cues or physically attached growth cues) rather
than gradients of diffusible cues (i.e. long-range cues). For example, the three differ-
ent stereotyped tracks of a) the obliquely ascending axons joining the DLF (Movie 2),
b) the canonical commissurals crossing perpendicular to the midline (Movie 1 and 3)
and c) all the ipsilateral axons, would otherwise require three different intermingled gra-
dients to be set up by yet other cells that would need to be present at precise spatial
locations to generate the three different spatial gradients of guidance cues. Additionally,
erroneous midline crossings, corrected subsequently to ipsilateral growth, were never
observed in the spinal cord. This indicates an underlying error-free process that likely
could be accomplished by stereotyped corridors of growth. This discussion, on stereo-
typical guidance, concerns the mechanism by which it is achieved, since it unarguably
is occurring in vivo. Indeed, zebrafish resemble each other generation after generation,
which is proof of a stereotypical process, in some cases even down to details observed at
the microscopic level, as recently reported for the processes leading to the emergence of
patterned neuronal population activity in the developing zebrafish spinal cord (Wan et
al., 2019).
Recent and older data from other investigators also point to the importance of substrate-
bound guidance mechanism. Substrates (e.g. NrCAM, laminin) are known to have a
dramatic impact on axonal growth (Andersen, 2001; Lentz et al., 1997; Stoeckli and
Landmesser, 1995; Stoeckli et al., 1997; Tanaka and Kirschner, 1995). In the mammalian
forebrain, commissural midline crossing requires a transient population of midline glial
cells (reviewed in (Comer et al., 2015). Akin and Zipursky (2016) reported for the wiring
of the Drosophila R8 photoreceptor cells that while a gradient of substrate-bound netrin
was observed, netrin-DCC was not required for R8 chemoattraction but was found to be
required for the R8 axon to remain attached to its final target. Both Slit and netrin are
possibly in vivo presented to the axons in a co-localized substrate-bound form rather than
as freely diffusible ligands (Akin and Zipursky, 2016; Brankatschk and Dickson, 2006;
Brose et al., 1999; Kidd et al., 1999; Zelina et al., 2014). Indeed, physical attachment of
netrin to a substrate seems important for its ability to induce an attractive response via
the DCC receptor (Endo et al., 2016; Moore et al., 2012).
22Hence, whether growth cones are explained to be guided by gradients of diffusible
cues (i.e. long-range cues) or by substrate-bound corridors of growth (i.e. short-range
cues) may in part be a question of semantics; likely of minor importance for the cellular
mechanisms of axon guidance in vivo (also discussed by Akin and Zipursky, 2016), but
probably of importance for setting up and organizing axon guidance at an organismal
scale in a 3D in vivo environment. Thus, the various ligands may well be substrate-
bound in vivo (i.e. are membrane-bound, reviewed by Stoeckli and Landmesser, 1995).
However, gradients of ligands are still involved in vivo, and in vitro experiments have
demonstrated clearly that gradients of diffusible cues can guide axons in vitro. Neverthe-
less, in vitro experiments represent non-physiological conditions that may not properly
mimic and cannot substitute for a 3D in vivo environment. (reviewed in Aberle, 2019; de
Ramon Francàs et al., 2017; Endo et al., 2016; Kolodkin and Tessier-Lavigne, 2011).
4.3 Filopodia interactions with surroundings and axonal shaft bends: growth under
tension
The commissural axons avoid each other on the floor plate. The recordings suggest
the avoidance is mediated by the growth cones’ filopodia, which seem to serve as a steer-
ing device that appears to act repulsively by avoiding prolonged interactions when collid-
ing with neighboring axonal shafts in the vicinity. However, upon reaching the DLF at the
contralateral side, the axons will eventually fasciculate. What mediates this shift from
avoidance to fasciculation upon floor plate crossing remains unknown, though similar
observations were reported earlier (Bak and Fraser, 2003; Drapeau et al., 2002; Michalski
et al., 2013; Moon and Gomez, 2005; Myers and Bastiani, 1993a;b). Axonal fascicula-
tion and peripheral synapse formation likely could be analyzed further in vivo with this
nanometer-resolution light-sheet approach.
The sinusoidal-shaped shaft-bendings illustrate how wobbly the entire network is
at this stage of development. The movies strongly suggest a direct role for filopodia
in inducing these reversible bends. A previous study using fixed Xenopus spinal cords
also reported commissural shaft bends and proposed similarly that they are caused by
filopodia interactions (Mason and Wang, 1997; Moon and Gomez, 2005).
A second shaft-bending mechanism appears likely, based on some of the recordings.
Notably at guidance points, namely, for example when the axons reach the contralateral
side, the growth cones sometimes stall as if loosing traction and the trailing shaft is then
observed to bend (e.g. Movie 4 label N2 and N3). The shafts of growing axons have
been reported to be under pulling tension by being stretched out like an elastic band
by advancing growth cones. Hence, it seems possible that the observed bends to some
extent could be caused also by the advancing growth cones losing traction temporarily,
thereby releasing the pulling tension on the shaft that would then bend like a relaxed
elastic band (Athamneh et al., 2015; Athamneh and Suter, 2015; Holland et al., 2015;
Mota and Herculano-Houzel, 2012; O’Toole et al., 2008).
In contrast, the ipsilateral axons were not seen making sinusoidal-shaped bends in the
available recordings. Their fast growth rates increase pulling tension on the shafts, which
may change their flexural rigidity as compared with that of the commissural shafts; also,
the ipsilateral growth cones did not seem to stall at any point. Perhaps because they are
growing in a substrate-bound corridor of growth and have less guidance information to
interpret as compared to commissural axons crossing the floor plate. Moreover, ipsilat-
eral axons appeared in the movies to have few neighboring growth cones with filopodia
that could collide with them.
It appears likely that the observed bends of the commissural shafts may be caused
23You can also read