The economic impact of Internet traffic growth on network operators
←
→
Page content transcription
If your browser does not render page correctly, please read the page content below
WIK-Consult Draft Final Report
Study
The economic impact
of Internet traffic growth
on network operators
for submission to
Google
by J. Scott Marcus
WIK-Consult GmbH
Rhöndorfer Str. 68
53604 Bad Honnef
Germany
This report solely reflects the views of the author.
It does not necessarily represent the views of Google, Inc.
Bad Honnef, 24 October 2014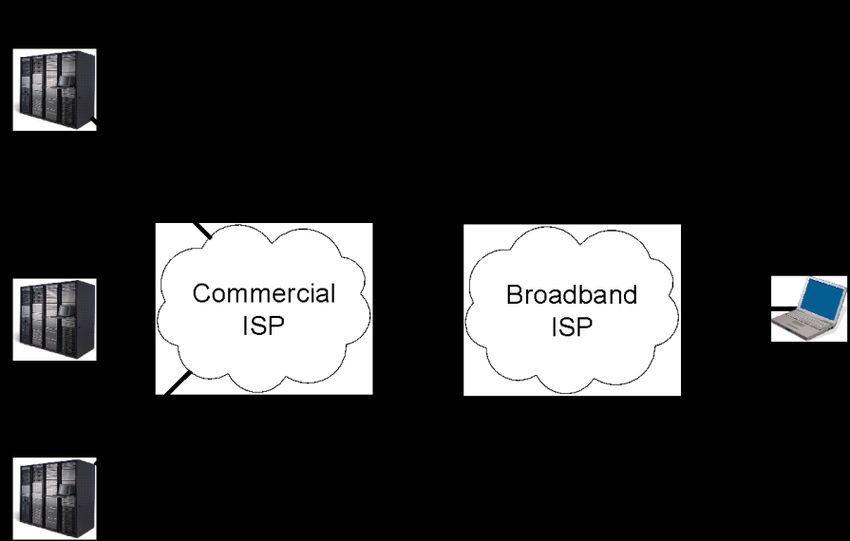
The economic impact of Internet traffic growth on network operators    I

Contents

Contents                                                                                          I

Figures                                                                                          III

Tables                                                                                           IV

1 Introduction                                                                                    1

2 Connection and interconnection in the Internet                                                  2

  2.1       Peering, transit, and more exotic forms of interconnection among ISPs                 2

  2.2       How content providers invest to deliver their services                                4

  2.3       Conclusions                                                                          10

3 Understanding network costs and network prices                                                 11

  3.1       Costs and prices                                                                     13

  3.2       Fixed costs versus usage-based costs                                                 14

  3.3       Moore’s Law                                                                          17

  3.4       Trends in relevant unit costs                                                        19

    3.4.1        Unit costs for equipment in the network core                                    19

    3.4.2        Internet transit costs                                                          21

    3.4.3        Effects at the edge of fixed and mobile networks                                24

  3.5       Trends in traffic volumes                                                            26

  3.6       Trends in the number of subscribers                                                  31

  3.7       Trends in traffic per subscriber                                                     34

  3.8       Trends in pricing                                                                    38

  3.9       Overall conclusions                                                                  44

4 Two-sided market theory and the Internet                                                       46

  4.1       Two-sided market theory                                                              47

  4.2       Two-sided markets and the Internet                                                   49

  4.3       The challenge of funding Next Generation Access (NGA)                                52

    4.3.1        The cost of fibre-based NGA poses a challenge to deployment                     52

    4.3.2        Challenges on the demand side                                                   53

    4.3.3        Cross subsidies between market sectors                                          56

  4.4       Conclusions                                                                          56
II The economic impact of Internet traffic growth on network operators
5 Findings and conclusions 58
5.1 Key findings 58
5.2 Recommendations to incumbent network operators 60
5.3 Recommendations to policymakers and regulators 61
References 62The economic impact of Internet traffic growth on network operators III
Figures
Figure 1: Peering and transit relationships 4
Figure 2: Monthly cost elements of a bundled DSL broadband/voice service (2013) 16
Figure 3: Microprocessor Transistor Counts 1971-2011 & Moore's Law 18
Figure 4: Price per Mbps (USD) and shipment quantities for high end routers 20
Figure 5: Price per Mbps (USD) and shipment quantities for long haul
DWDM 21
Figure 6: Estimated IP transit prices in USD / Mbps (1998 - 2015) 22
Figure 7: Global IP transit revenues (2013-2020) 23
Figure 8: Advanced mobile technology significantly lowers unit costs 25
Figure 9: Internet backbone traffic growth rates 27
Figure 10: Cisco VNI forecast of global fixed Internet and managed IP traffic
in Exabytes per month and associated growth rates (2014-2018) 28
Figure 11: Global IP traffic by application category (2013-2018) 29
Figure 12: Cisco VNI forecast of fixed plus mobile Internet traffic in Petabytes
per month in Europe (2013-2018) 30
Figure 13: Cisco VNI forecast of mobile Internet traffic in Exabytes per month
and associated growth rates (2014-2018) 31
Figure 14: Worldwide fixed broadband subscribers 32
Figure 15: Fixed broadband subscriptions for OECD members 33
Figure 16: Growth in the number of fixed subscribers in Europe (2003-2012) 34
Figure 17: Number of subscribers and projected traffic in Exabytes
(2013-2018) 36
Figure 18: Projected traffic per fixed subscriber in Gigabytes per month and
growth rate (2013 2018) 37
Figure 19: Average Revenue per User (ARPU) in GBP for fixed broadband in
selected countries (2007-2012) 39
Figure 20: Prevalence of bit / data usage caps among surveyed offers
(September 2012) 43
Figure 21: Average data caps (GB), logarithmic scale (September 2012) 44
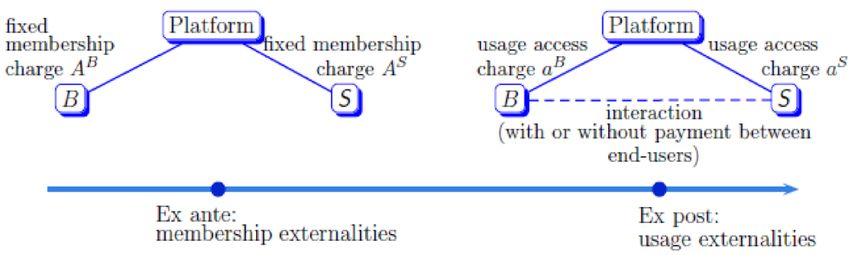
Figure 22: A two sided market 48
Figure 23: Subscription and usage fees in a two-sided market 49
Figure 24: Application services, ISPs, and end-users in the LMRT paper 50
Figure 25: Bandwidth consumption per household, Italy and selected
countries (2012) 55IV The economic impact of Internet traffic growth on network operators
Tables
Table 1: Total fixed broadband revenues in billion GBP in selected national
markets (2007 and 2012) 40
Table 2: Compound Annual Growth Rates (CAGRs) for fixed and mobile
subscribers in selected countries (2007-2012) 41
Table 3: CAPEX required to achieve 30 Mbps coverage in Italy (2014) 53The economic impact of Internet traffic growth on network operators 1
1 Introduction
In recent years, a number of telecommunications network operators have repeatedly
raised concerns that the explosive growth of Internet traffic is causing their costs to
1
spiral out of control, to the point where their services may no longer be sustainable.
In this paper, we examine this concern and find that it is not well supported by the data.
While Internet traffic is certainly increasing, there have also been offsetting cost
reductions thanks to technological innovation. On fixed networks, the total usage-based
cost per user is likely declining, despite the increase in traffic; on mobile networks,
although the usage-based cost per user cost is likely increasing, network operators are
benefiting both from cost declines, and from offsetting revenue increases.
Overall, we feel that the current data continue to demonstrate that traffic growth is not a
root cause of the challenges that network operators face.
Section 2 explains how content providers, consumers, businesses, and ISP networks
connect to one another to exchange their traffic, from the perspectives both of
technology and of economics. Section 3 discusses current trends as regards the costs
and prices of ISP networks today and tomorrow. Where Section 2 is largely based on
theory, Section 3 is empirical and quantitative. Section 4 provides a different
perspective, explaining the relevance of the economic theory of two-sided markets to
the discussion, and discussing the relevance of this discussion to the challenges going
forward of funding fibre-based Next Generation Access. Section 5 makes
recommendations to industry and to policymakers going forward.
The focus of this paper is not only on Europe, but also on North American and global
trends.
1 See for instance PAGE, Mark / ROSSI, Luca / RAND, Colin (2010): “Those who have to build and
operate the networks required to carry these traffic volumes earn almost no revenue from [content
providers] and are often locked into flat rate price schemes with the [consumers], continually
decreasing because of retail competition.” For a more recent expression of similar concerns, see
heise online (2014), “Deutsche Telekom: ‘Netzneutralität ist in Wahrheit die Privilegierung großer US-
Internetkonzerne‘“,17 September 2014, at: http://www.heise.de/netze/meldung/Deutsche-Telekom-
Netzneutralitaet-ist-in-Wahrheit-die-Privilegierung-grosser-US-Internetkonzerne-2392253.html.2 The economic impact of Internet traffic growth on network operators
2 Connection and interconnection in the Internet
Key Findings
How do network operators carry Internet traffic among one another? How do
content providers connect to the Internet, and to you? How does their connection
differ from the connection that you have at home or at the office?
The majority of interconnection among Internet Service Providers (ISPs)2 takes place
using variants of either peering or transit.
Content providers make substantial payments for network connectivity, either through
payments to Internet backbone providers, other Internet Service Providers (ISP), and
Content Delivery Networks (CDNs), or else through their own investment in equivalent
infrastructure. Content providers connect to the Internet in principle in much the same
way as other business users; however, large content providers are likely to climb their
own “ladder of investment”, progressively internalising more and more of the functions
of a network operator and/or a CDN.
We find nothing in the existing relationships among content providers and Internet
access providers that necessarily implies a free riding problem.
2.1 Peering, transit, and more exotic forms of interconnection among ISPs
If you have a broadband connection at home, you pay an Internet Service Provider
(ISP) to deliver your data to and from pretty much any Internet location in the world.
Similarly, small businesses and large corporations buy transit services from ISPs, and
for exactly the same reason. It enables them to communicate with other locations on the
Internet.
ISPs need to interconnect with one another as well; otherwise, their respective customers
would not be able to communicate with one another. One of the main means by which
they do this is, once again, transit. The transit services that one ISP purchases from
another (usually better-connected) ISP are not significantly different from those that an
enterprise would purchase from the ISP. It is not unusual to find a chain of these transit
relationships, where a small or poorly connected ISP is a transit customer of a larger or
better connected ISP, which in turn is a transit customer of a large, well-connected ISP.
2 An Internet Service Provider is a network operator that provides access to the Internet as a service to
its customers.The economic impact of Internet traffic growth on network operators 3
For clarity of exposition, we refer to the ISPs that serve consumers as broadband ISPs,
and the ISPs that serve large businesses and other ISPs as commercial ISPs. It is not
unusual for the same company to serve in both roles.
If there were some single super-ISP that ultimately served the whole world, there would
be no need for any interconnection arrangements other than transit relationships;
however, there are good technical and economic reasons why things are not done in
3
that way. Such a structure would imply a single point of failure, and would also tend to
imply a single ISP with monopoly market power.
A second arrangement evolved to interconnect ISPs, especially ISPs of similar size or
geographic reach. When two ISPs agree to become peers, they agree to interchange
traffic, but only for their respective customers (or customers of their respective
customers).
There is almost always a charge for transit service, since the ISP is providing a service
to its customer. The relationship is asymmetric – the transit customer is not expected to
provide the transit provider with transit service to third parties. Peering is, however, a
symmetric relationship. If both ISPs feel that they are getting a fair exchange of value,
4
they may (or may not) agree that no money should change hands.
A combination of peering and transit among ISPs would be sufficient to provide a fully
connected global Internet (see Figure 1). In the figure, the blue horizontal lines at the
top represent peering relationships; all other lines are transit. Each peer forwards traffic
only for its own transit customers, and for transit customers of its transit customers;
thus, ISP A can communicate with ISP B, and ISPs A1 and A1a can communicate with
ISP B1; however, ISP A1 cannot use the peering relationship between ISP A and ISP B
to communicate with ISP C1. ISPs A and C must make some other arrangement (for
example, an agreement to peer with one another, which is not shown in Figure 1) to
ensure that their respective customers can communicate with one another.
3 In other words, a failure of the single super-ISP would imply a loss of global connectivity.
4 For more rigorous definitions of peering and transit, see Section 2.5 of the “Service Provider
Interconnection for Internet Protocol Best Effort Service”, a white paper that was produced by NRIC V
(the Network Reliability and Interoperability Council V, and advisory group to the US FCC). “Peering is
an agreement between ISPs to carry traffic for each other and for their respective customers. Peering
does not include the obligation to carry traffic to third parties. … Transit is an agreement where an ISP
agrees to carry traffic on behalf of another ISP or end user. … Transit is usually a bilateral business
and technical arrangement, where one provider (the transit provider) agrees to carry traffic to third
parties on behalf of another provider or an end user (the customer). In most cases, the transit provider
carries traffic to and from its other customers, and to and from every destination on the Internet, as
part of the transit arrangement. … Peering thus offers a provider access only to a single provider’s
customers. Transit, by contrast, usually provides access at a predictable price to the entire Internet. …
Historically, peering has often been done on a bill-and-keep basis, without cash payments.”4 The economic impact of Internet traffic growth on network operators
Figure 1: Peering and transit relationships
Source: WIK-Consult
Very few ISPs are able, however, to use peering to reach all Internet destinations. Even
well-connected ISPs typically purchase transit from one or two other ISPs in order to
reach destinations that are not covered by their own peering arrangements.
In practice, more complicated variants of peering and transit are also used, and there
are some suggestions that these exotic variations are becoming more common over
5
time.
2.2 How content providers invest to deliver their services
In the current debate as to whether content providers should be obliged to make
payments to the broadband ISPs that serve the consumers who view their content, it is
sometimes asserted that providers of content do not pay for transmitting their data to
their customers. The fact is, content providers have always made substantial payments
for their connectivity, and we see nothing to suggest that they are, on balance, paying
less than they ought to be (see also Chapter 3). We find nothing in the existing
relationships among content providers and Internet access providers that necessarily
implies a free riding problem.
5 See P. Faratin, D. Clark, S. Bauer, W. Lehr, and P. Gilmore, "The Growing Complexity of Internet
Interconnection", Communications & Strategies, number 72, 4th quarter, 2008.The economic impact of Internet traffic growth on network operators 5
Content providers could be said to be on a ladder of investment. As a content provider’s
traffic, customer base and revenue stream grow, it achieves greater economies of
scale. With greater scale, the content provider finds it cost-effective to internalise more
6
and more network and content delivery functions, thus climbing the ladder.
● Small content providers tend to use commercial third party hosting services to
host their content, and may use commercial services (such as Amazon) to
provide general remote computing application services (e.g. cloud services).
● Somewhat larger content providers may choose to deploy their own web hosting
capabilities, and to purchase their own transit services from commercial ISPs.
They may also find it cost-effective to use a commercial third party Content
Delivery Network (CDN)) such as Akamai or Limelight. The CDN tends to
improve performance for the content provider’s users, and also to reduce the
7
content provider’s expenditures for transit service.
● Still larger content providers make substantial investments of their own in
international or global networks. Some content providers peer with ISPs,
because that can improve performance and can reduce their need for transit
services.
● The largest content providers may find it cost-effective to deploy their own
content delivery networks instead of (or in addition to) using commercial CDN
services such as Akamai or Limelight.
Different companies make different choices, but the general tendency is to invest more
as the content provider’s service grows in popularity. For example, Facebook started in
a dorm room, and, having grown substantially, broke ground on its first data center in
2010. Google started in a garage, but today (1) hosts its own content, (2) purchases
transit, (3) invests in a large global network, (4) peers with many ISPs, and (5) offers its
own CDN for deployment within the networks of larger ISPs.
Similarly, Netflix has gone to progressively greater lengths and has apparently made
significant development and deployment investments in order to efficiently deliver
streaming video to its customers. As recently as 2012, Netflix implemented a complex
architecture including the use of Amazon cloud services for Operational Support
Systems (OSS), together with caching of video content through three Content Delivery
8
Networks: Akamai, Limelight, and Level3. Today, however, Netflix makes no use of
6 This is different in its details from the broadband ladder of investment propounded in a series of
papers by Martin Cave (see for instance CAVE (2004)), but it is similar in its effects. As an
organisation grows, it is motivated to climb the ladder.
7 For background on CDNs, see Gries, C. and I. Philbeck (2013): Marktentwicklung im Bereich Content
Delivery Networks (Market developments in Content Delivery Networks), WIK-Diskussionsbeitrag No.
376, April 2013. (German only.)
8 Vijay Kumar Adhikari, Yang Guo, Fang Hao, Matteo Varvello, Volker Hilt, Moritz Steiner and Zhi-Li
Zhang (2012), ‘Unreeling Netflix: Understanding and Improving Multi-CDN Movie Delivery’.6 The economic impact of Internet traffic growth on network operators
third party CDNs; instead, Netflix uses three distinct means of delivering its content as
close as possible to Netflix’s end users, in each case making substantial payments in
storage and/or in network transmission capabilities in order to ensure that Netflix
customers (who are also customers of their respective broadband ISPs) are able to
enjoy a service of acceptable quality. The first is these is through direct peering
arrangements with the broadband ISP; the second is through a transit provider such as
Cogent or Level 3; and the third is by means of Netflix Open Connect, where Netflix
provides embedded CDN cache servers that to the broadband ISPs that serve Netflix
9
end users (as we explain shortly).
Apple appears to be following much the same trajectory as Google and Netflix, and for
largely the same reasons. “Apple's online delivery needs have grown in the last few
years, driven by its iCloud service for storing users' data and rising sales of music,
videos and games from iTunes and the App Store. … The company's need for
bandwidth and supporting infrastructure will grow if it moves further into television. …
Apple is signing long-term deals to lock up bandwidth and hiring more networking
experts, steps that companies like Google … and Facebook Inc. have already taken to
gain more control over the vast content they distribute. … Several analysts, however,
doubted that Apple could bring all that business in-house overnight. ‘It's a natural
progression for a company like Apple,’ said Aaron Blazar, vice president at telecom
10
consultancy Atlantic-ACM. ‘It can take several years.’”
As we have seen in Section 2.1, common practice in the Internet today is for each
transit customer to pay for transmitting its data to all destinations on the Internet. This is
just as true for commercial enterprise customers as for residential consumers, and it is
also true in general for content providers just as it is for other commercial users. The
broadband ISPs that serve consumers (not necessarily the same ISPs as the
commercial ISPs that serve their content providers) benefit from carrying the content
because their customers demand and desire it. The content provider pays to use
commercial Internet transit services to deliver a significant fraction of its traffic to end-
users. There is no question of free riding here.
As an alternative to purchasing transit services, a content provider that operates an
IP-based network could peer with ISPs who agree to do so. Although content providers
are not ISPs in the traditional sense (in that they do not necessarily have end-user
customers who purchase Internet connectivity directly from them), a number of content
providers have invested in building out networks that are comparable to those of the
largest ISPs. Content providers of sufficient scale can and do offer and obtain peering
arrangements to backbone and access networks worldwide. These are commercially
9 Markham C. Erickson et al. (2014), “Petition to Deny of Netflix, Inc” (in connection with Comcast /
Time Warner).
10 Drew Fitzgerald and Daisuke Wakabayashi (2014), “Apple Quietly Builds New Networks: Company
Boosts Internet Infrastructure, Lays Groundwork for More Traffic Amid Broader Ambitions”, Wall Street
Journal, 3 February 2014.The economic impact of Internet traffic growth on network operators 7
negotiated arrangements where the content provider exchanges traffic with the network
operator on a peering basis. Typically, there are no traffic-based charges to either party.
Many of these content providers also connect to Internet Exchange Points (IXPs)
around the world. For smaller networks, it is not unusual for the content provider to
adopt a liberal peering policy where it offers to peer with almost any network at any of
the Internet Exchange Points at which the content provider is present, subject to a basic
set of conditions detailed in the content provider’s peering policy.
Content providers also invest and innovate in a number of significant ways in order to
reduce the impact of their traffic on network operators that carry the traffic to
consumers. A noteworthy difference between the peering practices of some content
providers and those of commercial ISPs is that, where the content provider and a large
commercial or broadband ISP are connected at multiple physical locations, it is not
unusual for the content provider to attempt to carry traffic to the interconnection point
that is closest to the end-user. In contrast, common practice among ISPs is to hand off
traffic at the first available interconnection point (“hot potato” or shortest exit routing). An
advisory panel to the US FCC explained that “ISPs use shortest exit routing (also
known as ‘hot potato’ routing). With shortest exit routing, a packet which is to be
forwarded via a neighboring ISP is sent via the nearest interconnect to that ISP, without
concern for where in the neighboring ISP the destination is actually connected. In other
words, the packet will use the interconnect closest to the point where the packet enters
the first ISP. If both ISPs use shortest exit routing, the paths that the packets take will
not be the same in both directions, even between the same two end points.
[Asymmetries of traffic therefore come into play.] … A significant percentage of the
traffic in the Internet goes between web users (i.e., personal computers and
workstations) and web servers. In general, the volume of traffic from web user to web
server is relatively small (consisting of requests for content), and the volume of traffic
from web server to web user is relatively large (consisting of the content itself). This
implies that in many cases a particular user of the Internet may originate an exchange
of data, for example by using their personal computer or workstation to query a web
server. However, the system which initiates the exchange is typically the source of only
a small percentage of the total traffic, while the web server which is offering a service is
typically the source of the bulk of the traffic. Where shortest exit routing is used between
ISPs with a similar geographic footprint, this means that the amount of traffic is different
11
in each direction, which may cause one ISP to incur more cost than the other.”
These cost asymmetries are the reason why some large ISPs refuse to grant peering
where there is a significant traffic asymmetry. Content providers can ameliorate these
cost asymmetries, however, by carrying the traffic as close as possible to the point in
11 NRIC V, Focus Group 4 (2001), Interoperability: Service Provider Interconnection for Internet Protocol
Best Effort Service. This author was among the drafters of that report. Since the report is not widely
available today, relevant parts of the discussion are reproduced in full here. See also J. Scott Marcus
(1999), Designing Wide Area Networks and Internetworks: A Practical Guide, Addison Wesley,
Chapter 14.8 The economic impact of Internet traffic growth on network operators
the ISP’s network where the user is located. Carrying the traffic closer to the end user
serves both to enable a better user experience for the consumer, and also to reduce
cost for the commercial or broadband ISP (at a correspondingly increased cost to the
content provider).
A second major innovation is that the content provider can offer to deploy servers for its
own Content Delivery Network (CDN) into the network of larger ISPs or at large traffic
aggregation points aggregation points, such as Internet Exchanges. This tends to bring
the content closer to the consumer, which reduces the distance that the data has to
travel and the number of routers through which it must pass. This reduction in distance
travelled tends in turn to reduce delay, and to provide a better experience for the end-
user of the content provider’s services.
A few of the largest content providers offer to assume the cost of procuring CDN
servers at their own expense, deploying them into the networks of participating ISPs,
12
and operating them. The ISP is expected to provide (1) network connectivity to the
CDN servers, and (2) rack space and power in a suitable facility. In most cases, ISPs
are happy to agree to these arrangements because they reduce the net cost of network
transmission for the ISP – they avoid the need to carry the same data around the ISP's
network many times, and reduce the average distance that data travels. Moreover, the
customers who benefit from improved response time are customers not only of the
content provider, but also of the ISP.
If a content provider offers CDN servers to ISPs, it presumably perceives a new gain in
terms of its profitability. It is investing in order to achieve a better experience for its
users, and is also reducing costs by reducing carriage of traffic across its own network
as well as reducing the payments that it would otherwise be obliged to make for transit
services (thus substituting capital expenditures for operating expenditures). If a
consumer-serving broadband ISP accepts CDN servers, it is because it perceives
economic benefit in doing so, probably in terms of a better experience for its own end-
users, and a reduction in net costs. Thus, for a content provider to offer peering or CDN
capabilities should not be viewed as a case of free-riding, but rather as a win-win
situation (a Pareto improvement, with benefits all around) for the ISP, the content
provider, and the end-user.
As an example, Google itself functions not only as a content provider, but also as a
broadband ISP in a few U.S. cities providing consumers with high speed fibre-based
Internet access in a number of cities in the United States (Google Fiber). Google as a
broadband ISP considers the use of CDNs on the part of other content providers to be
positive for Google Fiber’s business case. “We give companies like Netflix and Akamai
free access to space and power in our facilities and they provide their own content
12 See, for instance, Netflix (2012), “Announcing the Netflix Open Connect Network”, at:
http://blog.netflix.com/2012/06/announcing-netflix-open-connect-network.html.The economic impact of Internet traffic growth on network operators 9
servers. We don’t make money from peering or colocation; since people usually only
stream one video at a time, video traffic doesn’t bog down or change the way we
manage our network in any meaningful way — so why not help enable it? But we also
don’t charge because it’s really a win-win-win situation. It’s good for content providers
because they can deliver really high-quality streaming video to their customers. … It’s
good for us because it saves us money (it’s easier to transport video traffic from a local
server than it is to transport it thousands of miles). But most importantly, we do this
because it gives Fiber users the fastest, most direct route to their content. That way,
you can access your favorite shows faster. All-in-all, these arrangements help you
experience the best access to content on the Internet — which is the whole point of
13
getting Fiber to begin with!”
Not all ISPs agree to peer with content providers, and not all agree to accept the CDN
servers offered by content providers. This may be their prerogative, but the reasons for
such a refusal are not always clear, since the refusal often implies increased costs for
the ISP and does not necessarily increase the revenues of that ISP. The content
provider would need to serve the same end-user customers, and would presumably
14
send roughly the same volume of data by means of any of its transit providers. It
would only rarely be the case that the same ISP that refuses to peer with a content
provider subsequently becomes the transit provider to the same content provider. The
ISP that refuses to peer would thus end up accepting roughly the same data, either over
a peering connection to some other ISP, or else over a transit connection to the ISP's
transit provider. In the former case, the ISP may incur additional internal network
transmission costs, but derives no additional revenue. A refusal to agree to peering
arrangements or a CDN would thus tend to reduce profits both for the ISP in question
and for the content provider, and also to result in a poorer customer experience for their
mutual end-user.
Where a broadband ISP and a content provider (or an ISP that serves the content
provider) cannot come to terms, it is not unusual for the broadband ISP to delay
upgrading interconnect capacity, thus allowing performance to gradually degrade as
traffic increases over time. Our feeling is that it is preferable, whenever possible, for the
parties to reach some commercial agreement rather than holding users hostage to a
commercial dispute to which they are not a party.
Different content providers approach their connectivity needs in different ways, but the
same analysis will tend to hold in general. Content providers are presumably making
payments for transit service that are rational in terms of the costs to which their
commercial transit provider ISPs are subject. The broadband ISPs that serve
13 Jeffrey Burgan (2014), “Behind the scenes with Google Fiber: Working with content providers to
minimize buffering”, 21 May 2014, at:
http://googlefiberblog.blogspot.de/2014/05/minimizing-buffering.html.
14 This is the underlying rationale for the off-net cost pricing principle described in Laffont, Marcus, Rey
and Tirole (2003).10 The economic impact of Internet traffic growth on network operators consumers (not necessarily the same ISPs as those that serve their content providers) benefit from carrying the content because their customers demand and desire it. None of these arrangements necessarily implies a free riding problem. In each case, the content provider can be assumed to be investing appropriately, either in infrastructure or in Internet transit service. 2.3 Conclusions Internet Service Providers (ISPs) connect to consumers, to businesses, and to content providers under generally similar technical and economic arrangements. The payments and investments that large content providers make are not necessarily different from or less than the payments and investments that other business users of similar size would make. Disputes between content providers (and the commercial ISPs that serve them) and consumer-facing broadband ISPs have occurred from time to time in the past, and will continue to occur in the future. Disputes like these involve difficult fact-specific determinations that will not necessarily lead to simple or unambiguous answers. What will be important going forward is that disputes do not impede the ability of consumers to view the content that they wish over the networks that they have chosen.
The economic impact of Internet traffic growth on network operators 11
3 Understanding network costs and network prices
Key Findings
Traffic volumes for Internet Protocol (IP) traffic are increasing, both for fixed and for
mobile networks, but the percentage rate of traffic increase year over year is declining
over time.
The growth in traffic reflects not only an increase in traffic per subscriber, but also an
increase in the number of subscribers. The number of fixed broadband subscribers
continues to increase, as does the number of mobile users who use data services.
Unit costs for relevant network equipment such as routers and optoelectronics are
declining at a rate equal to or greater than that of Internet traffic increase per user in the
fixed network. This can be viewed as an example of Moore’s Law.
In both the fixed and mobile European networks that are the primary focus of this study,
prices seem to respond to changes in underlying costs, as they should in competitive
markets.
For the fixed network:
The positive unit cost impact of Moore’s Law price/performance improvements is
now marginally greater than the negative unit cost impact of traffic growth per user.
Broadband prices appear to be declining slightly.
For the mobile network:
The positive unit cost impact of Moore’s Law price/performance improvements
appears to be significantly smaller than the negative unit cost impact of traffic
growth per user.
Effective prices have increased substantially.
If individual companies find it difficult to raise prices due to competition, this is not a
market defect. The most likely explanation is that their costs are higher than those of
their competitors. Costs and revenues are growing in balance with one another overall.
A key claim that this study seeks to address is that costs are rapidly increasing for
network operators, but that retail prices for consumer broadband for some reason
cannot respond.
A number of factors need to be considered in assessing that claim, all of which are
amenable to some degree to objective quantitative and empirical analysis, in terms of
their historical behaviour and also of likely future trends. To an economist, the price and
quantity of goods or services tend to be key, as they are here.12 The economic impact of Internet traffic growth on network operators
● What is the historical and likely future tendency of the quantity of service
demanded over the Internet (expressed here primarily in terms of network
traffic)?
● What is the historical and likely future tendency of unit prices for the cost drivers
that influence the retail price?
● What indications are there that the retail price for broadband Internet access
can, or cannot, increase in response to a net increase in underlying costs?
There is no question that Internet traffic is increasing – but this is nothing new. Internet
traffic has been increasing for as long as there has been an Internet. It is equally clear
that the unit cost of most of the goods and services used to produce broadband Internet
access are declining.
The question, then, does not depend solely on whether Internet traffic is increasing.
Rather, it depends on whether the increase in traffic is faster than the decline in the
underlying unit costs of carrying that traffic.
This question is, as it happens, not a new one. Both practitioners and academic experts
have long understood that there was something of a race between the growth in
Internet traffic and the cost reductions driven by improvements in semiconductor
technology (see the discussion of Moore’s Law in Section 3.3). In a 2001 paper, for
instance, Coffman and Odlyzko (looking at traffic growth that in percentage terms was
far more rapid than what we experience today) noted that “Since computing and storage
capacities will ... be growing, as predicted by the versions of ‘Moore’s Law’ appropriate
for those technologies, we can expect demand for data transmission to continue
15
increasing. A doubling in Internet traffic each year appears a likely outcome. … Such
a growth rate would have several important implications. In the intermediate run, there
would be neither a clear ‘bandwidth glut’ nor a ‘bandwidth scarcity,’ but a more
16
balanced situation, with supply and demand growing at comparable rates.”
We also note that, in assessing these factors, it is important to distinguish between
growth in the number of subscribers and growth in the traffic per subscriber. They have
quite different effects on the revenue and profitability of network operators. A new
subscriber is generally associated with a new revenue stream. New subscribers might
tend to have lower willingness to pay (WTP) than existing subscribers (otherwise they
would have joined sooner), but they might also make less use of the network and thus
generate less traffic. In the abstract, then, the ratio between costs and prices for new
consumers would not necessarily be very different from the ratio for existing customers.
15 A doubling year over year may have appeared likely in 2001, but rates of traffic growth today are far
less, as we explain shortly.
16 Coffman/Odlyzko (2001).The economic impact of Internet traffic growth on network operators 13
Section 3.1 provides a general overview of the relationships between price and cost as
they relate to the matter at hand. Section 3.2 notes the distinction between usage-
based costs, which are directly relevant to the discussion, and fixed costs, which for the
most part are not. Section 3.3 summarises Moore’s Law and its relevant effects. Section
3.4 reviews trends in a number of key underlying relevant cost drivers of an Internet
network operator. Section 3.5 explains overall trends in Internet protocol traffic, while
Section 3.6 explains the corresponding trends in the number of Internet subscribers.
Section 3.7 integrates the material in the previous two sections, presenting traffic per
user, which is a normalised measure of the key alleged driver of cost. Section 3.8
explores trends in retail pricing, and their relevance for overall revenue for the network
operator. Section 3.9 then closes with findings and conclusions.
3.1 Costs and prices
Key Findings
In a conventional competitive market, marginal cost tends to set a floor for retail prices,
while the prices established by competitors effectively set a ceiling.
Before embarking on an analysis of costs and prices for transmission over the Internet,
it is useful to review the general economic principles that link costs to prices.
In an effectively competitive market, prices tend in general to move in response to
17
underlying costs. The short run marginal cost sets a lower bound to the price, while
the prices established by competitors effectively set a ceiling. The difference between
the cost and the price is the producer’s profit.
There are exceptions. Under some circumstances, a producer maintains some pricing
18
power – the ability to price significantly in excess of its costs. A firm that benefits from
strong brand recognition may benefit from some degree of pricing power. Price and/or
quality discrimination (as for instance occurs when an airline distinguishes between first
class and second class tickets) can also confer some pricing power.
Market power can enable a firm to price above the competitive level that would
otherwise prevail – if there are no competitors, or if the competitors are relatively
ineffective, then they do not fully constrain the price that a monopolist firm can set. This
tends not to be a factor in terms of retail broadband in Europe, however, because
effective regulation at wholesale level results in reasonable competition at retail level in
17 To an economist, the cost of capital employed to produce the good or service is also part of this cost.
18 We refer here to pricing power as in HOTELLING (1929). It is largely a function of consumer
willingness to pay, and not necessarily indicative of a market failure.14 The economic impact of Internet traffic growth on network operators
most European Member States. In the United States, by contrast, consumers typically
have fewer options, particularly for service at higher speeds.
Consumers buy a service if the benefit that they derive is worth more to them than the
price. The difference between their valuation and the price is their consumer surplus.
The higher the price, the less their surplus. If the price were increased, then consumers
purchase less of the service. If the price were increased so much that the consumer
surplus goes negative, then consumers are not motivated to purchase the service at all.
This response of consumer demand to price is termed the price elasticity of demand.
The linkage between price and cost for broadband access is complicated. Network
operators tend to have somewhat different cost structures. Consumers may value
network connectivity somewhat differently, and thus one consumer may have different
willingness to pay than another. The consumer’s choice of provider is of course
influenced by the network operator’s price, but not by its underlying costs.
Nonetheless, if one wants to understand prices, it is important to understand the
underlying costs and cost drivers. First, the underlying marginal cost to which a network
operator is subject tends to set a floor for that operator’s price. Second, to the extent
that the market is competitive, the prices charged by aggressive competitors will tend to
limit the prices that can be charged by other network operators.
3.2 Fixed costs versus usage-based costs
Key Findings
Our concern in this study is with the impact of increased Internet traffic on network
costs. Not all network costs are relevant to this question. Our focus in this study is on
usage-based costs and cost drivers, not on fixed costs.
Data from the BNetzA, the German National Regulatory Authority (NRA), shed light on
the relative magnitude of these costs.
Transport in the IP backbone network contributes just € 0.72 of monthly cost, or
2.8% of the monthly total, and this percentage is rapidly declining over time.
Transport in the concentration network contributes just € 2.00 to monthly costs, or
7.7% of the monthly total.
The combined usage-based costs for a broadband interface were found to represent
just 10.3% of the total cost.
These usage-dependent costs are dwarfed by the cost of the unbundled copper local
loop and by other costs that may be dependent on the number of subscribers, but that
are largely or fully independent of the level of usage per subscriber.The economic impact of Internet traffic growth on network operators 15
In this study, we are concerned with the impact of increased Internet traffic on network
costs. Not all network costs are relevant to this question.
There is a long European and global tradition of regulatory cost modelling. It is routine
to distinguish between fixed costs and usage-based costs. Clearly, it is the usage-
based costs that are relevant here, since those are the costs that depend on the level of
Internet traffic.
For example, a large fraction of the cost of the fixed network is associated with the last
mile. The physical line is typically ordered once (or upgraded at rare intervals), whether
it is copper twisted pair, cable, or fibre, and then maintained for long periods of time as
the electronics that drive the line are upgraded over time. The cost of civil works
(especially digging) represents a large fraction of the cost of the line. More significantly,
however, it is the end user who chooses the speed of the broadband connection; in
order to maintain a rational system of incentives, it should therefore be the end user
who bears the cost. These costs are therefore not relevant to the discussion of the
impact of increased traffic on the costs of network operators.
Many operational costs are a function of the number of customers, and largely
independent of the level of traffic. For instance, costs associated with customer
acquisition, customer care, billing, and bad debt would appear to have little or nothing to
do with the volume of Internet traffic over the broadband connection.
For a fixed broadband service, it turns out that the usage-based costs represent a tiny
fraction of the total. Data from the BNetzA, the German National Regulatory Authority
19
(NRA), shed light on the magnitude of these costs. In a 2013 proceeding, the BNetzA
found that:
● Transport in the IP backbone network contributes just € 0.72 of monthly cost, or
2.8% of the monthly total (see Figure 3).
● Transport in the concentration network contributes just € 2.00 to monthly costs,
or 7.7% of the monthly total (again, see Figure 3).
● The combined usage-based costs for a broadband interface thus correspond to
just 10.3% of the total cost.
19 BNETZA (2013), Beschluss in dem Verwaltungsverfahren BK 3c-13/002/E19.02.2013, 26 June 2013.16 The economic impact of Internet traffic growth on network operators
Figure 2: Monthly cost elements of a bundled DSL broadband/voice service (2013)
20
Source: Data from German BNetzA (2013), page 80; WIK calculations
In our previous 2011 study, these figures were 7% and 6%, respectively, based on a
21
2009 BNetzA proceeding. Numerous European NRAs confirmed that those
percentages were consistent with their experience at the time. Due to the subsequent,
continuing decline in Internet transit prices (see Section 3.4.2), the percentage
contribution of transport over the IP backbone to total cost declined briskly from 7% to
2.8% in the four years from 2009 to 2013.
These usage-dependent costs are dwarfed by the fixed and sunk cost of the unbundled
copper local loop and by other costs that may be dependent on the number of
subscribers, but that are largely or fully independent of the level of usage per
subscriber.
20 Ibid.
21 BNETZA (2009): Beschluss in dem Verwaltungsverfahren BK 3c-09-005/E20.01.09, 31 March 2011.The economic impact of Internet traffic growth on network operators 17
3.3 Moore’s Law
Key Findings
Unit costs for relevant network equipment tend to decline over time. This can be viewed
as an example of Moore’s Law.
In a famous 1965 paper, Gordon Moore recognised that the number of components that
could cost-effectively be implemented with a single integrated circuit was doubling per
22
unit time. Today, it is widely understood that, with present technology, the number of
23
components per integrated circuit approximately double every two years. This
doubling every two years continues to the present day (see Figure 4).
We are all familiar with the effects of Moore’s Law. If we buy a personal computer
today, it will cost no more than a personal computer that we could have bought two
years ago, but it will be twice as fast, will have twice as much memory, and will likely
24
have a hard disk drive (or semiconductor equivalent) that is twice as large.
22 Gordon Moore, “Cramming more components onto integrated circuits”, Electronics, Volume 38,
Number 8, April 19, 1965. The original paper suggested a doubling per year, but subsequent work
found the rate to be a doubling every eighteen to twenty-four months.
23 Fundamental physical limits will eventually put a limit to trend, but it is likely to continue for a few more
cycles at least.
24 Disk storage is also benefiting from rapid improvements in technology.18 The economic impact of Internet traffic growth on network operators
Figure 3: Microprocessor Transistor Counts 1971-2011 & Moore's Law
25
Source: Wikipedia
Improvements in the cost-effectiveness of network equipment due to technological
improvement can compensate for, or even exceed, the rate of increase in Internet
traffic. These Moore’s Law improvements relate to routers, for example, but similar
improvements are visible in opto-electronic gear that drives fibre optics – the number of
wavelengths that can be distinguished over a single fibre is also steadily increasing over
time. Rapid technology-driven improvements in price/performance are also visible in
rotating magnetic disk storage. There are also dramatic improvements in the efficiency
26
with which data can be transmitted over the air.
25 Moore's law. (2011, July 23). In Wikipedia, The Free Encyclopedia. Retrieved 06:56, July 24, 2011,
from http://en.wikipedia.org/w/index.php?title=Moore%27s_law&oldid=440998745.
Figure by Wgsimon.
26 This assumes that national spectrum management authorities have made sufficient spectrum
available. See RYAN (2005).The economic impact of Internet traffic growth on network operators 19
3.4 Trends in relevant unit costs
Key Findings
The observed Moore’s Law declines in unit costs for relevant network equipment are
substantial. For high capacity routers, we estimate a CAGR of -26.4%; for long haul
DWDM, a CAGR of -18.4% over the period 2006-2013 (see Section 3.4.1).
The decline in the unit price of international Internet transit – a highly competitive
market in many European capitals – is a direct result of the decline in the unit prices
that network operators pay for underlying components, including high capacity routers,
optoelectronics, undersea cable capacity and long distance circuits over land (see
Section 3.4.2).
These declines in unit costs benefit the backhaul networks of both fixed and mobile
network operators.
The cost drivers of the mobile network airlink are also benefitting from technological
improvements; however, the last mile of fixed networks does not benefit in the same
way.
The cost of a fixed copper line has been relatively stable, but the amount of data that
can be carried at a reasonable cost is increasing. These last mile fixed networks costs
are only marginally relevant to the question of the impact of increasing traffic on costs,
however, since the cost of the line is largely independent of the traffic carried.
This section considers the evolution over time of the cost drivers for the fixed and
mobile Internet network core, the fixed last mile, and the mobile air interface.
3.4.1 Unit costs for equipment in the network core
Unit costs in the core of the Internet have been rapidly declining over the past ten years
due to Moore's Law improvements in the price/performance of high capacity routers and
DWDM optoelectronic equipment.
The high capacity transit that is sold to large enterprises and to large ISPs is to a
significant degree a commodity product in a highly competitive marketplace;
consequently, it is possible to reliably infer cost trends from price trends. There is ample
evidence of a steady decline in the price / Mbps of Internet transit (see Section 3.7). We
would therefore reasonably expect to find a drop in unit costs for the elements that the
IP transit providers use to provide the service, and this is indeed the case.20 The economic impact of Internet traffic growth on network operators
This trend can be assumed to reflect the aggregate behaviour of all of the usage-
sensitive cost drivers of the transit service, including (1) high capacity routers,
(2) optoelectronics, (3) undersea cable capacity, and (4) circuits over land. Labour costs
obviously play a role in these prices, but they are not particularly relevant here, since
they can be assumed to be driven by the number of customers rather than by the
volume of traffic that each customer uses – they are for the most part not usage-
dependent.
27
Detailed analysis bears these intuitions out. Market research data show that the price
per Mbps of capacity in high end service provider routers and in long haul DWDM
equipment continue to fall at a brisk pace. Figure 5 depicts the falling unit cost trend
(expressed in USD per Mbps of capacity shipped) for high capacity routers, while Figure
6 does the same for long haul DWDM equipment. We derived these estimates by taking
the historical or projected total worldwide value of shipments and dividing it by the total
port capacity shipped worldwide, in Mbps.
Figure 4: Price per Mbps (USD) and shipment quantities for high end routers
28
Source: Dell’Oro data, WIK calculations
27 Dell’Oro is a respected firm that routinely conducts detailed market research on the communications
industry. Our analysis of both historical and future trends are based on Dell’Oro data.
28 Dell’Oro Group, Routers Report: Five Year Forecast: 2011 – 2015, Vol. 15, No. 2 R2A, Customer
Segments: Enterprise Routers, Service Provider Routers, published July 2011.The economic impact of Internet traffic growth on network operators 21
Figure 5: Price per Mbps (USD) and shipment quantities for long haul DWDM
18.000.000.000 $7,00
16.000.000.000 $6,00
14.000.000.000
$5,00
12.000.000.000
10.000.000.000 $4,00
8.000.000.000 $3,00
6.000.000.000
$2,00
4.000.000.000
2.000.000.000 $1,00
0 $-
2017
2004
2005
2006
2007
2008
2009
2010
2011
2012
2013
2014
2015
2016
2018
Long haul DWDM capacity shipped (Mbps) Price ($) per Mbps capacity for long haul DWDM
29
Source: Dell’Oro data, WIK calculations
Note that the volume trend and the unit price trend are opposite in direction; however,
they are not equal in magnitude. The historical CAGRs reflecting the decline in the unit
price of high end routers and long haul DWDM over the period 2006-2013 are -26.4%
and -18.4%, respectively. The CAGR of high end router shipments (not all of which go
to network operators) over the same period is 47.6%, while that of long haul DWDM
shipments is 37.1%. The total revenue of equipment manufacturers (not all of which
derives from equipment manufacturers) increases over time, but not nearly as much as
the growth in capacity alone would suggest.
3.4.2 Internet transit costs
In Section 3.2, we found that the cost of transport in the Internet Protocol (IP) backbone
network was one of the two main components of usage-based cost, together with the
cost of transport in the concentration network (i.e. to bring traffic to the point where it
30
can be said to enter the IP backbone).
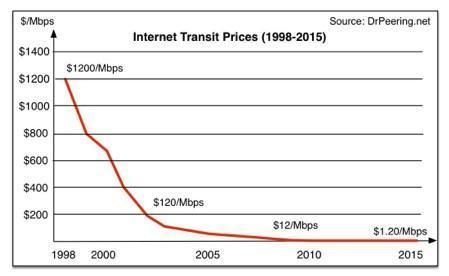
Numerous sources find rapidly declining unit prices for Internet transit (see, for example,
Figure 7, which shows a factor of ten decline every four or five years). This rough
29 Dell’Oro Group, Optical Transport Report: Five Year Forecast: 2011 – 2015, Vol. 11, No. 2 O2A,
Technology Segments: WDM, Multiservice Multiplexer, Optical Switch, Optical Packet, published July
2011.
30 The cost should be no higher, irrespective of whether the network operator purchases IP transit from a
third party or self-supplies. Unless the network operator has made an irrational build-versus-buy
decision, the cost to self-supply should not be greater than the price to purchase from a third party.22 The economic impact of Internet traffic growth on network operators
estimate by a U.S.-based expert implies an even faster decline than we computed in our
31
2011 study, which saw the unit price of Western European 10 Gigabit Ethernet transit
service declining with a CAGR of -27%, which would imply a factor of ten reduction every
seven years.
Figure 6: Estimated IP transit prices in USD / Mbps (1998 - 2015)
32
Source: William B. Norton (Dr. Peering)
For many years, Telegeography has been providing detailed historical data of IP transit
volumes, prices, and revenues by country and region. They report that “[t]he IP transit
market generated $2.1 billion in revenues in 2013. Sales of circuits connecting
customers to Internet hubs contributed an additional $2.5 billion, for a total of $4.6
33
billion in revenues.”
Telegeography’s forecast of worldwide transit revenues going forward depends
somewhat on the degree to which traffic shifts from transit to peering, which has been
ongoing over the past few years. If present trends continue, they predict “that IP transit-
related revenues will fall from $4.6 billion in 2013 to $4.1 billion in 2020. If the ratios of
31 J. Scott Marcus and Alessandro Monti (2011), “Network Operators and Content Providers: Who Bears
the Cost?”, 13 September 2011, available at: http://ssrn.com/abstract=1926768.
32 William B. Norton („Dr. Peering“) (2014), “Internet Transit Tricks”, 30 April 2014, at:
http://drpeering.net/AskDrPeering/blog/articles/Ask_DrPeering/Entries/2014/4/30_Internet_Transit_Tri
cks.html.
33 Telegeography (2014), IP Transit Revenues, Volumes Dependent on Peering Trends, 8 July 2014, at:
http://www.telegeography.com/press/marketing-emails/2014/07/08/ip-transit-revenues-volumes-
dependent-on-peering-trends/index.html.The economic impact of Internet traffic growth on network operators 23
traffic routed via transit and peering were to stabilize at current levels, IP transit
34
revenues would increase to $5.5 billion by 2020.”
35
In a 2011 study, we found that the total cost to convey all European Internet traffic by
third party transit was fairly stable (and possibly declining) from year to year, and
moreover was surprisingly small. Current Telegeography data tend to continue to
support both claims (see Figure 8). Total global transit revenues are indeed small, and
36
appear to declining over time, despite the growth in Internet traffic.
Figure 7: Global IP transit revenues (2013-2020)
37
Source: Telegeography (2014)
A related trend worth noting is that an increasing fraction of Internet traffic is remaining
local due to the use of caching and Content Delivery Networks (CDNs), especially for
video content. This traffic never requires IP transit at all. Cisco estimates that “[i]n 2013,
total metro traffic was 2.0 times higher than long-haul traffic, and by 2018, metro traffic
38
will be 2.6 times higher than long-haul.” This trend also tends to reduce the total cost
of IP backbone transit.
34 Ibid.
35 J. Scott Marcus and Alessandro Monti (2011), “Network Operators and Content Providers: Who Bears
the Cost?”, 13 September 2011, available at: http://ssrn.com/abstract=1926768.
36 Telegeography (2014), IP Transit Forecast Service, 8 July 2014, at:
http://www.telegeography.com/research-services/ip-transit-forecast-service/. The network operators
obviously make additional expenditures to self-supply transit, but unless the ratio of self-supply to third
party supply were to drastically change, the downward trend in total expenditure should be similar.
37 Ibid.
38 Cisco (2014), The Zettabyte Era: Trends and Analysis, 10 June 2014.You can also read


