CFA Institute Research Challenge Bahrain Polytechnic - CFA Society Bahrain
←
→
Page content transcription
If your browser does not render page correctly, please read the page content below
CFA Institute Research Challenge
 Hosted by
 CFA Society Bahrain
 Bahrain Polytechnic
Bahrain Polytechnic Student Research

Company: Aluminium Bahrain (Alba) Sector: Manufacturing Sector Recommendation: BUY
Exchange: Bahrain Bourse/London Stock Ex. Industry: Aluminium Industry Current Price (16th Jan 2018): BHD 0.620
Ticket Symbol: ALBH Valuation Date: 16th January 2018 Target Price: BHD 1.072 (+72.85%)

 SUMMARY
 Company profile Aluminium Bahrain (ALBA), established in 1968, was the first aluminium smelter in the
 16th January 2018 Middle East with a total production of 981,016 metric tonnes as of 2017. The company
 Market Capitalization BHD 877,399,820 engages in manufacturing aluminium and aluminium related products.
 Market Share Price BHD 0.620
 1.200 9
 Outstanding Shares 1,415,161,000
 52-Week High-Low 0.620 – 0.266 7
 1.000
 2-Year Average Beta 0.97
 Average 3m Volume 223,188 5
 0.800

 3
 Key Financials (Year ended 2017)
 0.600
 Dividend Yield 6.9%
 1
 EPS 24 fils
 0.400
 P/E Ratio 10.16 -1
 EV/EBITDA 7.58
 0.200
 ROA 2% -3
 Net Profit Margin 4%
 0.000 -5
 Debt Ratio 0.42
 Jan 17, 2017

 May 02, 2017
 May 16, 2017

 Aug 08, 2017
 Apr 05, 2017
 Apr 18, 2017
 Feb 01, 2017
 Feb 14, 2017
 Feb 27, 2017
 Mar 12, 2017
 Mar 23, 2017

 Jan 16, 2019
 Aug 21, 2017
 Sep 11, 2017

 Dec 04, 2017
 Dec 19, 2017
 Jan 07, 2018
 Jul 02, 2017
 Jul 13, 2017
 Jul 26, 2017

 Oct 04, 2017
 Oct 17, 2017
 Oct 30, 2017
 Jun 01, 2017
 Jun 14, 2017

 Valuation Summary Nov 14, 2017
 Valuation Approach Weight Price
 DCF 50% 1.496
 Change % Price
 Multiples 40% 0.668
 Ben Graham 10% 0.643 The one year forward blended 50:40:10 target price of BHD 1.072, upside of 72.85% from
 12-Month Target Price BHD 1.072 the current market price of 620 fils on 16th January 2018, is based on the following key
 Target Price Upside 72.85% factors;

 • Alba will become the largest single-site aluminium smelter in the world following the
 Source: Team Estimates & Annual Report operation of Line 6 expansion project. This will elevate their status and make them a
 prominent competitor in the aluminium industry.
 Alba Historical Stock Price since IPO
 Source: Bahrain Bourse • With the expectation of approximately 5% YoY growth for the next 5 years in demand
1.000 and decreasing supply by 2.2% of aluminium, Alba will benefit from higher aluminium
 prices. The forecasted market deficit will be driven by reduction in Chinese production
0.900
 of aluminium for environmental purposes.
0.800
 • The imposition of trade barriers on China’s aluminium will be giving Alba competitive
0.700 advantage due to FTA agreement with USA.
0.600
 • Despite rising price of alumina, green petroleum coke, and carbon, the expected rise
0.500 in aluminium prices will increase Alba’s revenue on a yearly basis. Considering Project
0.400 Titan, costs are expected to remain low.
0.300 • Alba dominates a monopolistic position in Bahrain’s market, being the only producer
0.200 of primary aluminium locally. The high barriers of entry shield them from competition
0.100 locally. Also, 41% of their products are secured by the downstream industries in
 Bahrain.
0.000
 • Alba pays yearly dividends, except for 2018 which will be zero given self-financing of
 11/20/2013

 07/19/2016
 12/01/2010
 07/05/2011
 02/13/2012
 09/10/2012
 04/16/2013

 06/19/2014
 01/29/2015
 08/27/2015
 03/31/2016

 11/14/2016
 06/13/2017

 Line 6 loan. However, dividends will be distributed thereafter given the rise in
 production, net income and cashflows due to operation of Line 6.
COMPANY ANALYSIS
 Table 1 Alba’s Facilities
 Source: Alba Website

 BUSINESS DESCRIPTION
 Facility Type # Facility Details
Main Potlines 5 Potline 1-2-3-4-5
Cast Houses
Carbon Plants
 2
 3
 971,420 mtpa
 - COMPANY
Fume Treatment
 11 -
 Aluminium Bahrain B.S.C., widely known as Alba, is the effort of the output of the Kingdom
Plants
 of Bahrain’s government to diversify production, reducing the reliance on oil and gas
 PS 1 (282MW)
 PS 2 (168MW) activities. Through the continuous advancement in its technological innovation and full
Power Plant 4
 PS 3 (860MW) involvement in enforcing CSR, training, safety, health and environment guidelines, Alba
 PS 4 (939MW)
Petroleum Coke has managed to be one of the largest aluminium smelters globally (Table 1). Alba was
 1 550,000 mt per day
Calciner established in 1968 and officially launched its operations in May 1971, becoming the first
Seawater
Desalination Plant
 1 41,000 m3 per day aluminium smelter in the Middle East with a total production of 120,000 tons per annum.
 13 hectares 15,000 The company became public on 23 November, 2010 and launched its IPO at BD0.900 per
Green Oasis -
 trees/shrubs ordinary shares and USD11.97 per GDR (1 GDR = 5 ordinary shares) which are traded
 Fruit/vegetable garden
 Artificial lake through the Bahrain Bourse and London Stock Exchange under the symbol “ALBH”. 75%
 of the total trading size were ordinary shares and Global Deposit Receipts (GDRs) through
 institutional investors, while 25% were ordinary shares available in retail offering. The
 Figure 1 Sales by product (2016) Company also has a subsidiary incorporated in the United States of America. The market
 Source: Alba's Website
 capitalization as of 16th January 2018 is BHD 877,399,820. Today, Alba produces over
 14% 971,000 metric tons per annum (mtpa) promising the highest quality of aluminium. As of
 2016, Bahrain is ranked as the 9th largest producer of aluminium globally and 2nd largest
 30%
 aluminium smelter in the MENA region1. (Appendix 15)
 11%
 PRODUCT MIX/PRODUCT RANGE
 Alba not only produces aluminium products, but other by-products as well. Primary
 11%
 products include, standard ingots, rolling slabs, foundry alloy ingots, extrusion billets, t-
 ingots and liquid metal (Figure 1). Other products include, anodes, power, water, calcined
 34% coke. Alba insures 99.86% purity of high-quality aluminium in all products (Appendix 17).
 The value-added sales accounted for 56% in 2016, a 12.5% drop from last year.
 Liquid Metal Extrusion Billet
 Furthermore, Alba imports raw material (alumina) from BHP Billiton, Alcoa and Hydro.
 Standard Ingots Rolling Slabs
 Foundry Alloys CONSUMER MIX/ CONSUMER SEGMENT
 The company’s main consumer sectors include; automotive, consumer products,
 commercial, residential, transport, and packaging industries. Alba’s main consumer base
 Figure 2 Sales Revenue by Geographic Location are regional clients and the typical length of the company’s commercial relationships with
 Source: Alba Annual Report 2016
 its top five consumers is more than 28 years (Figure 2). Alba consistently work in
 collaboration with their customers through technical support services to update their
 10% products and boost productivity.
 COMPANY STRATEGIES
 18% 41% Adherence to safety and environment management
 Alba prioritizes safety in the working environment by conducting regular upgrades to its
 safety system through the company’s Risk Assessment Committee. Additionally, all
 14% employees are trained in health and safety by OHSAS 18001 (Occupational Health and
 Safety) certified personnel. Alba is recognizable for being the first aluminium smelter in
 17% the world to have not a single Lost Time Injury (LTI) in more than 9,200,000 work hours2.
 Since 1990, the company has invested over USD589million in environmental conservation
 in the form of fume treatment plants focusing on waste management and reduction of
 Domestic Asia MENA Europe Americas harmful gas emissions.
 Investment in training and development
 Alba has continued to provide training for over 40 years in order to develop the skills of
 Figure 3 Porter's 5 Forces its employees up to international standards. Alba’s commitment to human asset
 Appendix 11 development led to opening a Training Centre which consists of workshops and smart
 Degree of classrooms. The Centre offers training in leadership, automotive, mechanical, electrical,
 Competition
 4 instrumentation and hydraulics and pneumatics.
 3 Customer satisfaction
Bargaining 2 Threat of Alba commits to maintaining strong relationships with its customers to build long-term
 Power of 1 New clientele. As a continuous effort to increase efficiency, Alba offers competitively priced
Customers Entrants products yet retaining the highest quality of its aluminium with 99.86% metal purity.
 0
 Technological Development
 Constant upgrades in the technology used in production is implemented to further
 Bargaining increase production and improve efficiency. Alba’s recent upgrade from “EGA DX+” to
 Threat of
 Power of
 Suppliers
 Substitutes “EGA DX+ Ultra” for Line 6 project is expected to increase the company’s production by
 540,000 mtpa. This technology improves energy efficiency allowing Alba to increase
 output by consuming less energy, thus, reducing the company’s production costs.
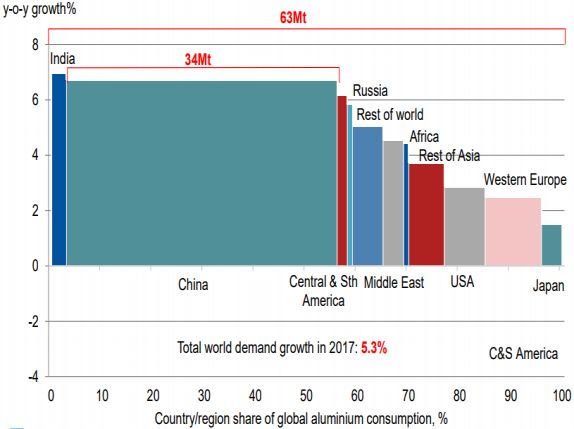
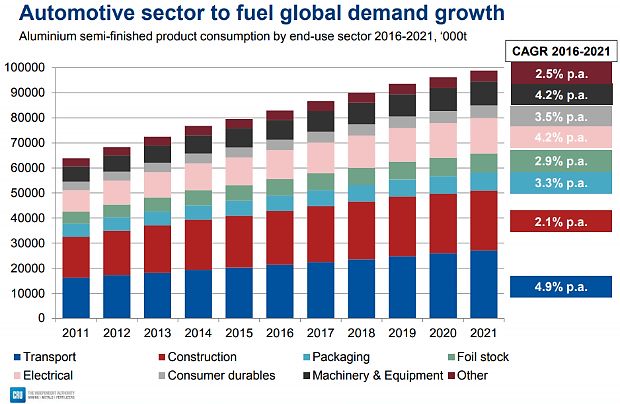
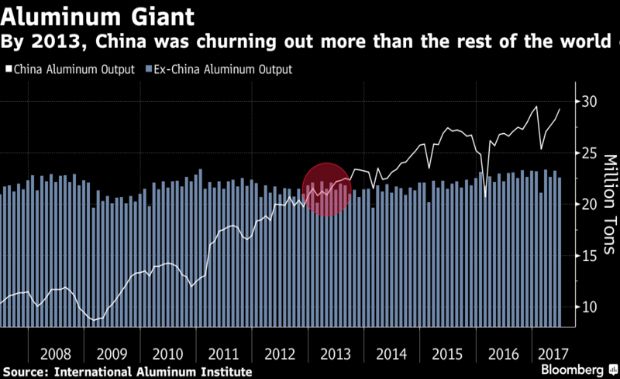
FUTURE DEVELOPMENT
 Table 2 Executive Managers Alba’s last expansion was completed in 2005 when the company introduced Line 5 to the
 Source: Alba's Website main site, increasing production by 307,000mtpa (total output=827,000 mtpa). Today,
 Name Current Position Alba’s line 6 is under development increasing production to 1,540,000mtpa (Appendix 16).
 Tim Murray Chief Executive Officer
 Ali Al Baqali Chief Supply Chain Officer
 Furthermore, Alba initiated plans of expanding its plant and work on developments to
 Khalid A.Latif Chief Marketing Officer further strengthen its operations within the nation by continuously supporting the non-
 Amin Sultan Chief Power Officer oil industry and Bahrain’s community to align with the Kingdom’s 2030 Vision.
 Waleed Tamimi Chief Admin Officer
 Hassan Noor Acting Chief Operations Officer CORPORATE GOVERNANCE
 CORPORATE STRUCTURE
 Figure 4 Alba's Shareholders Holding Board of Directors & Management Team
 Source: Alba’s Website The company has 10 members in the Board of Directors with diversified backgrounds and
 experience, 1 out 10 members of the board are non-independent, executives (Appendix
 0.74% 6.79%
 2.47% 13). Furthermore, the board works alongside with 3 sub-committees: The Board Audit
 Committee (BAC), the Board Executive Committee (BEC), and the Board Nomination and
 Remuneration Committee (BRC). The determination of Alba’s business operations
 20.60% direction and its long-run strategy is the main responsibility of the BOD. The management
 team has 55 members inclusive of the 6 executive managers (Table 2 & Appendix 14). The
 69.40% primary responsibility of executive managers in Alba is managing the daily operations and
 enacting strategies and polices set by Board of Directors. They receive compensation in
 the form of salaries, bonuses, gratuities, perquisites, pensions.
 Bahrain Mumtalakat Holding Co. BSC Shareholders
 Saudi Basic Industries Corp Alba’s ownership is majorly held by Mumtalakat Holding Company (a sovereign wealth
 Norges Bank Investment Management fund owned by Bahraini government) with 69.40% share, 20.60% is owned by Sabic
 Aluminium Bahrain BSC
 Public
 Industrial Investment Company (Saudi chemical manufacturing company), and remaining
 10% of ownership is by the public, out of which 0.74% is held by Alba itself (Figure 4).
 Employees
 Figure 5 Aluminium Output in China vs. Rest of World
 Source: International Aluminium Institute The company provides a healthy environment for employees and is the first company in
 Bahrain to create a Union in 1975. Moreover, Alba has committed to Bahrainisation and is
 the largest employer in the Kingdom. As of 2017, it has a total of 2,681, of which 84% are
 Bahraini nationals.
 CODE OF CONDUCT
 Alba’s corporate governance structure is completely aligned with The Kingdom’s
 Commercial Companies Law and Corporate Governance Code issued by Ministry of
 Industry, Commerce and Tourism. Furthermore, Alba complies with the International Best
 Practices and Corporate Governance Module issued by The Central Bank of Bahrain. The
 company’s code of conduct outlines a set of rules that governs five main subjects:
 Valuing People: fair treatment, respect, non-harassment policies, providing equal opportunity.
 Safety, Health and Environment: commitment to environment and strict safety rules. Good
 Citizenship and Social Responsibility: key attributes towards the community and political
 relations with the government. Ethical Business: eliminate unlawful acts such as corruption,
 Figure 6 Refined Aluminium Demand and Supply bribery, conflicts of interest and frauds. Information and Confidentiality: protecting confidential
 Source: Wood Mackenzie, RBC Capital Markets estimates information and methods of representing Alba.
120000 20% SOCIAL RESPONSIBILITY
 Alba is determined to create a positive impact and improvement on the society and
 preserving the environment by contributing and initiating in wide array of activities. In
100000
 458 15% sports field, Alba is the leading entity in supporting special needs athletes. Furthermore,
 1507
 716
 Alba also participates in Gulf Air Formula One Grand Prix. Alba dedicated a community
 80000 1454 services team that supports unprivileged locals financially by raising funds and creating
 1719
 10%
 charity events. As for healthier environment, Alba has contributed alongside the
 60000
 government in restoration of Malkiya beach as well as providing sponsorship for
 environmental entities and numerous events such as The International Garden show. Alba
 5%
 has spent USD$589 million for environmental conservation.
 INDUSTRY ANALYSIS
 40000

 0%
 20000 INDUSTRY OVERVIEW
 • Aluminium consumption increased 5% YoY in 2016; summing up to 59.6 million
 -376
 0
 -5% metric tons. Demand forecasted to increase 4-5% for 2018 and 5-6% for the next 5
 2009 2010 2011 2012 2013 2014 years, reaching 65.9 million metric ton in 2020.
 • Rising demand from transportation, electrical and machinery sectors.
-20000 -10%
 • Aluminium supply growth to 2.2% YoY due to Chinese production curtailment.
 Supply Demand • Increasing trade barriers against China could diminish world production supply.
 Surplus/Deficit % Change in Supply • China aims to reduce their reported production by 30% to lower pollution levels and
 aluminium oversupply in the market.
 % Change in Demand
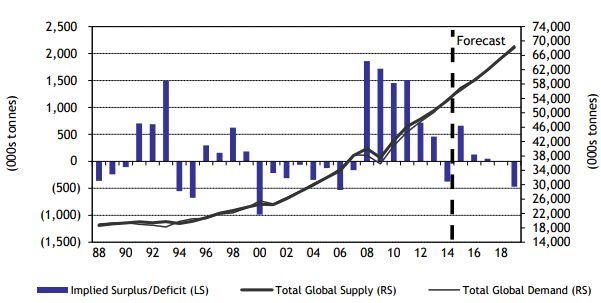
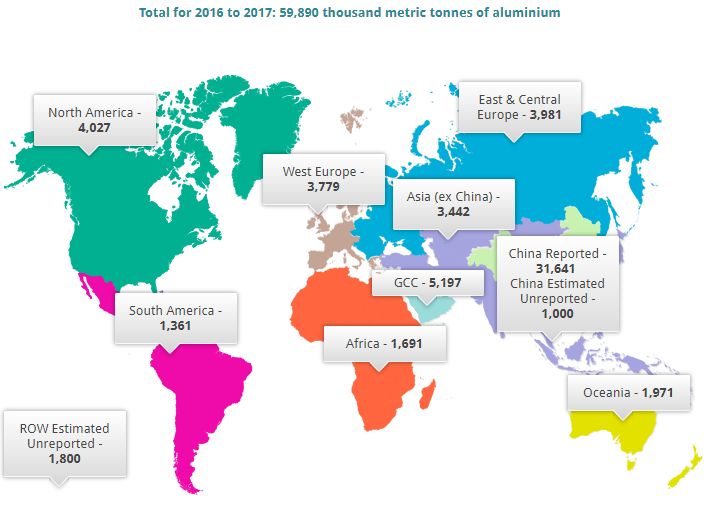
• Increasing raw material costs is pressuring the cost of production but marginal
 Figure 7 Global Aluminium Supply and Demand revenue exceeds marginal cost.
 Source: Bloomberg, RBC Capital Markets estimates GLOBAL ALUMINIUM INDUSTRY
 Direction of Market Balance: Is it a Deficit or Surplus?
 Alba operates in the aluminium industry that has faced challenging pressures on
 companies’ profits and valuations. The main reason behind such challenges is China, who
 started oversupplying aluminium mainly from 2013, more than the world producers,
 distorting aluminium prices and market balance (Figure 5). It could be observed from
 Figure 6; aluminium market recorded a surplus throughout the years except for the year
 2014 (-376,000 tons) and 2016 (-913,000 tons)3. The year 2016, market deficit exceeded
 the 2014 deficit, which could be attributed to China’s unexpected trimming of production
 (Figure 7). A relative balance of 344,000 tons and global deficit of 538,000 tons for 2017
 and 2018 is forecasted, a conclusion drawn based on the following:
 Assumptions: China’s output curtailment reaches 4.5 million tons in 2018.
 Curbing of China’s output for environmental purposes needs to be 600,000 tons in 2018
Figure 8 Global Primary Demand (YoY Growth % & mt) despite expansionary fiscal policies that will drive growth in short-run.
 Source: CRU Fall in growth of Chinese consumption by 4.5% in 2018
 Rise in China’s net exports to 800,000 tonnes in 2018 from 500,000 tonnes in 2017.
 Risks: Pump of new projects mainly by China’s State-Owned-enterprises
 Fluctuations in aluminium prices following response to China supply policy
 Rise in prices of alumina, carbon and power due to cost-push inflation
 SUPPLY & DEMAND DRIVERS OF ALUMINIUM
 Demand Trend
 In 2016, the consumption summed up to 59.6 million metric tons that is approximately
 5% YoY higher4 that than the world’s real GDP growth rate of 3.2% for 2016. The demand
 rate rises to 5.3% in 2017. China owned global demand share of 14% in 2000; exceeding
 50% in 20175. United States, Germany, India and Japan are considered chief consumers of
 aluminium after China.
 Demand Outlook
 Aluminium is the 2nd most consumed metal, headed by steel, due to its intrinsic
 characteristics such as 100% recyclability, durability, versatility, conductivity, lightweight
 and strength without comprising safety and performance. Steel is being replaced by
 Figure 9 Demand of Sectors for Aluminium aluminium as per the EU emissions scheme and the Corporate Average Fuel Economy
 Source: CRU which supports steel substitution as it is considered more environmentally friendly since
 it is lighter which enhances fuel efficiency and reduces Co2 discharges (Appendix 17).
 Aluminium consumption is expected to reach 65.9 million metric ton in 2020 6 while
 demand is expected to further grow by 5-6% in the next 5-10 years (Figure 8)7. These
 demand growth rate exceed the world’s forecasted real GDP growth rate of 3.6%, 3.7%
 and 3.8% in 2017, 2018 and 2022 respectively8. The increase in demand growth is due
 transportation, electrical and machinery sectors (Figure 9). China is anticipated to adopt
 expansionary fiscal policies to achieve their target of multiplying their real GDP from 2010-
 to-2020 as it was expected to ease from 6.3% to 5.7% YoY; thus, driving demand for
 aluminium in real estate and transportation sector; while US has major infrastructure plans
 worth USD 1 trillion9. Regions, such as India, that are unable to produce aluminium locally
 due to high costs, rely on imports providing Alba with exporting opportunities especially
 since India would require large supply quantities which can be granted by the Line 6
 expansion project. The reason being that India is viewed to boost aluminium consumption
 which increases from 3.3 million mt (2015/16) to 5.5 million from 2020 to 2021 as a result
 of government initiatives such as “Smart Cities”, “Make in India”, rural electrification,
 “Housing for All” and freight corridors10.
 Table 3 Top Aluminium Producers (August 2017 in Supply Trend
 million mt)
 The top individual aluminium producer is a Russian Company, UC Rusal, with total output
 Source: The Balance
 Producer Country Output amounting to 4,173,000 mt, followed by Alcoa in USA with 3,742,000 mt 11. However,
 UC Rusal Russia 4.173 China altogether is ranked the highest regional producer with a global aluminium output
 Alcoa Inc. USA 3.742
 Aluminium Corp of China China 3.502
 share exceeding 50%. The list of top producers as of August 2017 are listed in Table 312.
 China Power Investment Corp China 2.693 The 2nd highest regional aluminium producer is the GCC with a total output reaching
 Rio Tinto Alcan Inc Canada 2.174 5,197,000 mtpa, of which Alba contributes 17.4%; while Alba represents 1.64% of global
 Norsk Hydro ASA Norway 1.985
 China Hongqia Group Ltd China 1.821 supply (Figure 10)13. It is forecasted that the share of aluminium production will decrease
 Shandong Weiqiao Aluminium
 China 1.715 and there will be a slowdown in supply growth to 2.2%. This slowdown is mostly due to;
 & Power Co
 Shandong Xinfa Aluminium &
 information collected regarding trade barriers and geopolitical tensions, China revamping
 Electricity Group Ltd.
 China 1.630
 supply policies and the cost-push inflation in raw materials14.
 Dubai Aluminium Co. UAE 1.420 Trade barriers and geopolitical tensions
 The governments in Europe, India and US are enacting protective measures against
 exports from China by levying import duties or provision of subsidies to producers’
locally 15 . This is due to low-cost input and artificially cheap loans given to Chinese
 Figure 10 Aluminium Production 2016-2017 producers, hindering the world’s aluminium capacity. India increased import duties for
 Source: The World Aluminium primary aluminium and aluminium products to 7.5% and 10% respectively 16 . US
 preliminary duties on all Chinese aluminium foil products are around 96.81% - 162.24%.
 Alba will have competitive advantage over China given their Free-Trade Agreement (FTA).
 China’s supply-revamp policies
 From April 2017 onwards, the shutting-down of unlicensed smelting capacity, could result
 in loss of 4 million tpa. Secondly, the introduction of environmental tax to reduce pollution
 will impact production significantly. China plans to reduce their reported production by
 30% to lower pollution levels and aluminium oversupply in the market. Thus, reported
 production dropped by 2.3% within a month17.
 Cost-push inflation in raw material costs
 Cost of bauxite, alumina (extracted from bauxite), and anode baking capacities are
 pressuring raw material costs. China plans on trimming 30% of alumina production and
 30% of anode baking and calcining capacities. This will reduce Chinese exports to
 aluminium smelters and will heighten costs for the whole world, including Middle East.
 These reforms will increase the aluminum marginal cost of production (exclusive of
Figure 11 Alba’s Marginal Profit & Total Cost Estimate overheads, labor and management costs) over the years (Figure 11). Considering the main
 Source: Team Estimates components of production without the benefit of secured contracts, Alba still produces a
 positive margin due to rising aluminium prices.
5000
 LONDON METAL EXCHANGE (LME): ALUMINIUM PRICES
4000
 Aluminium prices dropped from 2013-2016, hitting rock bottom in 2015 with $1423.5 per
3000 1479.6 1466.3 ton. Aluminium became the 2nd best performing base metal in 2017/Q1 compared to
2000 488.4 535.7 being 2nd worst in 2016. If the bullish scenario continues as a result of expected global
 aluminium deficit in 2018, the LME aluminium prices will be as follows in 2018:
1000 1968 2002 Metal Bulletin Research outlook: Rise to an average of $2,090 to $2,195 per ton.
 0 Banks & trading companies’ outlook: Rise to an average of $2,400 and $2,500 per ton.
 2017 2021 Other’s outlook: Rise to an average of $2,000 and $2,200 per ton.
 LME Aluminium Total Cost Margin BAHRAIN MACROECONOMICS
 The lucrative growth in non-oil sectors, which generates 80.7% of Bahrain’s real GDP,
 powers Bahrain’s economy against benign international and national economic scene. The
 non-oil growth slipped down slightly from 5.2% to 4.3% in Q2 and Q1 of 2017
 respectively18; this is partially attributed to power outage for 3 hours in Alba, decreasing
 approximately 3%-5% of the company’s entire aluminium output. Bahrain is expected to
 experience macroeconomic headwinds, where the foreign-exchange reserves in the
 Central Bank of Bahrain depleted by 75% since 2014. Without aid or lift in oil prices,
 Bahrain will struggle to be pegged to US Dollars at BHD 0.376. Hence, Bahrain could be
 withdrawing subsidies on energy products, increasing Alba’s cost of production. Also,
 financial aid is expected to be extended to Bahrain as it is viewed less costly compared
 with BH devaluing the currency that will reverberate regionally. Still, Alba is viewed as solid
 and financially stable; hence, it receives competitive offers from banks to finance Line 6
 that will boost Bahrain economic position. (Appendix 12: PESTL analysis). Thus, its internal
 strength and Line 6 expansion will shield its stock price from any adverse event.
 LOCAL ALUMINIUM INDUSTRY
 The growth drivers of Bahrain’s industrial and logistic sectors are key infrastructure
 projects worth $33 billion. Among these projects, Alba initiated their Line 6 brownfield
 project to increase production capacity by 54%. With expectation of additional 250,000
 Figure 12 Alba Yearly Production (mtpa) mtpa output sold domestically, local downstream firms plan to take advantage and
 Source: Alba Website expand their own businesses to accommodate the growing production, creating a wider
 consumer base for Alba. Furthermore, Alba’s major shareholder, Mumtalakat, entered into
 joint venture with synergies casting of India in 2015 for building a downstream aluminium
 plant in Bahrain worth $150 million that will commence operations with output capacity
 of 25,000 tons in Q4/2017 to absorb Alba’s output when line 6 starts in 2019.
 COMPETITIVE POSITIONING
 Monopoly in local aluminium industry & high barriers to entry
 Alba is the top manufacturer within Bahrain’s aluminium industry due to its monopolized
 position within the market for aluminium smelting. With the 54% increase in output to 1.5
 million mtpa (Figure 12), Alba will have a more competitive edge in the market due to Line
 6 expansion. Due to its monopolized market, it is difficult for new entrants to establish a
 position in the market. Alba has reached high levels of economies of scale due to its
 increased production and advanced technology levels (EGA DX+ to EGA DX+ Ultra). With
 the addition of line 6, Alba will be able to lower their costs even more due to operational
 efficiency and lower energy consumption due to technological advancement.
Table 4 GCC Aluminium Production 2016 (mtpa) Value-added products are key priority
 Source: Aluminium Insider Alba is among the very few companies who have their own on-site calciner and carbon
 Emirates Global Aluminium, UAE 2,471,000
 plant allowing them to control operations efficiently and maintain optimum production
 Aluminium Bahrain, Bahrain 971,420
 Ma’aden Aluminium, Saudi Arabia 756,800 of value-added products which comprises of more than half the sales. Alba closed 2017
 Qatalum, Qatar 643,500 with value-added sales averaging 57% of total shipments against 56% in 2016.
 Sohar Aluminium, Oman 386,396 Advantage of domestic natural resources & low production costs
 The initiation of the aluminium industry was due to availability of natural gas – a main
 component of aluminium production. Alba secured a 10-year gas supply contract in 2015
 with NOGA (National Oil and Gas Authority) at a fixed price formula. Also, while electricity
 is provided at a lower price than the market, Alba generates their own electricity through
 their production process. With Project Titan and other advantage through the government
Figure 13 Alba's Competitive Positioning (5-strong & 0-weak)
 Source: Team Estimates
 for land use, construction and utilities, Alba has high competitive advantage.
 Advanced human capital and government support
 Monopoly
 5 Alba has invested greatly in their human capital through extensive workshops and
 4 programs. Alba is the first aluminium smelter in the world to have zero lost time injury
 Regional 3 Value-added
 competition 2 products (LTI) in +9,200,000 working hours. Also, since the government owns 50%+ of the company
 1 through Mumtalakat Holding Company (sovereign wealth fund), the government is
 0 encouraged to continuously support the smooth process of Alba’s operations.
 Strategic
 Domestic Strategic location for logistics
 location
 natural
 resources
 Bahrain has a strategic location, next to Saudi Arabia (largest economy in GCC),
 connecting via a causeway. Bahrain has easy access to the Gulf and MENA region due to
 Human capital its prime location. Similarly, Alba has its own port facilities to receive shipment of raw
 & gov support
 materials. Furthermore, Alba has a valuable physical position within the industry as the
 downstream industry is located few minutes away making transportation easy and cheap.
 Regional competition ranks Alba at 2nd place
 Top 6 producers of Aluminium in the GCC are listed in Table 4. With UAE’s Emirates Global
 Aluminium taking first place, Alba is ranked at 2nd. While UAE poses to be competition for
 Alba, it is asserted that with the start-up of line 6, Alba will improve in its ranking further.
 GCC accounts for one-tenth of global production; where 60% of production is exported19. This
 indicates that Alba has access to a wider market, reducing concentration domestically.
 Table 5 Target Price
 Source: Team Estimates
 FINANCIAL ANALYSIS
 Target
 Price
 Weight
 Weighted
 Price
 INVESTMENT SUMMARY
 DCF We establish a BUY recommendation for Alba at a target price of BHD 1.072 per share, a
 1.496 50% 0.748
 Valuation 72.85% from the current market price of 620 fils as of 16th January 2018 (Table 5). DCF is
 Relative
 0.649 40% 0.260 given highest weighting as it fully incorporates the impact of line 6 expansion. Relative
 Valuation
 Ben valuation has 40% since it highly reflects market perception of the stock using multiples.
 0.643 10% 0.064 Ben Graham formula is given 10% as this method yields a value in the upper bound level.
 Graham
 1-Year Forward Target Price BHD 1.072 INVESTMENT ARGUMENT
 Strong financial position
 Current Market Price (16th Jan 2018) BHD 0.620
 Despite the line 6 loan and interest burden, the ROA (Appendix 5) has continued to rise indicating
 Target Price Upside 72.85% strong financial health. With the expectation of increased revenues and production, the profit
 margin increases to 11% by 2021 from 5% in 2016. The current ratio of Alba remains above 1
 consistently showing its ability to pay-off any current liability obligations with its current assets.
 Table 6 Financial Analysis This is further supported by the 96.8% increase in cash and cash equivalent over 5 years from
 Source: Team Estimates 2016 to 2020, which is attributed to the line 6 production capacity increase. With boost in
 Financial Analysis (2016) revenue due to higher aluminium prices, effective cost reduction through Project Titan, secured
 contracts for important raw materials, and upgraded production process will help Alba
 Piotroski F-Score 5 strengthen their financial position.
 Beniesh M-Score -3.45 Company Financial Analysis
 Various analysis tools were employed to access the financial standing of the company
 Altman Z-Score 3.181 (Table 6 & Appendix 9). Firstly, the Piotroski F-score, which is used to determine the value
 of stocks through its financial strength, had average scores, representing resilient financial
 health. Secondly, the Beneish M-Score which is used to identify any manipulations within
 the financial statements; over the 5-year period, no manipulations were found. Lastly, the
 Table 7 Project Line 6 Altman Z-score which is used to access the probability of bankruptcy. With being highly-
 Appendix 16 leveraged for line 6 expansion it is vital to access the likelihood of bankruptcy. However,
 Line 6 Details with above average scores of 3, bankruptcy is highly unlikely.
 CAPEX USD$ 3 billion Line 6 Project
 Syndicated Loan $1.5bn Alba’s Line 6 project is the major driver in their forecasted valuation. With the expansion
 Project Funding Assuming 2nd loan of $1.2bn
 Equity financing of $300mn
 initiative of Line 6 and Power Station 5, it would make Alba the world’s largest single-site
 Output Adding 540,000 mtpa
 aluminium smelter as well as provide the largest and most efficient power station.
 Line 6 Valuation
 Collectively, it would improve Bahrain’s economic outlook by increasing aluminium
 Target Price
 BHD 0.374 per share sector’s GDP contribution from 12% to 15% and generate 500 jobs. Based on DCF
 Line 6 NPV BHD 530,832,000 valuation, line 6 is estimated to add 374 fils/share to the share price (Table 7).
Project Titan successful implementation
 Table 8 Valuation Variables (in BHD) Project Titan commenced in February 2014 as a two-year efficiency program to decrease
 Source: Team Estimates cash cost. Project Titan’s target was to save $150/mt; Alba managed saving $148/mt by
 Cost of Equity 2015. Followed by Project Titan II, with the aim of saving $100/mt by end-2017, Alba
 Risk-free rate 5.50% managed saving $78/mt in 2016 and $65/mt in 2017 (actual savings were low in 2017 due
 to line 5 recovery time). Project Titan will help Alba maintain sustainable growth, boosting
 Alba's Adjusted Beta 0.94
 the economies of scale benefit while lowering its costs. We assume the continuation of
 Market Return 10.68% this program to reduce costs every year to maintain optimal efficiency and competitive
 Cost of Equity 10.37% advantage especially with rising raw material prices.
 Positive LME Aluminium Price Outlook
 Cost of Debt
 The average LME prices are listed in Table 8. After falling prices between 2015-16, LME
 4.25% aluminium prices is seen to rise by 20% in 2017 at $1,929 from $1,604 in 2016. The
 WACC forecasted market deficit and higher LME prices in 2018 will support Alba’s growth in sales
 8.96% volume and revenue. In 2019, Alba’s rise in production from Line 6 project will lead to
 higher revenue and income. The upward trend will continue in 2020-21. Demand by
 transportation, electrical/machinery and construction sectors for aluminium is expected
 Relative Valuation to increase at 4.9%, 4.2% and 2.1% CAGR respectively. Correspondingly, LME aluminium
 Alba EPS 0.024 U.S. premium that stood at $180/mt on January 2017, was $200/mt by year-end-2017.
 This is expected to reach $250/mt with changing industry dynamics.
 Industry P/E 17.79
 Target Price 0.427 VALUATION
 Alba EBITDA 157,871,000 DISCOUNTED CASH FLOW VALUATION (DCF)
 Based on DCF, the 1-year forward target price achieved was of BHD 1.496, which is 141%
 Industry EV/EBITDA 9.71
 above current market price of 0.620 fils (Appendix 6).
 Alba Enterprise Value 1,509,246,760 Free Cash Flows to Firm (FCFF)
 Less: Debt Value 749,498,000 To determine the fair equity value of Alba, the formula for Free-Cash-Flow-to-Firm (FCFF)
 Add: Cash 371,806,000 was used (Cash flow from Operating Activities – Capital Expenditure – Changes in Net
 Working Capital). FCFF was selected because Alba uses a combination of equity and debt
 Equity Value 1,131,554,760
 to finance their expansion plans and debt plays a major role in the company’s financials
 Outstanding Shares 1,420,000,000 and the cashflow reflects all the major changes undergoing Alba.
 Target Price 0.797 Weighted Average Cost of Capital (WACC)
 WACC was used to determine the cost of capital at which to discount the FCFF. For the
 W of EPS 40%
 component of cost of equity, Capital Asset Pricing Model (CAPM) was used with the risk-
 W of EV/EBITDA 60% free rate of Bahraini Government 10-year Bond. The risk adjusted beta was derived by
 Blended Target Price 0.649 calculating it over a 2-year weekly average by comparing Alba’s stock prices to Bahrain
 All Share Index. The market return was calculated over a 5-year period by averaging the
 daily returns and compounding it annually. For the cost of debt, LIBOR rate of 3.25%+1%
 Table 9 Aluminium Price Sensitivity Analysis ($/mt) was used due to the syndicated loan secured for line 6 expansion project. Weightings
 Source: World Bank & Team Estimates
 were derived using historical 5-year average of debt-to-equity ratio (Appendix 6.2).
 Year 2017 2018 2019 2020 2021
 Terminal Growth Value
 Worst 1873 1890 1908 1926 1944
 Alba contributes 12% to the GDP as of 2016 and is expected to increase to 15% after line
 Base 1911 1929 1947 1965 1984
 6. This indicates Alba’s important contribution to the GDP; thus, it is used as a mechanism
 Best 1950 1968 1987 2005 2024
 Aluminium
 to determine the terminal growth rate for the terminal value. Conducting a sensitivity
 Price
 1929 1946 1965 1983 2002 analysis available in Appendix 6.3, the growth rate was 2.25%.
 RELATIVE VALUATION
Figure 14 Forecasted Revenue (BHD'000) and Aluminium
 prices (USD$/mt) To determine the financial worth of Alba, it is compared to 7 other similar companies in
 Source: Team Estimates the industry who are Alba’s competitors (Appendix 7). Using earnings multiples of P/E and
1,600,000 2020 EV/EBITDA, we derived a blended target price (40:60) of 649 fils. These multiples were
 1,480,322
 specifically selected since P/E ratio is a highly common ratio used to measure performance
1,400,000 2000 against competitors and EBITDA excludes non-cash items giving a more approximate
 1,263,190
 2002 value. The median value was used as it is a better measure of central tendency since it
1,200,000
 1,077,907 1980
 eliminates the outliers distorting the result.
 1983 BEN GRAHAM VALUATION
1,000,000 919,801
 1960 With use of a formula created by Benjamin Graham, we were able to calculate the intrinsic
 784,886
 800,000
 1965 value of Alba at 643 fils which is our target price for 1-year forward. Appendix 8 outlines
 1940
 the variables used to calculate the target price. It is understood that Alba’s share price is
 600,000
 1946 undervalued in the market; while its fair value is 3.71% above market price.

 400,000
 1929 1920 ANALYSIS
 REVENUE & PRODUCTION CAPACITY
 1900
 200,000 Alba is expected to recover from falling revenues (13% decrease) caused by downward
 trend in LME aluminium prices, $1,665 and $1,604 in 2015 and 2016 respectively, despite
 0 1880
 increasing production. The forecasted revenue is based on production levels and LME
 2017 2018 2019 2020 2021
 aluminium forecast prices. The production is expected to increase by 4%-5% based on
 Sales Revenue Aluminium Price
Figure 15 US$ Nominal Annual Average Price of Raw aluminium demand growth, more prominently from American and Asian regions.
Materials Source: Consensus Economic Inc & World Bank Additionally, the continuous increase in LME aluminium prices also contributes to the rise
 305 302 70 in Alba’s revenues with the forecasted LME prices between 2017-2021 to be at $1,929 in
 60 60.9 2017; reaching $2,002 in 2021. This is due to the expected reforms in reducing China’s
 59
 300
 56 60 production; thus, decreasing global aluminium supply. Collectively, Alba’s revenue is
 53 expected to exceed BHD1 billion as Line 6 commences in 2019, a 37% increase from 2017
 295
 (Figure 14).
 50
 290 289.4 COST OF SALES
 Currently, Alba is under a long-term contract with Alcoa for raw material supply (alumina)
 40
 285
 286.7 as a legal settlement since 2012. However, terms of the contract have not been disclosed;
 280
 thus, we assume continuation of contract for raw materials supply. Furthermore, with the
 30
 280.8 secured contract for gas prices with NOGA until April 2021, gas prices will become a major
 275 concern by then as it can cause a $31 million fall in net income. However, it is highly
 275 20 believed another contract for gas prices will be secured by then to prevent Alba from
 270
 incurring a loss considering the majority of the company is owned by the government.
 13.7 13.7 14.5 14.5 15.3 10 Additionally, the government would take necessary measures to strengthen Alba since it
 265
 is one of the major contributor to Bahrain's GDP (12%) and would serve in the best interest
 260 0 of the country. Crude oil price ($/mmbtu), which produces green coke, is expected to
 2017 2018 2019 2020 2021 minimally increase over the next 5 years. Moreover, carbon, which is used to produce
 Alumina Carbon Crude Oil
 carbon anodes for aluminium production is forecasted to increase 5.5% (5-year-CAGR).
 With the assumption of further implementation of Project Titan every year to successfully
 reduce costs, cost of sales consistently reduces except for the last 2 years where the
 increasing prices of alumina (Figure 15) and gas price to more than USD$4/mmbtu
 Figure 16 Dividend per share and Pay-out ratio (increasing by USD$0.25/mmbtu yearly) after April 2021 will apply pressure on costs. Thus,
 Source: Team Estimates Alba has a competitive advantage in more than half the components of production.
 100% 0.040 DIVIDENDS
 The dividend per share was calculated on the basis of compounded annual growth rate
 90%
 0.035 (CAGR) of -4.68%. Alba makes yearly payment of dividends but the dividend payout ratio
 80% and dividend per share are moving in a downward trend (Figure 16). Alba is expected to
 0.030
 70% distribute dividends in 2017 with a pay-out ratio of 80.99% compared to 16.03% in 2016;
 0.025
 this is due to pick up in LME prices. Despite improved aluminium prices in the future,
 60% Alba’s 10% self-financing plan for line 6 (USD$300 million) and higher capex (45% of line
 50% 0.020 6 cost) will result in no dividend paid for 2018. The ratio will increase in 2019 to be 40.82%
 due to an expected higher income following the operation of Line 6 and lower capex
 40%
 0.015 (25%). The pay-out ratio will decrease YoY in 2020 and 2021 to be 25.59% and 16.92% as
 30% Alba will still be constrained by its Line 6 debt repayment and finance cost obligations.
 0.010
 20% CASH FLOW GENERATION
 0.005 Alba is expected to yield favorable liquidity measurements, with current ratio exceeding
 10%
 1.5, indicating the ability to settle current debt obligations using current assets, especially
 0% 0.000
 in 2017 recording the highest ratio (3.83) due to increase in cash (Figure 17). However,
 2013
 2012

 2014
 2015
 2016
 2017
 2018
 2019
 2020
 2021

 2019 poses to be a difficult year for Alba considering its increased debt obligations and
 capex. With signs of recovery up till 2021, the company has a resistant liquidity standing
 Dividend Payout Dividend per share
 and has an upward trend overall. The cash ratio in 2017 will be the highest (2.06) given
 procurement of line 6 loan, and Project Titan-Phase II that will decrease cash-cost by US$
 100 per metric ton. Considering 2020 & 2021, the cash ratio will be low yet improved on
 Figure 17 Coverage Ratio a YoY basis (0.10 and 0.45) due to benefits of Line 6 expansion.
 Source: Team Estimates CREDIT PROFILE
 Syndicated term-loan from both conventional and Shari’aa compliant facilities was
 27.03
 acquired successfully mid-2017 worth $1.5billion (Appendix 16 for further loan details).
 Interest Margin is 325 basis point per annum over LIBOR for 7-year period, with a grace
 22.97
 period of 3 years for line 6 construction. The coverage ratio which indicates Alba’s ability
 22.26 to pay-off its financial obligations, a ratio of over 3 depicts strong financial health. As seen
 16.95 in figure 18, through the years, the ratio remains above 3 with a gradual increase as the
 burden of capex eases.
 17.99
 12.33 DUPONT ANALYSIS
 Return on Equity (ROE) is used as a measurement of Alba’s performance over the years.
 7.81 Considering the 3 factors of ROE (Figure 19), historically, Alba’s ROE is decreasing over
 the years persistently with the most prominent between 2015-16 due to increasing
 5.15
 financial leverage and falling net profit margin. However, the ROE is expected to follow an
 3.43
 3.97 upward trend from 2018 onwards as profits from increased sales will increase the profit
 margin (as a result of rising production and increase in LME prices), efficient asset turnover
 and the major influx of cashflows increasing the equity multiplier reflecting the significant
 contribution of the Line 6 project. Therefore, Alba is expected to achieve an ROE of 13%
 2013
 2012

 2014
 2015
 2016
 2017
 2018
 2019
 2020
 2021

 in 2021, the highest peak in past 5 years.
KEY RISKS
 MARKET RISK
 LME Aluminium Prices (R1)
 Figure 18 Cash Ratio
 Alba’s commodity prices are exposed to changes in LME prices (quoted from the London
 Source: Team Estimates
 Metal Exchange) which are used as a basis to determine aluminium prices. Any negative
 movements in LME prices would risk the profitability of the firm. However, as seen in figure
 2.06
 20, in the case where LME aluminium prices are to drop by 20%, the impact on the 1-year
 forward target price is still a 52.9% upside from the current market price of 620 fils as of
 16th January 2018. To manage this risk, futures commodity prices are considered to hedge
 selling price as per customers’ options. This approach can prove to be profitable if a
 proper strategy is adopted. However, Alba has been able to perform excellently despite
 1.17 low aluminium periods over the last few years indicating towards Alba’s resilience during
 industry downturn.
 0.58 Gas Prices (R2)
 0.38
 0.45 Generally, electricity accounts for 70% in cost variability of aluminium production and
 0.29 since 2015, the rising gas prices from $2.25 per million British thermal units (MMBTU) can
 0.21
 0.10 be a disadvantage for Alba. The yearly increase of $0.25 in price could cost Alba
 0.37
 -0.14 approximately $31 million. Alba consumes 3,574MW in energy for production while the
 rest of Bahrain consumes 3,817MW. This depicts the high level of energy consumption
 2012
 2013
 2014
 2015
 2016
 2017
 2018
 2019
 2020
 2021

 and dependency on gas for production. On April 2017, when Alba faced a power outage
 for 3 hours, they lost 3-5% of production. Following high dependence on gas, Alba
 secured a fixed gas price formula, effective till 1st April 2021. Furthermore, to offset
 fluctuating aluminium price risks, Project Titan, an in-house initiative, was introduced to
 reduce cash cost per unit. Currently, Alba aims to save $100 per unit on a production
 Figure 19 Return on Equity 1,000,000 mtpa for 2017. We assume the continuation of this project as it helps Alba
 Source: Team Estimates maintain its competitive advantage in the market.
 FINANCIAL RISK
 250% 14%
 Interest rate risk (R3)
 13%
 The company is exposed to interest rate risk which would affect its holding assets and
 12%
 200%
 12% liabilities interest. Currently, the USD$1.5 billion syndicated loan for Line 6 is based upon
 11% LIBOR + 3.25%. Therefore, Alba is subjected to high market risk since LIBOR experiences
 10% 10%
 daily movements thus it will have a high impact on the profitability and cashflows of Alba.
 9%
 150% Foreign exchange risk (R4)
 8% The operating activities is the main segment exposed to changes in foreign exchange
 7% rates. The majority of Alba’s financial instruments are denominated in Bahraini Dinars, US
 6%
 100%
 6% Dollars, Euros, Swiss Francs and Great Britain Pounds. In the past, the company entered
 5% into forward foreign exchange contracts to hedge against forward foreign exchange
 4% 4% contracts. Alba is not considered to have a significant exposure to US Dollar fluctuations
 3%
 50% as the Bahraini Dinar is pegged to the US Dollar at BHD 0.376. With this, the impact and
 2% probability are relatively moderate.
 Credit risk (R5)
 0% 0% Credit risk is applicable to Alba’s operating activities (primarily on trade receivables,
 financing activities including bank and financial institutions deposits), foreign exchange
 2012
 2013
 2014
 2015
 2016
 2017
 2018
 2019
 2020
 2021

 transactions and derivatives instruments. A method in which the company reduces credit
 Net Profit Margin Asset Turnover Ratio risk is to deal with its investments dealt with reputable banks and assign credit limits to
 Equity Multiplier Return on Equity each counterparty. For trade and other receivables, 52% of its outstanding trade
 receivables consist of the company’s five largest customers account. In order to manage
 the credit risk, Alba prefers receiving advanced payments from customers, assess
 creditworthiness by obtaining letters of credit and other forms of credit insurance and
Figure 20 Change in LME Aluminium Price impact on Alba's 1- track the customer exposure on a regular basis. When risks of default are identified,
 year forward target price provision for doubtful receivables are created. With the assumption of no derivative
 Source: Team Estimates contracts in the future, Alba is not subjected to credit risk for derivatives specifically.
 Liquidity risk (R6)
 1.210
 1.105 1.139 The company may be exposed to this risk when it is unable to sell its financial asset close
 1.008 1.039 to or equal to its fair value. This risk can be decreased by ensuring the availability of
 0.948
 banking facilities. Additionally, Alba includes a sales term where it requires a payment to
 be made within 30 to 180 days of the date of sale. However, with a negative cashflow for
 2019, liquidity risk remains high for the year. In the long-run this outlook is expected to
 change as Alba repays the line 6 loans and operates and maximum capacity to generate
 greater profits and cash flow in the future.

 -20% -10% -5% 5% 10% 20%
Figure 21 Bahrain Real GDP Growth Rate
 Source: World Bank
 OPERATIONAL RISK
 Raw Materials Risk (R7)
 8.30% Alba is dependent on its suppliers for raw material supply. Any disruptions in the supply
 chain could lead to major drawback in the production process. Alba is currently under
 contract with Alcoa for raw material supply, and the government for gas supply. In the
 6.20% 5.30% case these contracts no longer exist or are not renewed, Alba will be subject to major
 4.30% fluctuations in market price of raw materials as alumina is expected to become expensive.
 4.40% As contingency, Alba is assessing options to satisfy the demand for alumina which will rise
 3.60% to 2.5M metric tons/year once Line 6 begins. Alba’s CEO also announced the consideration
 2.90% of joint ventures with large alumina suppliers or off-take contracts with their refineries.
 3% Operational Cost Risk (R8)
 2.50%
 2.10% By means of Project Titan II, Alba has been able to successfully reduce operational costs
 over the last 3 years which given them a competitive advantage in the market by selling
 at low prices. In addition, Alba close 2016 without any lost time injury. Constant initiative
2007
 2008
 2009
 2010
 2011
 2012
 2013
 2014
 2015
 2016

 by the CEO has increasing operational efficiency significantly.
 Strategic risk (R9)
 Figure 22 Risk Grid
 Alba manages its strategic risks by adjusting its capital structure and taking appropriate
 Source: Team Estimates actions in response to economic changes. This can be done by adjusting dividend
 payment to shareholders, return capital and issue new shares. The main objective of
 capital management is to sustain a healthy and sufficient capital base able to support its
 operations and maximize shareholders’ value. Since Alba is constantly on top of such
 factors to ensure smooth flow of operations, the risk is minimal. Historically, Alba has had
 many successful strategies (Project Titan I & II).
 ECONOMIC RISK
 Bahrain Macroeconomic Status Quo (R10)
 The economic slowdown of Bahrain since the financial crisis 2007/8, Arab Spring 2011 and
 declining oil prices has been gradually recovering (Figure 21). The non-oil sector (of which
 Alba is a part of) has remained resilient despite fiscal reforms such as VAT (5%) and subsidy
 removal. The introduction of 5% Value Added Tax on all sales by Q3 in 2018 might affect
 Alba's semi-final aluminium production indirectly, as there is the likelihood of VAT being
 applied to the downstream industry products. This will eventually affect Alba’s revenue as
 41% is derived locally.
 Sovereign Credit Downgrade (R11)
 Bahrain’s credit rating is at a risk of another downgrade from B+. It was recently
 downgraded from BB- to B+ by S&P due to lack of fiscal reform plans and budgeting
 reports. However, with current reforms under process, the risk of downgrade is moderate
 since Alba already secured the syndicated loan for line 6 expansion.
 STOCK ANALYSIS
2015 Q3 - NOGA announced a 25% increase to oil and gas prices. This took an effect on April 1st. Increase in oil and natural gas prices
caused a panic among public shareholder within the Bahraini Index. ALBH started dropping starting Q3.
2016 Q2 - ALBH reached its lowest point due to LME price decline, owing to the major increase in supply. The oversupply affected the
global markets negatively. China started supplying the market with aluminum at lower price than the current market.
2017 Q1 - ALBH started to recover from the LME prices decline after adjusting to market fluctuations. LME started to resume its normal
prices after China’s proposed 30% cut of production capacity.
2018 Q1 - Line 6 is one of the major drivers of share price increase; as the project nears its completion date, the future prospect for Alba
is moving in a positive direction. Additionally, China production curtailment and expectation of higher LME prices has led to the increase.

 BHD 0.700 25000000

 BHD 0.600 20000000
 BHD 0.500
 15000000
 BHD 0.400
 10000000
 BHD 0.300

 BHD 0.200 5000000

 BHD 0.100 0
 Q1 Q2 Q3 Q4 Q1 Q2 Q3 Q4 Q1 Q2 Q3 Q4 Q1 Q2 Q3 Q4 Q1
 2014 2015 2016 2017 2018
 Figure 23 Stock Valuation Volume Average Price
APPENDICES
APPENDIX 1: CONSOLIDATED STATEMENT OF COMPREHENSIVE INCOME
 2012 2013 2014 2015 2016 2017F 2018F 2019F 2020F 2021F
 BD '000 BD '000 BD '000 BD '000 BD '000 BD '000 BD '000 BD '000 BD '000 BD '000
 Sales 743,725 749,338 821,715 766,686 669,760 784,886 919,801 1,077,907 1,263,190 1,480,322
 Cost of sales -638,515 -640,751 -673,947 -663,428 -587,381 -671,253 -777,438 -900,294 -1,042,415 -1,206,793
 GROSS PROFIT 105,210 108,587 147,768 103,258 82,379 113,633 142,363 177,614 220,776 273,528
 Other income 39,378 7,304 1,865 3,701 2,989 1,750 1,772 2,695 2,817 2,946
 (Loss) gain on foreign exchange translation -17,838 211 671 728 -19 - - - - -
 Administrative expenses -27,347 -30,609 -29,546 -32,417 -22,548 -28,263 -33,121 -38,815 -45,487 -53,305
 Selling and distribution expenses -1,346 -17,574 -19,885 -12,187 -11,259 -12,254 -14,360 -16,828 -19,721 -23,111
 Finance costs -7,182 -5,823 -4,449 -3,176 -2,504 -40,391 -61,200 -52,548 -43,936 -35,157
 Directors’ fees -190 -190 -190 -210 -210 -210 -210 -210 -210 -210
 Net revaluation/settlement of derivatives 5,860 17,871 211 264 - - - - - -
 PROFIT FOR THE YEAR BEFORE TAX 96,545 79,777 96,445 59,961 48,828 34,265 35,244 71,907 114,240 164,691
 Tax expense - - - - -438 - - - - -
 PROFIT FOR THE YEAR 96,545 79,777 96,445 59,961 48,390 34,265 35,244 71,907 114,240 164,691

ASSUMPTIONS:
Sales Revenue: expected to increase with the boost in production due to line 6. Increasing worldwide demand for aluminium is another reason for the increase.
 2012 2013 2014 2015 2016 2017 2018 2019 2020 2021
 Yearly Production 890,217 912,700 931,427 960,643 971,420 981,016 1,019,668 1,540,000 1,609,993 1,698,543

LME Aluminium Price: Based on World Bank forecasts, the team conducted a sensitivity analysis to produce realistic figures of the forecasted aluminium prices.

 2017 2018 2019 2020 2021 Probability The rising LME prices will encourage Chinese producers to increase aluminium output, posing downside
 risk on LME prices. Still, the LME prices will rise due to weakening US dollar against other basket of
 World Bank Forecasts 1950 1968 1987 2005 2024
 currencies, despite Federal Reserve interest rate hawkish hike from 1% to 1.25% this year (2017).
 Worst-case 1873 1890 1908 1926 1944 0.15 Moreover, the local premiums react to US Midwest premiums; and there is an impression that the US
 Base 1911 1929 1947 1965 1984 0.25 Midwest premium is increasing for P1020 aluminium, given the need for aluminium imports into US.
 Increase in freight rates will add to the premium prices; premiums will cushion aluminium smelters to
 Best-case 1950 1968 1987 2005 2024 0.60 some extent from fall in price. Furthermore, rising raw material costs will further drive the prices
 upwards. Incorporating all these factors, with the optimistic outlook in the aluminium market, the best-
 Team Estimates (in $/mt) 1929 1946 1965 1983 2002
 case scenario has a higher probability of occurrence than the base and worse.

Cost of Sales: With successful implementation of Project Titan Phase I & II, COS expected to decrease despite increase in Alumina prices due to Alba-Alcoa long-term contract
Expenses: As the size of Alba increases with its production, its expenses are expected to increase as well as it caters to more orders around the globe.
Finance Cost: With the line 6 loan of USD$1.5 billion and USD$1.2 billion at 3.25% LIBOR rate, the interest rate is calculated accordingly.
APPENDIX 2: CONSOLIDATED STATEMENT OF FINANCIAL POSITION

 (in BHD ‘000) 2012 2013 2014 2015 2016 2017F 2018F 2019F 2020F 2021F
Assets
Non-current assets
Property, plant and equipment 901,779 868,318 837,757 811,377 847,500 1,102,685 1,513,794 1,679,390 1,582,116 1,482,947
Long term receivable 10,314 6,877 3,439 - - - - - - -
Other asset - - 4,704 4,512 4,320 - - - - -
Deferred tax asset - - - - 10 - - - - -
 912,093 875,195 845,900 815,889 851,830 1,102,685 1,513,794 1,679,390 1,582,116 1,482,947
Current assets
Inventories 143,564 144,930 152,469 146,404 163,422 157,823 164,042 247,751 259,012 273,257
Current of long terms receivables 3,438 3,438 3,438 - - - - - - -
Long term receivable - - - 3,439 - 60,763 1,743
Trade and other receivables 108,299 85,375 92,888 100,698 92,065 100,684 117,991 138,273 162,041 189,894
Other assets - 4,800 - - - - - - - -
Derivatives financial instrument 104 - - - - - - - - -
Bank balances and cash 61,605 64,540 67,198 116,009 66,413 371,806 294,027 -30,814 24,500 130,726
 317,010 303,083 315,993 366,550 321,900 691,077 576,059 356,953 445,552 593,877
TOTAL ASSETS 1,229,103 1,178,278 1,161,893 1,182,439 1,173,730 1,793,762 2,089,853 2,036,343 2,027,668 2,076,825
Equity and Liabilities
Equity
Share capital 142,000 142,000 142,000 142,000 142,000 142,000 142,000 142,000 142,000 142,000
Treasury shares -4,087 -5,157 -3,696 -4,905 -4,965 -4,965 -4,965 -4,965 -4,965 -4,965
Statutory reserve 71,000 71,000 71,000 71,000 71,000 71,000 71,000 71,000 71,000 71,000
Capital reserve 249 249 249 249 249 249 249 249 249 249
Retained earnings 600,683 629,381 687,387 731,698 779,813 806,322 755,508 827,415 910,982 1,046,437
Proposed dividend 19,773 30,978 21,200 7,768 - 29,658 - 30,673 29,237 27,868
TOTAL EQUITY 829,618 868,451 918,140 947,810 988,097 1,044,264 963,792 1,066,372 1,148,503 1,282,589
Non-current liabilities
Borrowings 77,096 84,402 64,137 33,024 6,489 567,578 872,133 750,495 627,283 502,291
Employees’ end of service benefits 915 930 1,265 1,349 1,554 1,678 1,916 2,056 2,275 2,418
Derivatives financial instruments 23,996 5,313 - - - - - - - -
 102,007 90,645 65,402 34,373 8,043 569,256 874,048 752,550 629,558 504,709
Current liabilities
Borrowings 160,303 116,432 72,351 56,373 45,235 34,286 23,654 16,976 12,562 9,507
Trade and other payables 106,585 97,960 101,378 143,844 132,355 145,955 171,044 200,445 234,899 275,277
Derivative financial instruments 13,430 4,790 4,622 39 - - - - - -
Short term loans 17,160 - - - - - 57,315 - 2,145 4,744
 297,478 219,182 178,351 200,256 177,590 180,242 252,013 217,421 249,607 289,527
TOTAL LIABILITIES 399,485 309,827 243,753 234,629 185,633 749,498 1,126,061 969,971 879,165 794,236
TOTAL EQUITY AND LIABILITIES 1,229,103 1,178,278 1,161,893 1,182,439 1,173,730 1,793,762 2,089,853 2,036,343 2,027,668 2,076,825
You can also read