AGRICULTURAL SECTOR SKILLS PLAN - 2019-2020 Prepared on behalf of the Sector by AgriSETA for submission to the Department of Higher Education and ...
←
→
Page content transcription
If your browser does not render page correctly, please read the page content below

AGRICULTURAL SECTOR SKILLS PLAN
          2019-2020
Prepared on behalf of the Sector by AgriSETA for submission
    to the Department of Higher Education and Training

                      August 2018
AUTHORISATION AND OFFICIAL SIGN-OFF
We, the undersigned, hereby certify that this Final Draft Sector Skills Plan:
   • Was developed by the management of AgriSETA under the guidance of the AgriSETA
     Accounting Authority and in consultation with the Department of Higher Education and
     Training;
   • Was informed by extensive literature reviews, data analysis and research;
   • Takes into account all the relevant policies, legislation and other mandates for which
     AgriSETA is responsible;
   • Involved representative stakeholder consultations; and
   • Accurately reflects the findings in terms of skills gaps within documented limitations to
     inform strategy planning and performance priorities.

For more information, please contact:
AgriSETA House
Address: 529 Belvedere St, Arcadia, Pretoria, 0002
Phone: 012 325 165
Fax: 012 325 1677
Email: info@agriseta.co.za

                                                                                             i
FOREWORD
South Africa has a dual agricultural economy spanning subsistence and commercial interests.
These two constituencies have differing skills requirements and AgriSETA is required to serve
both. In order to accurately serve the skills needs of the Agricultural sector, AgriSETA requires an
updated Sector Skills Plan (SSP) for 2019/2020, including an occupational shortages and skills
gaps list which is aligned to government priorities and strategic frameworks. This document lays
out these priorities and identifies the skills needs of the sector.

   It was found that commercial farmers require high level technical skills for managerial
positions, and improved Adult Education and Training (AET) and Recognition of Prior Learning
(RPL) for their unskilled workforce. Co-operatives require partnerships (with big business,
government departments, other SETAs and industry bodies) that are targeted at helping co-
operatives develop into proper businesses with access to finance, corporate governance and
business management skills.

   The skills mismatch identified in this SSP points out that neither of these constituents outlined
above currently fully benefits from existing AgriSETA learnerships. Unskilled workers are, on the
whole, not eligible for lower level NQF AgriSETA learnerships because they do not have the
requisite basic literacy and numeracy skills, or require RPL to be launched onto a career
development path. This unskilled workforce spans commercial and subsistence farming. AgriSETA
provides sufficient lower level NQF interventions; however commercial enterprises require
technical skill for managerial and scientific positions, which should be catered for in the form of
mentorships and bursaries. The research supporting these findings is contained in this document.

                                                                                                  ii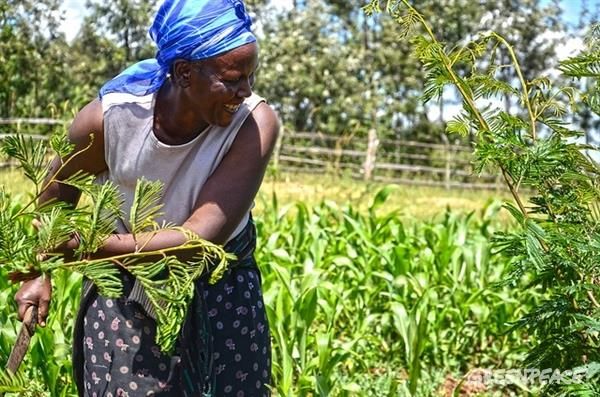
ABBREVIATIONS AND ACRONYMS

ABBREVIATION/ACRONYM                             DESCRIPTION

AASA                    Aquaculture Association of South Africa

AFASA                   African Farmers Association of South Africa

AGOA                    African Growth and Opportunity Act

AGRISETA                Agricultural Sector Education and Training Authority

APAP                    Agricultural Policy Action Plan

ATR                     Annual Training Report

BSASA                   Bivalve Shellfish Farmers Association of South Africa

BMI                     Business Monitor International

CoS                     Centres of Specialization

DAFF                    Department of Agriculture, Fisheries and Forestry

DHET                    Department of Higher Education and Training

DRDLR                   Department of Rural Development and Land Reform

DTI                     Department of Trade and Industry

FETMIS                 Further Education and Training Management Information
                       System

GDP                     Gross Domestic Product

HEMIS                   Higher Education Management Information System

HSRC                    Human Sciences Research Council

HTFV                    Hard To Fill Vacancies

IGDP                    Integrated Growth Development Plan

IDP                     Integrated Development Plan

IPAP                    Industrial Policy Action Plan

                                                                                iii
IRR        Institute of Race relations

KZN        KwaZulu-Natal

MAFISA     Micro Agricultural Financial Institution of South Africa

MFFASA     Marine Finfish Farmers Association of South Africa

MTF        Mpumalanga Trout Forum

NAFU       National African Farmers Union

NAMC       National Agricultural Marketing Council

NDP        National Development Plan

NERPO      National Emergent Red Meat Producers Organization

NGP        New Growth Path

NEETS      Not in Employment, Education or Training

NSDS III   National Skills Development Strategy III

NSFAS      National Students Financial Aid Scheme

QLFS       Quarterly Labour Force Survey

QCTO       Quality Council for Trade and Occupations

RPL        Recognition of Prior Learning

SAAA       South African Aquaculture Association

SACAU      Southern African Confederation of African Unions

SADC       Southern African Development Community

SAIVCET    South African Institute for Vocational Continuing
           Education and Training

SAQA       South African Qualifications Authority

SARS       South African Revenue Service

SDA        Skills Development Act

SIC        Standard Integrated Project

                                                                      iv
SIP       Standard Industrial Classification

SSP       Sector Skills Plan

SIZA      Sustainability Initiative of South Africa

STATSSA   Statistics South Africa

TAUSA     Transvaal Agricultural Union South Africa

TLUSA     Farmers Union

TVET      Technical Vocational Education and Training

WAVMA     World Aquatic Veterinary Medical Association

WCTA      Western Cape Trout Association

WSP       Workplace Skills Plan

WTO       World Trade Organization

                                                         v
TABLE OF CONTENTS
Authorisation and official sign-off ................................................................................................. i

Foreword ..................................................................................................................................... ii

Abbreviations and acronyms ....................................................................................................... iii

LIST OF TABLES AND FIGURES .....................................................................................................viii

EXECUTIVE SUMMARY ................................................................................................................ ix

RESEARCH PROCESS AND METHODS ............................................................................................. x

        1.Document review ......................................................................................................................xii
        2.Scarce and PIVOTAL List Formulation....................................................................................... xiii
         2.1. Scarce skills and skills gaps list was generated through: ....................................... xiii
         2.2. Pivotal list was generated through:........................................................................ xiii
        3.Summary of Key findings .......................................................................................................... xiii
Chapter 1: Sector Profile .............................................................................................................. 1

        1.INTRODUCTION .......................................................................................................................... 1
        1.1.SCOPE OF COVERAGE .............................................................................................................. 1
        1.2.KEY ROLE-PLAYERS................................................................................................................... 4
        1.3.ECONOMIC PERFORMANCE .................................................................................................... 7
        1.4.EMPLOYER PROFILE ................................................................................................................. 9
        1.5.LABOUR MARKET PROFILE .................................................................................................... 10
         1.5.1. Provincial distribution of employees.................................................................... 11
         1.5.2. Gender .................................................................................................................. 11
         1.5.3. Race ...................................................................................................................... 12
         1.5.4. Age ........................................................................................................................ 12
         1.5.5. Occupational categories ....................................................................................... 13
        1.6.CONCLUSION ......................................................................................................................... 13
Chapter 2: Key Skills Issues ......................................................................................................... 14

        2.INTRODUCTION ........................................................................................................................ 14
        2.1.Change Drivers ...................................................................................................................... 14
         2.2.PESTEL....................................................................................................................... 16
        2.3.ALIGNMENT WITH NATIONAL STRATEGIES AND PLANS ....................................................... 18
Chapter 3: Occupational Shortages and Skills Gaps ..................................................................... 21

        3.INTRODUCTION ........................................................................................................................ 21
        3.1.Occupational shortages and skills gaps ................................................................................. 22
        3.2. Extent and Nature of Supply ................................................................................................ 32
        3.2.2 Supply challenges experienced by firms ............................................................................ 38

                                                                                                                                                 vi
3.3. PIVOTAL List .......................................................................................................................... 38
        3.4.Conclusion ............................................................................................................................. 41
Chapter 4: Sector Partnerships ................................................................................................... 42

        4.INTRODUCTION ........................................................................................................................ 42
        4.1.EXISTING PARTNERSHIPS ....................................................................................................... 42
        4.2.NEW PARTNERSHIPS.............................................................................................................. 46
        4.3.PARTNERSHIPS AT SUB-SECTORAL LEVEL .............................................................................. 47
        4.4.CONCLUSION ......................................................................................................................... 51
Chapter 5: Skills Priority Actions ................................................................................................ 53

        5.INTRODUCTION ........................................................................................................................ 53
        5.1.Findings from previous Chapters........................................................................................... 53
        5.2.Recommended Actions ......................................................................................................... 55
        5.2.1. Policy provisions that create incentives to support rural skills development ..... 55
        5.2.2. Support co-operatives in corporate governance and enterprise development .. 56
        5.2.3. Mentorship and career pathways clearly mapped to support equity and youth
        development .................................................................................................................. 57
        5.2.4. Improve the quality of skills supply to the sector ................................................ 57
        5.2.5. Establish a cross-cutting focus (on green knowledge and animal and plant
        health) in all skill provisions ........................................................................................... 58
        5.3.CONCLUSION ......................................................................................................................... 58
Bibliography .............................................................................................................................. 59

                                                                                                                                                   vii
LIST OF TABLES AND FIGURES
TABLES

Table 1:RESEARCH PROCESS AND METHODS ................................................................................................... x
Table 2: STAKEHOLDERS CONTACTED FOR SURVEYS AND INTERVIEWS ......................................................... xv
Table 3: SECONDARY SOURCES OF DATA ....................................................................................................... xv
Table 4: ACTIVITIES WITHIN THE AGRICULTURAL SECTOR BY SIC CODE ........................................................... 2
Table 5: KEY AGRICULTURAL ROLE-PLAYERS .................................................................................................... 4
Table 6:DISTRIBUTION OF EMPLOYEES BY PROVINCE IN AGRICULTURE, FISHERIES AND FORESTRY .............. 11
Table 7: CHANGE DRIVERS ............................................................................................................................. 14
Table 8:PESTEL FOR SECTOR .......................................................................................................................... 16
Table 9:SMALL-EMERGING FARMERS AND CO-OPERATIVES HTFVS ............................................................... 22
Table 10:COMMERCIAL ENTERPRISES’ HTFVS ................................................................................................ 24
Table 11:TOP EMERGING SUBSECTOR SKILLS GAPS AND FUTURE OCCUPATIONAL SHORTAGES .................... 30
Table 12:SCARCE SKILLS AND SKILLS GAPS LIST ............................................................................................. 31
Table 13:EMPLOYEES TRAINED BY OCCUPATIONAL CATEGORY AND GENDER ............................................... 35
Table 14:HIGHER EDUCATION AND TRAINING INSTITUTES ............................................................................ 36
Table 15:COLLEGES OF AGRICULTURE ............................................................................................................ 37
Table 16:THE AGRISETA 2019/20 PIVOTAL LIST .............................................................................................. 39
Table 17:SECTOR PARTNERSHIPS ................................................................................................................... 43
Table 18:EXISTING PARTNERSHIPS BY SUB-SECTOR ....................................................................................... 47
Table 19:POLICY PROVISIONS SKILLS PRIORITY ACTIONS ............................................................................... 56
Table 20: CO-OPERATIVE SKILLS PRIORITY ACTIONS ...................................................................................... 56
Table 21:MENTORSHIP AND CAREER PATHWAY SKILLS PRIORITY ACTIONS .................................................. 57
Table 22:QUALITY OF SKILLS SUPPLY SKILLS PRIORITY ACTIONS .................................................................... 57
Table 23:GREEN KNOWLEDGE SKILLS PRIORITY ACTIONS .............................................................................. 58

FIGURES
Figure 1: DISTRIBUTION OF AGRICULTURAL ENTITIES BY SUBSECTOR .............................................................. 3
Figure 2: CONTRIBUTION TO GDP BY SECTOR, Q4 2017 ................................................................................... 7
Figure 3:PROVINCIAL DISTRIBUTION OF EMPLOYERS REGISTERED WITH AGRISETA ........................................ 9
Figure 4:GENDER DISTRIBUTION OF LABOUR IN THE AGRICULTURAL SECTOR ............................................... 11
Figure 5: Employees by race........................................................................................................................... 12
Figure 6:EMPLOYMENT CATEGORIES WITHIN LARGE ORGANISATIONS ......................................................... 13
Figure 7:UNIVERSITIES THROUGHPUT FOR AGRICULTURAL STUDENTS GRADUATING IN 2013-2014 ............. 33
Figure 8: NUMBER OF POST-SCHOOL GRADUATES IN AGRICULTURAL SECTOR .............................................. 33
Figure 9: SKILLS DEVELOPMENT INTERVENTIONS........................................................................................... 34

                                                                                                                                                    viii
EXECUTIVE SUMMARY
AgriSETA requires an updated occupational shortages and skills gaps list, aligned to
government priorities and strategic frameworks, in response to needs identified by the
Agricultural sector. There is a need to understand how the current skills gaps lists match the
needs of the Agricultural sector and how AgriSETA might facilitate relevant skills and
educational opportunities to address the occupational shortages and skills gaps identified.
This 2019-2020 Sector Skills Plan (SSP) aims to address five key objectives:
1. Provide a profile of the Agricultural sector which outlines economic indicators and
trends in the sector, including employer and employee trends;
2. Identify key skills issues in the agricultural sector by highlighting the macro socio-
economic factors that impact on the demand for skills. In this regard, change drivers
were identified and their articulations with national policy and strategy elaborated
upon;
3. Analyse the skills demand and supply trends in the agricultural sector to identify
potential skills mismatches. This analysis resulted in the formulation of the scarce and
pivotal skills lists;
4. Agricultural sector partnerships were determine and evaluated on how they can be
improved, as well as demonstrate ‘best practice’ with regard to partnering.
5. Identify skills priorities and actions as necessary steps to be taken in offering
stakeholders the support they need to address skills challenges in the agricultural
sector.
ixRESEARCH PROCESS AND METHODS
Sample size
4693 stakeholders were reached in the formulation of this SSP. This number comprised of
AgriSETA members, members of co-operatives, subsector committee members representing
levy payers, key industry players, existing & potential partners, as well as agricultural training
institutions. In addition, key information was derived from AgriSETA through internal
consultation
Of those in the farming industry who responded to the survey, 12% were co-operative
farmers, 13% were small & emerging farmers and 75% were commercial farmers. Thus, the
PIVOTAL list generated in this SSP caters for the needs of commercial farming & favours the
responses of top AgriSETA levy payers.
Time frame of the study
The study took about 8 months to complete, including qualitative document analysis,
quantitative survey & interviews, data analysis, synthesis, & triangulation.
Data collection tool/s
Data collection instruments was done through Internet data and unstructured interviews.
Such as pre-post survey questionnaire, qualitative survey questionnaire, quantitative
survey questionnaire, large focus group questionnaire & subsector focus group questionnaire
were utilized throughout the study.
Quantitative research study employed the survey questionnaire as a data collection tool.
Qualitative research studies employed interviews & document analysis as data collection
tools. Quantitative survey gathered data on the unskilled, skilled & generic occupational
shortages & skills gap. Qualitative interviews (primary data) & document analysis (secondary
data) established the occupational skills shortages & emerging skills needs in the 11
agricultural subsectors. Secondary data collection included an analysis of the 1700 WSPs &
ATRs submitted in 2016. This only represents 8.6% of the total 19834 registered with
AgriSETA. HEMIS data provided a snapshot of the throughput of graduates in the agricultural
sector.
Document review established the economic performance & trends by subsector,
geographical concentration & employers. Government policy & strategy documents, as well
as the key statistical & industry publications, were also reviewed.
The research process and methods are presented in the following table:
Table 1: RESEARCH PROCESS AND METHODS
Research topic/s Research Objective/s Research Nature of Findings
question/s of the study method/s the study
1. Sector How does the Understandin Desktop Sector Sector
profile economy, g the research profile profile was
enterprises and economy, Included analysed.
labour look within enterprises gathering Chapter 1
the sector? and labour empirical
evidence
xwithin the using
sector. primary
data
sources, as
well as
undertaking
theoretical,
desktop
research
using
secondary
data
sources.
2. Skills issues What are the key Identify the Quantitative For skills Key skills
& demands skills shortages & key skills research was issues & shortages
demands with shortages & used to demands &
demands
regard to demands identify the and
with regard
unskilled, skilled, with regard agricultural occupation to
generic subsector to unskilled, skills issues & al shortages unskilled,
occupations & skilled, demands. & emerging skilled,
emerging skills generic skills needs generic
needs in the subsector quantitativ subsector
agricultural occupations e& occupation
s&
sector? & emerging qualitative
emerging
skills needs in data was skills needs
the gathered in the
agricultural using a agriculture
sector. purposive sector
sampling Identified.
method. Chapter 2
Purposive
3. Occupationa What are the Establish the Qualitative Occupation
sampling shortages
l shortages occupational occupational research was
was used to &
& emerging shortages & shortages & used to
identify emerging
skills needs emerging skills emerging establish the
stakeholder skills needs
needs in the 11 skills needs in occupational in the 11
s from
subsectors of the the 11 shortages & subsectors
agricultural subsectors of emerging whom
of the
specific agriculture
sector? the skills needs in
information sector
agricultural the
agricultural is required. established
sector.
.
sector.
Chapter 3
xi4. Sector Who are the key Identify key Desktop Recent Key &
partnerships partners & AgriSETA research, & information potential
potential partners partnerships large focus on sector sector
partnership
in the sector? group & partnership
s were
subsector was identified.
focus group gathered. Chapter 4
questionnaire
s.
5. Skills What are the Identify skills Desktop Synthesis of Skills
priority skills priority priority research, & findings of priority
actions actions to be actions large focus the actions
taken? group & previous were
subsector chapters. identified.
focus group Chapter 5
questionnaire
s.
WORKPLACE SKILLS SURVEY
Research Objective/s of Research Sample size Time Findings
topic/s the study method/s frame of
the study
Improvement of Establishing a quantitative 11 of sub- 1 Month Key skills
labour market credible, research sector and 21 issues and
intelligence institutional administerin committees days Occupatio
n
mechanism for g of survey
shortages
skills planning &
emerging
skills
needs in
the 11
subsectors
1. DOCUMENT REVIEW
A document review was conducted to establish the economic performance and trends by
subsector, geographic concentration and employers. Government policy and strategy
documents, as well as the key statistical and industry publications, were reviewed and these are
included in the bibliography. A thematic analysis was conducted to synthesise the key economic,
policy and training issues affecting the agricultural sector, to identify key skills issues.
xii2. SCARCE AND PIVOTAL LIST FORMULATION
The scarce skills, skills gaps and pivotal skills lists were arrived at through secondary data
analysis and the numbers made available in previous Sector Skills Plans.
2.1. Scarce skills and skills gaps list was generated through:
Identifying hard-to-fill vacancies based on the results of previous Sector Skills Plans,
triangulated with 2015/16 and 2016/17 WSP data, as well as surveys sent to all the
AgriSETA levy payers, non-levy payers, small-scale farmers and agricultural sub-
subsector committee members. Further information was obtained through interviews
with the top levy payers and key industry stakeholders to corroborate these findings.
An analysis of graduate completion rates compared against hard-to-fill vacancies
identified through stakeholder engagements.
2.2. Pivotal list was generated through:
An analysis of employer commitment to train in specific occupational areas as per the
WSP submissions, in comparison with the hard-to-fill vacancies, thus determining
where additional training is needed that industry has not yet, or is unable to, respond
to.
These analyses corroborated the existing top ten scarce skills list and are discussed in
chapter 3. They provide an indication of the imbalances in the sector at national
qualification and occupational level. They also provide an indication of the volume of
skills formation in the workplace and through training providers (Powell & Reddy,
2015).
3. SUMMARY OF KEY FINDINGS
South Africa has a dual agricultural economy spanning subsistence and commercial
interests. AgriSETA is required to fairly serve both these constituencies despite deriving
the bulk of its income from top levy players who are a minor proportion of the sector
as a whole. The top levy payers’ contributions justifies their skills needs be catered for,
but there is also an equal democratic imperative to support subsistence farmers and
rural development for the sake of improved livelihoods and food security.
These two constituencies have differing skills requirements. Commercial farmers
require high level technical skill for managerial positions, and improved AET and RPL
for their unskilled workforce. While co-operatives require partnerships (with big
business, government departments, other SETAs and industry bodies) that are targeted
at helping co-operatives develop into proper businesses with access to finance,
corporate governance and business management skills. These should be provided in
the form of mentorships which fall beyond traditional SETA learnerships.
It appears that the skills mismatch in the agricultural sector is that neither of these
constituents currently fully benefits from existing AgriSETA learnerships. There is a
group of unskilled workers who are not eligible for lower level NQF AgriSETA
learnerships because they do not have the requisite basic literacy and numeracy skills,
xiiior require RPL to be launched onto a career development path. This unskilled
workforce spans commercial and subsistence farming. AgriSETA provides sufficient low
to medium level NQF interventions, while agricultural colleges and higher education
institutions provide medium to high level skills required by commercial enterprises.
xivTABLE 2: STAKEHOLDERS CONTACTED FOR SURVEYS AND INTERVIEWS
Who we contacted
Demand AGRISETA members 3 983
Co-operatives 113 Surveyed 4 145 stakeholders
Subsector committee members 49
Top levy payers 7
Key industry players 12
Existing partners (DRDLR, DAFF, DoL, 4 Surveyed 25 key role players
Co-ops)
Potential partners 2
Supply Agricultural training institutes 523 Surveyed 523 training
institutions
Total stakeholders contacted 4 693
The sources of the secondary data analysis are captured in Table 3 below:
TABLE 3: SECONDARY SOURCES OF DATA
Source Analysis
Demand Review of WSP and ATR Training undertaken & projected by members
submissions 2015/16 - 2016/17
Supply Review of AGRISETA and Number of training providers by qualification
SAQA qualifications
Review of HEMIS data Throughput of graduates in agricultural sector
xvCHAPTER 1: SECTOR PROFILE
1. INTRODUCTION
Chapter 1 provides an overview of the agricultural sector in South Africa by describing five broad
sections. The first section deals with the scope of the agricultural sector’s coverage of constituent
members. The second section describes the AgriSETA stakeholders and key role-players in the sector.
The third section expands on the economic performance of the agricultural sector and details how the
sector contributes to the broader South African economy. The fourth section explores the employer
profile which is based on the submitted ATR 2016/17 & WSP 2017/18 data, supplemented with data
from Statistics South Africa’s Quarterly Labour Force Surveys. Finally, the fifth section provides a labour
market profile, where the number and demographics of people employed in the sector are provided.
This chapter is intended to set the scene for the skills issues delved into in subsequent chapters.
1.1. SCOPE OF COVERAGE
Agriculture, in relation to skills development in the sector, only includes agricultural activities
concerned with resource production (primary) and some primary processing of food, aquaculture
and growing of trees as a secondary crop by farmers (secondary). The sector is divided into 41
subsectors that are classified according to their agricultural and economic focus. The table below
highlights the 11 subsectors and their Standard Industrial Classification (SIC) codes, as well as their
focus areas.
1TABLE 4: ACTIVITIES WITHIN THE AGRICULTURAL SECTOR BY SIC CODE
Subsector SIC Code SIC Description
SEED 11140 Seed production and marketing
PEST CONTROL 99003 Pest Control
FIBRE 30118 Grading, ginning and packing of wool and cotton raw material
TOBACCO 11142 Manufacture of tobacco products
62208 Processing and dispatching of tobacco
POULTRY 11220 Other animal farming, production of animal products (not
elsewhere classified)
11221 Ostrich farming
30114 Poultry and egg production including the slaughtering, dressing and
packing of poultry
AQUACULTURE 13000 Fishing, operation of fish hatcheries and fish farm
Milling, 30311 Manufacture of flour and grain mill products, including rice and
Pet Food & vegetable milling, grain mill residues
Animal Feed 30330 Manufacture of prepared animal feeds
30331 Manufacture of pet foods
30332 Manufacture of starches and starch products
SUGAR 11122 Sugar plantation including sugar cane and sugar beet etc.
30420 Manufacture of sugar including golden syrup and castor sugar
HORTICULTURE 11120 Growing of Vegetables, Horticultural specialties and nursery
products
11121 Growing of Vegetables, Horticultural specialties (Including
Ornamental Horticulture)
and nursery products.
11130 Growing of fruit, nuts, beverage, and spice crops.
11301 Growing of coffee and tea including coconuts, cocoa, nuts, olives,
dates, etc.
12109 Growing of trees as second crop by farmers
30132 Fruit packed in cartons, fruit juice concentrate drummed and fruit
juice in container
ready for consumption
30133 Fruit exporters and importers
30493 Processing and marketing of coffee and tea including coconuts, cocoa,
nuts, olives, dates, etc.
62112 Service to nut farmers and companies
GRAINS & 11110 Growing of Cereals and other crops (not elsewhere classified)
CEREALS 30300 Manufacture of grain mill products and starches
30313 Handling and storage of grain
61502 Wholesale & retail trade in Agricultural machinery
62111 Sale and distribution of Agricultural raw materials and other
farming inputs
RED MEAT 11141 Production and animal products (not elsewhere classified)
11210 Farming of cattle, sheep, goats, horses, asses, mules, and hinnies;
Dairy farming.
211222 Game farming
11300 Growing of crops combined with farming of animals (Mixed
farming)
11400 Agricultural and animal husbandry services, except veterinary
activities
11402 Other animal farming (not elsewhere classified)
30115 Production, sale & marketing of Agricultural by products (e.g.
bones, hides)
30117 Slaughtering, dressing and packing of livestock, including small
game for meat and
processing of ostrich products
61210 Wholesale trade in Agricultural raw materials and livestock
74136 Transport of livestock as supporting activity
87120 Agricultural and livestock research
Source: AgriSETA, 2016.
These subsectors are classified into 11 subsector committees, which represent their industry
interests to AgriSETA. They include: 1) Milling, Pet Food and Animal Feed; 2) Seed; 3) Sugar; 4)
Pest Control; 5) Tobacco; 6) Aquaculture; 7) Grains and Cereals; 8) Fibre; 9) Poultry; 10) Red
Meat; and 11) Horticulture. The graph below indicates the relative size of membership numbers
by subsectors, as captured in the AgriSETA member database for 2016.
FIGURE 1: DISTRIBUTION OF AGRICULTURAL ENTITIES BY SUBSECTOR
Tobacco (0%)
Pest control (1%)
Seed (1%)
Sugar (1%)
Milling, Petfood, Animal Feed (2%)
Poultry (2%)
Aquculture (5%)
Fibre (9%)
Grains and Cereals (10%)
Horticulture (24%)
Red meat (45%)
Source: AgriSETA member database, 2016
AgriSETA generates its revenue from Skills Development levies. Currently, there are only
19,834 employers registered with AgriSETA, while there are reportedly over 40,000 commercial
farmers registered for Value Added Tax (VAT) in the sector. This means that just under half of
commercial farming units are contributing towards skills development in the sector, placing a
fair degree of strain on available resources. In order for skills development interventions to
reach a broader base, multiple resources need to be channelled into skills development
interventions.
31.2. KEY ROLE-PLAYERS
There are a number of public and private key role-players in the agricultural sector which
contribute towards its functioning, including: national government departments, sector
representatives and industry bodies. For the sake of brevity, the table below groups these role-
players according to their strategic contribution to the sector.
Please note that while as comprehensive as possible, this list is not exhaustive.
TABLE 5: KEY AGRICULTURAL ROLE-PLAYERS
Strategic Department or Relevance to agricultural skills
contribution organisation development
Skills Development Department of Basic Quality of education of entrants to
and Research Education labour market, career awareness
programmes to expose agriculture as
a possible career choice
Department of Higher Responsible for TVETs, HETs,
Education and Training agricultural colleges and skills
development. Sets the national skills
development agenda through
regulation of SETAs.
Statistics SA Provision of updated statistics on
agricultural sector economics &
labour force.
Agricultural Research Scientific research on agricultural
Council production issues.
National Wool Growers The three elements of the Fibre
Association, Mohair SA, Subsector are organised into industry
Cotton SA, Cape Mohair associations that engage with other
and Wool bodies and export markets on behalf
of its members.
Mobile Agricultural Skills Non-Profit Company (NPO) providing
Development and comprehensive and ranging support
Training (MASDT) services in agriculture to emerging
farmers in remote rural areas, in
particular to Small Medium
Entrepreneurs (SMEs).
Developing Poultry Caters to the needs of smallholder
Farmers Organisation and emerging farmers by addressing
(DPFO) issues affecting the poultry industry.
Strategy and Department of Trade and Industrial strategy, international
Policy Industry & Provincial trade agreements, agricultural sector
Departments of Economic strategy and policy implementation
Development desk.
Department of Sector regulatory framework,
Agriculture Forestry and strategy and leadership, provision of
Fisheries extension services, Broad Economic
Empowerment funding of
4development interventions including
provision of bursaries for scarce skills.
National Treasury & SARS Financial planning, incentives,
accountability of Land Bank, skills
levies.
Planning Department of Labour Labour legislation, wage
determinations, employment equity
Department of Economic Sector economic strategies
Development
National Planning Identification of inter-departmental
Commission overlaps and gaps
Department of Policy and guidelines on environment
Environmental Affairs protection and natural resource
management, partner in
environmental education
Department of Transport Planning for transport needs in rural
areas
Rural Development Department of Rural Partnering with AgriSETA in
and Land Reform Development and Land mobilising funds for capacity building
Reform of claimants.
Department of Linking agricultural and rural
Cooperative Governance development to IDPs and LED,
and Traditional Affairs & infrastructure and services to
Municipalities agricultural enterprises
Services Department of Water Water Boards manage local irrigation
Affairs schemes
Department of Energy Strategy to supply electricity to rural
areas
South African Police Collaboration with agricultural
Service community to address issues of farm
security, including attacks, stock and
property theft
Credit and assistance Land and Agricultural Financial services to commercial
Development Bank of farming sector, agribusiness, and
South Africa emerging farmers.
Micro-Agricultural Production loans
Financial Institutions of to smallholder operators
South Africa (MAFISA)
Union and Sector Agri South Africa (AgriSA) Agricultural Union serving some 32
representatives 000 large and small commercial
farmers.
National African Farmers’ Represents black farmers to level the
Union of South Africa field in all agricultural matters.
(NAFU)
5The African Farmers’ Represents commercial African
Association of South farmers to bring black commercial
Africa (AFASA) farmers into mainstream
agribusiness.
Transvaal Agricultural A national agricultural
Union South Africa (TAU union serving commercial farmers
SA)
South African Poultry Serves as an industry collective voice
Association (SAPA) to the public and government.
Plays an active role in protecting the
industry from foreign “dumping” of
poultry.
National Chamber of Represents the milling industry in
Milling South Africa. Directly represents 20
milling companies in South Africa, but
also have associate members
(business partners in the milling
industry).
South African Pest Control Engage with farmers, create
Association (SAPCA), awareness of the importance of
African Farmers compliance, promotion of dedicated
Association of South skills development interventions
Africa (AFASA), National relating to pest control on farms
African Farmers Union in
South Africa
Agribusiness Agricultural Business Fosters a favorable agribusiness
Chamber environment
Grain SA Conglomerate organization providing
commodity strategic support and
services to South African grain
producers to support sustainability.
AgriSA Promotes the development,
profitability, stability and
sustainability of Agriculture in South
Africa by means of its involvement
and input on national and
international policy and the
implementation thereof.
Red Meat Industry Forum Represent Red Meat industry to
(RMIF) negotiate for enabling regulatory
environment and assist in formulating
relevant industry policies and
strategies and facilitate the
compliance to legislation.
It is an umbrella council consisting of
members that represent the interests
of sector specific organisations.
6Source: 2015 GCIS Handbook, Agriculture and AgriSETA SSP 2011-2017
1.3. ECONOMIC PERFORMANCE
Agriculture accounts for 2.4% of gross domestic product (GDP) and 4.4% of total
employment (IRR, 2016). The contribution by sector for the fourth quarter of 2017 is shown in
Figure 2 with Agriculture, Forestry and Fishing industry, the largest positive contributor to
growth in GDP, an increase of 37.5% and a contribution of 0.8% to overall SA GDP growth in
the quarter; this was largely as a result of higher production of animal products. Similarly, the
agricultural industry recorded one of the largest growth in employment, accounting for 39 000
employment in the 4th quarter of 2017 (STATSSA, 2017).
FIGURE 2: CONTRIBUTION TO GDP BY SECTOR, Q4 2017
Electricity,Gas and Water (2%)
Agriculture, Forestry and Fisheries (3%)
Personal Services (6%)
Mining (9%)
Transport, Storage and Communication (10%)
Manufacturing (14%)
Trade, Catering and Accommodation (16%)
Government Services (17%)
Finanace, Real Estate and Business Services (23%)
Source: StatsSA, 2017, Gross Domestic Product
The reported number of commercial farmers in South Africa varies. AgriSETA (2016) reports
that there are over 40,000 commercial farmers registered for VAT with SARS. Of this number
fewer than 2,500 reportedly produced more than half of gross farm income (Kane-Berman,
2016). This means as a sector, most agricultural enterprises are small in size, with a few large
players making up the lion’s share of GDP contributions. Most commercial farms have an
annual turnover of less than R1 million, which is borne out in the WSP data, which this year
reports that of the 19 834 AgriSETA members, 17,475 are categorised as small, (1-49
employees) while only 698 members are categorised as large (more than 149 employees).
AFASA says a third of its 10 000 members, spread across livestock, field crops, and
horticulture, are “farming for the market,” but that only 2% of them are doing so successfully
(Kane-Berman, 2016). Thus, many South African farms are hand-to-mouth operations,
regardless of their categorisation as ‘subsistence’ or ‘smallholder’, and require significant
support to become sustainable. Those farmers categorised as ‘emerging’ are attempting to
graduate from small-scale farming to commercial, but again require support in the form of
development finance, managerial mentoring and enterprise development. The reported
number of emerging farmers ranges from 50,000 to 120,000 (IRR, 2016), and some of the
biggest numbers of emerging farmers are in timber and sugar. These remarks point to the need
for skills development in the agricultural sector, to bolster existing farming concerns, as well as
7bringing new skills into the industry. The effect of shifts in land reform for rural skills
development will be taken up in chapter 2.
The value of primary agriculture production in South Africa accounted for R273 million in
2016/17, compared to R243 million in the previous year – an increase of 12.5%. The increase
can be attributed to an increase in the value of field crops and animal products. Overall, income
from all agricultural products by 10.2% from R242 million in 2015/16 to R267 million in
2016/17. Similarly, the increase can be attributed to field crops which increased by 24.2% to
R64 million for the year ended June 2017 (DAFF, 2017). Maize remains the most prominent
field crop in South Africa. The maize industry contributes 0.4% to the national GDP and the
industry is interlinked with many industries in the manufacturing sector.
The gross value of animal products, horticulture products and field crops contributed 46.5%,
27.7% and 25.8%, respectively to the total value of gross value agricultural products. The
poultry meat industry made the largest contribution, followed by cattle and calves slaughtered,
with 12.5% and maize with 10.7%.
One of the key factors underlying consumer trends has been the growth of disposable
income in South Africa. This is reflected in the increase of red meat product consumption over
the last couple of years. However, given the highest unemployment levels since the 2008-09
recession (in excess of 27 percent in the second quarter of 2017), a weak rand and the worst
drought in 23 years, and a weaker commodity prices have converged to decreased overall
consumer spending. With that said, Business Monitor International (July, 2016) holds a mixed
outlook for the South African agricultural market. This is due to the effects of the drought and
El Niño on corn and wheat. The weak rand, weather volatility and falling farm incomes are
forecast to exert downward pressure on the market. However, in the longer term it is predicted
that revenue in the sector will be boosted by a growth of about 40% from food consumption
due to the growth of the middle class and disposable incomes. BMI estimates that annual food
consumption revenue will reach over R609 billion in 2018.
The agricultural sector contributed approximately 12% to South Africa’s total export
earnings in 2016/17 (Export.gov, 2017). South Africa imported $7 billion in agricultural and food
products between 2016 and 2017. The major agricultural products imported by the country
included rice ($424 million) and wheat ($367 million). Due to the severe drought in the 2015/16
season, which decreased production by almost 50%, imports of more than three million tons
of maize were needed to fulfil local demand (Export.gov, 2017).
The mohair industry is reported to be the largest in the world, accounting for 53% of total
global production in 2016 (NDA, 2016). All mohair produced is exported. Similarly, the majority
of the annual wool clip and cotton lint is also exported. South Africa also produces 20% of the
total meat produced on the African continent, accounting for 1% of global meat production.
South Africa is also by far the largest pet food manufacturer in the Middle East and Africa,
accounting for more than half of the sales of the region (Global Pets, 2016). Euromonitor
International forecast that value sales of pet food in South Africa will expand by 12% at 2015
prices, between 2015 and 2020. According to the Industrial Policy Action Plan (IPAP), South
Africa also possesses a competitive advantage in a number of fruit and beverage subsectors.
8Products from subsectors such as wines, indigenous Rooibos and Honeybush tea, and certain
fruits are highly sought after in export markets. Similar to the consumer trends observed in the
domestic consumption of red meat, exports of subtropical fruit and tree nuts are increasing at
a rapid rate, as middle-income consumers in developed markets are demanding more variety.
An analysis of the fruit and vegetable market also revealed that over a five year period up to
2019, the highest expected growth for the fruit and vegetable market will take place in Asia
Pacific, with 6.4% year-on-year growth, followed by Europe with 4.4% and the US with 2.2%
(Farmers Weekly, 2016).
In the 2015/2016 financial year corn production was expected to decline by 38.8% and sugar
production to decline by 20.2% due to the severe drought and El Niño. However, poultry
production will increase by 1.2% and pork production will rise by 2.1%. Until two years ago, the
poultry industry was one of the largest agricultural sectors in South Africa, with an estimated
value of R51 billion a year (Willemse, 2017). The decline in the poultry in more recent years can
be largely attributed to the enormous volumes of below-cost poultry being imported into the
country. (Willemse, 2017). The effect of the drought and climate change on skills development
will be taken up in Chapter 2.
1.4. EMPLOYER PROFILE
The AgriSETA members’ database includes some 19,803 employers. A total of 17,118
employers are categorised as small, (1-49 employees), 1,601 are medium (50-149 employees)
while only 653 members are categorised as large (more than 149 employees). Among
registered employers, there were 13,946 employers in the primary sector, most of them small
companies. The primary sector constitutes 70 % of all registered employers, followed by fibre
(11%) and red meat (6 %). The sugar, coffee/tea and tobacco subsectors have the fewest
registered employers, jointly accounting for about 1% of all registered employers in the sector.
The provincial distribution of employers registered with AgriSETA is reflected in the pie chart
below, with provincial distribution by employer size in the figure below.
FIGURE 3:PROVINCIAL DISTRIBUTION OF EMPLOYERS REGISTERED WITH AGRISETA
Eastern Cape (9%)
Free State (7%)
Gauteng (17%)
Kwazulu Natal (14%)
Limpopo (1%)
Mpumalanga (12%)
North West (3%)
Northern Cape (8%)
Western Cape (29%)
Source: AgriSETA members’ database (WSP 2017/18 & ATR 2016/17)
9What is shown in the figure above is that the Western Cape at 29% is the most represented
province in the AgriSETA membership database, followed by Gauteng (17%), KwaZulu-Natal
(14%) and Mpumalanga (12%), and the Eastern Cape, Northern Cape and the Free State 9%, 8%
and 7%, respectively. The lowest number of AgriSETA members ranged between 3 % for
Northwest and 1% for Limpopo province. The AgriSETA database does not represent all farming
enterprises in the country, and thus must be treated with a fair degree of caution when
applying it to a national context. For instance, Limpopo is a known farming province, but is
underrepresented in AgriSETA numbers. Nevertheless, there is significant number of
stakeholders expressing an interest in skills development in the agricultural sector.
What these figures reveal is that AgriSETA needs to meet the needs of two distinct
constituencies: top levy payers and small-scale farmers. The needs of a large commercial farm
differ from those of a subsistence farmer. There is a need to work towards supporting the skills
development needs of top levy payers because of their large contributions and ability to absorb
labour, but there is also a democratic responsibility towards ensuring that the large majority of
small-scale farmers attain skills that make them sustainable for the sake of the food security of
their communities. These issues are further taken up in chapter 2.
1.5. LABOUR MARKET PROFILE
Turning from the employer profile, the focus will now be at the employee profile of the
agricultural sector. The labour market trends presented here have largely been drawn from
AgriSETA WSP and membership databases supplemented with data from the quarterly Labour
Force Survey (QLFS) data from StatsSA. It is important to recognise the limitations of both these
datasets so that unfounded extrapolations are not made.
The QLFS data does not distinguish between employment figures for agriculture, forestry
and fisheries or between the informal and formal sectors. Data for domestic workers is
aggregated with agricultural data and the data only reflects the economically active population
between the ages of 15 and 64. Where possible, this data will be compared to the AgriSETA
WSP data, which is also limited in its scope in that it only represents about 10% of employers
affiliated with the SETA.
South Africa recorded an unemployment rate of 24.5% in the fourth quarter of 2015 (narrow
definition) (StatsSA, QLFS, Q4, 2015). If people who are no longer actively seeking work are
included, the broad unemployment rate rises to 35.22% (StatsSA, QLFS, Q4, 2015). South Africa
now has a NEET (not in employment, education or training) youth population of approximately
3, 4 million people. The sheer scale of the crisis demands each and every sector’s involvement
and the particular impact of this youth bulge is addressed in chapter 2.
Over the twelve-month period from January 2015 to January 2016, employment in the
agricultural sector decreased from 891 000 to 877 000. Departing from this downward trend,
the QLFS conducted by StatsSA in the first quarter of 2016 put the agricultural sector amongst
the few industries that experienced a quarterly increase in employment levels (16,000
employment opportunities were observed). BMI has attributed some of this growth to huge
sums being invested in the “Proudly South African” food campaign to encourage consumers to
buy domestically grown and produced goods.
101.5.1. Provincial distribution of employees
The table below indicates that the Western Cape has the highest number of agricultural
employees at 215 000, this is followed by KwaZulu-Natal at 141 000 employees and Limpopo
at 140 000 employees (StatsSA, 2017). There has been growth in employment in other sectors
except in the agricultural sector (Quarterly Labour Force Survey, Quarter 1, 2017).
TABLE 6:DISTRIBUTION OF EMPLOYEES BY PROVINCE IN AGRICULTURE, FORESTRY AND
FISHERIES
Province 2010 2011 2012 2013 2014 2015 2016 2017
Western 135 107 000 142 000 162 131 000 214 000 228 000 215 000
Cape 000 000
Eastern Cape 66 000 63 000 58 000 67 000 88 000 89 000 95 000 87 000
Northern 54 000 57 000 48 000 45 000 60 000 43 000 40 000 47 000
Cape
Free State 63 000 62 000 62 000 70 000 54 000 64 000 72 000 70 000
KwaZulu 114 95 000 98 000 96 000 102 000 141 000 136 000 141 000
Natal 000
North West 35 000 33 000 32 000 42 000 42 000 57 000 54 000 50 000
Gauteng 31 000 74 000 51 000 53 000 55 000 34 000 37 000 36 000
Mpumalanga 81 000 84 000 106 000 77 000 89 000 92 000 95 000 89 000
Limpopo 70 000 94 000 121 000 102 121 000 126 000 120 000 140 000
000
Total 649 671 000 718 000 713 742 000 860 000 877 000 875 000
000 000
Source: Statistics South Africa, 2017. Quarterly Labour Force Survey.1st Quarter 2017
These employment statistics reveal a bias in AgriSETA WSP data, where Limpopo was shown to
have a minimal employer profile. What this QLFS data indicates is there is room for substantial
engagement with Limpopo, to up their provincial contribution towards skills levies, thereby
increasing the skills resources pool across the board.
1.5.2. Gender
The figure below gives the breakdown of the agricultural sector by gender as reported in the
fourth quarter of 2017 (StatsSA, QLFS, Q4, 2017):
FIGURE 4:GENDER DISTRIBUTION OF LABOUR IN THE AGRICULTURAL SECTOR
80%
70%
60%
50%
40%
30%
20%
10%
0%
Female Male
2016 33% 67%
2017 31% 69%
11Source: Statistics South Africa, 2017. Quarterly Labour Force Survey, 4th Quarter 2017
The male to female percentage for agricultural labour was found to be 31% for females and
69% for males, as indicated above.
1.5.3. Race
WSP (2017/18) data reveals that black Africans comprise the majority of employees in the
sector at 64%, followed by Coloured employees at 23% and whites representing 12% of the
agricultural workforce. Asians only represent 1% of workers in the agricultural sector.
FIGURE 5: EMPLOYEES BY RACE
Indian/Asian (1%)
White (12%)
Coloured (23%)
African (64%)
Source: AgriSETA WSP Submissions, 2017/18
WSP data from all the subsectors shows only 601 employees with disabilities out of 244,224
employees within large Agricultural enterprises were selected for training.
1.5.4. Age
Half of the people employed in the agricultural sector by employers submitting WSP, are
between the ages of 35 and 55. Young people below the age of 35 constitute 42% of people
employed whilst 8% are above the age of 55. In total, 92% of the workers are below the age of
55.
These demographic realities were validated in interviews with stakeholders, who all
commented on the need for skills transfer from those exiting the workforce to those coming
up the ranks. The issue of unskilled youth presents a difficulty for skills transfer, because some
base level qualification is needed to enter the skilled workforce in the first place. This presents
challenges for skills development, because of the double hurdle of experienced employees
exiting at a rate not able to be matched by the numerous youth demographic. Analysis of WSP
submissions by employers in 2016 shows that the majority of employees are in the primary
subsector (48%) followed by the grain subsector (11%) and poultry at 19% each. Coffee & tea,
sugar and fibre subsectors have the least representative of workers.
121.5.5. Occupational categories
This chapter concludes by looking at the reported existing skills levels in agricultural
enterprises as reported in WSPs for 2017. The necessary skills vary from highly skilled
managerial and professional occupations to fairly low level skills for elementary occupations.
The majority of the workforce comprises elementary occupations, while managers comprise
7% of the workforce.
FIGURE 6:EMPLOYMENT CATEGORIES WITHIN LARGE ORGANISATIONS
Managers 7%
Professionals 4%
Technicians and Associate Professionals 7%
Clerical Support workers 9%
Services and Salesworker 12%
Skilled Agricultural and related Trade workers 0%
Craft and related trade 10%
Plant and Machine operators 7%
Elementary Occupationa 44%
Source: AgriSETA WSP Submissions, 2017/18
1.6. CONCLUSION
Having a firm sense of the agricultural sector’s contribution to the economy in terms of
production and employment, we can now more readily identify key skills issues that speak to
this economic reality. The remainder of this document covers the following issues that speak
to Sector Skills Planning. Chapter 2 identifies key skills issues as framed by government
legislation, policies and frameworks, and identifies key macro socio-economic and
environmental factors that function as key change drivers in addressing skills development in
the agricultural sector.
Where Chapter 2 offers a high-level overview and Chapter 3 becomes much more granular.
In chapter 3, the mismatches between the occupational shortages and skills gaps in the sector
are examined by drawing on the views of industry stakeholders and validating these views
through secondary data analysis. Chapter 4 points to key partnerships in the sector, examines
existing partnerships and asks what future partnerships might be necessary to address the skills
gaps identified in Chapter 3. The final chapter draws together these macro and granular skills
issues and asks what the key skills priorities should be for AgriSETA over the next five years.
These priorities will act as a guiding set of objectives that will inform the planning processes of
the AgriSETA’s annual performance and strategic plans, where they will be quantified and
operationalized.
13You can also read