POWER AFRICA GAS ROADMAP TO 2030 - usaid
←
→
Page content transcription
If your browser does not render page correctly, please read the page content below
POWER AFRICA GAS ROADMAP TO 2030
ACKNOWLEDGEMENT
Many individuals and organizations contributed to the development of this
Power Africa Gas Roadmap. This strategy blends the ideas, input, and vision
from a wide range of Power Africa’s many partners, including those serving
in U.S. Government agencies and posts across sub-Saharan Africa, the
private sector, international finance institutions, and other partners.
In particular, we would like to extend a special thanks to the following
people outside of the U.S. Government, who provided detailed input and
insight: Adrian P. Hamra–ExxonMobil; Robert Appelbaum, John Smelcer,
Gibbs Johnson–Webber Wentzel; Angelo Madera, Alessandro Gelmetti,
Nadira Haraigue–Eni; Kribs Govender–Sasol; Marcel Bruhwiller–
International Finance Corporation; Jeffrey Krilla–Kosmos Energy; Frederik
Smits van Oyen–Cheniere; Katan Hirachand–Société Générale; Paul
Eardley-Taylor–Standard Bank; Ross Boyd–General Electric.
Finally, a special acknowledgement to all of the staff across U.S.
Government agencies and departments involved in developing this
Power Africa Gas Roadmap.
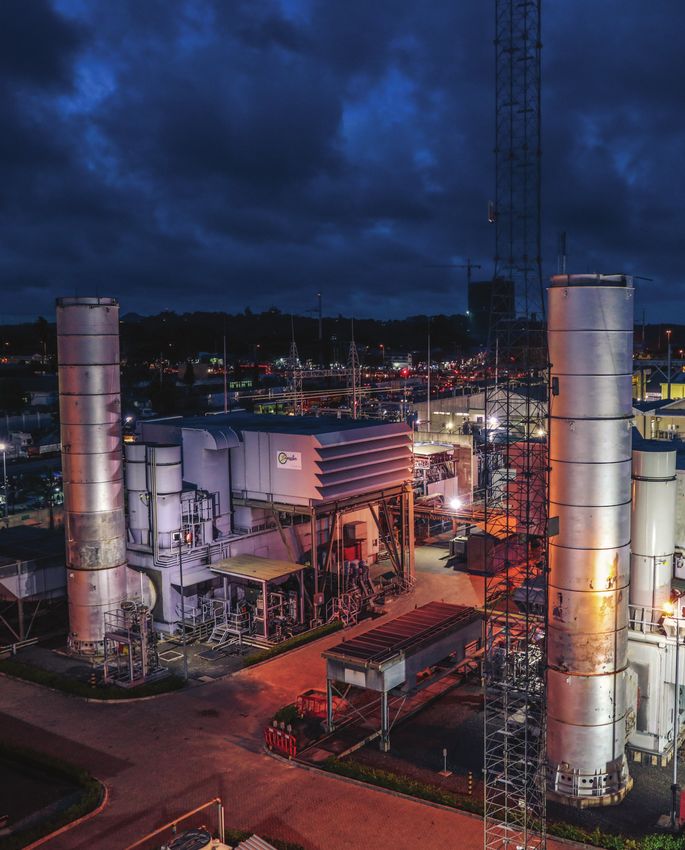
Cover: The 180 MW Songas Ubungo generation plant in Dar es Salaam, Tanzania, supplies nearly one-quarter of the country’s
electricity and uses the country’s own natural gas resources (Photo: Songas/Globeleq)
ii POWER AFRICA I GAS ROADMAP TO 2030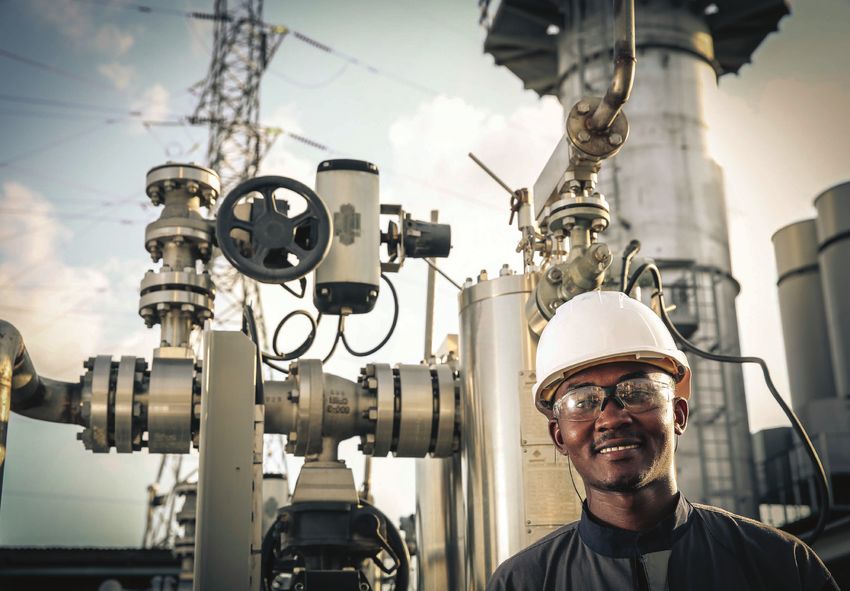
TABLE OF CONTENTS
                          5 Executive Summary               		 13 Catalyzation Impact
    2                     9 Introduction                    		 13 Diversification and Flexibility
    FOREWORD              9 Power Africa’s Focus on Gas     13 The Global LNG Market:
                         		 9 Resource Potential            		 Why Imported LNG Now
    3                    		 11 Economics                    		 Makes Sense for Africa
    PREFACE              		12 Momentum                      15 Advancing U.S. Policy Goals

                         16 Power Africa’s Gas Strategy     		28 Nigeria (4,490 MW)
                         18 Challenges                      		31 Senegal (433 MW)
                         		 18 Overarching Challenges       34 East Africa (1,720 MW Goal)

    16                   		 18 Country and Regional         		 and Southern Africa
                         		    Challenges                   		 (4,365 MW Goal)
    REACHING OUR GOALS                                      		35 Kenya (550 MW)
                         19 Regional Dynamics
    THROUGH GAS                                             		37 Tanzania (1,170 MW)
                         20 West Africa (7,749 MW Goal)
                                                            		40 Angola (600 MW)
                         		 21 Côte d’Ivoire (1,271 MW)
                                                            		43 Mozambique (915 MW)
                         		 24 Ghana (1,555 MW)
                                                            		48 South Africa (2,850 MW)

    52                   54 Gas Monetization               57 Gas Opportunity Matrix
    OPPORTUNITIES FOR    56 Exporting LNG to sub-Saharan
    U.S. COMPANIES       		Africa

    58
    CONCLUSION

    59                   59 APPENDIX A                     62 APPENDIX C
    APPENDICES           		 Defining the Roadmap           		 Development Partner Activities
                         60 APPENDIX B                     69 APPENDIX D
                         		 Understanding Gas-to-Power     		Acronyms
                         		 Project Dynamics

                                             POWER AFRICA I GAS ROADMAP TO 2030                     1
FOREWORD BY RICK PERRY
     UNITED STATES SECRETARY OF ENERGY
                               On my childhood farm in rural Texas, my family had a small windmill that would,
                               on windy days, provide power for a few short hours. There was no predicting
                               when the lights might be on, or when critical machinery might work. For years,
                               our farm’s production efficiency, not to mention quality of life, was at the whim
                               of the wind.

                              Today, a similar lack of reliable electricity impacts millions of people across
                              Africa. I know firsthand from my engagements on the continent that the energy
                              challenges of African nations are real. However, I also know that the solutions
                              are real, and that the United States is committed to partnering with our allies
     in Africa to power businesses and schools, homes and clinics, and family farms much like the one where I
     was raised.

     A key ingredient in Africa’s energy mix is, and will continue to be, clean natural gas. Natural gas and
     liquified natural gas (LNG) projects have the potential to generate essential electricity quickly, and at
     reasonable prices. Gas-fired power plants also work well alongside other generation technologies, and
     their replacement of fuels like diesel and kerosene contributes to a healthier environment.

     This Power Africa Gas Roadmap underscores how the United States can help advance gas sector
     investment in several countries, as well as how the export of LNG and related innovation from the
     United States can spur gas-to-power development across the continent. It is also a perfect companion to
     the Understanding Natural Gas and LNG Options handbook developed by the U.S. Department of Energy
     and the U.S. Energy Association, with support from Power Africa.

     The United States’ position as a leader in the global gas market creates an ideal synergy for American
     and African companies to work together on gas export and import projects. Already, many gas-to-power
     projects in Africa utilize parts and technology designed and built in the United States, and nearly all large-
     scale LNG facilities in operation use liquefaction processes licensed and developed in the United States.

     The Power Africa Gas Roadmap also exemplifies the United States’ drive towards energy security and
     shared prosperity for our partners and allies. This Roadmap is a critical tool for the United States to
     achieve its National Security Strategy goal of attaining “universal energy access to lift people out of
     energy poverty and foster economic development” and involves using our abundant energy resources
     to support self-reliance, competitive markets, and stability around the world. America, as an energy-
     dominant nation and global leader, will continue to export resources, knowledge, and tools to boost
     energy markets across the globe.

     Through Power Africa and other initiatives, the United States is investing in infrastructure, technology,
     and services that will change lives and charge economies. Together, we are helping our partners in Africa
     generate new power through mutually beneficial and sustainable energy development.

     I am confident that the guidance and direction charted in this Power Africa Gas Roadmap will accelerate
     the advancement of our shared goals.

2   POWER AFRICA I GAS ROADMAP TO 2030
PREFACE BY MARK GREEN
USAID ADMINISTRATOR
                          When I ended my service as U.S. Ambassador to Tanzania in 2009, the
                          population of Africa had just passed one billion people. By the year 2050, it will
                          be double that.

                          No amount of government intervention alone can possibly create the jobs
                          necessary to employ so many people. Only entrepreneurialism and private-
                          sector growth have the potential to lift people out of poverty on that scale. This
                          Roadmap illustrates how gas not only can power current industries today, but also
                          generate entirely new ones tomorrow — which will provide millions of jobs.

By focusing on Africa’s vast natural gas reserves, riding the momentum of growth in market demand and
leveraging private sector investment, USAID and Power Africa expect to make substantial progress in
promoting Africa’s resilience and self-reliance in the coming years. This will improve regional stability, as
African economies continue to grow and expand, and create opportunities for young people.

The Power Africa Gas Roadmap will support America’s economic prosperity by expanding the number
of American firms that work in Africa with expertise in this abundant fuel. Power Africa is committed to
strengthening U.S. engagement and leadership in Africa as we work to foster free and open markets, and
promote sustainable and transparent enabling environments for business.

Power Africa and natural gas are a classic win-win, and I look forward to being a part of it.

                                                                 POWER AFRICA I GAS ROADMAP TO 2030             3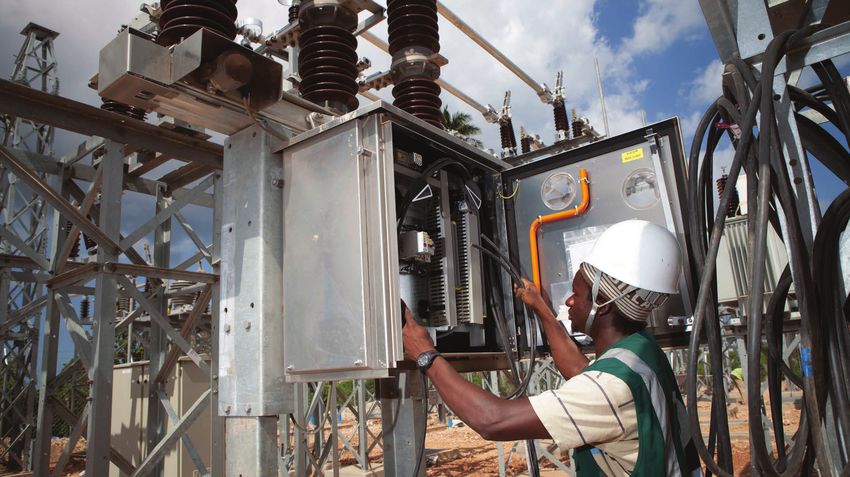
The Songas integrated gas-to-electricity facility in Tanzania includes a gas processing plant, transportation pipeline and power plant. Photo: Globeleq

4             POWER AFRICA I GAS ROADMAP TO 2030
EXECUTIVE SUMMARY
In the Power Africa Roadmap, published in 2016, we illustrated how the collective
effort of Power Africa’s public and private sector partners were working
together to achieve an ambitious goal of adding 30,000 megawatts (MW) of
new electricity generation capacity and 60 million new connections by 2030.
Since we released the Roadmap, Power Africa has                 Power Africa sees five key reasons to focus on gas:
expanded to more than 160 partners, including new
government and donor partners, and even more of the             1. RESOURCE POTENTIAL: Based on known reserves,
world’s top energy and technology companies.                       there is potential for approximately 400 gigawatts (GW)
                                                                   of gas-generated power in sub-Saharan Africa.
This Power Africa Gas Roadmap builds on the Power Africa        2. ECONOMICS: With the drop in global prices, the use
Roadmap to outline a plan for achieving up to 16,000 MW            of gas has become more attractive, and could replace
of additional gas-fired power generation in sub-Saharan            more expensive fuel sources, thus reducing the cost
Africa by 2030, which is over 50 percent of Power Africa’s         of energy. With lower prices, businesses can thrive and
topline goal. Exhibit 1 illustrates the anticipated impact of      more people can have access to electricity. In addition,
Power Africa support for gas-to-power projects.                    carbon emissions from natural gas usage is much
                                                                   lower than emissions from coal and oil-based fuels like
                                                                   kerosene, diesel, gasoline, and heating oil, as well as
 EXHIBIT 1                                                         burning biomass for cooking.
 ANTICIPATED, CUMULATIVE IMPACT                                 3. MOMENTUM: Many African countries are actively
 OF GAS INTERVENTIONS BY 2030
                                                                   pursuing programs to grow their gas economies. Not
  Megawatts
 18,000                                                            just gas-to-power, but also industrial and transport gas
                                                                   markets.
 13,500
                                                                4. CATALYZATION IMPACT: Decreasing the risk of
   9,000                                                           new projects by improving returns for upstream gas
                                                                   production and proving viability can create stronger
   4,500
                                                                   markets for gas.
        0
              2019      2020        2025        2030            5. DIVERSIFICATION AND FLEXIBILITY: Gas-fired
                                                                   plants complement the generation profiles of renewable
                                                                   sources, thereby increasing the reliability and availability
                                                                   of power.

                                                                       POWER AFRICA I GAS ROADMAP TO 2030                         5
The Power Africa Gas Roadmap provides a comprehensive                                             actively pursuing programs to grow their gas economies
    framework for defining and coordinating gas-to-power                                              through the development of industrial and transport gas
    activities supported by Power Africa and partners                                                 markets, in conjunction with gas-to-power programs.
    through 2030. This Roadmap is designed to optimize and
    leverage Power Africa’s key strengths to achieve a discrete                                       If planned facilities are completed, gas could become
    and measurable set of objectives. Although constraints                                            the dominant fuel for generating power in Africa.3
    and bottlenecks to the development of gas-fired power
    generation still exist, new gas discoveries–in combination
    with advances in technology and increasing activity from                                          FOCUSING SUPPORT
    domestic and international investors–have produced the                                            While Power Africa supports gas-to-power projects across
    conditions for an “African Gas Revolution.”1 Power Africa is                                      sub-Saharan Africa, this Gas Roadmap focuses on nine,
    uniquely positioned to achieve this revolution and drive real                                     strategically selected countries, highlighted in blue in
    outcomes in sub-Saharan Africa’s gas-to-power markets.                                            Exhibit 2:

                                                                                                        •      Côte d’Ivoire              •      Ghana              •      Nigeria
    THE GOAL
                                                                                                        •      Senegal                    •      Angola             •      Mozambique
    In the Power Africa Roadmap, we demonstrated how Power                                              •      South Africa               •      Kenya              •      Tanzania
    Africa’s innovative, private sector-led model is clearing
    hurdles and accelerating transactions of all types. The
    objective of this Gas Roadmap is to outline how Power
                                                                                                            EXHIBIT 2
    Africa and its partners can advance the current portfolio of
    gas projects toward financial close. The ambitious target of                                            GAS ROADMAP FOCUS COUNTRIES
    up to 16,000 MW is based on the projects that could likely
    reach financial close by 2030, taking into consideration:
    • the existing constraints in each of these countries; and
    • what Power Africa could potentially do in this period
      to assist in alleviating these constraints.

    GAS POTENTIAL IN AFRICA
    Gas resources have been identified in 14 countries
    in sub-Saharan Africa, with Nigeria accounting for 81
    percent of proven reserves. Several undeveloped fields in
    Mozambique and Tanzania account for 62 percent of total
    contingent resources.2 Other African countries without
    their own reserves will need to develop infrastructure
    for importation of natural gas to support local demand
    (power generation and other), which will require sufficient
    investment in upstream natural gas infrastructure.
    Already, several governments in sub-Saharan Africa are

    1 Castellano, A., Kendall, A., Nikomarov, M and Swemmer, T. (2015) Brighter Africa: The growth potential of the sub-Saharan electricity sector. [online] Available at: http://www.mckinsey.
      com/~/media/McKinsey/dotcom /client_service/EPNG/PDFs/Brighter_Africa-The_growth_potential_of_the_sub-Saharan_electricity_sector.ashx.
    2 Harnessing African Natural Gas: a new opportunity for Africa’s energy agenda? World Bank, 2014. http://documents.worldbank.org/curated/en/858091468203694236/
      Harnessing-African-natural-gas-a-new-opportunity-for-Africas-energy-agenda
    3 BP Energy Outlook 2017 (https://www.bp.com/content/dam/bp/pdf/energy-economics/energy-outlook-2017/bp-energy-outlook-2017.pdf)

6                POWER AFRICA I GAS ROADMAP TO 2030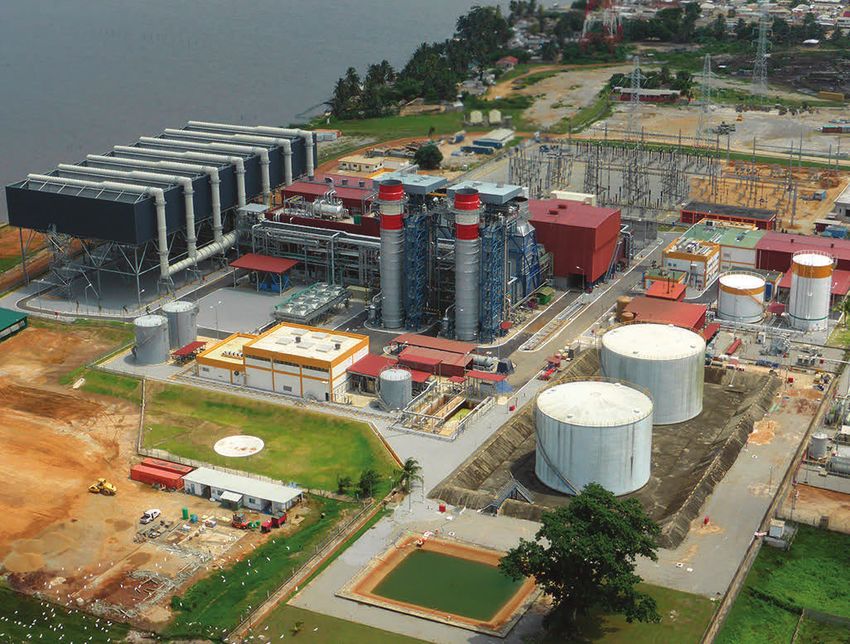
We estimate that these countries hold the potential                                       Due to gas-related regional dynamics, this Gas Roadmap
for around 16,000 MW (86 percent) of new gas-                                             groups focus countries into two regions: 1) West Africa,
fired power generation projects through 2030.                                             and 2) East and Southern Africa. The East and Southern
These focus countries were selected due to their relatively                               Africa countries are categorized together as they present
large populations, high gross domestic product (GDP), and                                 significant gas markets and gas supply options to each
either because they have local gas resources (in operation                                other for intra-basin or regional trade. For more details on
or under development) or are planning liquified natural gas                               analysis around Southern Africa’s regional trade potential,
(LNG) import projects. Exhibit 3 highlights the projected                                 please refer to Power Africa’s Southern Africa Gas Roadmap.
generation capacity in these focus countries through 2030.

 EXHIBIT 3

 PROJECTED GAS-FIRED GENERATION CAPACITY
 IN FOCUS COUNTRIES THROUGH 2030

 5,000

 4,000
 3,000

 2,000
 1,000

      0
            Angola          Côte           Ghana           Kenya      Mozambique Nigeria                Senegal          South        Tanzania
                           d’Ivoire                                                                                      Africa

INTERVENTIONS                                                                             • The availability of gas (both from a source as well as
                                                                                            delivery method perspective);
To ensure that future Power Africa interventions in the gas
                                                                                          • Financial strength of off-takers of power and gas;
sector are focused where they will deliver the maximum
impact, this Gas Roadmap analyzes the gas-to-power value                                  • Lag in downstream infrastructure, such as power trans-
chain, typical transaction structures, make-up of the tariffs,                              mission and distribution capacity; and
major constraints encountered by the market, and where                                    • The various markets’ ability to absorb power and gas.
Power Africa partner interventions are in place.4

By focusing on decreasing fuel costs, development costs,                                  Power Africa’s interventions will focus on
and the cost of capital, the best possible tariffs for the end
                                                                                          addressing the constraints related to gas
user can be realized. Power Africa’s interventions will focus
on addressing the constraints related to gas projects in sub-                             projects in sub-Saharan Africa.
Saharan Africa, including:

4 For more on gas-to-power transaction structures, see Understanding Natural Gas and LNG Options, the third volume in a series of handbooks Power Africa co-produced, following
  Understanding Power Purchase Agreements and Understanding Power Project Financing. https://energy.gov/ia/articles/understanding-natural-gas-and-lng-options

                                                                                                     POWER AFRICA I GAS ROADMAP TO 2030                                           7
The Top 8 strategic interventions (in no specific estimated cost for power project development that U.S.
order): companies could invest in or compete for is $175 billion,
1. Develop an Integrated Gas Economy Planning as outlined in Exhibit 4.
Tool for each country and region. The focus of the
tool will be on quantifying current and future market EXHIBIT 4
and supply options. ESTIMATED CAPITAL COSTS
FOR 16,000 MW SCENARIO
2. Develop and/or update Gas Master Plans
to ensure streamlining, relevancy and correct $113 billion $28 billion
implementation.
3. Update regulations and policies to fit the current
requirements to support the increase of gas in the
$175 billion
energy mix.
4. Strengthen the financial capacity and
creditworthiness of state entities.
$35 billion
5. Assist in increasing power transmission and
distribution capacity and reliability. Supply Demand Infrastructure
6. Create a simplified and streamlined protocol
for more efficient decision making within and A Gas Opportunity Matrix, describing all opportunities
among each of the various state entities and regulators for each focus country, is provided on page 57.
to provide certainty regarding approval and permitting
procedures for potential investors in the sector. It should also be noted that the relative proximity of various
sub-Saharan markets to the United States presents an
7. Review proposed LNG import projects
opportunity for U.S. LNG companies seeking to market
to determine, among other things, procurement
new liquefaction capacity to underpin multi-billion-dollar
process, optimal location, commercial structure, and
investments in new export projects. With the cost of
requirements for LNG volumes over time.
shipping U.S. LNG to sub-Saharan Africa being 20-40 percent
8. Assist development of CNG and small-scale lower than shipping LNG to North Asia, U.S. LNG projects
LNG projects to monetize local gas resources, as well are in a position to compete in the sub-Saharan Africa
as serve local demand centers. market. If 10 percent of the projected demand for gas in
Detailed interventions for each focus country are outlined Africa is supplied by imported LNG, the annual market value
in pages 21–51. for export is significant, as highlighted in Exhibit 5:6
EXHIBIT 5
OPPORTUNITIES FOR U.S. COMPANIES5
LNG EXPORT POTENTIAL
This Gas Roadmap highlights how the gas value chain in $Billions
6
sub-Saharan Africa has high potential, offering rich $5.20
5 $4.41
investment and export opportunities for U.S. companies,
4 $3.78
including the ability to on-shore additional manufacturing
jobs in the United States. U.S. companies have a long 3
history and deep experience in the global gas sector, and 2
are, therefore, well positioned for engagement. The total 1
0
2020 2025 2030
5 In November 2017, USTDA launched the U.S. Gas Infrastructure Exports Initiative to connect American companies to export opportunities across the gas value chain in emerging
economies. https://www.ustda.gov/program/us-gas-infrastructure-exports-initiative
6 Based on projections as per BP Energy Outlook 2017 (https://www.bp.com/content/dam/bp/pdf/energy-economics/energy-outlook-2017/bp-energy-outlook-2017.pdf) and a LNG
selling price of $7.00/MMBtu
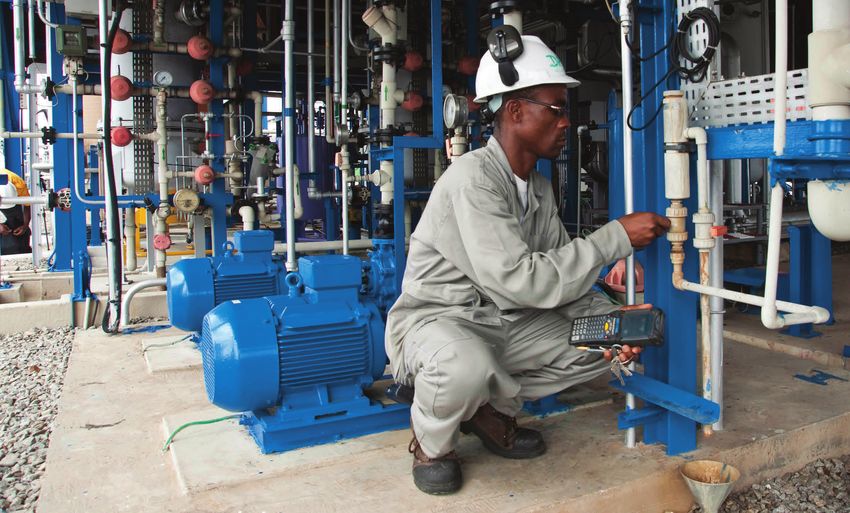
8 POWER AFRICA I GAS ROADMAP TO 2030Inspecting equipment at the 430 MW Azito facility near Abidjan, Côte d’Ivoire
INTRODUCTION 4. CATALYZATION IMPACT: Decreasing the risk of
new projects by improving returns for upstream gas
production and proving viability can create stronger
POWER AFRICA’S FOCUS ON GAS markets for gas.
Power Africa sees five key reasons to focus on gas: 5. DIVERSIFICATION AND FLEXIBILITY: Gas-fired
plants complement the generation profiles of renewable
1. RESOURCE POTENTIAL: Based on known reserves, sources, thereby increasing the reliability and availability
there is potential for approximately 400 gigawatts (GW) of power.
of gas-generated power in sub-Saharan Africa.
2. ECONOMICS: With the drop in global prices, the use
of gas has become more attractive, and could replace RESOURCE POTENTIAL
more expensive fuel sources, thus reducing the cost of Although gas resources have been discovered in 14
energy. With lower prices, African power sectors can countries, Nigeria accounts for 81 percent of proven
become more solvent, businesses can thrive, and more reserves; the three LNG-exporting countries–Nigeria,
people can have access to electricity. In addition, carbon Angola, and Equatorial Guinea–account for 92 percent.
emissions from natural gas usage is much lower than The huge undeveloped fields in Mozambique and Tanzania
emissions from coal and oil-based fuels like kerosene, account for 62 percent of total contingent resources.7
diesel, gasoline, and heating oil, as well as burning
biomass for cooking. Exhibit 6 highlights the proven gas reserves in sub-Saharan
3. MOMENTUM: Many African countries are actively Africa. Exhibit 7 illustrates the amount of current, installed
pursuing programs to grow their gas economies. Not gas-fired generation capacity relative to overall installed
just gas-to-power, but also industrial and transport gas capacity.
markets.
7 Harnessing African Natural Gas: a new opportunity for Africa’s energy agenda? World Bank, 2014. http://documents.worldbank.org/curated/en/858091468203694236/
Harnessing-African-natural-gas-a-new-opportunity-for-Africas-energy-agenda
POWER AFRICA I GAS ROADMAP TO 2030 9EXHIBIT 6
PROVEN GAS RESERVES IN SUB-SAHARAN AFRICA
Nigeria
193.351Tcf
200.0 – 100.0 Tcf
95.0 – 45.0 Tcf
44.0 – 10.0 Tcf
9.0 – 0.05 Tcf
Mauritania
1.00 Tcf Ethiopia
0.88 Tcf
Somalia
0.20 Tcf
Côte d’Ivoire
1.00 Tcf
Ghana
0.80 Tcf
Uganda
0.50 Tcf
Benin
0.04 Tcf Rwanda
Cameroon 2.00 Tcf
4.77 Tcf
Tanzania
Equatorial Guinea 0.23 Tcf
1.30 Tcf
Gabon
1.00 Tcf
Congo, Rep. Mozambique
100.00
3.2 Tcf
Angola
10.88 Tcf
Namibia
Source: EIA 2.20 Tcf
EXHIBIT 7
CURRENT, INSTALLED GAS-FIRED GENERATION CAPACITY
(TOTAL MW AND PERCENTAGE OF OVERALL GENERATION CAPACITY)
■ Nigeria 88.91% 12,665MW
■ Congo, Rep. 55.74% 350MW
■ Ghana 54.20% 1718MW
■ Gabon 54.09% 392.18MW
■ Côte d’Ivoire 51.48% 973MW
■ Tanzania 45.91% 748MW
■ Equatorial Guinea 45.64% 178.2MW
■ Benin 22.89% 80MW
■ Cameroon 15.65% 216MW
■ Mozambique 13.05% 344.6MW
■ South Africa 0.34% 158MW
Source: MIR
TOTAL: 17,822.98MW
10 POWER AFRICA I GAS ROADMAP TO 2030ECONOMICS
Gas is highly competitive as a new source of power. of $0.07 - $0.09/kWh. Exhibit 8 outlines the comparative
A 2016 study found that prices for gas-to-power could prices of power generation in sub-Saharan Africa.
run as low as $0.10/kWh for integrated LNG projects
and $0.15/kWh for small-scale and distributed power Exhibit 9 on the next page shows the average cost
projects.8 Both projected prices are lower than the $0.18/ of various fuel sources typically used in thermal power
kWh average cost of generation in sub-Saharan Africa. generation, as well as transport and industrial sectors
Recent gas-to-power transactions in Ghana, Nigeria, and in sub-Saharan Africa that could be substituted with
Mozambique utilizing local gas resources have yielded tariffs natural gas.
EXHIBIT 8
COMPARATIVE PRICES OF INDEPENDENT POWER PROJECTS IN SUB-SAHARAN AFRICA
Large hydropower independent power projects (IPPs) have emerged, albeit only in the form of Bujagali in
Uganda (250 MW) and, more recently, Itezhi in Zambia (120 MW). Bujagali, at $0.10/kilowatt-hour (kWh),
has helped offset higher-priced thermal installations ($0.24–0.27/kWh) in the country.
Small hydropower IPPs (EXHIBIT 9
AVERAGE COST OF VARIOUS MODERN FUEL SOURCES The environmental benefits of natural gas usage compared
IN SUB-SAHARAN AFRICA to other fossil fuels and biomass could also translate into
economic benefits as a result of lower cost of capital,
FUEL SOURCE AVERAGE $/GJ IN SSA
decreased financial liabilities with regards to environmental
HFO 23-27
management, and potential income from carbon trading
Diesel 35-38
mechanisms.
LPG 39-42
Petrol 38-41
MOMENTUM
Coal (20 MJ/kg mouth of mine) 2-4
Coal (24 MJ imported) 5-9 Several governments in sub-Saharan Africa are actively
Source: SGS pursuing programs to grow their gas economies through
the development of industrial and transport gas markets,
These figures illustrate the clear opportunity to in conjunction with gas-to-power programs. Gas bunkering
displace some liquid fuel consumption with for fueling oceangoing vessels is also a growing opportunity
natural gas. The constraint, however, is the availability of that should be explored by African governments and
gas, which can be overcome with scale and more flexible companies.
supply, distribution, and import infrastructure options. There
are numerous sources of gas scattered across the continent The benefits of this approach include:
that are either too small for large-scale power use, or are • Early monetization of gas resources, improving returns
awaiting certainty of large-scale, long-term offtake to bank for upstream companies, and accelerating the further
upstream development costs. Many of these have existing development of the resource;
exploration wells that have been venting gas for a number
• The creation of a market for the gas that grows expo-
of years. A typical exploration well can produce between
nentially over time; and
50,000-150,000 gigajoules (GJ) (or 14 - 47 MMscf) of
gas per annum, which is too small for large-scale power • Proof of the technical and commercial viability of the
generation that, as a rule of thumb, requires 100,000 GJ (94 gas supply.
MMscf) per MW per year. It is, however, interesting for an
existing liquid fuel user in the transport or industrial sector Exhibit 10 shows that there is volume growth in the power
and owners. market, but that the combined transport and industrial
EXHIBIT 10
ENERGY CONSUMPTION BY SECTOR IN AFRICA
(MILLION TONNES OF OIL EQUIVALENT)
2,000
1,500
1,000
500
0
1990 1995 2000 2005 2010 2014 2015 2020 2025 2030 2035
Total Transport Total Inputs to Power Total Industry Total Other Sectors
Source: BP Energy Outlook 2017
12 POWER AFRICA I GAS ROADMAP TO 2030markets are significantly larger consumers of energy. EXHIBIT 11
There are various ways to link gas sources to gas markets GAS TRANSPORT OPTIONS
depending on volume and the distance between source, as
shown in Exhibit 11.
500
Gas delivery (mGJ/a)
Pipeline
LNG
Compressed natural gas (CNG) is a proven method of 400
transporting smaller volumes of gas over shorter distances. LNG + GTL?
Advances in mini-LNG, trucking, and rail transportation 300
makes LNG an avenue to investigate, as well. 200 r Tropsch
(GTL) - Fische
CNG Gas-To-Liquids
100
Stranded or Possibly GTL (Methanol DME)
CATALYZATION IMPACT 0
0 1000 2000 3000 4000 5000
History shows that the introduction and/or increased Distance to market (km)
supply of gas as an alternative energy source Source: Gas Monetization Options, Shell
has a transformative impact on economies. The
construction schedule of a combined cycle gas turbine
(CCGT) plant is approximately 30-36 months (with open THE GLOBAL LNG MARKET:
cycle capability often being available after roughly 20 WHY IMPORTED LNG NOW
months). The feasibility, licensing, and financial close process
MAKES SENSE FOR AFRICA
of these projects can take anywhere between 2-5 years. In
the interim, there are many other users that would be able In the last decade, the world witnessed the United States’
to utilize the gas if it was available. The markets for liquid transition from being a liquefied natural gas (LNG)
fuel products in Africa make up roughly 40 percent of the importer to a growing LNG exporter (see Exhibit 12). This
total energy consumption and are projected to hold steady shift changed the dynamics of the global gas market such
for the near future (this number is even greater when only that it has gone from being a “seller’s market” to a “buyer’s
sub-Saharan Africa is taken into consideration). market.” Now, even for many African countries that do not
have indigenous gas reserves, gas-to-power projects can
DIVERSIFICATION AND FLEXIBILITY still become a reality by importing LNG and developing the
associated LNG-to-power infrastructure, such as offshore
Gas-fired plants complement the generation profiles of floating storage and regasification units (FSRUs) or onshore
renewable sources, thereby increasing the potential to LNG terminals and related infrastructure.
add more renewable generation to a system. In terms of
flexibility, the relatively short construction time required EXHIBIT 12
to build a gas-fired power generation facility can be GLOBAL LNG EXPORTS
an important incentive for governments across sub-
Saharan Africa. With average development times
of approximately two to three years, gas-fired
power plants can fill critical electricity gaps much
Reference Case
more quickly than large-scale hydro, coal-fired
High Oil and Gas
or nuclear plants, which can take up to seven years to Resource and
Technology
construct.9
Low Oil and Gas
Resource and
Technology
High Oil Price
Low Oil Price
9 IEA. 2015. Projected costs of generating electricity. Paris: IEA/NEA.
Source: U.S. Energy Information Administration, “Annual Energy
Outlook 2017”
POWER AFRICA I GAS ROADMAP TO 2030 13South Africa could import 100 million gigajoules (GJ) (95 For the United States and U.S.-based companies,
Bcf) of LNG annually to fuel 3,000 MW of gas-to-power the benefits of increased African demand are
generation by 2030. Given the changes in the global three-fold:
LNG market, a country like South Africa should be able
1. Africa can become an additional market for gas from
to import LNG on more competitive and flexible terms
the United States;
since producers will need to place shipments of LNG that
may not have been sold forward on long-term contracts, 2. Africa can be a customer for U.S. Companies
meaning prices may be discounted; and demand growth that design and build LNG facilities and other gas
may shift to smaller, niche markets, such as those in many infrastructure; and/or
African countries. 3. Increased demand from Africa could support prices and
revenue for U.S. producers by preventing oversupply in
Exhibit 13 breaks down whether proposed gas-fired the market.
generation projects in the nine focus countries would be
supplied by indigenous gas or LNG imports. This distinction
is important as it determines the interventions required
for supply options, as well as the infrastructure required to
deliver gas to the point of use.
EXHIBIT 13
PROPOSED GAS-FIRED GENERATION PROJECTS IN FOCUS COUNTRIES
ESTIMATES OF CURRENT
PERCENTAGE OF PROPOSED GENERATION
AND POTENTIAL
INCREASE BY GAS SUPPLY SOURCE
GAS PROJECTS UNDER ASSESSMENT
PROPOSED MW OF INDIGENOUS
GAS-FIRED GENERATION PRODUCTION LNG IMPORTS
West Africa
Côte d’Ivoire 1,100 75% 25%
Ghana 3,000 50% 50%
Nigeria 8,000 100% Some possible
Senegal TBD portion of HFO Capacity 100% Some possible
East Africa & Southern Africa
Angola 2,000 100% -
Kenya 750 Unclear at present Unclear at present
Tanzania 3,000 100% -
Mozambique 1,100 100% Some possible
South Africa 5,200 10% 90%
Source: Gas Strategies, LLC. report for Power Africa, based on the Power Africa Tracking Tool, national gas policy and planning documents, and Gas Strategies’ database of LNG
import projects under development in sub-Saharan Africa. This table includes data from all projects in our focus countries, not just the projects being tracked by Power Africa.
14 POWER AFRICA I GAS ROADMAP TO 2030ADVANCING U.S. POLICY GOALS
The Power Africa Gas Roadmap aligns with the Department • Strategic Objective 2.3 of the JSP: Advance U.S.
of State and USAID Joint Strategic Plan (JSP) and the United economic security by ensuring energy security,
States National Security Strategy.10 These strategies and combating corruption, and promoting market-oriented
plans include emphasis on diversification of energy sources, economic and governance reforms.
suppliers and routes; removing barriers to energy trade The Power Africa Gas Roadmap focuses primarily on the
and promoting U.S. exports; working to attain universal role of gas as it relates to power generation. However,
energy access; and ensuring energy security for U.S. allies and many U.S. Government agencies lead other comprehensive
partners. In particular, this Roadmap aligns with: gas-related programs and initiatives.
• The National Security Strategy objective to
Embrace Energy Dominance through reducing
barriers, promoting exports, ensuring energy
security, attaining universal energy access and
furthering America’s technological edge; and
Secretary of Energy Rick Perry is joined by U.S. Secretary of Interior Ryan Zinke, Administrator, Environmental Protection Agency, Scott Pruitt
and Director of National Economic Council Gary Cohn for a roundtable discussion on Energy Dominance: Policy Framework for the Future on
June 29, 2017. Photo: Simon Edelman, U.S. Department of Energy
10 The 2018 National Security Strategy of the United States of America is available at https://www.whitehouse.gov/wp-content/uploads/2017/12/NSS-Final-12-18-2017-0905.pdf,
and the FY 2018-2022 Department of State and USAID Joint Strategic Plan is available at https://www.state.gov/s/d/rm/rls/dosstrat/2018/pdf/index.htm
POWER AFRICA I GAS ROADMAP TO 2030 15REACHING OUR GOALS OUR OVERALL GOAL
to enable electricity access by adding
THROUGH GAS 30,000 MEGAWATTS
of new and cleaner power generation
POWER AFRICA’S GAS STRATEGY
This strategy builds on Power Africa’s successes assisting 60 MILLION
new electricity connections
19 gas projects reach financial close in 6 countries, totaling
4,152 MW. The pipeline of projects Power Africa is tracking
includes 60 gas projects in 17 countries, with a potential new
generation capacity of more than 17,000 MW. set of solutions, at the appropriate stage of the project’s
development. Projects will be reviewed on a regular basis
This section provides a high-level summary of the to ensure effective service delivery and to adjust/change
specific market dynamics and risks that could impact the support depending the transactions’ life cycle and specific
achievement of the Roadmap’s primary MW goals. While obstacles that have emerged.
this assessment is current as of June 2018, the risk and
market profile of the regions and focus countries should Power Africa recognizes that the project portfolio will not
be assessed regularly and workplans updated on a regular be static. Projects can be added or removed. The key idea
basis to ensure that Power Africa’s activities meet the goals is maintaining a commitment to a long-term strategy of
of this Gas Roadmap. advancing a focused project portfolio.
Each of the nine countries addressed in this Gas Roadmap A critical success factor will be selecting
has different requirements, and the approach to stimulating
each gas market should therefore be tailored accordingly.
projects and interventions that can have
This section provides some context for each of the markets the greatest impact and maximize Power
and a tailored set of interventions that Power Africa can
Africa’s competitive strengths.
deliver to support the growth of the gas sector.
Primary Activities Secondary Activities
A critical success factor to achieving the 16,000 MW Power Africa recognizes that broader enabling
target is selecting projects and project interventions in environment and market reforms are critical to
which we can have the greatest impact and maximize the development of sub-Saharan African gas-to-
our relative competitive strength in advancing projects. power markets. While some power generation projects
The 16,000 MW is built from a set of selected projects have managed to achieve financial close in less than
categorized into three intervention areas: optimal policy or market conditions, we recognize that
improving the enabling environment is key to unlocking
1. 8,000 MW through maximizing value from existing
the full potential of sub-Saharan gas-to-power markets.
transactions;
Power Africa has had some success in facilitating policy and
2. 7,000 MW through advancing new opportunities for
institutional reforms. For this Gas Roadmap, Power Africa
deal flow; and
will focus policy reform support on activities (in those
3. 1,000 MW through increasing the efficiency of existing
countries with prioritized projects) that will have the most
generation facilities.
impact on advancing gas-to-power transactions:
For each project, Power Africa and partners relevant to
• Developing, finalizing, and implementing policies and
the transaction propose to tailor project support based
regulations to enable upstream developers to monetize
on: (a) analysis of the deal, (b) engagement with the
the gas required to kick-start domestic gas demand in
“buy-side” client, and (c) engagement with the “sell-side”
countries such as Angola, Tanzania, and Mozambique.
client to ensure that we are providing the right solution, or
16 POWER AFRICA I GAS ROADMAP TO 2030• Creating a simplified and streamlined protocol for more • Measure a basket of associated energy and economic
efficient decision making among each of the various indicators relevant to each country;
state entities and regulators. Simplified decision making • Enable scenario planning and comparison of technology
can help provide certainty regarding approval and per- or project options in a cost-benefit analysis framework;
mitting procedures for potential investors in countries
• Serve as a user-friendly, in-country communication and
such as Ghana and Côte d’Ivoire.
workshopping tool; and
• Updating Gas Master Plans to ensure streamlining, rele-
• Run on conventional software and produce user-friendly
vancy, and correct implementation in countries such as
outputs.
Mozambique, Senegal, and Nigeria.
In addition, the limited capacity and availability of power Improving the enabling environment is
transmission and distribution systems have been identified key to unlocking the full potential of
as a constraint to the development of power projects, as
well as the development of stranded gas assets within the sub-Saharan gas-to-power markets.
region. To this extent, Power Africa will assist with the
improvement of existing transmission and Regulatory and policy, finance, transaction advisory, and
distribution infrastructure and operations, as well capacity-building interventions are recommended to be
as the development of new grid infrastructure. phased as follows:
An Integrated Gas Economy Planning Tool is • Determine and enable near and long-term gas market
recommended to be developed for each country opportunities (demand);
and region. The focus of the tool will be on quantifying • Match these markets to appropriate gas supply (source
current and future market and supply options, and will be and delivery method) options;
designed to: • Develop appropriate mitigation measures for the vari-
ous risks identified;
• Enable detailed country-specific gas and gas-to-power
• Prioritize the matched demand-supply opportunities;
planning;
and
• Match different power generation, transmission, and
• Provide transaction implementation support.
distribution technologies/options/projects with
electricity and other energy demands;
• Simulate energy tariffs and their effects;
• Measure investment returns;
• Measure MW generated per project/initiative/
investment;
Improving transmission and distribution networks in sub-Saharan Africa is
critical to delivering new gas-fired power to homes and businesses across
the continent.
POWER AFRICA I GAS ROADMAP TO 2030 17CHALLENGES • Absence of or inadequate host government support
(guarantees);
OVERARCHING CHALLENGES • Inability to obtain requisite insurance (political risk);
A fundamental challenge revolves around institutional or • Inadequate security of gas supply, gas pricing, and
structural problems relating to the production, use, or contractual arrangements; and
regulation of gas. These challenges focus around opening • Power grid constraints.
the market through development of policy or regulation or
frameworks for upstream and downstream developments. Financing challenges are one of the most fundamental
Interventions may take time to implement and may and overarching concerns for infrastructure projects in
require significant technical expertise, but could provide a sub-Saharan Africa. The short-term solution is the use of
good return on investment as the revamped institutional financial guarantees by governments and state-owned
framework may allow a higher level of certainty for private entities, to ensure the flow of money along the gas chain
and public sector investors. is guaranteed and supports the integrity of the physical
gas chain. However, in the longer term, these fundamental
Common across sub-Saharan Africa is the existence issues, particularly the insolvency of many African utilities,
of relatively small onshore gas discoveries, as well as will need to be resolved.
relatively low levels of gas demand spread across different
geographic areas. Advances and increasing utilization of Power Africa, with on-the-ground
technology such as CNG and small-scale LNG mean that
there is the potential to both monetize small gas resources,
transaction advisors who are in regular
as well as serve small and/or off-grid demand centers (not contact with all relevant stakeholders, is
necessarily just in connection with small gas resources).
extremely well positioned to assess project
These actions are already taking place in Nigeria and South
Africa, and should be encouraged across the continent. The risks and barriers, and propose solutions to
major benefit of this approach is that gas demand can be mitigate them.
scaled up over time without the need for large, upfront,
fixed capital investments.
COUNTRY AND REGIONAL CHALLENGES
When screening potential gas-related business For the countries we have defined as having developed
opportunities, it is important to look at the whole natural gas reserves (Nigeria, Ghana, and Côte d’Ivoire), the
gas-to-power value chain and to remember that this chain fundamental problems tend to revolve around the updating
is only as strong as its weakest link. A plethora of parties of regulation and policy to fit the current requirements. In
fulfill the functions within this value chain, making the Nigeria, the Gas Master Plan is out of date and requires
contractual arrangements challenging at times. fundamental updates to ensure streamlining, relevancy
and correct implementation. In Ghana, the role of multiple
Moreover, most countries in sub-Saharan Africa have state entities and regulators in the gas industry has caused
limited or no creditworthy off-takers, and/or constrained confusion and delayed progress. Clarity on the role and
government support, which leads to an unavailability reach of regulators would be helpful. Côte d’Ivoire has
of guarantees. Power Africa has identified four main recently updated legislation, which may create uncertainty
constraints that have delayed recent projects from reaching in the near term.
financial close, or caused projects to be abandoned
altogether: For Mozambique, Tanzania, and Senegal, with some existing
developed (as well as discovered but undeveloped)
gas reserves and significant LNG export projects on
the horizon, the main interventions are addressing the
18 POWER AFRICA I GAS ROADMAP TO 2030challenges caused by these large discoveries and their
exports. Since 2014, when oil prices began to fall, project
economics in Mozambique and Tanzania have changed
significantly, yet the export projects and upstream fiscal
regimes have not been amended. This discrepancy will be
a fundamental challenge if not addressed. For Senegal, the
challenges include a unitization agreement with Mauritania
prior to commercialization. Subsequently, Senegal will need
to draft legislation to address its new potential exporter
status. The 430 MW Azito power plant in Abidjan delivers a quarter of Côte
d’Ivoire’s baseload electricity generation to the national power utility.
For South Africa, having the largest existing power Photo: Globeleq
consumption per capita to go with limited gas resources,
there are very different fundamental challenges. Gas supply However, on a realistic and practical level, to achieve
and a clear, structured, and purposeful national policy of national and regional self-sufficiency through regional
how to plan gas supply are required. interdependence, the commercial fundamentals of the
gas and gas-to-power sector in each country need to be
The ambitious target of up to 16,000 MW is based on robust and reliable on a sustainable, long-term basis. The
the projects that could likely reach financial close by 2030, energy sectors of many West African countries have not
taking into consideration: yet proven to meet these criteria.
• The existing constraints in each of these countries; and
In contrast to West Africa, only moderate volumes in East
• What Power Africa could potentially do in this period to
and Southern Africa are being commercially produced
assist in alleviating these constraints.
at present. The much larger offshore gas resources
discovered are yet to reach commercial production.
REGIONAL DYNAMICS However, significant progress is being made, particularly in
Mozambique where the 3.4 Mtpa Coral floating liquefied
Within Africa’s energy sector, few countries operate natural gas (FLNG) project has reached Final Investment
in isolation. To fully appreciate the challenges and Decision (FID), and the 12 Mtpa Mozambique LNG project
opportunities in each of the nine focus countries, it is is also making noteworthy steps towards FID.11
important to understand their position within their regional
contexts. These regional dynamics play a significant role in The development of these upstream gas projects, and
the approach that must be taken to reach the objectives of the resultant revenue flow to governments from its
this Gas Roadmap. share of the resources and tax, will be transformative
for countries in East and Southern Africa.
West Africa is the most mature oil and gas region in
sub-Saharan Africa. However, within each country in the While interventions in the Nigerian and Ghanaian markets
region there is wide variation in the scale of gas resources, could deliver successful outcomes relatively quickly, thanks
demand potential, market development, and energy to existing and planned gas and gas to power infrastructure
integration with neighboring countries. Theoretically, West and more mature gas markets, results in other markets will
Africa could become energy self-sufficient from take longer to realize. The potential impact of interventions
a gas and gas-to-power perspective. Based upon the also varies across each country. Across all countries
volume of proven reserves, and expected growth rates examined as part of this Gas Roadmap, interventions in the
for gas-fired power generation, gas supply should not be a gas sector should have a significant positive effect on power
constraint in the region. sector development.
11 https://www.reuters.com/article/anadarko-petrol-lng-edf/anadarko-agrees-mozambique-lng-sale-banks-discuss-finance-terms-idUSL8N1QA7U4
POWER AFRICA I GAS ROADMAP TO 2030 19WEST AFRICA (7,749 MW GOAL) West Africa could become
The West African countries considered within this energy self-sufficient from a gas
Gas Roadmap (Nigeria, Ghana, Côte d’Ivoire, and
and gas-to-power perspective.
Senegal) have proven gas reserves that are in production,
ranging from large volumes in Nigeria to negligible volumes
in Senegal. Nigeria has the largest proven gas reserves in In Nigeria and Ghana, the gas-to-power chain is not
sub-Saharan Africa, as well as LNG export facilities. Nigeria functioning on an economically sustainable basis due to
has been a major player in the LNG business for over issues such as revenue collection at the customer level,
20 years, but has been unable to harness additional gas revenue not flowing back up the chain to gas suppliers,
resources to solve domestic or regional power generation inadequate infrastructure, and the security of gas supply.
deficiencies. Ghana and Côte d’Ivoire have more modest Gas supply issues and contractual agreements not being
reserves, and both are in the process of establishing LNG honored by producers have also impacted the commercial
imports to supplement indigenous production to meet viability and operational performance of the WAGP–
a growing need for downstream gas demand for power influencing the decision of those countries needing to
generation. The recent discoveries in Senegal are of a scale import gas to advance LNG import facilities to ensure
and cost that will need access to international markets access to a potential range of gas supply sources, and
through LNG to warrant commercial development. therefore not to be reliant upon a single source. The
historical underperformance of WAGP influenced the
Looking forward, this diversity creates the possibility for decision to pursue LNG imports in Côte d’Ivoire rather
increased regional integration. For example: than seeking to extend WAGP. While the LNG import
option is being developed, further work can be done on
• There would be operational efficiency and shipping cost
resolving the issues causing the underperformance of
advantages by supplying LNG within the region.
WAGP.
• A small-scale LNG hub-and-spoke distribution business
could be developed to supply smaller parcels of LNG to
A significant private sector and commercial
distributed power generation facilities.
drive will be required to realize gas-related
• The existing West Africa Gas Pipeline (WAGP) is opportunities. Often, the first movers to take advantage
available to flow gas from Nigeria to Benin, Togo, and of regional opportunities are highly entrepreneurial and
Ghana. There is both the opportunity to reverse flow nimble players that can see and implement opportunities
the line to move gas within Ghana and from Ghana to early, perhaps at the smaller end of the investment and
Nigeria if additional Ghanaian resources are developed, infrastructure scale. A good example, albeit outside of Africa,
or if Ghana moves forward with an LNG import project is New Fortress Energy, a U.S. company that is establishing a
with substantial surplus capacity. The WAGP could also small-scale LNG hub-and-spoke distribution business to fuel
be extended to Côte d’Ivoire. Increased utilization of distributed power stations across the Caribbean.
the pipeline requires solutions to payment and supply
inconsistencies. Governments will also play an enabling role, but will be
• In the downstream power sector, investment in power focused on ensuring the sustainable delivery of energy in
generation capacity and transmission reinforcement their own jurisdictions before tackling a broader agenda.
within the West Africa Power Pool (WAPP) provides
the opportunity for increased integration. The following pages outline intended Power Africa
interventions in West Africa.
20 POWER AFRICA I GAS ROADMAP TO 2030CÔTE D’IVOIRE (1,271 MW)
Gas is, and will continue to be, an important part of Côte As the development of both the upstream and
d’Ivoire’s energy mix. Additional investment in securing downstream components of gas projects are intricately
supply is critically needed if a portion of the generation linked, interventions should target four areas across the
capacity targets are to be met through gas-fired plants. gas-to-power value chain:
There are significant opportunities for the supply of
• Upstream (local gas field and gas supply contract);
imported LNG, as well as the development of import
and regional midstream infrastructure. It will, however, be • Local gas infrastructure (LNG imports and gas pipe
difficult to balance proposals for large gas import and coal- lines);
fired power generation projects with a desire for additional • Regional gas infrastructure (including WAGP); and
domestic gas resource development. As with other • Gas markets (power generation and gas markets,
countries in the region, it will also be a challenge to balance which could help to anchor the demand, including
the ambitions of neighboring countries to become power LNG re-export).
exporters within the WAPP.
IVORY COAST
GHANA
AREA OF Aggreko
MAP
Map: Gas Strategies
Abatta
Ciprel
Abidjan Songon
Azito Grand Bassam
Vridi
Gazelle
Espoir
Panther Baobab
Foxtrot
Existing pipelines
Projected pipelines
SCALE
0 miles 150 Gas fields
Gas power plant
0 km 150
Proposed gas
power plant
POWER AFRICA I GAS ROADMAP TO 2030 21CÔTE D’IVOIRE GAS-TO-POWER SNAPSHOT
MOST IMPACTFUL NEAR-TERM
INTERVENTIONS REQUIRED TO
CATEGORY STATUS GOAL REACH GOAL
Generation 2,172 MW (1,298 MW is from Additional gas Assist with the development of a PPA
Capacity gas and/or liquid fuels) generation capacity: that reflects the challenges of an LNG-
2019: 372 MW to-power project, rather than a domestic
gas-to-power project.
2020: 277 MW
2025: 272 MW Increase access to on-grid power
through the development of
2030: 350 MW
transmission and distribution
Total: 1,271 MW
infrastructure.
Gas Supply Despite an existing developed gas Increase gas supply through facilitating
resource (estimated at 1 Tcf) and the importation of LNG. This will require
recent offshore finds, there is a not only the supply of LNG, but also the
current gas deficit (estimated at development of the appropriate import
0.35 Tcf/year). infrastructure.
The single biggest constraint to Explore options for smaller scale
increasing gas-fired generation imports.
is limited gas supply. Indigenous
Explore options for cooperation with
gas finds have not kept pace with
WAPP to justify larger scale imports for
declining existing reserves, and
power generation.
increasing demand.
Assist with increasing indigenous gas
production through supporting:
• Increase in exploration.
• Acceleration of the progression from
gas finds to first gas production.
• Identify solution and off-taker for
identified potential gas offshore
development.
Gas Limited pipeline infrastructure Assist with the development of off-
Infrastructure linked to existing power plants. grid solutions, which may include
consumer and fleet vehicle use of CNG
(compressed natural gas), and LNG,
which could be linked to a LNG-to-
power project.
Regulatory Liberalized electricity sector. Assist with the developing of LNG policy
Environment CI-ENERGIES, the public utility and regulation.
company, has been unbundled to
Assist with developing the appropriate
increase competition.
regulatory and fiscal regimes and
IPPs are allowed to sell power
incentives to increase indigenous
direct to the grid and guidelines
production of gas.
exist on power marketing and
distribution.
22 POWER AFRICA I GAS ROADMAP TO 2030RECOMMENDATIONS FOR INTERVENTION IN CÔTE D’IVOIRE
WHERE INTERVENTIONS
CAN BE APPLIED TO
REGULATORY/POLICY FINANCE TRANSACTION ADVISORY REACH 2025 MILESTONE
INTERVENTIONS INTERVENTIONS INTERVENTIONS GOAL
• Update regulations and • Fund upstream • Provide commercial • Expansion of existing
policies to fit the current developments (greenfields), assistance to design the generation plants
requirements to support gas processing facilities, most appropriate LNG-to- (300 MW)
the increase of gas in the pipelines, LNG import power project structure. • Development of new
energy mix, with reference terminal(s) and • Develop additional local gas generation plants
to LNG supply. downstream projects resources. (600 MW)
• Create certainty in the utilizing gas. • Independent benchmarking • LNG import terminal
near term with regards to • Develop CNG and of gas supply alternatives • Conversion of existing
recently updated legislation, small-scale LNG projects (domestic gas, regional gas, plants from liquid fuels
by enabling implementation. to monetize local gas and LNG imports); to gas
• Review of existing resources as well as serve • Provide independent review • Small-scale LNG projects
Production Sharing local demand centers. of the most relevant project
Contracts to ensure structures.
appropriate incentives for • Develop a PPA that reflects
exploration and production. the challenges of an LNG-
• Review the local and to-power project, rather
regional gas and power than a gas-to-power supply
price markets with a view chain.
to assist in addressing any • Improve energy efficiency
gaps. through the repair or
rehabilitation of transmission
and distribution lines.
• Develop off-grid gas and
gas-fired power projects.
• Provide transactional,
legal, technical, financial
and project development
support to private
developers and public
entities to develop and
implement projects across
the gas value chain.
POWER AFRICA I GAS ROADMAP TO 2030 23You can also read