Cause Area Report: Housing Affordability in England - LAST UPDATED 04/2020 - Thinkhouse
←
→
Page content transcription
If your browser does not render page correctly, please read the page content below
Cause Area Report:
Housing Affordability in
England
AUTHOR: LAST UPDATED 04/2020
STEPHEN CLARE, M.SC.
Executive Summary
1 Scope of this report
This research was conducted in response to member demand for high-impact donation opportunities in high-income

countries. We were prompted to look into housing affordability and land-use reform by similar research from the Open

Philanthropy Project1 and experts who claim that inefficient land use is likely one of England’s most significant

socioeconomic problems.2 We focus on England rather than the UK because the Town and Country Planning Act, the

country’s foundational land-use legislation, is specific to England and Wales. We use data for England wherever

possible but use UK data where necessary.

We continue to encourage people seeking to maximise the amount of good done by their donation to look for

opportunities to help people in lower-income countries, animals, or future people on the basis that charities in these

areas generally receive much less funding than charities working in high-income countries. However, for donors who

would prefer to use some of their donations to help people in high-income countries, land-use reform is likely to be one

of the highest-impact opportunities available. At the end of this report we compare work on this cause to funding

opportunities in low-income countries in greater detail.

2 Summary of findings
Housing affordability varies greatly between different parts of England. In terms of both prices and rents, and even

after adjusting for local incomes, housing is much more expensive in London and the Greater South East than in the

rest of the country. In this report, we discuss the severity of housing unaffordability in England, the likely reasons for

local variation in housing costs, and the effects on wellbeing. There are strong reasons to believe that it is unusually

difficult to build houses in certain parts of England and that this is an important driver of housing unaffordability.

Moreover, the places where it is more difficult to build are generally more economically productive. This relationship

has important welfare implications.

2 — Founders Pledge Housing Affordability in England
First, high regional housing costs reduce movement to economically prosperous places. This lowers economic growth,

depresses incomes, and reduces social mobility. Because the effects of lower productivity accumulate year-on-year, the

aggregate effect is large: each house that is not built represents a societal loss on the order of £100,000 just in lost

productivity. This estimate does not account for agglomeration externalities, i.e. the fact that people are more

productive when they work alongside many other people in dense cities.3 The total economic loss from reduced

population growth in productive places could be even higher.

Second, there are negative distributional effects. Restrictions on the supply of houses have contributed to a decades-

running increase in real house prices that has transferred wealth from young people and renters to older people and

long-term homeowners. While rents do not exhibit the same long-term increase as do prices, the current level of rent is

unaffordable in many parts of England. This increases the prevalence of homelessness.

Third, supply restrictions make it harder to replace older homes and densify cities. This means that English homes are

unusually old, small, and low quality. Less dense cities also have larger environmental impacts.

Overall, we estimate that these effects add up to at least £3 billion per year. It is plausible that the annual productivity

hit is about 1% of GDP, representing a loss of about £20 billion per year. Though that’s just a few hundred pounds per

person, the effects are unevenly distributed and that figure does not account for lost agglomeration benefits, increased

homelessness, reduced quality of life, or environmental impacts.

To help solve these problems, we recommend supporting London YIMBY. A small organisation founded to improve

housing policy in England, London YIMBY has taken a novel approach that focuses on overcoming political economy

challenges. This is important because political hurdles have stymied many past attempts at reform. If London YIMBY’s

policy proposals succeed, they could also be replicated in other areas and have widespread positive impact. Finally, for

a small but growing organisation like London YIMBY, donations are likely to have a large counterfactual impact.

3 — Founders Pledge Housing Affordability in England
Acknowledgements
We are grateful to the people who gave feedback on this report, especially Ian Mulheirn (Tony Blair Institute) and David

Miles (Imperial College London). Thank you also to the many experts with whom we spoke during the research process.

4 — Founders Pledge Housing Affordability in England
Contents
Executive Summary 2

1 SCOPE OF THIS REPORT 2

2 SUMMARY OF FINDINGS 2

Acknowledgements 4

Contents 5

1 What is the problem? 8

1.1 STATE OF THE EVIDENCE FOR A HOUSING CRISIS 8

1.1.1 LOCAL RENTS AND PRICES 8

1.1.2 LONG-TERM TRENDS 11

1.2 HOW HOUSING MARKETS AFFECT AFFORDABILITY 16

1.2.1 STRONG DEMAND FOR HOUSING 17

1.2.2 INELASTIC HOUSING SUPPLY 20

1.2.3 COMPLICATIONS 23

1.3 EFFECTS ON WELLBEING 24

1.3.1 LOWER PRODUCTIVITY 24

1.3.2 INCREASED PREVALENCE OF HOMELESSNESS 27

5 — Founders Pledge Housing Affordability in England
1.3.3 DISTRIBUTIONAL EFFECTS 29

1.3.4 QUALITY OF LIFE AND ENVIRONMENTAL BENEFITS 30

2 What are the potential solutions? 32

2.1 PRIORITIZING INTERVENTIONS 32

2.1.1 PLANNING REFORM 32

2.1.2 DIRECTLY SUBSIDIZE OR BUILD BELOW-MARKET HOUSING 34

2.1.3 ADVOCATE FOR MORE PUBLIC HOUSING SUBSIDIES 34

2.2 BENEFITS OF SOLVING THE PROBLEM 34

2.3 UNCERTAINTIES 37

2.3.1 POLITICAL ECONOMY CHALLENGES 37

2.3.2 SKEPTICISM ABOUT THE EFFECT OF SUPPLY-SIDE REFORMS 38

2.3.3 POTENTIAL DOWNSIDES 40

3 Recommended funding opportunities 41

3.1 SHORTLIST 41

3.2 EVALUATION 42

3.3 RECOMMENDATION 43

3.3.1 DESCRIPTION OF LONDON YIMBY 43

6 — Founders Pledge Housing Affordability in England

3.3.2 BACK-OF-THE-ENVELOPE COST EFFECTIVENESS CALCULATION 47

3.3.3 COMPARISON TO OTHER FUNDING OPPORTUNITIES 48

4 Appendices 50

4.1 ARE FOREIGN BUYERS RESPONSIBLE FOR HIGH HOUSE PRICES IN LONDON? 50

4.2 HAS RENT AFFORDABILITY WORSENED? 51

4.3 HAS HOUSEHOLD FORMATION BEEN CONSTRAINED? 53

4.4 ILLUSTRATION OF FOREGONE CONSTRUCTION 58

4.5 DIAGRAM OF THE PLANNING PROCESS FOR MAJOR HOUSING PROPOSALS 60

4.6 RECOMMENDATION PROCESS 61

Endnotes 62

7 — Founders Pledge Housing Affordability in England
1 What is the problem?
1.1 State of the evidence for a housing crisis
We start by examining the strength of the evidence for a housing crisis in England. We focus on rent-to-income ratios as

a measure of affordability rather than price-to-income ratios. The cost of housing is signalled by market rent or the

‘imputed’ rent on an owner-occupied house, comprising costs like maintenance and mortgage payments.4 This is a

better affordability metric than prices because the cost of housing services are what reduce net incomes and stop

people from moving to certain areas or living in nicer homes. However, we do also briefly discuss house prices because

understanding housing markets inevitably requires us to consider both prices and rents.

The degree to which housing is unaffordable and how this has changed over time are difficult to determine with

certainty. Local housing markets function differently across the country, data on rents are limited, and housing

affordability can be measured in several ways. After accounting for this uncertainty, we draw two key conclusions:

 1. By the metric of median rent-to-income ratios, housing in London, and to a lesser extent the Greater South
 East, is currently unaffordable.
 2. House prices have grown dramatically in real terms over the last few decades. It is less clear whether rents have
 similarly grown, and the trendline of affordability changes depending on which metric you choose to measure.

We first discuss the current level of housing costs before considering how they have changed over time.

1.1.1 Local rents and prices
Housing is much more expensive in some parts of England than in others. In 2014 rent as a proportion of total

disposable income was more than twice as high in London as in the North East, despite salaries being much higher in

London (figure 1).5 For individuals, in 2016 the median rent-to-salary ratio was 27% for all of England, but ranged from

23% in the North East to 49% in London.6,7 In fact, London has the sixth-highest rents in the world according to

Deutsche Bank.8 In a 2018 Ipsos Mori survey, 1000 respondents ranked housing affordability behind only Brexit and

crime as the most important issue facing the city.9

8 — Founders Pledge Housing Affordability in England
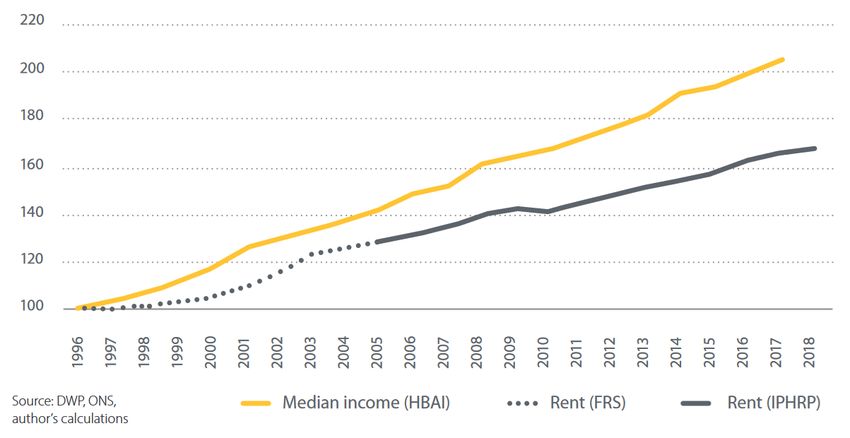
Figure 1: Earnings vs rent, regions of England

Source: “Economic Review: April 2016,” Wales

Affordability is worse for people with lower incomes. At the national level, for the lowest 10% of income earners,

median housing costs comprise about 65% of median household income (figure 2). 10 In 2017, the lowest quartile rent in

London was £1,175 (57% of earnings) and in the South East it was £695 (37% of earnings).11 Note, though, that this does

not account for social transfers such as Housing Benefit.

Figure 2: Median ratio of housing costs to net household income, by Family Resources Survey income decile (combined
five years of data 2012 to 2016, countries of Great Britain)

Source: “UK Private Rented Sector: 2018”, Christiansen and Lewis

Whether or not such levels of rents are affordable depends on how one defines affordability. Conventionally, the upper

limit of affordability is set at a rent-to-income ratio of between .25 and .40.12 By that metric, rents in London and, to a

lesser extent, the Greater South East, seem clearly unaffordable. However, straightforward comparisons of rent and

9 — Founders Pledge Housing Affordability in England
income are tricky and we have to be careful what variables we use. For example, there are more workers than

households in the UK,13 so simply comparing median earnings to median rents will slightly underestimate the

affordability ratio. Data on rents are also more limited than data on prices, especially at the local level.14 Where data are

available, we lack panel data that clarify long-term trends. Overall, though, the available data do support the

perception of a housing affordability crisis. In a majority of local authorities, the median monthly rent exceeds 30% of

the median gross monthly salary (figure 3).

Figure 3: Median monthly rent as a percentage of median gross monthly salary, by local authority, England, 2016

Source: "Housing Summary Measures Analysis: 2016," Henretty

Because the average household has about 1.2 wage earners, median rent will comprise a slightly lower percentage of

the median household salary. However, this effect is not large enough to dramatically change our interpretation of

figure 3. Moreover, note that figure 3 compares rent to gross salary; the ratio would be even larger were we to consider

net salary after taxes and deductions. Unfortunately, the Office for National Statistics does not provide data that

compare median household rent to median net household salary at the local authority level.

House prices display even more local variation than rents. While the rent-to-income ratio is about twice as high in

London than in the North East, the corresponding price-to-income ratio is almost three times higher (figure 4).

10 — Founders Pledge Housing Affordability in England
Figure 4: Ratio of median price paid for residential property to median workplace-based gross annual earnings, by region
and country, England and Wales, 2016

Source: "Housing Summary Measures Analysis: 2016," Henretty

Overall, both rent and house price data support the popular conception that London, and a few other parts of England,

face serious housing affordability challenges. In the next section, we look into whether this has been getting worse over

time.

1.1.2 Long-term trends
While data for house prices since the 1800s are available, data for historical rents are lacking. That makes it difficult to

assess how housing affordability has changed over time. Changes in home ownership rates and public subsidies also

mean we cannot just look at how average rent has changed over time. In this section, we review the available data on

trends in housing affordability. House prices appear to have significantly diverged from housing costs over the past few

decades. UK house prices have more than tripled since 1980 in real terms. While this does not change our interpretation

of the current level of rent affordability, it does show that we cannot assume that all measures to reduce house prices

will also reduce rents, and vice versa.

1.1.2.1. Compositional change and rents

Wales documents an upward trend since the 1980s for both mean and median rent-to-income ratios for renters. Figure

5 shows the fraction of total household disposable income accounted for by rental charges on primary dwellings. On

11 — Founders Pledge Housing Affordability in England
average, the proportion of a renting household’s disposable income spent on rent has more than doubled since the

early 1980s. For private renters, the average amount spent on rent is now close to 25%.15

Figure 5: Fraction of total disposable household income spent on rent

Source: "Economic Review: April 2016", Wales

However, compositional change means trends in rental affordability cannot be easily inferred from this graph.

Compositional change refers to population-wide shifts in the proportion of people who own their homes, rent privately,

or rent subsidized social housing. It can also refer to changes in the location or types of homes people are renting. Since

1980, the council rented-sector has declined while the proportion of homes rented privately or from Housing

Associations has grown. Because council rents are heavily subsidized, this shift may have increased the average rent

without increasing the rent of any given property.16 Figure 6 shows that people were more than twice as likely to rent

privately in 2014 as they were in 1987, though private rentals are still a small part of the total market. Home ownership

also grew over the same period.

12 — Founders Pledge Housing Affordability in England
Figure 6: Proportion of population by tenure status, England, 1977 to 2014

Source: "Economic Review: April 2016", Wales

A statistic published by the Office for National Statistics called the Index of Private Housing Rental Prices measures rent

changes while accounting for compositional change. This index is calculated by tracking rent over the course of a year

for each property in a large sample of privately-rented properties. That means it tracks rents on a “like-for-like basis.”

Data from the sample are then adjusted to reflect national compositional changes. This metric is useful, with two

limitations: (1) it is not adjusted for inflation and (2) official data are only available for England from 2005 on. This index

appears to show that median income growth has actually outstripped average rent growth in recent years (figure 7).17

Rental costs grew by about 30% since 2005. Over the same period, median incomes grew by about 45%. The solid line

in figure 7 is official data. The dotted line represents a proxy metric used by Ian Mulheirn in "Tackling the UK Housing

Crisis", and should be treated somewhat cautiously.

13 — Founders Pledge Housing Affordability in England
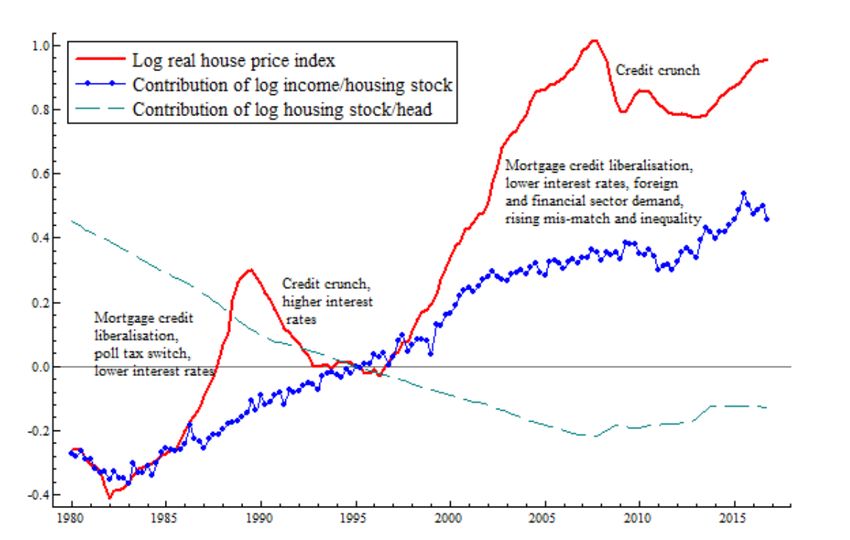
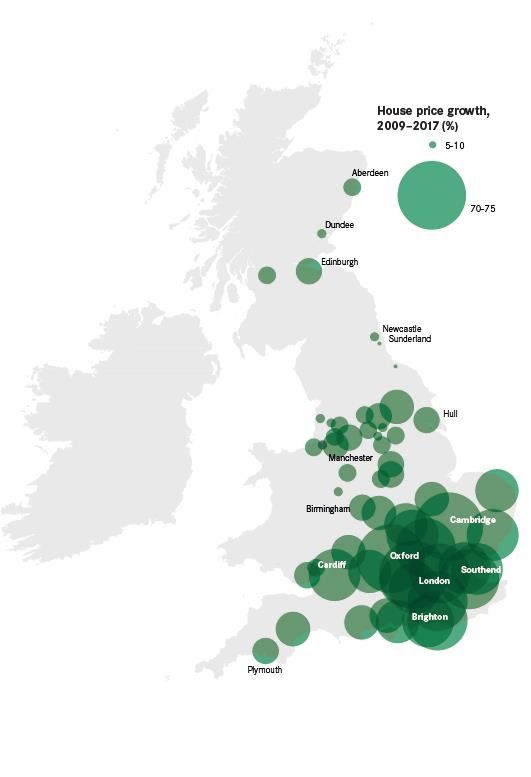
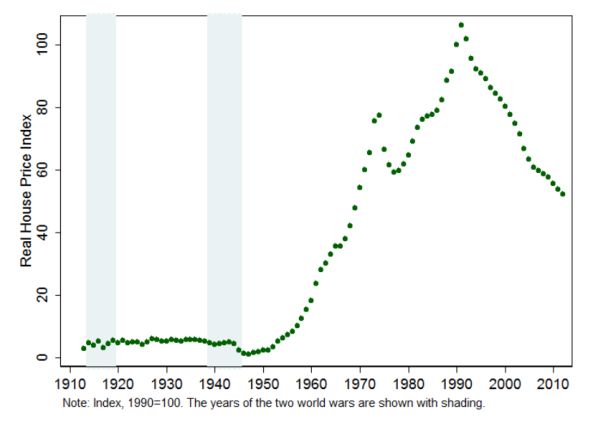
Figure 7. Housing costs and household incomes, current prices, 2005-18

Source: "Tackling the UK Housing Crisis", Mulheirn

Note, though, that this does not contradict the story of a housing crisis. First, Wales’s data document a long-term trend

in rent growth but relative stability among private renters at ~25% of income since 2005, from which time we have

official rental index data. Second, and more importantly, recent rent trends do not change the fact that the current

level of rent is very high in certain parts of the country. It is possible that rents were already unaffordable in 2005 or

1996.

1.1.2.2. House price growth

While rent data are difficult to interpret, real house prices have undoubtedly experienced dramatic growth. Figure 8

shows that UK house prices more than doubled between 1950 and 1980 and then doubled again between 1996 and

2006. 18

14 — Founders Pledge Housing Affordability in England
Figure 8: Real house price index for the UK, 1899-2012

Source: "No Price Like Home", Knoll et al.

Although house prices have also risen in comparable countries, growth in the UK seems to have been particularly

severe (figure 9).19

Figure 9: Real house price growth in G7 countries, 1980-2018

Source: "UK House Prices and Three Decades of Decline in the Risk‑free Real Interest Rate", Miles and Munro

15 — Founders Pledge Housing Affordability in England
While not offering a clear picture on long-term affordability trends, these data show how house prices and rents can

move independently. That is why we focus on rent-to-income ratios as a measure of affordability rather than house

prices, because price increases do not necessarily indicate worsening affordability. In the next section, we try to

understand these trends by taking a closer look at how housing markets work.

1.2 How housing markets affect affordability
Why are rents so much higher in certain places, even after adjusting for incomes? And why have house prices risen so

much in recent years? Evaluating proposals to improve housing affordability requires a good understanding of housing

markets. This is challenging as there is a great deal of expert disagreement on these questions. In England, the debate

has two main focal points. First, there is disagreement over how to measure housing affordability, and in particular

when to look at rents and when to look at prices. Second, there is debate about whether high rents and prices result

more from strong demand due to falling interest rates20 or weak supply due to insufficient rates of homebuilding.21

One of the reasons this is complicated is that there are two distinguishable but related markets within the housing

sector. First, there is a market for housing services, in which demand is driven by people looking for nice places to live.

Second, there is a market for housing assets, in which demand is driven by investors who want to hold assets that are

expected to appreciate and provide a return (in this case, a rental yield equivalent to the annual rent divided by the

price of a house). These markets are linked because the level of market rent is set by the interaction of renters’ demand

for housing services and the supply of homes. Demand drivers like income or population growth can affect rents by

increasing demand for housing. Supply shocks, like sudden changes in building costs or financial markets, can affect

rents by increasing or decreasing the cost of providing housing assets.

In this section, we focus on rent-to-income ratios and discuss the influence of both demand- and supply-side factors.

We note that rising incomes, population growth, and falling interest rates have all increased demand for housing. We

then review evidence that suggests England’s supply of housing is particularly inelastic: few new homes are built in

16 — Founders Pledge Housing Affordability in England
response to growing demand, leading to higher prices and rents. Drawing on evidence from other countries and

modelling exercises for England, we argue that a key cause of this inelastic supply is government policy, particularly the

national planning system. A strong case can be made that about half of the house price growth in the 2000s was driven

by falling interest rates. However, because interest rate changes shift demand for housing assets more than housing

services, a better explanation for regional disparities in rent affordability is weak supply due to local regulatory

strictness. We examine each of these factors in turn and conclude this section by summarizing how they interact.

1.2.1 Strong demand for housing
1.2.1.1. Population and income growth

Population growth increases housing demand. Income growth does as well because as people earn more money they

want to live in nicer places. The income elasticity of housing demand describes the strength of this effect. Most

estimates of income elasticity find that it is about 1. That is, when someone’s income grows by 1% they spend about 1%

more on housing.22 Income elasticity of demand in the UK may be slightly higher than average.23

The UK’s median income has grown about 1.7% annually, adjusted for inflation.24 Muellbauer shows that the growth of

the UK’s housing stock has not kept up. He suggests that this has inflated house prices, though does not consider the

effect on rents. Rather than number of houses, he uses the total value of the housing stock (i.e. the total value of all

dwellings in England minus the value of land) because this accounts for both new construction and quality

improvements. If the average quality of the housing stock (considered broadly as newer, nicer, or better located homes)

does not improve as incomes rise, then people will end up spending more for the same housing services as they

compete to live in the nicest places. In contrast, if the average quality of the stock improves, then everyone can end up

better off. This is important because some data suggest that English homes are, on average, of lower quality than

homes in comparable countries.25

17 — Founders Pledge Housing Affordability in England
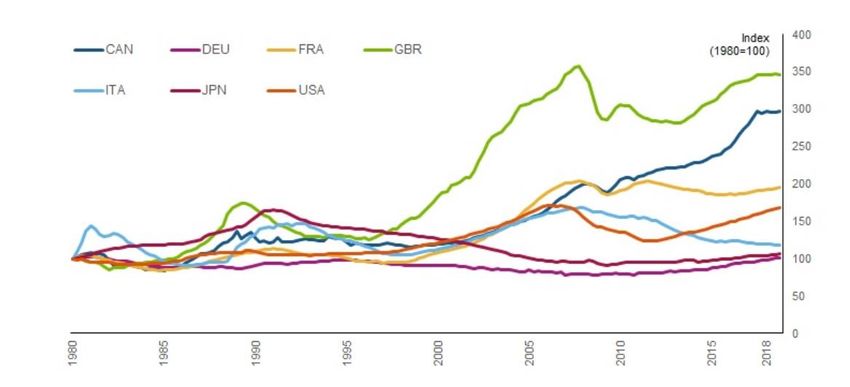
Muellbauer models housing demand h as

 ℎ = − ℎ + +

where ℎ is the real housing price, is real income and represents other demand shifters such as interest rates and

expectations of future income growth. The own-price elasticity of demand, which measures how much demand falls as

prices rise, is –α and the income elasticity is β. Assuming, with empirical justification, that β ~ 1, he rearranges equation

1 to obtain the following expression for house prices:

 ℎ = ( − ℎ + )/

His findings are shown in figure 10. The red line is the log of the real house price index. The blue line measures income

per house relative to the housing stock, while the green line measures housing stock per capita. The large gap between

these two lines means that income growth has outpaced housing stock growth.26

Figure 10. Key drivers of UK real house prices

Source: "Housing, Debt and the Economy", Muellbauer

18 — Founders Pledge Housing Affordability in England
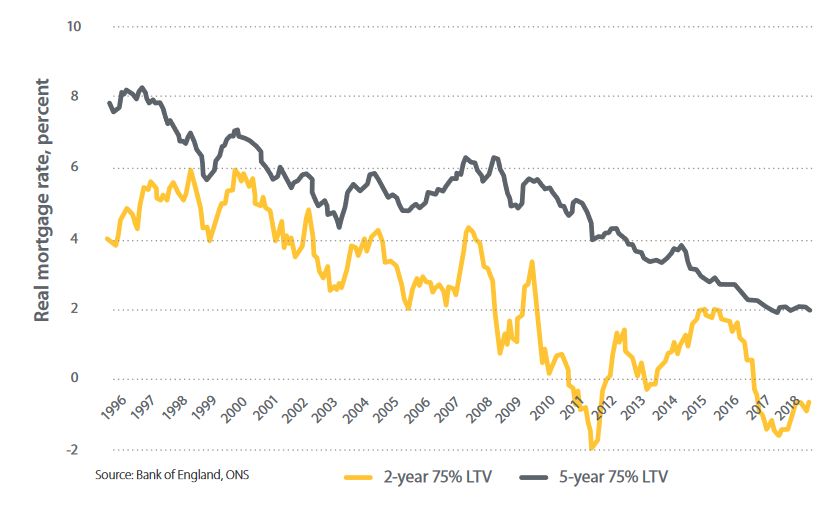
However, house prices have grown more than income and population growth alone would predict. The gap in price

growth is accounted for by z, other demand shifters. The annotations on figure 10 indicate that changes in financial

markets play an important role in explaining this gap.

1.2.1.2. Changes in financial markets

Because houses are assets in addition to goods, housing demand is affected by international financial markets. The

demand for houses from investors who are looking for assets depends in part on the return offered by competing

assets, such as government bonds. Such factors also affect mortgage rates. When it is cheaper to borrow money, each

homebuyer can afford to service a larger mortgage, so house prices increase.

Recent research by the Bank of England assesses the contribution of financial market conditions to house price growth

between 1985 and 2018. The authors assume that, in equilibrium, housing costs equal market rents. That is, at the

margin, some people are indifferent between owning a house and renting because the costs are the same.27 The costs

of home ownership include the opportunity cost of capital (the money used to buy a house could instead be invested

elsewhere), taxes, and maintenance, and are offset partially by expected capital gains.

This implies:

 Rent = house prices × (risk-free rate + maintenance + ownership taxes

 + depreciation rate and risk premium on housing – expected capital gains)

When rates fall, as they have in England (figure 11), investors demand more housing relative to other assets and

homebuyers borrow more because it is cheaper to service their mortgage.28 However, while interest rate falls can

increase demand for housing quite quickly, houses take time to build and supply cannot change in the short-term. This

means that the only way for the market to clear is for prices to increase.

19 — Founders Pledge Housing Affordability in England
Figure 11: Inflation-adjusted mortgage rates, 1996-2018. LTV stands for loan-to-value, so this is measuring the interest
rate on mortgages worth 75% of the price of property.

Source: "Tackling the UK Housing Crisis", Mulheirn

This has likely had a significant effect on house prices. Miles and Monro estimate that the falling risk-free rate alone

increased house prices by 108%, while rising incomes increased prices by 80%.29 Importantly, though, several other

assumptions contribute to this estimate, including assumptions about the response of housebuilders. In the next

section, we turn to these supply-side factors.

1.2.2 Inelastic housing supply
1.2.2.1. How supply elasticity affects housing costs

Multiple factors have contributed to increased demand for housing over the last few decades. But the effect of

increased demand on housing costs and house prices depends on the reaction of housing supply. The elasticity of supply

measures how much housing supply expands when prices increase. The lower this elasticity, the larger the effect of

demand changes on prices.

Supply elasticity in the UK is notoriously low.30 One estimate puts the UK’s supply elasticity at 0.395 compared to an

OECD average of 0.653.31 Other estimates suggest an even lower elasticity, possibly close to 0.32 In contrast, housing

supply elasticity is 2.01 in the US, 0.528 in Australia, and 0.428 in Germany, though in other countries such as the

20 — Founders Pledge Housing Affordability in England
Netherlands (0.186) and Switzerland (0.146) supply is less elastic than in the UK.33 Inelastic supply contributes to higher

house prices because if more houses are not built when demand increases, homebuyers will compete for the existing

homes and bid up prices. This will also raise rents because, in a competitive market, rental yields will stay relatively

constant.

When interest rates fall and housing demand grows, prices must increase in the short-term because houses take time to

be built. In the long-term, though, suppliers could react to higher prices by building more homes. This increased supply

would partly counteract the short-term price increase. Yet because the elasticity of supply in the UK is so low, the long-

term price increase is 90% as large as the short-term increase.34 In a counterfactual model holding all else constant, but

doubling the elasticity of supply, prices are estimated to be 9% lower in 2018.35 This underestimates the total effect of

inelastic supply because the model only considers price increases since 1985.

1.2.2.2. The cause of inelastic supply in England

Supply elasticity is strongly influenced by government housing policy. Research in other jurisdictions has found that

stricter regulations on development are correlated with higher house prices.36 In the US, Raphael finds a strong

correlation of r=.83 between median rent-to-income ratio and state regulatory stringency index.37

In England, the national planning system regulates development, and there are several reasons to think that this

system makes housing supply more inelastic.38 Its key feature is that the authority to approve or reject development

proposals rests with local authorities who have few incentives to approve development.39 This makes supply more

inelastic for several reasons:

 • The system lacks consistent rules governing land-use permissions. Instead, all new developments or

 renovations are subject to political approval from local authorities on a case-by-case basis.40 The uncertainty

 inherent in this process raises average development costs because builders have to account for the chance that

 their project will be rejected.

21 — Founders Pledge Housing Affordability in England
• In addition to this uncertainty, obtaining planning permission is a complicated and lengthy process.41 Appendix

 A.4. shows how burdensome the planning process can be.

 • Local authorities capture few of the benefits of development but absorb most of the negative externalities from

 construction and increased density.42 NIMBY (“Not In My Back Yard”) activists also apply political pressure.

 Local residents dislike development because it disrupts their life and in-migration will increase pressure on local

 amenities. Since current residents have a vote in local politics that potential future residents lack, local

 politicians have few incentives to approve developments.43

 • While increased development raises land values, local authorities capture few benefits, if any, though the

 council tax system.44 This means financial incentives are also lacking.

Because planning permission is difficult to obtain, land that already has planning permission is far more valuable than

land that lacks it. For example, receiving planning permission to convert agricultural land to residential use increases its

value by almost 100 times.45 In 2004, office space in Birmingham cost 44% more per square metre than it did in

Manhattan.46

Hilber and Vermeulen estimate the aggregate effect of the planning system by comparing house prices and regulatory

restrictiveness between 1974 and 2008. Figure 12 shows there is substantial geographic heterogeneity in planning

restrictiveness, with more restrictions in London and the South East.

22 — Founders Pledge Housing Affordability in England
Figure 12: Average refusal rate of residential projects with more than 10 dwellings, 1979-2008

Source: "The Impact of Supply Constraints on House Prices in England", Hilber and Vermeulen

Their results suggest that if the average refusal rate for major residential projects47 had been 16.7% instead of 25.4%,

house prices, and by extension rents, would be 14% lower today.48 If planning restrictions were fully relaxed they

estimate prices and, holding all else constant, rents would be up to 40% lower today.

1.2.3 Complications
Because data are limited and rent and income statistics can be interpreted in multiple ways, the severity of the housing

crisis has been intensely debated. Compositional change, household formation, inflation, and regional disparities all

stymie straightforward analyses of housing costs. We discuss this further in the appendix.

In the preceding discussion we have focused on rents, and specifically rent-to-income ratios, as the measure of

affordability wherever possible. However, data on prices are more readily available than data on rents. Where variables

affect prices without changing the housing stock, as falling interest rates do, then prices may move independently of

rents. In other cases where prices are affected by changes in the growth of the housing stock - for example, by

increased demand from rising income or supply restrictions from planning decisions - then prices and rents will be

23 — Founders Pledge Housing Affordability in England
correlated. This is because, as shown by the Bank of England’s model, the rent on a house is set in a competitive market

for assets. If the price of a housing asset falls due to a supply increase, then the rent will decrease proportionally so the

rental yield stays constant.

Because housing markets are complex and much of the evidence we present above was generated by modelling

exercises rather than experimental studies, our views here are uncertain. Overall, though, it seems likely that restrictive

planning has led to a lack of growth in the housing stock relative to rising incomes, and that this has put significant

upward pressure on both prices and rents. In the next section, we examine the various ways in which this has lowered

quality of life in England.

1.3 Effects on wellbeing
To estimate the welfare loss due to high housing costs, we focus on three main effects: lower productivity and incomes

due to reduced labour mobility, increased homelessness, and more unequal wealth distribution. In section 1.3.4., we

briefly discuss other plausible impacts, but do not quantify these in great detail.

1.3.1 Lower productivity
1.3.1.1. The effect of housing costs on labour mobility

On average, labour productivity is higher in cities. However, in England housing costs are also higher in cities.49 At the

margin, this will discourage some people from moving to work in these highly-productive areas. At the individual level,

the people who would have moved if housing costs weren’t so high end up working where wages are lower but housing

is more affordable. This leads to spatial misallocation of labour. In the UK, the Resolution Foundation has shown that

young people aged 25-34 are only one-third as likely to have moved home and changed jobs in the last year as they

were 20 years ago (figure 13).50

24 — Founders Pledge Housing Affordability in England
Figure 13: Proportion of 25-34 year olds renting privately in the UK who changed residence and jobs in the past year
(two-year rolling averages).

Source: "Moving Matters", Judge

A small but growing literature suggests that the overall impact of spatial labour misallocation is very large. Hsieh and

Moretti observe that low levels of housebuilding have depressed population growth in New York, San Francisco, and

San Jose, cities where productivity and income are high.51 They model the effects and estimate that reducing supply

restrictions in these cities to the level of the median American city would increase the annual growth rate of aggregate

output in their sample of 220 cities from 0.795% to to 1.49% between 1964 and 2009. This would cause U.S. GDP to be

8.9% higher in 2009, adding $1.28 trillion in economic output per year.52

We take this estimate as a theoretical upper bound because this growth acceleration requires enormous shifts in

population distribution. For example, in the counterfactual scenario New York and San Francisco grow 10 times and 7

times more than they actually have. Still, even when imperfect labour mobility is introduced to the model - i.e. when it

is assumed that moving is costly and people don’t always move to the best opportunity available - U.S. GDP is

estimated to be 3.7% higher in 2009, a gain of $540 billion annually.53

25 — Founders Pledge Housing Affordability in England
A recent working paper by Duranton and Puga supports Hsieh and Moretti’s estimates.54 Notably, their model

incorporates more realistic assumptions about the costs of urbanization, but finds similarly large effects of foregone

GDP growth due to restrictions on housing supply.55 Duranton and Puga model the effects of setting planning

restrictiveness in the three most productive U.S. cities to the level of the median U.S. city and find that the average real

income would grow by 8.2%, or about $5,000 per person.56

These estimates are highly uncertain and, like many modelling exercises, sensitive to assumptions. Nevertheless, we

note that even if they are overestimated by an order of magnitude, the annual cost of high housing costs as a result of

supply restrictions in the US is on the order of $50 billion to $100 billion annually, about 65% of which is foregone wages

for workers.57

1.3.1.2. Estimating the productivity effects in England

No similar exercise has been conducted for England. However, we think it is likely that the effects are even greater in

relative terms. Even in expensive American cities like New York and San Francisco, housing supply is more elastic than

in England.58 If we assume sluggish housing supply has lowered English GDP by between 1% and 10%, the total cost is

between £17.5b and £175 billion annually.59 In per capita terms, that’s between £260 and £2,650 per person and

probably borne disproportionately by lower-income people.

We can roughly estimate the potential costs for England by estimating the amount of foregone construction. Because

developers make decisions based on the price for which they can sell the home rather than the cost of the services it

provides, we measure foregone construction using prices rather than rents. As an upper bound for the price inflation,

we take Hilber and Vermeulen’s estimate that prices are up to 40% higher than they otherwise would be due to

regulatory restrictions on housing supply.60 As a lower bound, we take Miles and Monro’s estimate that prices would be

roughly 10% lower if supply elasticity was doubled.61 The true figure likely lies in the middle. Hilber and Vermeulen’s

estimate assumes total relaxation of regulatory constraints, which is infeasible. However, Miles and Monro only

measure the price increase since 1985, so almost certainly underestimate the total effect.

26 — Founders Pledge Housing Affordability in England
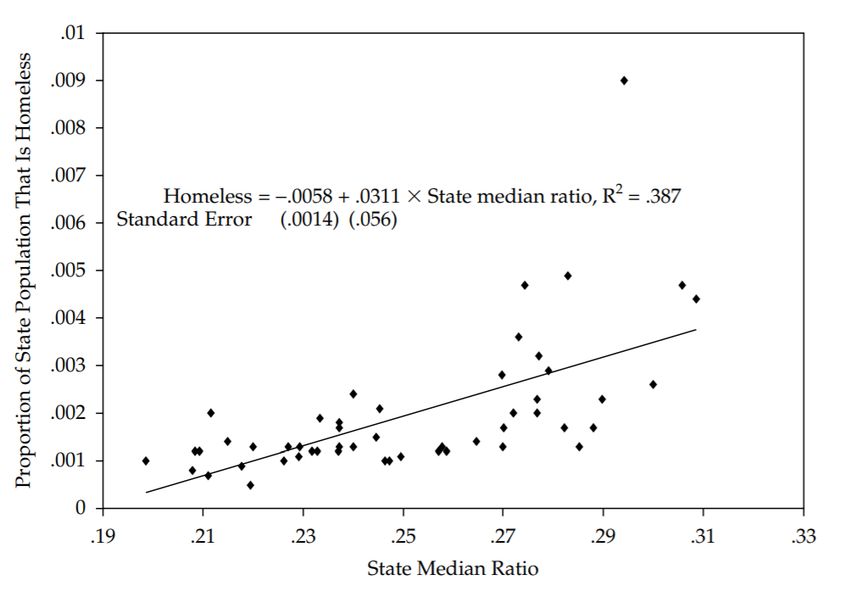
The elasticity of demand for housing with respect to price is about -0.4.62 Therefore, Britons would probably consume

5% to 22% more housing services if prices were between 10% and 40% lower. Overall, we estimate that, if lower prices

led to more construction, the value of the English housing stock would increase by about £100 billion to £400 billion

above its current value of ~£6 trillion.63

We can use gross value added statistics to get a sense of the potential productivity gains. Moving to a city like London is

associated with about a 20% boost to income64 as the median income in London is £10,000 higher than the median

income for the UK as a whole.65 If supply restrictions were dramatically relaxed, 300,000 additional homes in London

built over the next couple of decades is a reasonable goal.66 If we assume each new house is occupied by an average of

1.2 workers, the total income gains would be around £3 billion to £4 billion. If similar effects occurred in other urban

centres such as Oxford, Cambridge and Manchester, the annual gains could double to about £6 billion annually in lost

wages alone. This is almost certainly an underestimate of the economic effect as it does not account for the capital

share of the productivity boost or increasing agglomeration externalities.

1.3.2 Increased prevalence of homelessness
High housing costs also likely increase the prevalence of homelessness.67 Homelessness, of course, is a complex social

problem driven by a range of social, economic, and health factors. However, there is evidence that people in regions

with lower housing affordability are more likely to experience homelessness. Raphael, for example, documents a

reasonably strong correlation between homelessness incidence and rent-to-income ratios for US states (figure 14).

27 — Founders Pledge Housing Affordability in England
Figure 14: Proportion of state that is homeless on a single night vs state median rent-to-income ratio, 2007

Source: "Housing Market Regulation and Homelessness", Raphael

This does not prove that affordability has a causal effect on homelessness. States with nicer climates, for example, may

attract higher demand for housing and larger populations of people experiencing homelessness. The causal relationship

could also go the other way. Policymakers in regions with growing populations may introduce regulations on housing

supply to try and control migration. However, after controlling for multiple covariates Raphael still finds that reducing

housing costs by modestly reducing regulatory strictness could reduce homelessness at the national level by up to

22%.68

We have been unable to find similar research that explicitly links housing supply, affordability, and homelessness trends

in England. Some information is found in a housing model developed by Bramley et al. for the Ministry of Housing,

Communities and Local Government. Their results describe the elasticity of several measures of homelessness to house

prices and affordability ratios. They estimate that a 1% decrease in house prices would reduce homelessness by 0.18%69

and that a 1% decrease in the price-to-income ratio would reduce the incidence of concealed households by .36%70 and

overcrowding by 0.51%.71 These effects are very sensitive to assumptions, including the relative proportion of social and

28 — Founders Pledge Housing Affordability in England
private housing that comprise the increased housing supply. Nevertheless, we take them as weak evidence in support

of the hypothesis that a general increase in the supply of houses would reduce the incidence of homelessness in

England. If we combine Bramley et al.’s figures with a potential 20% to 40% decrease in housing costs, homelessness

may be reduced by ~3.6% to ~7.2%. These numbers roughly match Raphael’s estimates for the USA. Excluding

concealed households, this would imply that between 5,000 and 10,000 families, between 11,500 and 23,000 people,

and between 180 and 370 rough-sleepers would find housing.72

1.3.3 Distributional effects
High housing costs have other distributional effects, especially for people with low incomes and young people. First,

low-income renters spend a larger fraction of their earnings on housing. This means that increases in housing costs are

more burdensome for people lower on the income distribution. Malpezzi and Green show that in the US, holding all else

constant, moving from an area with few regulations on housing supply to an area with highly-regulated housing supply

disproportionately increases the rents of low-income renters.73 Raphael also documents adverse effects for low-income

renters.74 As previously discussed, this pattern is also evident in England.

Second, in the UK older and more educated people are more likely to own homes (figure 15). Those with post-

secondary education are 16 percentage points more likely to own a house, which is unusual for OECD countries.75 The

gap in home ownership rates between young and old people has also consistently widened as house prices have

increased. Constantly increasing house prices transfer wealth from renters, who tend to be younger, less educated, and

poorer, to older, wealthier, and more educated people, and make it harder for people in the former group to move to

the latter.

29 — Founders Pledge Housing Affordability in England
Figure 15: Tenure status by age group, 1977-2014

Source: "Economic Review: April 2016", Wales

Because obtaining planning permission is so valuable, relaxing regulatory restrictions may be a windfall to the owners

of land which otherwise would not have gained planning permission. To the extent that house prices fall as more homes

are built, people who are short housing, e.g. renters,76 will benefit, while those who are long, e.g. landlords and

homeowners, will lose out. Because homeowners are currently richer than average, we expect that this will make

overall wealth distribution more equal.

1.3.4 Quality of life and environmental benefits
It is plausible that increased housing supply could produce several other benefits.

Densification could lower commute times. A review paper finds that, among 15 large European countries, the U.K. has

the third-longest average commute. Commute length has been increasing for all age categories (figure 16).77

30 — Founders Pledge Housing Affordability in England
Figure 16. Mean travel time from home to work in minutes, by age, England

Source: "Moving Matters", Judge

There is some debate in the literature regarding the effect of commute length on life satisfaction.78,79 Nevertheless it

seems likely that shorter commutes are a positive side-effect of increased homebuilding and densification. Because the

effect is uncertain and seems likely to be less important than the productivity or homelessness effects, we do not

incorporate this into our cost-effectiveness analysis.

Increased homebuilding rates would lower the average age and increase the average quality of English homes.

Depressed rates of homebuilding also mean that the UK’s housing stock is unusually old and poor quality. The

proportion of buildings built before 1945 is higher in the UK than in any other EU country.80 The UK is one of only three

OECD countries in which maintenance of existing buildings accounts for more than 30% of total residential

investment.81 British homes are smaller on average, too.82 Over the last two decades floor space per person has grown

by only about 3%, whereas it appears to have increased by 18% in France and 28% in Japan.83 In the mid-1990s, the UK

had more floor space per person than both France and Japan; now it has less. In London, people are increasingly forced

to share homes to make them affordable.84

In addition to reducing home energy use, increased building could have other environmental benefits if it leads to more

densification. Urban expansion into rural areas could be slowed. Denser cities are also more walkable, more energy-

efficient, and support more environmentally-friendly public transportation systems.85

31 — Founders Pledge Housing Affordability in England
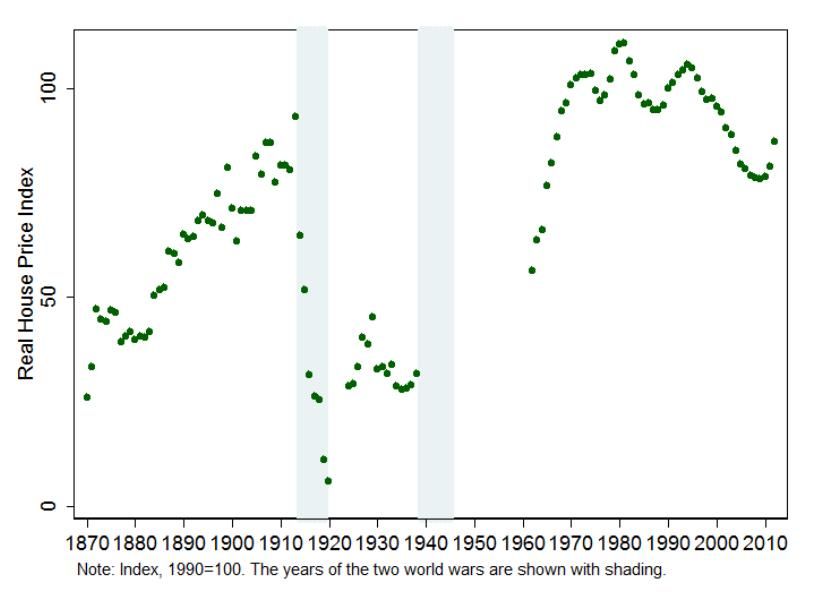
2 What are the potential solutions?
2.1 Prioritizing interventions
Given the above evidence, we considered interventions that would increase the elasticity of housing supply so that

more homes are built in response to growing demand for housing in England. Muellbauer, for example, identifies a

range of policy factors that explain the difference between the British housing market and the more affordable German

market. He proposes a reform agenda for the UK in two main areas: (1) tax reform to encourage better land-use and (2)

supply-side reforms to encourage the granting of more planning permissions, more release of public-sector land, more

financial incentives to grant planning permission, and more social housebuilding.86 We looked into three particular

approaches mentioned in the literature and by experts with whom we spoke: advocating for improvements to the

English planning system, directly subsidizing housing at below-market rates, and advocating for more social housing.

Planning reform is our preferred approach as it seems most likely to be cost-effective, politically feasible, and impactful.

2.1.1 Planning reform
A philanthropist could try to make private housing supply more responsive to changes in housing demand by

supporting efforts to improve planning policy. The unusually low elasticity of U.K. housing supply suggests there is

room for improvement. England’s discretionary planning differs from the rules-based systems of the USA, Denmark,

and Germany.87 Breach suggests that relatively low average rents in Tokyo are due in part to Japan’s simple zoning

system, which allows for “by-right” development.88 Muellbauer contrasts the UK and Germany, attributing the notable

divergence in affordability over the last three decades to a variety of factors, especially restrictive planning.89 Japan

(figure 17) and Germany (figure 18) prove popular comparisons because their house prices notably diverge from the

OECD trend.

32 — Founders Pledge Housing Affordability in England
Figure 17. Real house price index in Japan, 1913-2012

Source: "No Price Like Home", Knoll et al.

Figure 18. Real house price index in Germany, 1870-2012

Source: "No Price Like Home", Knoll et al.

Data on rents are more limited, but it’s notable that no German cities rank in the top 20 of Deutsche Bank’s list of the

most expensive cities for rent.90 Frankfurt is ranked 23rd, with an average rent 37% lower than London (ranked 6th).

Tokyo is 10th, with rents 19% lower than London. These rankings do not account for local earnings, but these are

roughly similar (Germany’s GDP per capita is actually 15% higher than the UK’s).

33 — Founders Pledge Housing Affordability in England
2.1.2 Directly subsidize or build below-market housing
Another approach would be to subsidize homebuilding or directly build homes at below-market rates. These

approaches are similar in that they increase the number of homes built in equilibrium by shifting the amount of demand

for or supply of housing. However, we did not look at these approaches in great detail because they seem unlikely to be

cost-effective. To have a meaningful impact on average housing costs in England, hundreds of thousands or even

millions more homes will need to be built. The total value of the English housing stock is about £6 trillion.91 So if a

philanthropist wanted to increase the housing stock by 1% and provide the additional homes at just 10% below market

rates, the cost would be on the order of £6 billion. Less lavish subsidies are just not large enough to improve housing

affordability on the scale required.

2.1.3 Advocate for more public housing subsidies
A philanthropist could also fund advocacy efforts to increase government housing subsidies. The government could

increase their support for housing benefit or build more social housing for rent at below-market rates. Modelling

presented in Bramley suggests that building more social housing reduces homelessness, though general supply

increases better address regional disparities and overall affordability.92

We did not deeply investigate this approach because policies that depend on large increases in public spending

currently seem politically infeasible.93 The Conservative’s 2019 election manifesto focused on private housing supply,

mortgage reform, and support for renovations instead of increased social housing support.94

2.2 Benefits of solving the problem
We focused on finding opportunities to advocate for improvements to the English planning system. The aim of these

improvements should be to reduce regulatory burdens, make housing supply more elastic, and increase the number of

homes being built in areas where demand is high and regulation is currently strict, i.e. in London and the Greater South

East (figure 19).

34 — Founders Pledge Housing Affordability in England
Figure 19: Theory of change for housing supply interventions

 Movement to
 high-income
 areas

 Lower prices
 More elastic Increased Reduced
 supply building homelessness

 Densification

We used a Guesstimate model to estimate the expected effect of adding between 20,000 and 300,000 homes to

London over the next 30 years.95 We assume there are 1.2 wage earners per household, in line with the national

average, and we assume that moving to London increases their productivity by between £5000 and £10,000.96 Finally,

we assume that increased homebuilding in London accounts for between 30% and 80% of the total benefits of planning

reform. This estimate is highly uncertain. London accounts for just ~20% of England’s population,97 ~25% of England’s

GDP,98 and ~30% of the value of the country’s stock.99 Planning reform could also have significant benefits by

increasing building in other productive areas like Oxford, Cambridge, and Manchester. Because London has the most

unaffordable rents and the most restrictive regulation, we expect the value of reform to be disproportionately

concentrated there, but it is plausible that more than half of the benefits could still flow from opening up access to

urban centres in the rest of the country.

Overall this model estimates that, once the homes are built, the benefits of planning reform are about £3 billion per

year in expectation. The total benefits over the next 30 years are about £67 billion. This seems likely to be an

underestimate because the lower bound for the number of additional homes is very conservative, the model also does

35 — Founders Pledge Housing Affordability in England
not account for increasing returns to urban agglomeration or other effects such as reduced homelessness or

environmental impacts. The highest estimates of the benefits of planning reform extend up to £600 billion per year.100

We are most likely to be underestimating the amount of extra building that could occur. For example, Cheshire and

Buyukileva estimate that if Green Belt permissions were slightly relaxed, up to two million new homes could be built

nationally and up to 900,000 in London.101 This is significantly higher than our estimate. It is also possible that we are

underestimating the productivity gains and the effects in the rest of the country beyond London. Together these

factors could depress our estimate by an order of magnitude. If instead, we simply assume that planning restrictions are

roughly as severe in England as they are in the US102 and that we solve just 10% of the problem, then the benefits would

be on the order of 1% of GDP, or about £20 billion per year.

The magnitude of other benefits, especially reduced homelessness, depend on the change in housing costs resulting

from the increased supply. We can roughly estimate the impact of increased supply on prices in London. While we care

about housing costs rather than house prices, note that the Bank of England model shows that, holding other demand-

side factors constant, a decrease in house prices should lead to a proportional decrease in housing costs.

The consensus in the literature is that, all else equal, a 1% increase in the housing stock is expected to reduce house

prices and rents by about 2%.103 London currently has about 3.5 million households and is expected to grow to about 4.3

million households over the next 20 years.104 If we could instantly add 200,000 homes in London, that would increase

the stock by 6% and reduce prices and rents by 12%. If we add those houses over the next 20 years, the stock will grow

by an additional 5% and prices and rents will be 10% lower. These figures are more conservative than other estimates:

the Bank of England model predicts a price decrease of 9% with increased supply elasticity, but this underestimates the

local effect because it is measured at the national level and only for the study period (1985-2018). Hilber and Vermeulen

estimate that reducing the regulatory burden in the South East to the level of the North East would eventually reduce

local prices by up to 25%.105

36 — Founders Pledge Housing Affordability in England
Overall, it seems reasonable to expect that increasing the supply of homes in London by an additional 200,000 units

would reduce prices and rents by at least 10%. We would expect increased internal and external migration in response

which would somewhat counteract the price decrease. However, this would not have a large effect on the total welfare

gains because those moves will likely be from areas with lower incomes.

2.3 Uncertainties
While the potential benefits from an improved English planning system seem considerable, there are a few good

reasons to be skeptical about advocating for policy change in this area. In particular, there are considerable political

economy challenges to overcome, the benefits are uncertain and may take decades to manifest, and there may be

costs to some people even if the net effects are positive.

2.3.1 Political economy challenges
Criticisms of the planning system date back to at least the 1970s, and were a key result of the government-sponsored

2004 Barker Review of Housing Supply.106 Yet house price-to-income ratios have continued to rise and rent affordability

does not seem to have improved. This suggests that there are substantial political barriers to reform.

One concern is that strict regulations may be largely endogenous; that is, that regions which are growing quickly may

enact more regulations to try and slow in-migration.107 Deteriorating housing affordability is not a problem unique to

the UK. Recall from the first section of this report that the UK is far from the only high-income country in which house

prices have increased over the last few decades (figure 19).

37 — Founders Pledge Housing Affordability in England
Figure 19. Mean and median real house price growth, OECD countries

Source: "No Price Like Home", Knoll et al.

The endogeneity explanation would explain why multiple markets saw a similar pattern of extreme house price growth

without a strong supply response in response. While it does not mean that increasing supply elasticity would be useless,

it does mean that proposed reforms may face strong social and political opposition.

2.3.2 Skepticism about the effect of supply-side reforms
Some researchers are also skeptical that even substantially increased homebuilding would meaningfully reduce

housing costs. The English housing stock comprises about 24 million homes108 and between 100,000 and 200,000 new

houses are already built per year.109 An additional ~30,000 properties are added to the stock through ‘change-of-use’

(often office buildings converted to apartments) each year, although this is not sustainable because there are limits to

the number of convertible buildings.110 That means that the stock is only growing by about .5% to 1% per year. Recall

that Miles and Monro estimated that if housing supply had been twice as elastic between 1985 and today, house prices

in England would be 9% lower.

Similarly, were we to make supply more elastic today, prices would only be noticeably reduced over decades. Let us

again assume a price elasticity of demand for housing between -1.1 and -2.2. England had about 24.2 million homes in

38 — Founders Pledge Housing Affordability in England
You can also read