WSDOT Equity Study Authors: Audrey Barber Brianna Berkson Natalie Furness Sarah Thorsteinson - WWU CBE
←
→
Page content transcription
If your browser does not render page correctly, please read the page content below
WSDOT Equity Study                                          Authors:
Prepared by the Center for Economic and Business Research   Audrey Barber
                                                            Brianna Berkson
                                                            Natalie Furness
                                                            Sarah Thorsteinson

                                                                              1|Page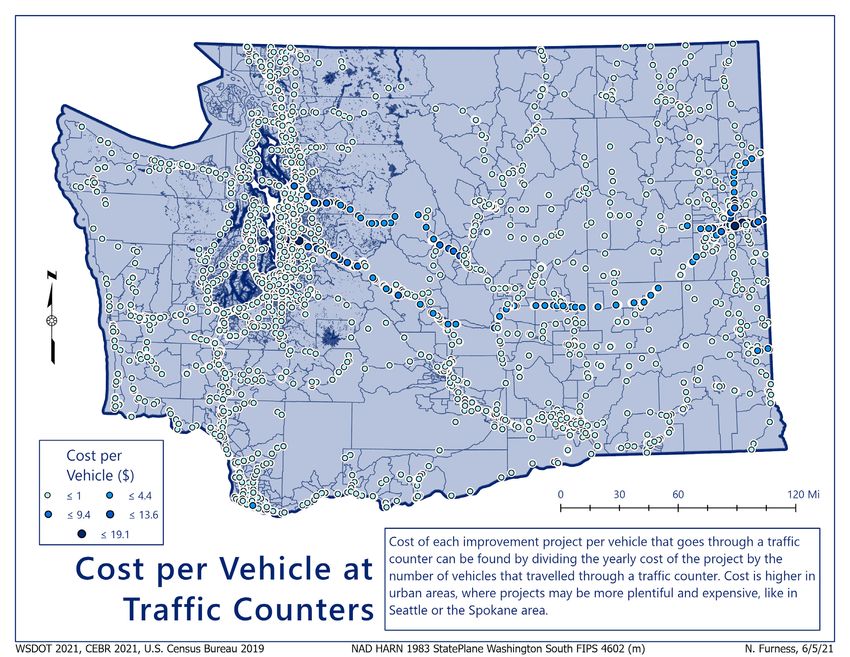
Table of Contents
About the Authors ........................................................................................................................................ 4
Executive Summary....................................................................................................................................... 5
   Report Structure and Key Questions ........................................................................................................ 5
   Summary of Findings................................................................................................................................. 6
       Question 1 – Equitable Compensation in Property Acquisition ........................................................... 6
       Question 2 – Equity of Highway Construction Program Investments .................................................. 6
       Question 3 – Workforce Representation .............................................................................................. 6
       Question 4 – Distribution of Benefits for Transportation Investments ................................................ 8
Question 1 – Equitable Compensation in Property Acquisition ................................................................... 9
   Methods .................................................................................................................................................... 9
   Results ..................................................................................................................................................... 10
Question 2 – Equity of Highway Construction Program Investments ........................................................ 12
   Methods .................................................................................................................................................. 12
   Income .................................................................................................................................................... 13
   Communities of Color ............................................................................................................................. 14
Question 3 – Workforce Representation .................................................................................................... 16
   Part 1 – Demographic Representation.................................................................................................... 16
       Methods .............................................................................................................................................. 16
       Average Percent of People of Color & Mean Annual Household Income .......................................... 17
       Applicants and New Hires of Color from 2018-2020 .......................................................................... 18
       Female Applicants and New Hires from 2018-2020 ........................................................................... 20
   Part 2 – Literature Review on Recruitment ............................................................................................ 24
       WSDOT Recruitment Process .............................................................................................................. 24
       WSDOT’s Commitment to a Diversified Workforce ............................................................................ 25
       Best Equitable Recruitment Practices ................................................................................................. 28
       Focus on Building Talent Pipelines...................................................................................................... 28
       Update Codes of Ethics and Job Descriptions ..................................................................................... 29
       Emphasize Competitive Benefit Offerings in Job Postings and Descriptions ..................................... 30
       Streamline HR Processes with Technology ......................................................................................... 31
       Social Media ........................................................................................................................................ 31
       Market to Individuals with Disabilities................................................................................................ 32

                                                                                                                                                 2|Page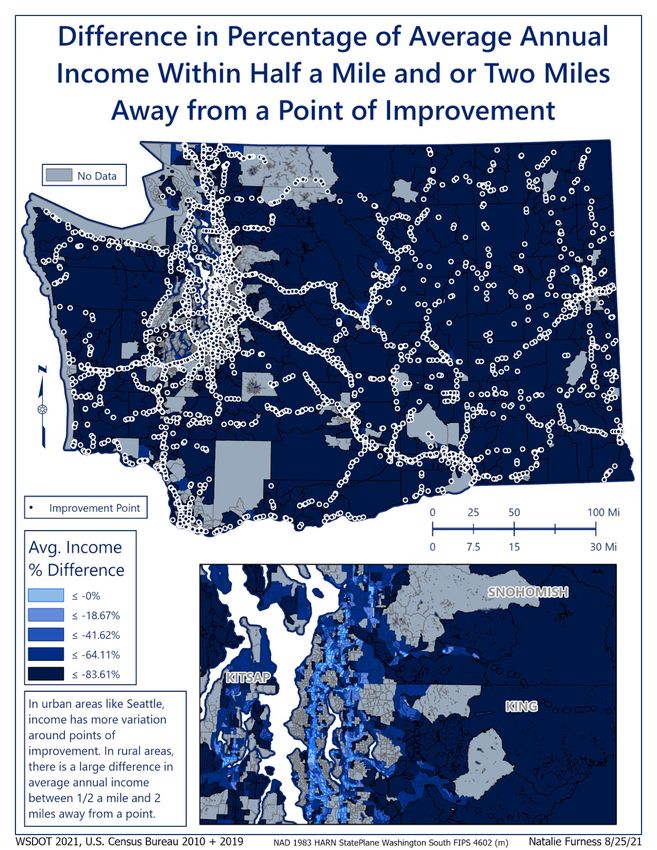
Implicit Bias Training ........................................................................................................................... 32
       Retention Strategies ........................................................................................................................... 32
       Additional Resources .......................................................................................................................... 33
       Reforming the Recruitment Process ................................................................................................... 34
       Recruitment Practices that WSDOT can Implement ........................................................................... 37
   Part 3 – Analysis of Compensation ......................................................................................................... 39
       Regional Comparisons......................................................................................................................... 39
       Demographic Comparisons ................................................................................................................. 44
       Income ................................................................................................................................................ 46
Question 4 – Distribution of Benefits for Transportation Investments ...................................................... 52
   Active Transportation Investments......................................................................................................... 53
   Accessibility and Mobility ....................................................................................................................... 55
   Highways, Freeways, and Roads ............................................................................................................. 57
   Bus and Rail ............................................................................................................................................. 60
   Environmental Justice ............................................................................................................................. 64
   Equitable Planning and Policies for Transportation Investments ........................................................... 66
       Sault Ste. Marie Tribe of Chippewa Indians Michigan ........................................................................ 66
       Decatur, Georgia ................................................................................................................................. 66
       Nashville, Tennessee ........................................................................................................................... 67
       Portland, Oregon................................................................................................................................. 67
Bibliography ................................................................................................................................................ 70

                                                                                                                                                3|Page
About the Authors
The Center for Economic and Business Research is an outreach center at Western Washington University
located within the College of Business and Economics. In addition to publishing the Puget Sound
Economic Forecaster, the Center connects the resources found throughout the University to assist for-
profit, non-profit, government agencies, quasi-government entities, and tribal communities in gathering
and analyzing useful data to respond to specific questions. We use a number of collaborative
approaches to help inform our clients so that they are better able to hold policy discussions and craft
decisions.

The Center employs students, staff, and faculty from across the University as well as outside resources
to meet the individual needs of those we work with. Our work is based on academic approaches and
rigor that not only provides a neutral analytical perspective but also provides applied learning
opportunities. We focus on developing collaborative relationships with our clients and not simply
delivering an end product.

The approaches we utilize are insightful, useful, and are all a part of the debate surrounding the topics
we explore; however, none are absolutely fail-safe. Data, by nature, is challenged by how it is collected
and how it is leveraged with other data sources. Following only one approach without deviation is ill-
advised. We provide a variety of insights within our work – not only on the topic at hand but also the
resources (data) that inform that topic.

We are always seeking opportunities to bring the strengths of Western Washington University to
fruition within our region. If you have a need for analysis work or comments on this report, we
encourage you to contact us at 360-650-3909 or by email at cebr@wwu.edu.

To learn more about CEBR visit us online at https://cebr.wwu.edu or follow us online through your
favorite social media stream.

       facebook.com/westerncebr

       twitter.com/PugetSoundEF

       linkedin.com/company/wwu-center-for-economic-and-business-research

       instagram.com/wwucebr

The Center for Economic and Business Research is directed by Hart Hodges, Ph.D. and James McCafferty.

                                                                                               4|Page
Executive Summary
The Washington State Department of Transportation (WSDOT) tasked the Center for Economic and
Business Research (CEBR) with broadly exploring the overall equity of the agency’s operations. The four
key areas for consideration in this equity study are: land acquisitions, investments in highway
construction, employee recruitment and compensation, and general industry trends in benefits
distribution.

The goal of this study is to serve as a starting point for future research and exploration of equity within
WSDOT, rather than to provide concrete answers or next steps. Throughout the report, we will highlight
key literature on transportation equity and best practices. Data provided by WSDOT further illuminates
areas for improvement and future research.

Report Structure and Key Questions
In designing this project, WSDOT has four key questions surrounding the equity of the agency and its
operations. The following report is organized into four distinct sections to address each of these
questions:

    •   Question 1 – Equitable Compensation in Property Acquisition
           o Is WSDOT offering equitable value based on surrounding land values during the right of
               way and condemnation process?

    •   Question 2 – Equity of Highway Construction Program Investments
           o Are investments being made equitably?
           o Where are the investments being made? Where are they not being made?

    •   Question 3 – Workforce Representation
           o Is the WSDOT workforce demographically reflective of the communities they serve?
           o Are WSDOT’s wages equitable when compared internally and externally?

    •   Question 4 – Distribution of Benefits for Transportation Investments
           o What value and benefits do different income and racial groups receive from
               transportation system investments?

                                                                                               5|Page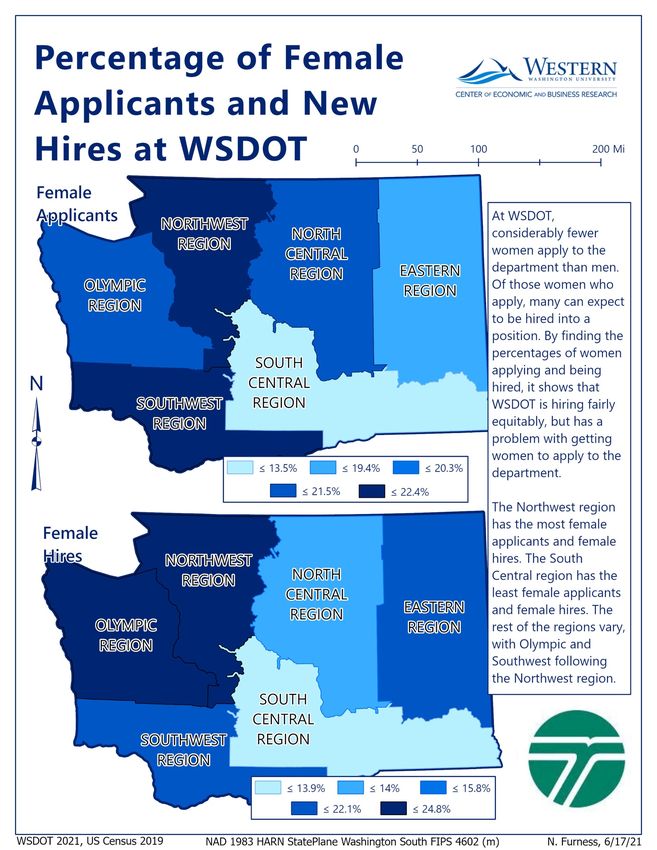
Summary of Findings
Below is a brief summary of the key findings from each of the four report sections. More detailed
methodology, analysis, findings, and recommendations for further research can be found within the
body of the report.

Question 1 – Equitable Compensation in Property Acquisition
   •   On average, WSDOT pays less per square foot than private buyers within ½ mile
   •   However, the land WSDOT purchases tends to be of significantly lower assessed value than the
       average property within ½ mile
   •   This suggests that WSDOT is paying more for their acquisitions than the expected sales price in
       the private market
   •   Note: this analysis considers a limited set of data and is unable to account for the wide range of
       variables needed to conduct a true property valuation

Question 2 – Equity of Highway Construction Program Investments
   •   Income Patterns:
           o Household incomes within ½ mile of WSDOT points of improvement are significantly
               lower than those within a 2-mile radius
           o This is likely a product of lower property values near major infrastructure
   •   Demographic Patterns:
           o Unlike income patterns, the analysis found no significant difference in the prevalence of
               communities of color between the ½ mile and 2-mile buffers
   •   These results likely do not show a bias by WSDOT, but rather reflect structural and historical
       factors which have pushed lower-income households into less-desirable land near major roads
       and highways

Question 3 – Workforce Representation
   •   Part 1 – Demographic Representation
           o When looking at applicants and new hires, the WSDOT region that hires the most people
                of color and has the highest number of applicants of color is the Northwest region. The
                region with the lowest number of applicants of color and new hires is the Eastern
                region.
           o For female applicants and new hires, the regions on the Western side of the state have
                the highest numbers for both.
           o In addition, the Northwest region had the highest starting salaries for new hires.
                However, more analysis may be needed to determine the differences in starting
                positions across the regions.

                                                                                              6|Page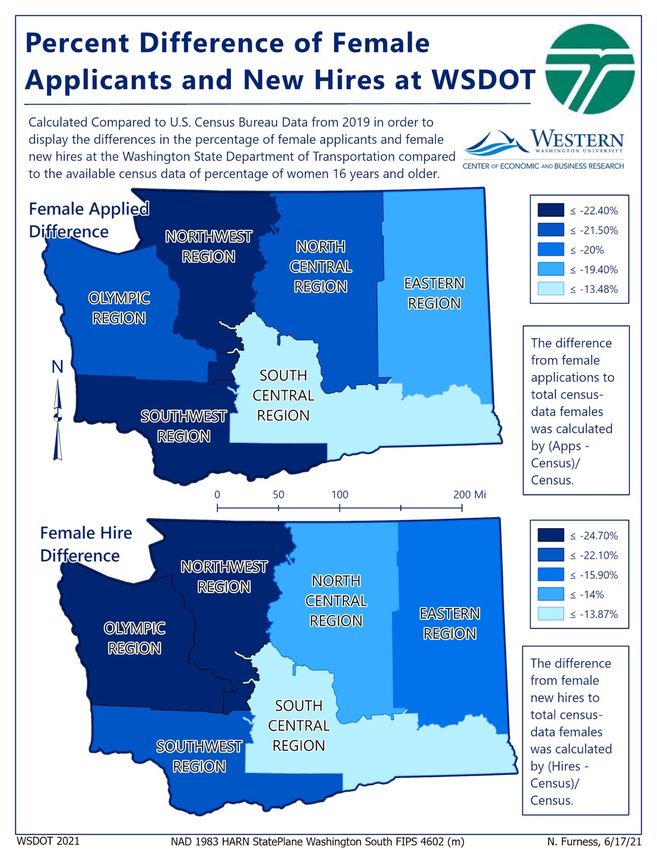
• Part 2 – Literature Review on Recruitment
o Reviewed literature from consulting companies, public agencies, blogs, and universities
on the best recruitment practices to foster a diverse workforce and compared to
WSDOT’s recruitment and hiring practices.
o An overview of WSDOT’s recruitment process shows a commitment to building a diverse
workforce. The Human Resources Department has demonstrated a strong
implementation of the recruitment practices discussed in the literature. Although there
is significant room for improvement, current metrics are showing promising progress.
o There are multiple key factors identified in the literature that WSDOT has policies to
address. These include use of social media for marketing and outreach, decreasing the
time to fill for open positions, marketing to individuals with disabilities, and mandatory
agency-wide trainings.
o Moving forward, WSDOT could consider continuing to decrease the average time to fill
for the agency, transition from a transactional to consultative recruitment process,
reduce the difference between diverse applicants and diverse new hires, update the
language in job postings and descriptions, and develop retention strategies.
• Part 3 – Analysis of Compensation
o For new WSDOT hires in many job codes, the median base salary was less than the
average entry-level wage of similar jobs in the region.
This was most prevalent in WSDOT’s Eastern and North Central regions
o Average new-hire salaries were $2,552 higher for women than men and $1,764 higher
for the hiring of people of color compared to White hires.
After accounting for job codes, there is no clear pattern of over or
underpayment by race or gender.
o The data does not show any patterns of over or under payment by demographic group.
Disaggregated by region, there were a significant number of sectors within the agency
that had median compensation levels below the average, regional, entry-level salary.
o The Northwest Region has significantly higher starting salaries compared to the other
five regions in the state.
o Based on cost-of-living data, the North Central Region has a higher average income than
expected. The Southwest and Olympic Regions has lower than expected average income
based on cost-of-living data.
7|Page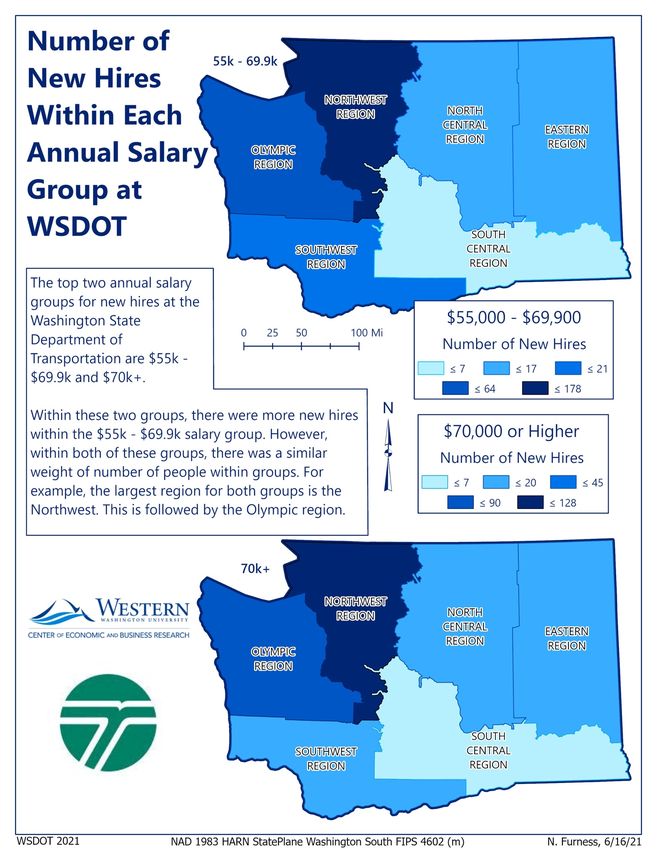
Question 4 – Distribution of Benefits for Transportation Investments
   •   Investments are becoming highly car-based which is disadvantageous to low-income individuals
       that are unable to afford a vehicle.
   •   Active transportation can fill gaps in transportation; however, investment is not always placed
       equitably for those who use public transportation the most (low income and communities of
       color).
   •   Highway infrastructure investment may aid in decreasing income inequality.
   •   Light rail investments are mainly used by higher income, White individuals, thus leading to
       gentrification of surrounding neighborhoods, despite goals to improve access to public
       transportation.
   •   Equitable transportation planning involves community involvement and incorporating multiple
       forms of transit.

                                                                                            8|Page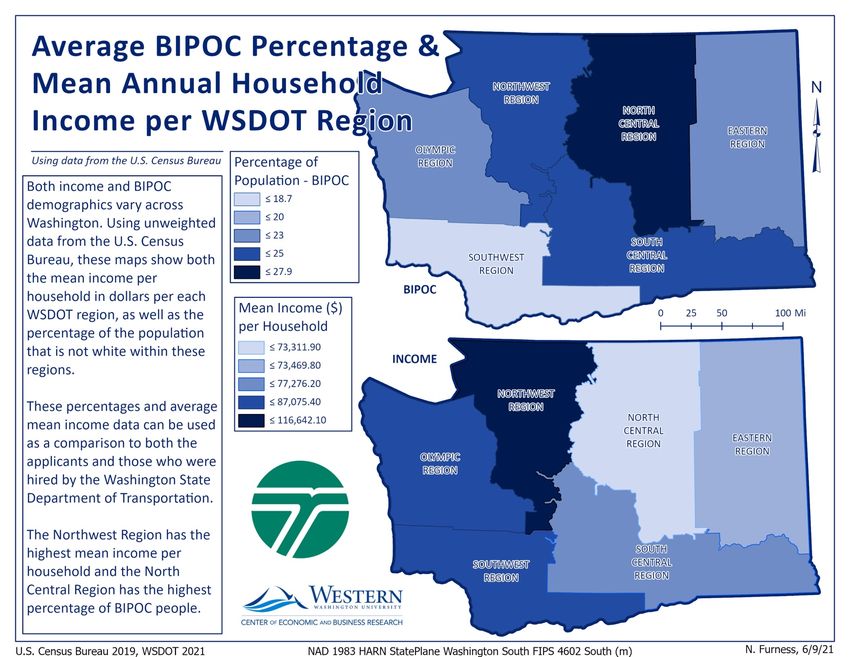
Question 1 – Equitable Compensation in Property Acquisition
The goal of this section is to examine the equity of WSDOT’s compensation for property acquisitions.
For instance, consider the owner of a piece of land. If the owner lists that piece of land, how much
would they make in the private market? How does this compare to what WSDOT would offer for that
same piece of land? In an equitable scenario, WSDOT would pay the market value of the land.
It is important to note that property valuation is a complex process that involves many variables that
were not able to be incorporated into this analysis. Instead, this modeling considers a series of three
difference equations. These equations compare WSDOT’s compensation of property owners to nearby
private transactions and the assessed value of the properties. All comparisons are made in dollars-per-
square-foot terms to standardize the data.
Based on the modeling used in this report, we find that WSDOT’s compensation of property owners may
be greater than what a private buyer would be willing to pay. Various factors, including small sample
sizes and limited variables may be able to explain these differences.

Methods
Using WSDOT, Northwest Multiple Listing Service (NWMLS), and assessor’s data, we compared values in
standardized, dollars-per-square-foot terms. This was done using three equations:

        Equation 1: Comparing WSDOT purchase prices to nearby (½ mile) private transactions

                ([WSDOT Purchase Price – Nearby Purchase Price] / Nearby Purchase Price) * 100

        Equation 2: Comparing the assessed value of WSDOT purchases to nearby (½ mile) land values

                ([WSDOT Assessed Value – Nearby Assessed Value] / Nearby Assessed Value) * 100

        Equation 3: Comparing the difference in purchase prices to the difference in assessed values

                [Equation 1 – Equation 2]

To make the data comparable, a few tools were used within ArcGIS Pro. After joining the WSDOT data to
the parcels and the private real estate data to block groups, the compensation or value of land was
divided by the square footage of the land obtained. For private real estate data, lands purchased were
included if they were within a half mile of a parcel that WSDOT purchased.

                                                                                             9|Page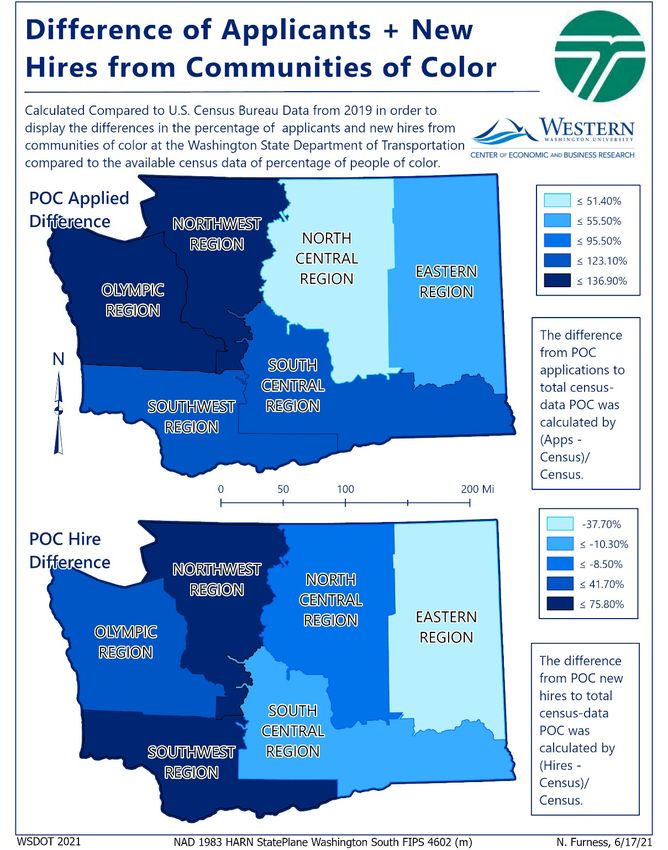
Results
Findings from this analysis do not suggest any systemic equity issues in WSDOT’s compensation of
property owners. Again, it should be noted that this analysis only considers three datapoints – WSDOT
purchase price, private land transactions, and assessed value. A more accurate valuation would take
into consideration many other factors that were not available to this research team.
When considering both partial-parcel and full-parcel acquisitions, we see that WSDOT tends to pay less
than nearby private transactions (Column 3), but that the land WSDOT purchases tends to be of
significantly lower value than nearby private transactions (Column 6). Ultimately, WSDOT on average
paid more than the private market in 9 of 14 instances (Column 7).
For an example of interpreting the table below, consider Clark County in 2019. On average, WSDOT paid
48 percent less per square foot than nearby private transactions (Column 3). However, the land being
purchased had an average assessed value 77 percent lower than nearby private transactions (Column 6).
Subtracting Column 6 from Column 3 shows a 29 percentage point difference (Column 7). This means
that, on average, WSDOT is likely to have paid more than a private buyer would have.

                      Table 1: Summary of Outputs by Year and County (Partial and Full Parcel Acquisitions)

   Averages ($/sf)     (1)          (2) Average   (3) Average        (4)         (5) Average    (6) Average           (7)
  Including Partial    Average      Nearby        Difference:        Average     Nearby         Difference:           Column 3
 and Total WSDOT       WSDOT        Private       WSDOT vs.          WSDOT       Private        WSDOT vs.             minus
    Acquisitions       Purchase     Transaction   Nearby Private     Assessed    Transaction    Nearby Private        Column 6
                       Price                      Transaction        Value       Assessed       Transaction
                                                  Price                          Value          Assessed Value
 2020-    King            $84.08       $120.97               -33%     $292.32          $95.08                  59%        -92%
 2021
          Pierce          $11.22         $20.51              -40%        $9.17         $17.11                 -62%         21%
          Thurston        $10.31         $83.75              -67%        $0.68         $28.25                 -98%         30%
          Whatcom         $33.76       $212.97               -55%        $2.49         $37.42                 -93%         39%
 2019     Clark           $12.00         $23.04              -48%        $3.77         $16.41                 -77%         29%
          King           $143.45       $165.30               -22%       $61.58       $141.89                  -50%         28%
          Pierce           $9.56         $25.47              -59%        $6.92         $26.56                 -74%         15%
          Thurston         $7.31         $80.54              -91%        $0.10         $36.69                 -100%         9%
 2018     Clark           $10.16         $35.61              -71%        $4.75         $36.00                 -87%         16%
          Cowlitz          $8.06         $31.01              -64%        $6.81         $17.52                 -50%        -15%
          King            $17.51       $117.91               -83%       $33.44         $98.60                 -67%        -15%
          Kitsap          $22.34         $66.22              -62%       $57.21         $37.60                  51%       -113%
          Pierce           $8.64         $53.62              -81%        $4.60         $62.76                 -93%         12%
          Thurston         $5.91         $64.47              -90%        $4.03         $15.33                 -73%        -17%

                                                                                                                  10 | P a g e
Looking only at WSDOT’s full-parcel acquisitions shows slightly different trends. It is important to note
here that WSDOT makes far more partial-parcel acquisitions, so the sample sizes in this analysis are
small. In this table, we see that WSDOT occasionally pays more on average than private buyers;
however, the land WSDOT buys consistently is of lower value than the surrounding area on average. In
all but one case – Cowlitz County in 2018 – WSDOT is estimated to have paid more on average than a
private buyer.
Table 2: Summary of Outputs by Year and County (Full Parel Acquisitions)
Averages ($/sf) (1) (2) Average (3) Average (4) (5) Average (6) Average (7) Column 3
Excluding Partial Average Nearby Difference: Average Nearby Difference: minus
WSDOT WSDOT Private WSDOT vs. WSDOT Private WSDOT vs. Column 6
Acquisitions Purchase Transaction Nearby Private Assessed Transaction Nearby Private
Price Transaction Value Assessed Transaction
Price Value Assessed Value
2020- King $277.93 $105.97 67% $20.53 $87.92 -85% 153%
2021 Pierce $56.90 $28.56 99% $51.20 N/A N/A N/A
Whatcom $33.76 $212.97 -55% $2.49 $37.42 -93% 39%
2019 King $290.14 $188.87 59% $19.43 $166.54 -76% 136%
Pierce $14.30 $23.20 -33% $2.81 $23.40 -88% 55%
2018 Clark $10.16 $35.61 -71% $4.75 $36.00 -87% 16%
Cowlitz $13.35 $25.35 -39% $12.24 $13.33 -8% -31%
King $46.75 $96.22 -42% $7.77 $73.99 -92% 51%
Pierce $9.75 $58.34 -78% $5.20 $68.68 -92% 14%
11 | P a g eQuestion 2 – Equity of Highway Construction Program Investments
This section explores whether WSDOT’s highway construction program investments are being made
equitably. The goal is to understand the demographics of those who benefit from these investments
and those who experience more of the negative impacts.
Looking at income, those living within ½ mile of WSDOT’s highway construction projects have
significantly lower incomes than those living within 2 miles of the project. These differences are smaller
in more densely populated areas and more pronounced in rural areas.
In contrast, the modeling suggests that there is a similar presence of communities of color within ½ mile
and 2 miles of WSDOT’s highway construction projects. This indicates that the benefits and costs of
WSDOT’s projects are not disproportionately distributed based on race, at least within the defined 2-
mile radius.
Methods
For question two, the main goal was to understand and analyze the demographics of people living near
WSDOT’s recent points of improvement. To do this, we ran the same analysis for income and
race/ethnicity within ½ a mile and 2 miles of a point of improvement.
Within ArcGIS Pro, waterways were removed from the block group layer, since they were not needed for
analysis. A half mile buffer or a 2-mile buffer was then created around each improvement point. Using
the union tool, we connected these buffer areas with block groups. This allowed the calculation of
subareas (the area of buffers within block groups) and the resulting weight (Area / Subarea).
This weight calculation allows for the construction of weighted values for each buffer-block group area.
The displayed values were calculated by multiplying these weights by the corresponding demographic
characteristics of the region.
To calculate the difference in income between ½ a mile and 2 miles, the following formula was used for
both differences in weighted average income and the percentage of communities of color in the buffers:
100 * ([weighted avg. within ½ mile] – [weighted avg. within 2 miles]) / (weighted avg. within 2 miles)
12 | P a g eIncome
Our findings indicate that points of improvement are being made mainly near areas with higher
concentrations of low-income individuals. This is a likely result of lower property costs near major
roads, highways, and other infrastructure.
In Washington’s Figure 1: Difference in average household income by proximity to WSDOT improvement
largest
metropolitan
areas –
Snohomish, King,
Clark, and
Spokane – these
disparities
between buffers
were the
smallest. This
may be a product
of high density
and high demand
keeping property
values more
uniform
regardless of
proximity to
infrastructure. In
less populated
counties across
eastern
Washington,
average incomes
were more than
80% lower within
½ mile of the
improvement
compared to
incomes within a
2-mile radius.
13 | P a g eCommunities of Color
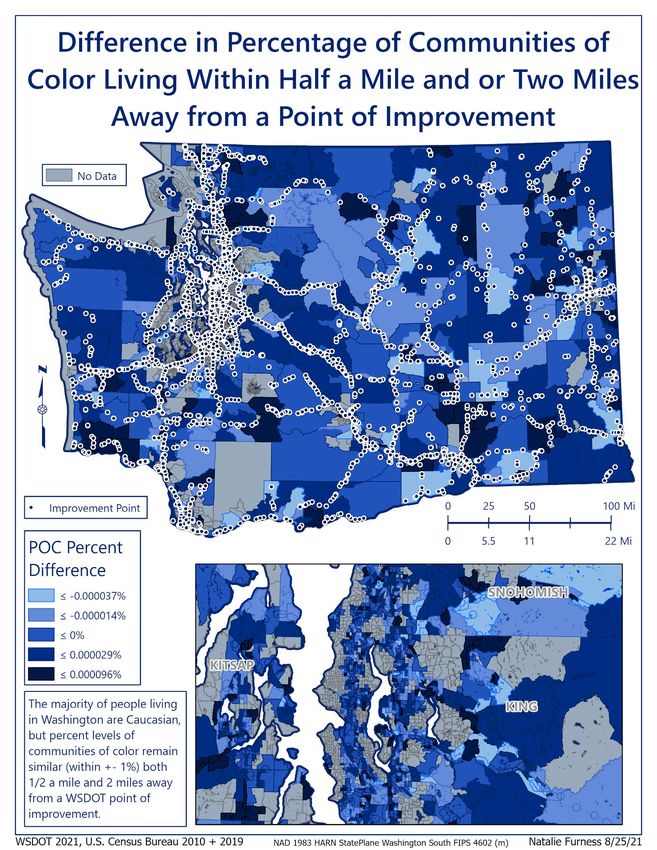
When comparing the percentage of communities of color within ½ mile and 2 miles of a WSDOT
improvement, differences are negligible. This contrasts with the substantial differences in income seen
between the two buffers and suggests that these improvements do not have a disproportionate positive
or negative impact on communities of color.
Figure 2: Showing difference (%) between POC ½ mile and 2 miles from points of improvement
14 | P a g eCost Per Vehicle
Our findings imply that WSDOT’s highway construction projects are generally low cost on a one-year,
per-vehicle basis. The points with higher costs could imply that either the investments are costly or that
those points of improvement are being made in areas that do not get as much traffic. For some of the
points in central Washington, for example, this could be an example of the road not being used as
frequently, since they are further from the city and population in those areas is much smaller. In Seattle,
the concentration of traffic counters and traffic is much higher, which may be why cost per vehicle is
low.
This map indicates that the cost of each improvement project per vehicle (in a 1-year timeframe) for
most traffic counters is less than $1. 1 Costs per vehicle are higher in Spokane, Seattle, and parts of the
major roadways between. There are only a few improvement points with a high cost per vehicle
($13.60-$19.10), and they are in the center of the Seattle and Spokane areas.
Figure 3: Map showing cost per vehicle at traffic counters
1
Based on the traffic count data provided by WSDOT.
15 | P a g eQuestion 3 – Workforce Representation
This section of the report explores the question of equity through the lens of WSDOT’s workforce.
Analysis is separated into three distinct parts:
• Part 1 – Demographic Representation
• Part 2 – Literature Review on Recruitment
• Part 3 – Analysis of Compensation
Part 1 – Demographic Representation
The key findings from an analysis on WSDOT’s workforce demographics are:
• There is a higher percentage of applicants of color than new hires of color.
• There is an over representation of applicants of color in all six counties
o New hires, who are of color, are underrepresented in the North Central, South Central,
and Eastern Regions
• The difference between the percentage of female applicants in each region to percentage of
female hires in each region is low.
• Female applicants and new hires are underrepresented in all six regions throughout the state.
The most notable underrepresentation is in the Northwest and Olympic regions.
One possible avenue for future research would be to detail SOC level data with industry level data to be
able to conclude whether there is an industry-wide structural bias that is leading to the disparity
between male and female new hires at WSDOT.
Methods
The main goal of question three is to compare the demographics and income from the U.S. Census
Bureau to the new hires and applicants to WSDOT. Analysis for this was kept simple by connecting the
data to the corresponding WSDOT region and displaying the unweighted value. These values could then
be used to calculate the differences between the U.S. Census Bureau and applicants and the U.S. Census
Bureau and new hires. The same formula used for differences in the previous questions was used to
calculate differences in question three.
16 | P a g eAverage Percent of People of Color & Mean Annual Household Income
This map shows the average population for people of color percentage for six regions in Washington
State in conjunction with the average household income for those same regions. The purpose of this
map is to illustrate the average population of people of color and household income for each county to
compare to the demographics and socioeconomic characteristics of WSDOT job applicants and new
hires.
Figure 4: Average % of people of color and household income by region
17 | P a g eApplicants and New Hires of Color from 2018-2020
This section compares the percentage of applicants of color to open positions within WSDOT to the
percentage of applicants of color that were hired into those positions. The key finding here is that there
is a higher percentage of applicants of color than hires of color. This is to be expected to some degree,
as there are many factors at play within the hiring process. However, this percentage difference may be
pointing to issues within the recruitment and hiring process that are leading fewer hires from
communities of color. Additionally, the Center found that the number of applicants of color is over
representative in each of the six regions. However, the percentage of hires of people of color is under
representative of the region’s population of people of color in half of the six regions.
2018-2020 Applicants from Communities of Color
For the six regions in Washington State, this map shows the percentage of job applicants from
communities of color. From 2018 to 2020, the Northwest Region had the highest percentage of
applicants of color, between 31.8 and 37.1 percent. The Eastern Region has the lowest percentage of
applicants of color, with less than 20.6 percent.
Figure 5: % applicants of color per WSDOT region.
18 | P a g e2018-2020 New Hires of Color
In comparison to the percentage of job applicants of color from 2018-2020, this map shows the
percentage of new hires of color from those applicants. In half of the six regions, 12.8 to 17.7 percent
new hires were people of color. The Northwest Region had the highest percentage of new hires color
while the Eastern Region had the lowest percentage. This aligns with the pattern observed from the
percentage of applicants of color from each region.
Figure 6: New hires of color (%) at WSDOT
Percent Difference of Applicants of Color and New Hires at WSDOT
This map illustrates percentage differences for applicants and new hires of color for each region in the
state. For these calculations, a zero percent difference would mean that WSDOT’s workforce is exactly
representative of the population. Any negative percent difference reflects under representation and any
positive percent difference represents overrepresentation.
The percent of people of color applicants is overrepresented compared to the people of color
population in each of the six regions. However, the hiring of people of color is underrepresented in the
North Central, South Central, and Eastern Regions. While the Northwest, Southwest, and Olympic
19 | P a g eregions have an over-representation of hiring from communities of color, the percentage is less than for
the applicant pool. Focusing on the North Central, South Central, and Eastern Regions, these maps
highlight a pattern of over representation of applications from people of color to WSDOT positions but
an underrepresentation of new hires from communities of color, meaning far fewer people of color
applicants are being offered positions at the agency than are applying.
Figure 7: Difference (%) of applicants of color and new hires at WSDOT
WSDOT Recruits a
Qualified Applicant
Pool That is More
Diverse Than the Local
Population
However, WSDOT’s
Hires Are Less Diverse
Than the Pool of
Qualified Applicants in
Every Region. In the
Eastern and South
Central Regions, Hires
are Less Diverse Than
the Local Population.
This Suggests That
Qualified Applicants
Who Are People of
Color are Less Likely to
be Hired Than an
Equally Qualified
White Applicant
20 | P a g eFemale Applicants and New Hires from 2018-2020
Unlike to the findings between people of color applicants and new hires, the Center found that there is
little difference between the percentage of female applicants and female new hires to positions within
the agency. However, the percentage of female applicants is significantly lower compared to the
percentage of male applicants. Although the findings show that most of the female applicants are being
hired into open positions, there is also a notable under representation of female applicants in all six
regions.
Percentage of Female Applicants and New Hires at WSDOT
This map shows the percentage of female applicants and new hires to WSDOT in six different regions
across the state. The Northwest Region has the highest number of both female applicants and female
hires while the South-Central Region has the lowest number of both female applicants and female hires.
The difference between the percentage of female applicants in each region to percentage of female
hires in each region is low. This means that most of the female applicants to WSDOT positions are being
hired. However, overall, the percentage of female applicants and hires compares to males is much
lower. This may show a disparity in the recruitment process rather than the hiring process when
comparing male and female demographic patterns within WSDOT applicants and new hires.
Percent Difference of Female Applicants and New Hires at WSDOT
This map illustrates percent differences for female applicants and hires for WSDOT positions in
comparison to the female demographic patterns in each region of the state. For these calculations, a
zero percent difference would mean that WSDOT’s workforce is exactly representational of the
population. Any negative percent difference reflects under representation and any positive percent
difference represents overrepresentation.
Female applicants and new hires are underrepresented throughout the state with no exceptions. Female
applicants are notably underrepresented in the Northwest and Southwest Regions while female hires
are most prominently underrepresented in the Northwest and Olympic Regions. The
underrepresentation of female hires is not surprising given the underrepresentation of female
applicants across the state.
21 | P a g eFigure 8: Female applicants and new hires (%) at WSDOT
22 | P a g eFigure 9: Difference in female applicants and new hires (%) at WSDOT
WSDOT Attracts Fewer
Women than Men
However, the Gender
Distribution of Hires is
Similar to Applicants.
This Suggests That
Qualified Female
Applicants Have the
Same Likelihood of
Being Hired as
Qualified Male
Applicants.
23 | P a g ePart 2 – Literature Review on Recruitment
WSDOT Recruitment Process
The recruitment process at WSDOT starts with the appropriate Human Resources (HR) Office within the
agency for the open position. Internal approvals and partnering between managers and/or supervisors
with HR consultants are required before the formal recruitment process occurs. Once the recruitment
process has been initiated, the position is equally accessible to both internal and external applicants.
Based on documents shared with the Center, WSDOT’s recruitment process can be broken down into
seven general stages: application screening, certification, interviews, salary setting, reference checks,
background, criminal history checks, and appointment.
The initial screening of applicants is done using the minimum qualifications outlined in the position
description that was made accessible to all applicants. In addition to the initial screening process, a
designated subject matter expert (SME) may conduct a review of the job candidate’s application. This
SME review is done before certification and serves as an additional resource in reviewing whether the
experience and qualifications in each application will be sufficient for the applicant to sufficiently uphold
the responsibilities of the position. After the initial screening of applications, additional screening
methods are used to narrow down the candidate pool. The additional screening methods are decided
upon between the position recruiter and hiring managers and are based solely on position-specific
requirements.
According to WSDOT’s Human Resources Desk Manual, 2 certification occurs when applicants who meet
all the requirements for the position are referred to the hiring official for further consideration. In
WSDOT’s recruitment process, there is a set order in which applicants are certified, laid out by WAC 357-
16-130. In addition, the number of applicants that are certified for any given position is determined by
the appointing authority.
WSDOT uses a structured interview format, which includes a predetermined set of questions that are
used for each candidate. The questions are position-specific, and any assessment criteria used in the
interview process will be predetermined. For the interview process, there is a minimum of three
individuals on the interview panel who are subject matter experts on the position. The interview panel
will ideally have a diverse array of perspectives and backgrounds.
WSDOT is committed to ensuring the equal setting of wages and compensation for all current and future
employees. In order to implement this commitment, WSDOT has outlined a set of rules for salary setting
within the recruitment process. The compensation package offered for each position within the agency
is job-specific and shall not be influenced by any outside factors that are not related to the
responsibilities of the position. WSDOT employees are not allowed to inquire about the previous salary
2
Washington State Department of Transportation. “Chapter 10: Recruitment, Assessment, and Certification.”
WSDOT Human Resources Manual, December 2020.
24 | P a g eof an applicant, nor can WSDOT use age, gender, or other demographic characteristics as the basis for
setting different levels of compensation for employees with similar responsibilities.
From the WSDOT Human Resources Desk Manual, 3 WSDOT defines a professional reference as “an
individual with professional relation to the candidate who can attest to their work performance,
technical skills, and job-related competencies.” All reference checks are conducted after the interview
process has been completed, and generally include a minimum of three references for each candidate.
Reference checks are conducted by the position recruitment and hiring managers using a predetermined
set of questions. In addition to professional reference checks, WSDOT advises that the investigation or
review of an applicant through online search engines or social media should be avoided during the
recruitment process.
WSDOT is committed to conducting criminal background checks with the best interest of the candidate
in mind. Results from criminal background checks may not automatically disqualify the candidate from
employment until they have been evaluated and reviewed by the position recruiter. WSDOT is barred
from obtaining any information on candidates’ background criminal history until is it determined that
the candidate is qualified for the position.
The finale of the recruitment process is making an offer of employment to a candidate. All application
materials, including interview notes, assessment checks, reference checks, etc. must be reviewed by the
position recruiter and local HR consultant, and documented approval from the appointing authority
must be received before an offer of employment is made to a candidate.
WSDOT’s Commitment to a Diversified Workforce
After reviewing WSDOT’s recruitment process, the Center has identified several features of the process
that, if implemented, aid in ensuring an equitable recruitment process. It is important to note that these
features must be put into practice in order for the intend effect to be seen. On that note, in addition to
implementing new measures to ensure WSDOT’s workforce is representative of the communities that it
serves, one additional option is to review the following practices that are already listed within the
recruitment guidelines and prioritize enforcement of said practices. The elements of WSDOT’s
recruitment process that are important in providing a channel to grow a more diversified workforce are
listed below. Each bullet point is excerpted from WSDOT’s Human Resources Desk Manual. 4 The
importance of each bullet point will be discussed in the literature review section.
• All recruitment and selection efforts are open to both internal and external applicants (10-4 D)
• Reviews from the hiring manager or designate subject matter expert may not include an
identifying information about the applicant (10-4.1 B)
• Establishing screening criteria that will be used to narrow down the certified pool of applicants
before any applicants have been reviewed (10-4.1 C)
3
Ibid.
4
Ibid.
25 | P a g e• Gaps in employment cannot be the sole cause for an applicant to be excluded from candidacy if
the applicant is otherwise competitively qualified for the position (10-4.1 D)
• Using a predetermined set of questions for all candidates in the interview process (10-4.3)
• Interview panels consist of people from a variety of backgrounds, roles, and perspectives (10-4.3
D)
• WSDOT’s criteria for salary setting outlined in section 10-4.4
• Reference checks conducted after the interview process (10-4.5 C)
• General avoidance of the use of online search engines or social media reviews of the applicants
during the recruitment process (10-4.5 E)
• Refraining from inquiring or obtaining information on an applicant’s criminal history until after
the applicant has been determined as a qualified candidate for the position (10-4.6)
The 2019-2020 Recruitment Rollup and the 2020 EEO Assurances overview of the WSDOT Internal
Diversity and ADA Compliance Program highlight further details of WSDOT’s recruitment process, as well
as internal efforts, that illustrate a commitment to cultivating a diverse workforce.
As will be mentioned in the following section, the amount of time between when an applicant applies
for a job and when that position is filled is critical for maintaining a functional recruitment process and
ensuring that the most qualified candidates are offered a position. According to a report from Glassdoor
Economic Research, the average time to fill in the US is 23.8 days – the average time to fill a position for
government employers is currently 53.8 days. WSDOT is currently clocking an average of 50.6 days to fill
a position 5, which is below the government agency average but almost twice the US average. This shows
that current metrics and programs in place to streamline the hiring process are showing promising
results in comparison to other agencies but that there is still substantial room for improvement.
Position advertisement and marketing is another arena where WSDOT’s current practices are showing
encouraging results. It is without question that social media and other online platforms are now the
number one resource of job seekers. 6 WSDOT is employing the resources offered by major job positing
platforms, such as Indeed.com and Handshake. 7 This strategy strengthens the agency’s online presence
and casts a much wider net into the applicant pool, which is a critical component of ensuring a diverse
applicant pool from the start. However, that all being said WSDOT must maintain a relationship a
relationship with the communities it serves. Continuing to be involved with higher-ed institutions, job
fairs, and the like enables WSDOT to establish a constructive agency image while also supplementing
recruitment by bolstering a brand as a reliable employer within local communities. 8
By committing to a recruitment process that fosters diversity amongst candidates and new hires, an
agency must also commit itself to other avenues that go beyond the confines of the recruitment
5
Chamberlain, Andrew. “How Long Does It Take to Hire? Interview Duration in 25 ...” Glassdoor Economic
Research, 2017
6
Jones, Krystle. Washington State Department of Transportation, 2019, pp. 4–14, Recruitment Rollup
7
Ibid.
8
Ibid.
26 | P a g eprocess. The 2020 EEO Assurances overview of the WSDOT Internal Diversity and ADA Compliance
Program details WSDOT commitments that are critical to not only attracting a more diverse workforce
but cultivating a workplace culture that is welcoming to all employees regardless of background. In the
first chapter, the document lays out specifics on how it is maintaining its Internal Equal Employment
Opportunity Program. The specifics include the use of business resource groups (BRGs), representation
on the Washington State Diversity, Equity and Inclusion Council, the WSDOT statewide Diversity
Advisory Group (DAG), and the use of the Learning Management System (LMS) for mandatory employee
trainings. 9 These specifics are important for diverse recruitment and retention efforts because they
foster the development of strategies, space for employee input, allyships, community-wide discussions,
and region-specific goals.
The second chapter of the 2020 EEO Assurances gives an overview of WSDOT’s compliance with the
Americans with Disabilities Act (ADA). The biggest takeaway from this section is WSDOT’s Involuntary
Disability Separation for employees who are no longer able to fulfill the responsibilities of their position,
which includes reemployment assistance. 10 Before an Involuntary Disability Separation is initiated,
WSDOT has proven its commitment to providing employees with necessary accommodations – in fiscal
year 2019-2020, for the 108 employees that requested accommodation, 168 requests were met. 11 The
struggles of individuals with disabilities in the workplace cannot be understated. By committing to
providing employees with the resources they need to perform their jobs, WSDOT is showing that an
employee’s disability status does not dictate their value as an employee and that their perspective and
input are viewed equally in the eyes of the agency.
The first step in developing an equitable recruitment process that will result in a diversified workforce is
to analyze the current process in place and identify the areas that can be effectively revised to result in
the most impactful changes. The human resources services at McMaster University 12 has published a
series of questions that can be used to guide the implementation of the best equitable recruiting
practices into a recruitment process. These questions include:
• Have we created a Selection Committee that is committed to the principles of fair and equitable
recruitment? Are all Selection Committee members trained or educated on equitable practices?
Have we ensured that our assessors are themselves appropriately diverse?
• Have we identified the skills, experience, and competencies that are required to perform the
essential duties of the position? Have we created a rubric based on those requirements to
support fair and consistent candidate assessment? Have we identified preferred qualifications,
and turned our minds to how such preferences may create barriers to equity and diversity?
• Have we ensured that all members of the interview team are familiar with the appropriate and
respectful ways to phrase questions in an interview?
9
Office of Human Resource and Safety. Washington State Department of Transportation, 2020 Equal Employment
Opportunity (EEO) Assurances – Part II Update
10
Ibid.
11
Ibid.
12
McMaster University. “Best Practices for Equitable Recruiting.” Human Resources Services
27 | P a g e• Have we ensured that all members of the interview team are familiar with competency-based
interviewing, so that candidates will be encouraged to provide specific examples from their
work experience that demonstrate the skills and competencies required for the position?
• Have we used inclusive and non-gendered language in the job posting? Have we advertised the
job to attract a diverse pool of qualified applicants? Have we actively recruited diverse
candidates?
• Have we applied fair and equitable assessment practices at each stage of candidate assessment?
Have we consciously worked to eliminate bias through this recruiting process?
• Have we documented, and can we justify, our selection decisions at each step of the process?
• Have we evaluated the recruitment process and the contribution of the Selection Committee
members?
Having answers to these questions, even if it is a simple yes or no, will be extremely valuable in
highlighting the areas of recruitment that are not aligned with the values and goals of an employer and
serve as a guide in moving forward with revising and implementing various recruitment practices.
Best Equitable Recruitment Practices
There is extensive literature on the best recruitment practices for equitably recruiting a diverse
workforce. However, the most relevant practices are those that are designed to evolve with shifting
workforce demographics, provide educational opportunities for future generations to develop skills in
the workforce, and highlight career tracks in public service. 13 After reviewing the existing literature on
this topic, the Center has identified the best equitable recruitment practices that are both widely used,
and frequently discussed in the literature.
Focus on Building Talent Pipelines
There are many private recruitment practices that a public agency, such as WSDOT, can implement into
its recruitment process. One of these practices that was frequently discussed in the literature is to start
developing talent pipelines. The San Francisco Fellows Program operates under the San Francisco
Department of Human Resources with the sole purpose of developing “community stewardship by
preparing recent college graduates and young professionals for roles in public service and
administration.” The program also targets historically black colleges. 14 Through the program, fellows
spend almost 12 months working full time as city employees, earning competitive pay, benefits, and on-
the-job training through several projects including city planning and program development. 15 Although
it is competitive, San Francisco Fellows program is a perfect example of how building talent pipelines
13
Center for State and Local Government Excellence, et al. “Stakeholders Meeting on Developing The Public Sector
Workforce of the Future.” Center for State and Local Government Excellence
14 City & County of San Francisco. About Us | Department of Human Resources
15
Ibid.
28 | P a g ecan bring diverse and qualified candidates into public service careers. 16 Similar to talent pipelines,
government agencies can utilize fellowships, mentorships, job shadowing, and apprenticeships to target
hiring at a more diverse pool of candidates while also giving candidates an on-the-job opportunity to
develop skills. 17 These models can help increase diversity within an agency’s workforce because they
expand recruitment opportunities to different populations. Candidates from a diverse set of
backgrounds tend to come from non-traditional career feeds. Therefore, agencies must open their doors
and recruitment processes to these non-traditional pathways by providing opportunities for agency
positions that have not been traditionally utilized. In addition, in promoting non-traditional pathways
into public service careers, agencies must participate in outreach to K-12 schools to begin developing
communications with potential candidates as well as work with guidance counselors on the
opportunities available to students. 18
Update Codes of Ethics and Job Descriptions
One of the main reasons why updating codes of ethics and job descriptions, and making that
information available to candidates, can help support the growth of a diversified workforce is that they
can help show potential candidates the agency’s commitment to inclusion and equity, as well as
emphasize the benefits of public service careers. An example of this would be integrating into the codes
of ethics or the job descriptions any innovative practices and modern developments that the agency has
made, 19 and by doing so highlighting the agency’s inclusiveness and involvement with society.
The language used in job descriptions is one of the most important places that an agency can focus on in
hopes of diversifying its recruitment process. For example, the minimum requirements listed in the
position description can be a large deterrent for many applicants who may be well suited to fill the
position but do not have the exact requirements listed. Using flexible language, such as “similar” or
“related work” in the minimum requirements for a job will be crucial in recruiting a higher number of
applicants as it shows hopeful candidates that the requirements are flexible and therefore, they will be
more likely to apply.
Language is an imperative focus for any discussion around diversity. The language an agency uses in the
public domain is going to be the first form of “interaction” that a potential job candidate will have with
the agency and therefore the language can be the sole reason why an individual may or may not decide
to apply for a position. In terms of recruitment practices, the language needs to convey the message
that the agency wants applicants to come and bring new perspectives and changes. The applicants
should feel that they have a space to voice themselves and their perspectives and that their input will be
16
Kellar, Elizabeth, and Gerald Young. Center for State and Local Government Excellence, 2018, Workforce of the
Future: Strategies to Manage Change.
17
Center for State and Local Government Excellence, et al. “Stakeholders Meeting on Developing The Public Sector
Workforce of the Future.” Center for State and Local Government Excellence, 2020, www.slge.org/.
18
Ibid.
19
Staff, Recruiting Daily Advisor Editorial. “Strategies for Effectively Recruiting Government
Workers.” HR Daily Advisor
29 | P a g evalued. Diverse recruitment is not about setting the table for many different people and expecting them
to all fit into a pre-set mold. Committing to a diverse recruitment process is about providing a table for
individuals from different backgrounds to bring their own place settings as a contribution to the
functioning of the agency.
Additionally, for entry-level jobs, online software programs can be used to test the reading and
comprehension grade-level of content in job advertisements and public-facing website content/media.
The comprehension grade level, especially for entry-level jobs, can be imperative in opening the space
for a wider range of potential candidates to apply.
Emphasize Competitive Benefit Offerings in Job Postings and Descriptions
There should be a strong emphasis on the competitive benefit offerings in both the job postings as well
as the job descriptions. These benefits should include an emphasis on opportunities for advancement,
job security, and workplace flexibility. 20 Hiring within government agencies can be difficult because the
private sector often provides higher pay levels. However, by clearly communicating the benefits
associated with a career in public service, including but not limited to health and retirement benefits,
paid time off and/or parental leave, and student loan assistance can be the deciding factor in a potential
job applicant choosing the public versus private sector. 21 One way to communicate the available
benefits is to consider putting a monetary value on those benefits. This will help public agencies because
having a monetary value of the position’s benefits will make it easier for the applicant to conceptualize
the value of the benefits and compare the total compensation of the job to similar positions in the
private sector. Additionally, an increasingly popular job benefit is workplace flexibility. The onset of
COVID-19 forced many companies and agencies to quickly adopt work-from-home strategies. While this
process was streamlined due to the pandemic, maintaining, and emphasizing the flexibility of work
arrangements within the agency can be paramount in recruiting a diverse workforce.
In general, but especially with younger generations, applicants are not only looking for a job, but they
are looking for quality of life in their jobs. This is to say that job applicants are looking for an employer
that is committed to them as an individual, not just as an employee. One way to facilitate the
communication of an agency’s commitment to its employees or potential employees is by including
messages from heads of departments, which can help close the gap between employer and employee.
Additionally, including images of actual employees in the workplace and interacting in the day-to-day
work environment can help convey an agency’s culture to potential job applicants.
20
Dohrmann, Thomas, et al. “Attracting the Best.” McKinsey & Company, 2008
21
Ramsey, Mike. “Hiring Challenges Confront Public-Sector Employers.” SHRM
30 | P a g eYou can also read