Towards COVID-19 recovery and greater resilience in Zuid-Holland, The Netherlands - OECD Regional Development Papers
←
→
Page content transcription
If your browser does not render page correctly, please read the page content below
OECD Regional
Development Papers

Towards COVID-19 recovery
and greater resilience
in Zuid-Holland, The Netherlands

       _local
  @OECD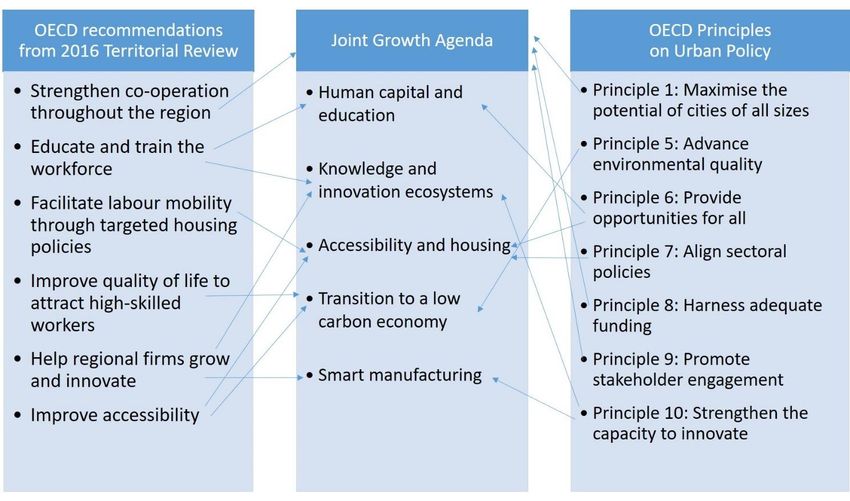
OECD Regional Development Papers
     Organisation for Economic Co-operation and Development
                                                                                  CFE/RDPC/URB(2020)16

     For Official Use                                                                 English - Or. English

    Towards COVID-19 recovery and greater
  resilience in Zuid-Holland, The Netherlands

     Towards COVID-19 recovery and greater resilience in Zuid-Holland, The Netherlands

     3 November 2020, 12:00-14:30
     VIRTUALThis  paper aims to
             MEETING                       provide guidance to the Zuid-Holland province (The
               Netherlands) and its partners on developing their post-COVID 19 Joint
               Growth Agenda. It draws on broader OECD analysis of cities’ policy
     This document provides guidance to Zuid-Holland province (Netherlands) and its partners on
     developingresponses
                 their post-COVIDto the COVID-19
                                     19 Joint          crisis,Itthe
                                              Growth Agenda.         OECD
                                                                 draws        Principles
                                                                       on broader analysis ofon  Urban
                                                                                              cities’ policyPolicy
     responsesand
                to thethe
                        crisis,
                            OECDthe OECD  PrinciplesReview
                                      Territorial    on Urban of
                                                              Policy
                                                                  theand the 2016 Metropolitan
                                                                       Metropolitan    RegionReview       of
                                                                                                   of Rotterdam-
     MRDH (Rotterdam-The
               The Hague (2016).Hague).

     It is submitted to delegates for APPROVAL.

JEL codes: R11, R58
Keywords: COVID-19 recovery; Regional development; OECD Principles on Urban Policy
     Contact:
     Soo-Jin Kim (Soo-Jin.Kim@oecd.org)
     Klara Fritz (Klara.Fritz@oecd.org)

     OFDE

PUBE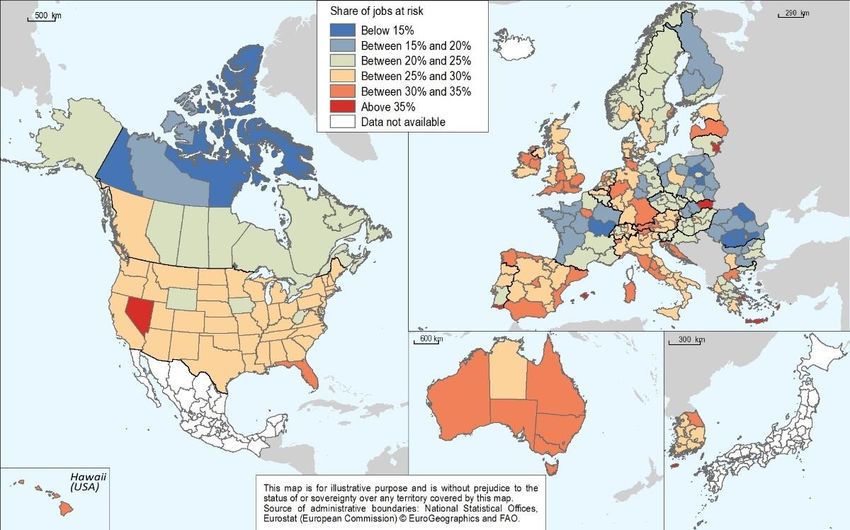
2
ABOUT THE OECD
The OECD is a multi-disciplinary inter-governmental organisation of 37 member countries which engages
in its work an increasing number of non-members from all regions of the world. The Organisation’s core
mission today is to help governments work together towards a stronger, cleaner, fairer global economy.
Through its network of 250 specialised committees and working groups, the OECD provides a setting
where governments compare policy experiences, seek answers to common problems, identify good
practice, and co-ordinate domestic and international policies. More information available: www.oecd.org.
Papers from the Centre for Entrepreneurship, SMEs, Regions and Cities of the OECD cover a full range
of topics including regional statistics and analysis, urban governance and economics, rural governance
and economics, and multi-level governance. Depending on the programme of work, the papers can cover
specific topics such as regional innovation and networks, sustainable development, the determinants of
regional growth or fiscal consolidation at the subnational level. OECD Regional Development Papers are
published on http://www.oecd.org/cfe/regional-policy.
This paper was authorised for publication by Lamia Kamal-Chaoui, Director, Centre for Entrepreneurship,
SMEs, Regions and Cities, OECD.
This document, as well as any statistical data and map included herein, are without prejudice to the status
of or sovereignty over any territory, to the delimitation of international frontiers and boundaries and to the
name of any territory, city or area.
© OECD 2021
You can copy, download or print OECD content for your own use, and you can include excerpts from
OECD publications, databases and multimedia products in your own documents, presentations, blogs,
websites and teaching materials, provided that suitable acknowledgement of OECD as source and
copyright owner is given. All requests for public or commercial use and translation rights should be
submitted to rights@oecd.org.
TOWARDS COVID-19 RECOVERY AND GREATER RESILIENCE IN ZUID-HOLLAND © OECD 2021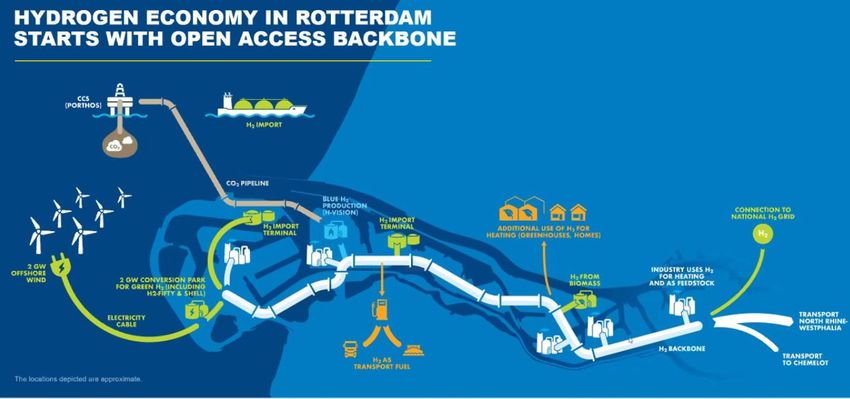
3 Acknowledgements This paper was prepared by the OECD Centre for Entrepreneurship, SMEs, Regions and Cities (CFE) led by Lamia Kamal-Chaoui, Director. It was prepared by Kenza Khachani and Klara Fritz, Policy Analysts, under the supervision of Soo-Jin Kim, Head of the Urban Policies and Reviews Unit, and Aziza Akhmouch, Head of the Cities, Urban Policies and Sustainable Development (CITY) Division of CFE. This paper was made possible through the support of the City of Rotterdam, the City of The Hague, the Province of Zuid-Holland and the Metropolitan Region of Rotterdam-The Hague, and the participation of the City of Delft, the City of Dordrecht, the City of Leiden and the City of Zoetermeer; the Erasmus University Rotterdam, Leiden University and Technical University Delft; Economic Board Zuid-Holland, InnovationQuarter, NEO Observatory, Port of Rotterdam and TNO. Special thanks are due to the local team, including Aldo Dorsman and Gillis Oudeman (City of Rotterdam), Jean-Christophe Spapens (Province of Zuid-Holland), Bart Nijhof (Metropolitan Region of Rotterdam-The Hague) and Linco Nieuwenhuyzen (Economic Board Zuid-Holland). The paper was approved by the OECD Working Party on Urban Policy on 3 November 2020 under cote CFE/RDPC/URB(2020)16. Special thanks are due to Pilar Philip, who prepared the paper for publication. TOWARDS COVID-19 RECOVERY AND GREATER RESILIENCE IN ZUID-HOLLAND © OECD 2021
4
Table of contents
Acknowledgements 3
Executive summary 6
1 Trends, challenges and opportunities in the Zuid-Holland province 10
A context of close co-operation within the province 10
The region has strong assets but also potential to improve its economic growth 11
An engine of the Dutch economy 11
High levels of human capital but relatively low share of high-tech manufacturing 14
Innovation and digital infrastructure are strong, but require more private investment 17
Zuid-Holland fares unevenly in different dimensions of well-being 19
Climate adaptation and mitigation remains a challenge 20
Zuid-Holland has a good level of accessibility, but more can be done to promote multi-
modality 22
Housing prices are on the rise, especially in cities 23
Despite a high quality of life, inequalities persist 23
A mix of development strategies in Zuid-Holland 24
COVID-19 highlighted further the urgency to tackle pre-existing challenges in Zuid-Holland 25
The impact of COVID-19 on Zuid-Holland 25
The crisis requires both short- and long-term actions aligned across levels of government 29
2 Leveraging the Joint Growth Agenda to advance COVID-19 recovery and greater
resilience 33
A flexible and iterative process to develop the Joint Growth Agenda 33
Spotlight on the key pillars of the Joint Growth Agenda 34
Human capital and education 34
Knowledge and innovation ecosystems 36
Accessibility and housing 38
Transition to a low carbon economy 40
Smart manufacturing 42
Potential to strengthen the Joint Growth Agenda 43
Reducing inequalities 43
Broadening the transition agenda 44
Harnessing the urban-rural continuum 44
Towards an effective implementation of the Joint Growth Agenda 45
Prioritising the projects 45
Leveraging synergies between the pillars of the JGA and with EU agendas 45
Aligning the JGA and post-COVID 19 recovery strategies 46
TOWARDS COVID-19 RECOVERY AND GREATER RESILIENCE IN ZUID-HOLLAND © OECD 2021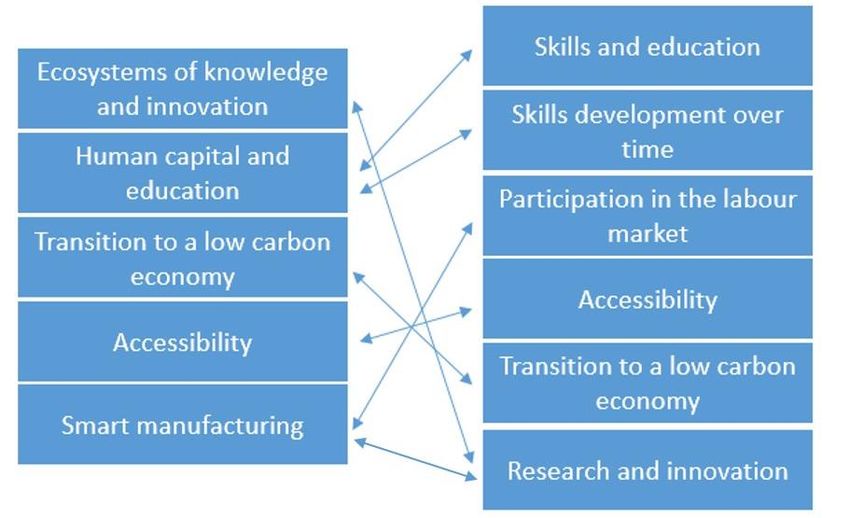
5
Using the JGA as an agile and flexible tool for recovery and resilience 47
References 48
Tables
Table 2.1. Priority areas in strategies developed by different levels of government in Zuid-Holland 25
Table 3.1. Projects under the Human Capital Agreement 35
Table 3.2. Projects to support the transition to a low carbon economy in the framework of the JGA 42
Figures
Figure 1.1. Mapping the Joint Growth Agenda against the 2016 OECD recommendations and the OECD
Principles on Urban Policy 7
Figure 2.1. Stakeholders involved in the development of the Joint Growth Agenda 11
Figure 2.2. Employment by sector in Zuid-Holland 12
Figure 2.3. Unemployment rate the Netherlands, 2001-2019 13
Figure 2.4. Unemployment rate in Zuid-Holland and selected OECD regions, 2001-2019 14
Figure 2.5. Early leavers from education and training in Zuid-Holland and the Netherlands, 2000-2019 15
Figure 2.6. Percentage change of pupils enrolled in upper secondary vocational training, 2013-2018 16
Figure 2.7. Share of employment in high-technology manufacturing and knowledge-intensive services in Zuid-
Holland and comparable regions 17
Figure 2.8. PCT patent applications in Zuid-Holland and selected OECD regions 18
Figure 2.9. R&D expenditure by region, business and public sector in Zuid-Holland and selected OECD
regions 19
Figure 2.10. Well-being indicators in Zuid-Holland and the Netherlands 20
Figure 2.11. Evolution of PM2.5 in Zuid-Holland and the Netherlands, 2000-2016 21
Figure 2.12. Air pollution in Zuid-Holland and selected OECD regions, 2016 21
Figure 2.13. Modal split in Zuid-Holland, 2017 22
Figure 2.14. Evolution of the price index of existing houses, 1995-2020 23
Figure 2.15. Regional unemployment rates for native- and foreign-born in Zuid-Holland and selected OECD
regions, 2015 24
Figure 2.16. Share of jobs potentially at risk from COVID-19 containment measures 26
Figure 2.17. Expected impact of the COVID-19 crisis on regional employment in 2020 by labour market region
in the Netherlands 27
Figure 3.1. Links between the JGA and the six thematic areas of the national investment fund 33
Figure 3.2. Hydrogen economy in Rotterdam 41
Boxes
Box 1.1. The OECD Principles on Urban Policy 8
Box 2.1. Selection of OECD regions comparable to Zuid-Holland 13
Box 2.2. COVID-19’s fiscal impact on subnational government 28
Box 2.3. Examples of inclusive, green and smart recovery plans in cities across OECD countries 30
Box 2.4. Example from the UK Core Cities: leveraging regional partnerships to weather the crisis 31
Box 2.5. Recovery and renewal in Aix-Marseille-Provence (France) 32
Box 3.1. Hydrogen strategy for a climate neutral Europe 41
TOWARDS COVID-19 RECOVERY AND GREATER RESILIENCE IN ZUID-HOLLAND © OECD 2021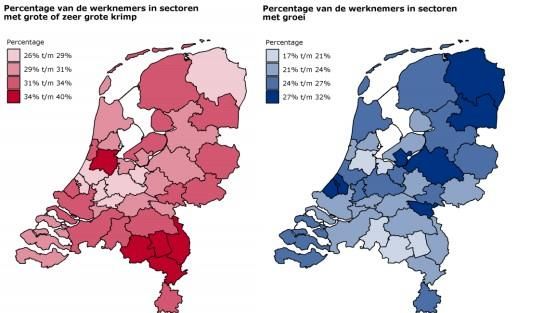
6
Executive summary
In 2016, the OECD conducted an in-depth review of the Metropolitan Region of Rotterdam-The Hague
(MRDH), just after a new metropolitan authority was set up to promote transport planning and economic
development across its 23 member municipalities. The OECD Review underlined that further economic
integration within the MRDH area and closer collaboration between the metropolitan authority and the
province of Zuid-Holland could help unlock agglomeration benefits (OECD, 2016).
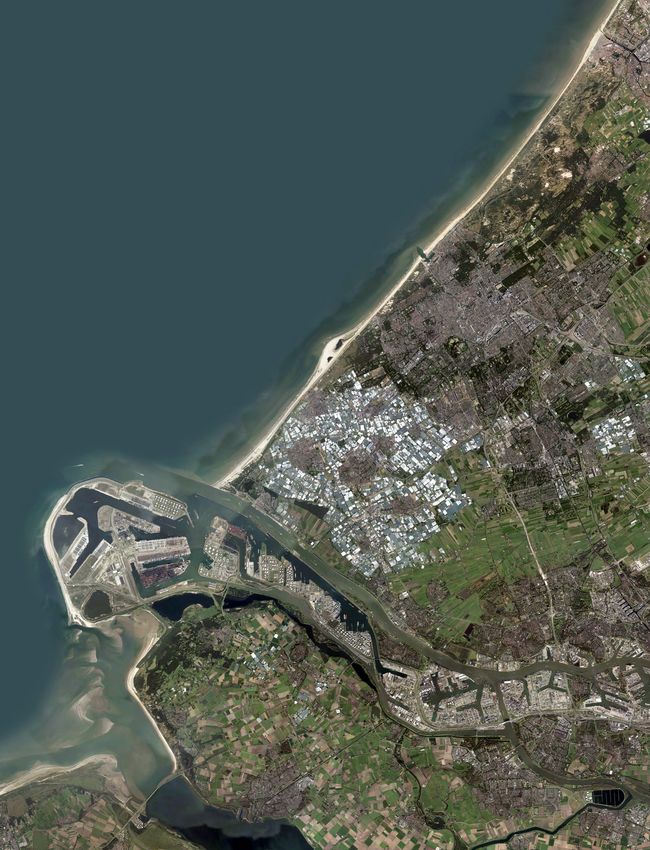
The province of Zuid-Holland represents around a fifth of the Dutch economy. It is the most densely
populated among the twelve provinces of the Netherlands and it hosts strong economic sectors, with a mix
of world-class large companies (for example KPN, Unilever, Shell, Port of Rotterdam) and SMEs. It is also
home to three top-ranked universities, the national government and a host of multiple international NGOs
and institutions. Despite such assets, however, over the past decade, Zuid-Holland’s GDP growth has
fallen behind that of other provinces, such as Noord-Brabant (which grew 10% faster) and Noord-Holland
(which grew 15% faster).
With the aim of fostering national growth, in September 2019, the Ministry of Economic Affairs (EZK)
announced the creation of a national investment fund to finance projects that have promising potential to
boost the economy. The MRDH has worked with the province of Zuid-Holland and a range of key
stakeholders to design a Joint Growth Agenda (JGA). The JGA brings together existing initiatives, with the
aim of leveraging the potential of the broader region to harness knowledge and innovation, bolster the
transition to a low-carbon economy and advance national goals of prosperity and well-being.
While the JGA was under development, the COVID-19 pandemic, which is profoundly shaking the
foundations of economies and societies, hit the Netherlands and Zuid-Holland. Although Zuid-Holland
seems to have been impacted to a lesser extent than other provinces, the first four months of the 2020
saw an increase in unemployment benefits of 60.1% compared to the same period a year earlier (Zuid-
Holland, InnovationQuarter, Zuid-Holland, & Area, 2020). At the same time, the crisis has provided an
opportunity, as well as a need, to refine the JGA especially given the heightened impetus behind achieving
more sustainable and inclusive growth.
This paper aims at providing a broad, high-level assessment of how the Joint Growth Agenda can help
further implement the policy recommendations from the 2016 Metropolitan Review, align with the OECD
Principles on Urban Policy (Box 1.1 and Figure 1.1), and help address the impacts of the COVID-19 crisis.
TOWARDS COVID-19 RECOVERY AND GREATER RESILIENCE IN ZUID-HOLLAND © OECD 2021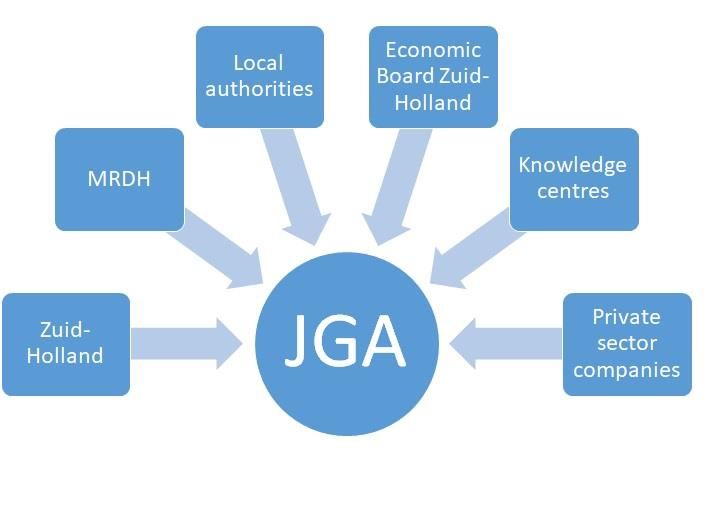
7 Figure 1.1. Mapping the Joint Growth Agenda against the 2016 OECD recommendations and the OECD Principles on Urban Policy TOWARDS COVID-19 RECOVERY AND GREATER RESILIENCE IN ZUID-HOLLAND © OECD 2021
8
Box 1.1. The OECD Principles on Urban Policy
The OECD Principles on Urban Policy consolidate the lessons from the past 20+ years of work on cities
to guide policymakers in building smart, sustainable and inclusive cities. They were co-developed with
a diverse range of stakeholders, including international organisations, development banks, networks of
cities and local governments, research institutes and academia, and the private sector. The Principles
were welcomed by Mayors and Ministers during the 7th OECD Roundtable of Mayors and Ministers on
19 March 2019 in Athens, Greece. Mayors, Ministers and partner institutions supported the
implementation of the Principles through the Athens Pledge.
While the Principles were developed in a pre-pandemic context, they offer a critical tool to inform the
new urban paradigm that the COVID-19 crisis has called for:
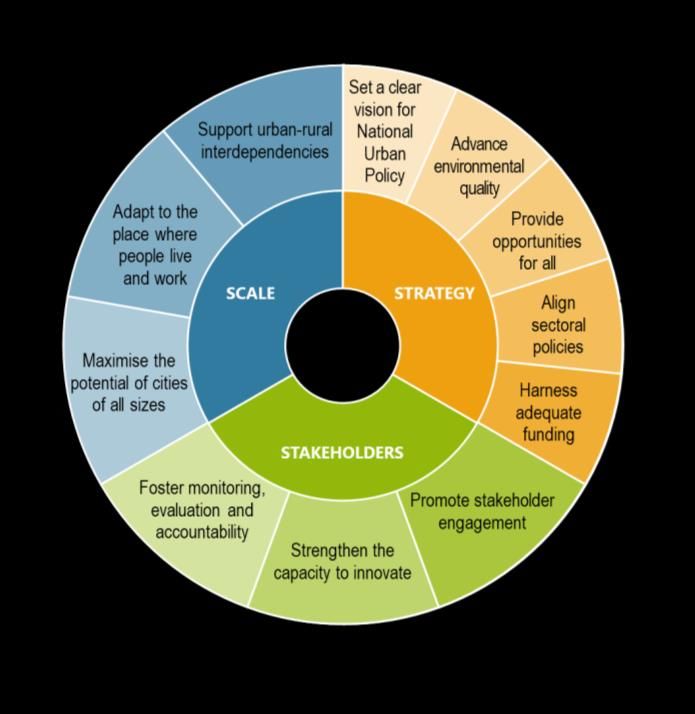
Scale: lockdowns have brought to the fore some episodes of urban exodus and highlighted the
underexploited potential of cities of all sizes (particularly midsize cities) to drive growth and well-
being (Principle 1), at a time where remote working has also risen significantly (Principle 2).
These changes reinforce the importance of urban-rural interdependencies (Principle 3).
Strategy: with trillions of dollars spent on stimulus and recovery packages around the world,
the role of National Urban Policy (NUP) in restoring cities as engines of national growth is more
critical than ever (Principle 4), including for tackling climate objectives (Principle 5) and closing
inequalities (Principle 6). The new urban paradigm for smart, sustainable and inclusive recovery
will also require close alignment across previously siloed sectoral policies (Principle 7), matched
with adequate funding at a time where subnational finance is suffering a major “scissor effect”
with the concurrent drop in revenues and massive rise of expenditure needs (Principle 8).
Stakeholders: Both national and city governments have risen to the occasion to engage
stakeholders more closely, better understand their needs and shape more inclusive recovery
strategies (Principle 9).The crisis has also offered a unique opportunity to harness urban
innovation (Principle 10). It will be critical to set up monitoring, evaluation and accountability
mechanisms to take stock of recovery initiatives in cities (Principle 11).
Figure 1.2. OECD Principles on Urban Policy
Source: https://www.oecd.org/cfe/urban-principles.htm
TOWARDS COVID-19 RECOVERY AND GREATER RESILIENCE IN ZUID-HOLLAND © OECD 20219
Key findings
The province of Zuid-Holland has strong development assets, including high levels of human
capital and robust innovation policies. It also provides good quality of life for residents. However,
COVID-19 has highlighted both the urgency and the momentum to tackle pre-existing challenges
in Zuid-Holland, especially regarding house prices, the environment (e.g. air pollution) and
inequalities.
Before the COVID-19 pandemic hit, a large range of stakeholders within Zuid-Holland joined forces
to elaborate the Joint Growth Agenda (JGA) in response to a call for projects launched by the Dutch
national government. Since its inception, the JGA has enabled a participatory process to set a
shared vision for the future of the province and to define key areas for progress.
The elaboration of the JGA is a very positive illustration of the significant improvement in
collaboration among key stakeholders in Zuid-Holland since the OECD Territorial Review of the
Metropolitan Region Rotterdam-The Hague in 2016. These include the municipalities, the
metropolitan authority of Rotterdam/The Hague – MRDH, and the province, with the MRDH also
playing an important role in voicing the interests of municipalities.
Five pillars form the basis of the JGA – Human capital and education, Knowledge and innovation
ecosystems, Accessibility and housing, Transition to a low carbon economy and Smart
manufacturing (this fifth pillar was later added as a way to address the unfolding COVID-19 crisis).
These are well positioned to tap into the growth potential of the region in light of previous OECD
recommendations and the OECD Principles on Urban Policy, whose call for maximising the
potential of cities of all sizes in delivering growth and well-being, integrating sustainability and
inclusion objectives within a coherent policy framework and engaging all stakeholders takes on a
renewed relevance in the COVID-19 new urban paradigm.
The JGA not only aims at increasing growth within the region, but also at accelerating the transition
towards a more sustainable future. The JGA was developed in a way to foster cross-sectoral
synergies between the five pillars. Supporting human education and skills, for example, is
necessary for the creation of knowledge and innovation ecosystems, which, in turn, can support
the transition to a low carbon economy. Improving accessibility by investing in public transport
infrastructure can also yield benefits beyond the infrastructure itself, to advance further economic
integration and support more sustainable urban and regional development.
The JGA has further potential to advance inclusive growth and reduce inequalities, which have
been brought to the fore by the COVID-19 crisis. Mainstreaming inclusive growth more clearly
throughout the agenda could help pave the way towards a resilient, sustainable and inclusive
recovery.
Even though the JGA was not designed as a recovery strategy per se, it has significant potential
to reinforce the recovery strategies currently being developed at local and provincial level. It also
matches several of the seven flagship areas defined in the European Commission’s Recovery and
Resilience Facility (RRF). Ensuring coherence and synergies between the JGA and other
strategies will be critical to make the most of limited resources and build a stronger region.
TOWARDS COVID-19 RECOVERY AND GREATER RESILIENCE IN ZUID-HOLLAND © OECD 202110
1 Trends, challenges and
opportunities in the Zuid-Holland
province
A context of close co-operation within the province
As highlighted in the 2016 OECD review, when the Metropolitan Region of Rotterdam-The Hague (MRDH)
body came into formal existence in January 2015, it entered a crowded field of institutional actors, networks
and platforms in regional economic development. The Netherlands is a decentralised unitary state with a
three-tier system, which consists of local, provincial and national government (SNGWOFI, 2019). In
addition to those three levels of governments, following the abolition of eight city-regions, the Dutch
government allowed for the creation of metropolitan areas such as MRDH and the Amsterdam Metropolitan
Area [Metropoolregio Amsterdam, MRA]. This move reflected the government’s willingness to tailor its
urban policy to the specific needs of different urban areas, as opposed to imposing a uniform setting across
the entire country (OECD, 2016). However, the distribution of responsibilities between the province of Zuid-
Holland and the MRDH used to be unclear, particularly in terms of economic development.
Since 2016, co-operation within the different levels of government and among different stakeholders of the
Zuid-Holland province improved significantly. This co-operation has been reflected in the development and
implementation of regular meetings, joint networks and joint investments, for example. This trend is in line
with the OECD Principles on Urban Policy, which call for the promotion of stakeholder engagement in the
design and implementation of urban policy (OECD, OECD Principles on Urban Policy, 2019). The impact
of the 2016 OECD findings, together with a new political leadership following municipal elections in 2018,
seem to have contributed to strengthening collaborative governance.
The development of the Joint Growth Agenda (JGA) could be considered as a consecration of this
strengthened co-operation. To reboost national economic growth, the Ministry of Economic Affairs (EZK)
announced in September 2019 that it would provide a national investment fund to finance projects that
have a strong potential to stimulate the economy and support the transition to a low carbon economy. The
three main goals of the national government are to improve the growth rate, labour participation and labour
productivity by focusing on six thematic areas: i) skills and education, ii) skills development over time, iii)
participation in the labour market, iv) research and innovation, v) accessibility, and vi) transition to a low
carbon economy. Based on this announcement, different stakeholders within Zuid-Holland joined forces to
develop together a Joint Growth Agenda (JGA), which aims at revitalising and strengthening the economy
of the province by investing in growing sectors and on developing skills. The JGA goes beyond traditional
co-operation between public and private bodies. Stakeholders involved in the development of the JGA cut
across different levels of government (the province of Zuid-Holland, MRDH and local authorities such as
Rotterdam and The Hague) and include other stakeholders such as the Economic Board Zuid-Holland,
universities and companies (including the Port of Rotterdam, Shell, DSM, KPN) (Figure 1.1). Stakeholders
also worked closely with line ministries of the central government to develop the JGA. For instance, the
TOWARDS COVID-19 RECOVERY AND GREATER RESILIENCE IN ZUID-HOLLAND © OECD 2021 11 fifth pillar (on accessibility) was developed in close co-operation with the Ministry of Infrastructure and Water Management. However, civil society organisations and citizens were not directly involved in the design of the Joint Growth Agenda. Stakeholders reported that this was mostly due to the short timeframe of approximately 7 months to develop it and the fact that the strategic thematic areas had already been set by the national government. Figure 1.1. Stakeholders involved in the development of the Joint Growth Agenda Municipalities highlighted the key role of MRDH in voicing their interests and concerns vis-à-vis provincial and national levels of government. Co-operation between the MRDH and municipalities located in its region has also tightened, which was one of the recommendations from the 2016 OECD report. For instance, MRDH has played a key role in voicing the concerns of municipalities within the region to the national government. MRDH has also actively involved municipalities in preparing strategic agendas such as the regional energy strategy, the sustainable mobility programme and the MRDH Strategic Agenda. The region has strong assets but also potential to improve its economic growth An engine of the Dutch economy Zuid-Holland contributes over a fifth of the Dutch GDP. Wholesale, retail activities, public administration and health care generate together over 50% of employment in the region (Figure 1.2). Rotterdam, the largest city in Zuid-Holland, is home to the busiest port in Europe, which in turn directly employed 121 800 workers in 2017. The Western part of Zuid-Holland also hosts a major horticulture sector. TOWARDS COVID-19 RECOVERY AND GREATER RESILIENCE IN ZUID-HOLLAND © OECD 2021
12
Figure 1.2. Employment by sector in Zuid-Holland
Healthcare 11.6%
Retail 11.0%
Specialized business services 10.2%
Education 7.1%
Whole sale 6.5%
Construction industry 6.3%
Public administration and government services 6.2%
Transport and storage 5.6%
Rental and other business services 5.3%
Hotel, Restaurants, Cafés 4.0%
Wellbeing and care services 3.9%
Information and communication 3.6%
Financial services and real estate 3.3%
Metallurgic industry 2.6%
Other services 2.6%
Agriculture 2.3%
Culture, sports, recreation 2.3%
Other industry 2.1%
Chemical industry 1.3%
Energy 1.2%
Food industry 1.1%
0.0% 2.0% 4.0% 6.0% 8.0% 10.0% 12.0% 14.0%
Source: https://data.arbeidsmarktinzicht.nl/data/state/2343#tab-visibility
The relatively high share of employment in care and public administration is estimated to have contributed
to the region’s resilience compared to other provinces in the face of the COVID-19 crisis (Zuid-Holland,
InnovationQuarter, Zuid-Holland, & Area, 2020).
Unemployment in Zuid-Holland spiked in 2014 in the aftermath of the financial crisis of 2008, and has
steadily decreased in the years since ( (OECD, OECD Regional Database: Regional Economy)) before
the COVID-19 crisis. While the unemployment rate of Zuid-Holland (4.1%) was under the EU average in
the second quarter of 2020, after the start of the COVID-19 crisis (CBS, 2020), it is higher than both the
national unemployment rate and that of North Holland, the region including Greater Amsterdam. Before
the COVID-19 crisis, youth and long-term unemployment in Zuid-Holland (7.8% and 1.3%, respectively)
were also higher than the national average (6.7% and 1.1%, respectively) in 2019.
TOWARDS COVID-19 RECOVERY AND GREATER RESILIENCE IN ZUID-HOLLAND © OECD 2021 13
Figure 1.3. Unemployment rate in South Holland, North Holland and the Netherlands, 2001-2019
10 Netherlands North Holland South Holland
9
8
7
6
5
4
3
2
1
0
2001 2002 2003 2004 2005 2006 2007 2008 2009 2010 2011 2012 2013 2014 2015 2016 2017 2018 2019
Source: OECD Regional Database
Box 1.1. Selection of OECD regions comparable to Zuid-Holland
The OECD defines “regions” as administrative tiers of subnational government. Large regions (OECD
Territorial Level 2 – called TL2) correspond to the 12 provinces in the case of the Netherlands. In order
to put Zuid-Holland in an international perspective within a sample of ten large regions, three criteria
were chosen: population size, level of GDP, and presence of a port. On the basis of these criteria, the
following regions were selected to allow for international comparisons where data was available:
Stockholm (Sweden)
Hamburg (Germany)
British Columbia (Canada)
Northwest England (UK)
Flemish Region (Belgium)
Gyeongbuk Region (Korea)
Emilia-Romagna (Italy)
Provence-Alpes-Côte d’Azur (France)
Hokkaido (Japan)
TOWARDS COVID-19 RECOVERY AND GREATER RESILIENCE IN ZUID-HOLLAND © OECD 202114
Figure 1.4. Unemployment rate in Zuid-Holland and selected OECD regions, 2001-2019
14 South Holland Flemish Region Stockholm Provence-Alpes-Côte d’Azur
Hamburg Emilia-Romagna North West England British Columbia
Hokkaido Gyeongbuk Region
12
10
8
6
4
2
0
2001 2002 2003 2004 2005 2006 2007 2008 2009 2010 2011 2012 2013 2014 2015 2016 2017 2018 2019
Source: OECD Regional Database
High levels of human capital but relatively low share of high-tech manufacturing
The Zuid-Holland labour force is highly educated. Almost half (49.8%) of 30-34 year-olds in Zuid-Holland
have completed tertiary education (i.e. short-cycle tertiary education, bachelor’s or equivalent level,
master’s or equivalent level, and/or doctoral or equivalent level), which puts Zuid-Holland above both
national and EU-28 averages, which are at 46% and 40.7% respectively.
Despite high levels of education, the quality of education could be improved and the content better match
the needs of the labour market. Quality of education should be monitored closely considering the decrease
in Dutch PISA scores. In the Netherlands, mean performance in reading in 2018 was below the level
observed in any previous assessment, while mean performance in mathematics and science remained
closer to the level observed in 2015. However, when considering all comparable assessments, the long-
term trajectory was clearly negative in mathematics and science (OECD, The Programme for International
Student Assessment (PISA): Results from PISA 2018, 2019). As gaps between the highest- and lowest-
performing students increase, care should be taken to ensure that every student can access quality
education.
One positive trend is the rate of early leavers from education and training. This rate has decreased in the
past two decades, from over 16% in 2000 to just over 8% in 2019, meaning the rate of early leavers in
Zuid-Holland has effectively been halved (Figure 1.5). It is below the EU average, and lower than the rates
in comparable regions such as Provence-Alpes-Côte d'Azur (France), Hamburg (Germany) and North-
West UK (UK). However, it picked up again from 2017 to 2019, and it is higher than in regions such as
Stockholm (Sweden) and the Flemish Region (Belgium).
TOWARDS COVID-19 RECOVERY AND GREATER RESILIENCE IN ZUID-HOLLAND © OECD 2021 15
Figure 1.5. Early leavers from education and training in Zuid-Holland and the Netherlands, 2000-
2019
% of 18-24 year olds who attained at most lower secondary education and are not involved in further education or
training
18.0 Netherlands Zuid-Holland
16.0
14.0
12.0
10.0
8.0
6.0
4.0
2.0
0.0
2000 2001 2002 2003 2004 2005 2006 2007 2008 2009 2010 2011 2012 2013 2014 2015 2016 2017 2018 2019
Source: (Eurostat, Early leavers from education and training by sex and NUTS 2 regions[edat_lfse_16])
From 2013 to 2018, the number of students enrolled in upper secondary vocational training increased by
16.07% in Zuid-Holland. This is slightly higher than the national average, and represents an exception
compared to other European regions, where enrolment in vocational training has decreased since 2013
(Figure 1.6). Vocational training is a common pathway for Dutch students. Although the Netherlands
spends close to the OECD average on primary education per student, at secondary level the Netherlands
spends 30% more per student than the OECD average, with the higher expenditure largely driven by higher
expenditure per vocational student. Spending per vocational student reached USD 14 530 in 2016,
compared to the OECD average of USD 10 922 (OECD, 2019).
TOWARDS COVID-19 RECOVERY AND GREATER RESILIENCE IN ZUID-HOLLAND © OECD 202116
Figure 1.6. Percentage change of pupils enrolled in upper secondary vocational training, 2013-2018
Flemish Region (Belgium)
Stockholm (Sweden)
North West (UK)
Provence-Alpes-Côte d'Azur (France)
Hamburg (Germany)
EU-27
Emilia-Romagna (Itlay)
Netherlands
South Holland (netherlands)
North Holland (Netherlands)
-15% -10% -5% 0% 5% 10% 15% 20% 25%
Source: (Eurostat, Pupils enrolled in upper secondary education by programme orientation, sex and NUTS2 regions, 2020)
Employment in high-technology manufacturing in Zuid-Holland is fairly low compared to similar regions
(Figure 1.7). In the last decade, the percentage of those employed in high-tech manufacturing in Zuid-
Holland has dropped further from 0.4% in 2008 to 0.27% in 2018, below the national average of 0.48%.
While many regions comparable to Zuid-Holland have observed a similar decrease in employment in high-
tech manufacturing (such as Provence-Alpes-Côte d’Azur in France and Stockholm in Sweden), other
regions such as Hamburg have registered a steady increase (from 1% to 1.43% from 2008 to 2018).
Considering the JGA pillar focused on smart manufacturing, there is potential to stimulate high-tech
manufacturing more actively.
TOWARDS COVID-19 RECOVERY AND GREATER RESILIENCE IN ZUID-HOLLAND © OECD 2021 17
Figure 1.7. Share of employment in high-technology manufacturing and knowledge-intensive
services in Zuid-Holland and comparable regions
% of total employment, 2018
Share of employment in high-tech manufacturing
Hamburg
Flemish Region
North West England
Emilia-Romagna
Stockholm
Netherlands
Provence-Alpes-Côte d’Azur
South Holland
0 0.2 0.4 0.6 0.8 1 1.2 1.4 1.6
Share of employment in knowledge-intensive services
Stockholm
Provence-Alpes-Côte d’Azur
Flemish Region
North West England
Hamburg
South Holland
Netherlands
Emilia-Romagna
0 10 20 30 40 50 60 70
Source: (OECD, OECD Regional Database: Knowledge and high technology industries, 2020)
Innovation and digital infrastructure are strong, but require more private investment
Zuid-Holland ranks average in the number of PCT (Patent Co-operation Treaty) patent applications when
compared to other OECD regions of a similar size and GDP (Figure 1.8). Zuid-Holland has one of the
highest shares of public spending on R&D, but private spending on R&D from the business sector lags
behind public spending and is lower than that of many comparable regions (Figure 1.9). This points to
further potential to engage the private sector in R&D investment. In 2018, R&D intensity (the percentage
of GDP spent on R&D) in the Netherlands is slightly above the European average (2.16% against 2.11%).
TOWARDS COVID-19 RECOVERY AND GREATER RESILIENCE IN ZUID-HOLLAND © OECD 202118
While the Europe 2020 strategy set the target for R&D expenditure at 3% of GDP, the Dutch ambition is to
reach 2.5% due to the country’s specific sectoral structure1.
Figure 1.8. PCT patent applications in Zuid-Holland and selected OECD regions
Normalised score given for the most recent year
Stockholm
Emilia-Romagna
Vlaams Gewest
South Holland
Provence-Alpes-Côte d'Azur
Hamburg
North West
0 0.1 0.2 0.3 0.4 0.5 0.6 0.7 0.8 0.9 1
Source: (European Commission, Regional Innovation Scoreboard | Internal Market, Industry, Entrepreneurship and SMEs, 2019)
1
A number of studies show that the Netherlands’ very specific sector structure explains the low level of spending on
R&D. Haveman and Donselaar (Haveman & Donselaar, 2008) showed as early as 2008 that 60% of the Netherlands'
arrears in spending can be explained by its sector structure. ING has also pointed out that the Netherlands would
score much higher on R&D intensity if its sector structure were taken into account (ING, 2014). The OECD has
calculated that R&D intensity in the Netherlands would increase by more than half a percent if its sector structure were
comparable to the OECD average (OECD, 2017).
TOWARDS COVID-19 RECOVERY AND GREATER RESILIENCE IN ZUID-HOLLAND © OECD 2021 19
Figure 1.9. R&D expenditure by region, business and public sector in Zuid-Holland and selected
OECD regions
Normalised score given for the most recent year
R&D expenditure business sector R&D expenditure public sector
South Holland
Hamburg
Provence-Alpes-Côte d'Azur
Provence-Alpes-Côte d'Azur
Stockholm
Vlaams Gewest
Emilia-Romagna
North West
0 0.1 0.2 0.3 0.4 0.5 0.6 0.7 0.8
Source: (European Commission, Regional Innovation Scoreboard | Internal Market, Industry, Entrepreneurship and SMEs, 2019)
Zuid-Holland fares unevenly in different dimensions of well-being
The economic performance of a region alone does not provide a comprehensive picture of the living
conditions of residents. Assessing the level of well-being requires looking not only at how the economy is
functioning, but also at the diverse experiences and living conditions of people. To help better gauge
people’s well-being at the scale where they experience it, the OECD has developed a Regional Well-being
framework around three key domains: material conditions, quality of life and sustainability, which are
subdivided in 11 dimensions. The mix between different well-being dimensions is unique to each
community where people live, study, work and connect. Improving people’s lives requires making where
they live a better place. (OECD, Measuring Well-being and Progress: Well-being Research -)Well-being
measures need to be explicitly brought into the policy-making process to spur public support for action and
to create a mechanism for prioritising resources. .
Zuid-Holland ranks well in terms of safety, community and life satisfaction. However, indicators related to
the quality of life (environment) and those related to material conditions (such as income and housing)
show important gaps (Figure 1.10). While Zuid-Holland’s score for income is higher than the national score
of 3.3, the region has fallen behind the national performance on the environment and housing, scores for
which are much lower than the national average (OECD, OECD Better Life Index: Netherlands).
TOWARDS COVID-19 RECOVERY AND GREATER RESILIENCE IN ZUID-HOLLAND © OECD 202120
Figure 1.10. Well-being indicators in Zuid-Holland and the Netherlands
Zuid-Holland
Zuid-Holland The Netherlands
The Netherlands
Education Education
10 10
Life satisfaction 9 Jobs 9
Life satisfaction Jobs
8 8
7 7
6 6
5 5
Community Income Work-life balance Income
4 4
3 3
2 2
1 1
0 0
Housing Safety Community Safety
Accessiblity to services Health Housing Heatlh
Civic engagement Environment Civic engagement Environmental quality
Note: The national and subnational well-being data sets are not directly comparable due to slight differences in the selection and availability of
indicators.
Source: (OECD, OECD Better Life Index: Netherlands), (OECD, OECD Better Life Index: Netherlands)
Climate adaptation and mitigation remains a challenge
Since 2000, the level of PM2.5 emissions decreased by almost a third in the province (-32% between 2010
and 2016). However, Zuid-Holland still registers the third highest level of air pollution in the Netherlands,
with an average level of PM2.5 at 15.1 µg/m³, well above the OECD average of 13.2 (Figure 1.11).
Compared across all OECD regions, Zuid-Holland ranks in the bottom 34% in the Regional Wellbeing
Index in the “Environment” dimension. Zuid-Holland also ranks lower in environmental issues than other
Dutch regions. In particular, it ranks much lower than other regions in terms of air quality, light pollution
(presence of artificial light in the night environment) and heat stress (Planbureau voor de Leefomgeving,
2019).
TOWARDS COVID-19 RECOVERY AND GREATER RESILIENCE IN ZUID-HOLLAND © OECD 2021 21
Figure 1.11. Evolution of PM2.5 in Zuid-Holland and the Netherlands, 2000-2016
Average level in µg/m³ experienced by the population
19 Netherlands Zuid-Holland
18
17
16
15
14
13
12
11
2000 2003 2005 2006 2009 2010 2011 2012 2013 2014 2015 2016
Source: OECD Regional Database
Figure 1.12. Air pollution in Zuid-Holland and selected OECD regions, 2016
Average level in µg/m³ experienced by the population
Gyeongbuk Region (Korea)
Emilia-Romagna (Italy)
Flemish Region (Belgium)
Provence-Alpes-Côte d’Azur (France)
Hamburg (Germany)
Zuid-Holland (Netherlands)
Hokkaido (Japan)
North West England (UK)
British Columbia (Canada)
Stockholm (Sweden)
0 5 10 15 20 25 30
Source: OECD Regional Database
Zuid-Holland cut its CO2 emissions from 23.1 million tons in 2010 to 22.8 million tons in 2017, which
represents a decrease of around 1.3%. The decrease in emissions has been particularly high in the built
environment, i.e. emissions have decreased the most in homes and businesses. However, CO2 emissions
from industry, energy, recycling and water increased in the region over the same period.
TOWARDS COVID-19 RECOVERY AND GREATER RESILIENCE IN ZUID-HOLLAND © OECD 202122
Zuid-Holland has a good level of accessibility, but more can be done to promote multi-
modality
The province of Zuid-Holland has higher accessibility to the European market than the average Dutch
region, but also higher accessibility relative to Noord-Holland, home to Amsterdam. This is due in part to
port-related infrastructure in Rotterdam. Zuid-Holland has about 550 kilometres of provincial roads, 130
kilometres of provincial waterways, 250 kilometres of shoreline and almost 700 bridges, locks, viaducts,
tunnels and culverts.
Despite the high accessibility of the region, the increase in emissions related to passenger transport points
to further potential to encourage low-carbon alternatives. Looking at the modal split of Zuid-Holland
(Figure 1.13), almost three quarters of total passenger kilometres are travelled by car (including both
passengers and drivers), which is just below the national average. Compared to other urbanized regions,
car dependency is high in Zuid-Holland, in the MRDH specifically. The share of public transport (combining
the categories of train and bus, tram and metro) is higher than in the Netherlands, but the share of bicycle
is a fraction lower. Although more people use public transport and fewer people use cars than on average
nationally, train stations are not as conducive to multi-modal solutions as they could be. An analysis carried
out by the province of Zuid-Holland to assess Transit-Oriented Development in the region (Staat van Zuid-
Holland) used 21 indicators that a successful station environment should ideally meet. Only 6 of 67 train
stations met these criteria and it was found that stations were heavily car-oriented, with large parking lots
but lacking other facilities. Station environments could thus be made more conducive to walking and
cycling.
Figure 1.13. Modal split in Zuid-Holland, 2017
Share of transport mode in total passenger miles
Walking, 3.60% Moped / light moped, 0.80%
Bus / tram / metro , 4.70%
Bicycle, 8.00%
Train, 9.30%
Car (driver) , 49.20%
Car (Passenger), 24.50%
Source: Zuid-Holland (State of South Holland | Mobility Behavior, 2019), State of Zuid-Holland: Mobility Behavior, https://staatvan.zuid-
holland.nl/portfolio_page/mobiliteitsgedrag/ (accessed on 18 September 2020)
TOWARDS COVID-19 RECOVERY AND GREATER RESILIENCE IN ZUID-HOLLAND © OECD 2021 23
Housing prices are on the rise, especially in cities
House purchase prices have increased dramatically in Zuid-Holland (average purchase prices increased
by 38% from 2015 to 2019), at the same pace as the national average (Statistics Netherlands, 2020).
However, prices in some cities such as Rotterdam have increased even faster (Figure 1.14). This is largely
due to increased demand spurred by continued migration to large cities in the Netherlands, and has been
found attributable to scarcity pricing (Hekwolter, Nijskens, & Heeringa, 2017). Zuid-Holland has the third
highest housing cost ratio in the Netherlands, which indicates that people are spending a larger percentage
of their income on housing. This is especially the case for renters in Zuid-Holland, who spent 38.9% of
their income on housing in 2018, as opposed to 28.6% for homeowners (Statistics Netherlands- CBS,
2019). Zuid-Holland actually registers the highest housing cost ratio for tenants in the Netherlands.
Figure 1.14. Evolution of the price index of existing houses, 1995-2020
Price index purchase prices, 2015=100
170 Netherlands South Holland The Hague Rotterdam
150
130
110
90
70
50
30
1995 2000 2005 2010 2015 2020 1st quarter
Source: https://www.cbs.nl/en-gb/figures/detail/83913ENG
Despite a high quality of life, inequalities persist
Even though quality of life in Zuid-Holland is relatively high, inequalities exist in the region and need to be
addressed to create a sustainable and liveable region for all. With 15% of its population at risk of poverty,
Zuid-Holland ranks above the national average of 13.2% (Eurostat, At-risk of poverty rate by NUTS regions,
2020), indicating that Zuid-Holland’s population is vulnerable compared to the national population. Within
the region, foreign-born residents in Zuid-Holland are more than twice as likely to be unemployed (14.9%)
than native-born residents (6.8%) (Figure 1.15). This difference is especially striking when it comes to
youth unemployment: 17.1% of foreign-born youth in Zuid-Holland is unemployed, compared to 7.1% of
youth born in the Netherlands.
TOWARDS COVID-19 RECOVERY AND GREATER RESILIENCE IN ZUID-HOLLAND © OECD 202124
Figure 1.15. Regional unemployment rates for native- and foreign-born in Zuid-Holland and
selected OECD regions, 2015
%
Native-Born Foreign-Born
Western Australia
British Columbia
Hamburg
North West England
Flemish Region
Netherlands
Stockholm
Zuid-Holland
Provence-Alpes-Côte d'Azur
Emilia-Romagna
0 2 4 6 8 10 12 14 16 18
Source: OECD Regional Database
A mix of development strategies in Zuid-Holland
All three levels of government in Zuid-Holland – province, MRDH and municipalities – have adopted their
own development strategies to address challenges:
The province of Zuid-Holland adopted the Coalition Agreement for 2019-2023 (South Holland),
which puts forward eight pillars:
o Working together in Zuid-Holland: Involving residents, organisations and companies in decision
making at an early stage
o Accessible Zuid-Holland: Efficient, safe and sustainable roads water and rails
o Clean energy: clean and affordable energy
o Competitive Zuid-Holland: Economic diversity and strengths
o Attractive rural areas: Contribution to the quality of life
o Strong cities and villages in Zuid-Holland: Accelerating housing construction
o Health and Safe Zuid-Holland: Protect and promote a healthy, safe living environment
o Finance and organisation: Working together on a sustainable management of the provincial
government.
In the “Zuid-Hollandse economie” programme, Zuid-Holland focuses on three strategic ambitions:
stimulating innovation, the transition towards a sustainable and digital economy, and the creation
of an attractive business climate.
In 2019, the MRDH adopted its strategic agenda for 2022 (MRDH, 2020). The Agenda was
developed by the 23 MRDH municipalities in consultation with the Province of Zuid-Holland, the
Economic Board Zuid-Holland and the water boards. In line with the MRDH mandate, the agenda
focuses on the economic renewal of the metropolitan region and on improving accessibility.
TOWARDS COVID-19 RECOVERY AND GREATER RESILIENCE IN ZUID-HOLLAND © OECD 2021 25
Municipalities in Zuid-Holland also adopted a strategic agenda to respond to the challenges they
are facing at the local level. For instance, The Hague developed its economic strategy “The Hague
+2030” and a mobility transition strategy. Delft developed its “Agenda 2020”, with a focus on six
topics: i) Delft as a high tech capital, ii) tourism, iii) housing, iv) climate actions, v) energy efficiency,
and vi) accessibility in and outside the city.
While each of those strategies depends on the mandate of its respective organisation and on the local
context, most of the strategies cover similar topics: accessibility, developing the local economy, climate
actions and clean energy, innovation and the development of the high-tech sector (Table 1.1). This
recurrence of priority areas highlights the fact that many challenges are shared across Zuid-Holland and
the potential synergies to join forces in tackling them. Such common priorities are also reflected in the JGA,
as discussed in section 3.
Table 1.1. Priority areas in strategies developed by different levels of government in Zuid-Holland
Economic Innovation/ Hi- Clean Climate Accessibility Digitalisation Well- Tourism
development/ tech sector energy action (mobility, being
Business climate housing)
Zuid- X X X X X X
Holland
MRDH X X X X X X X
The Hague X X X X X
Rotterdam X X X X
Delft X X X X X
Source: Author’s elaboration based on data provided by MRDH
COVID-19 highlighted further the urgency to tackle pre-existing challenges in
Zuid-Holland
The impact of COVID-19 on Zuid-Holland
Both the health crisis and the economic and social crises triggered by COVID-19 have had an asymmetric
territorial impact across and within OECD countries. On the health front, the virus emerged locally and
often concentrated in specific regions before spreading further across countries. On the economic and
social front, the impact depends on factors such as the sectoral composition of the local and regional
economy, trade openness and the composition of the labour market. For example, regional economies
that rely heavily on the tourism industry have been more affected than other regions by lockdowns and the
freeze in global movements of people. Capital regions and other large metropolitan regions also have a
relatively higher risk of job disruption than other regions (OECD, The territorial impact of COVID-19:
Managing the crisis across levels of government , 2020) as they tend to have a higher concentration of
jobs, especially in service industries that have been affected. The OECD analysis shows stark regional
disparities in the share of jobs potentially at risk in the short term as a result of confinement measures
(Figure 1.16). The share of jobs at risk ranges from less than 15% to more than 35% across 314 regions
in 30 OECD and 4 non-OECD European countries. The share of jobs at risk in Zuid-Holland has been
estimated to be 26.7% (OECD, The territorial impact of COVID-19: Managing the crisis across levels of
government , 2020). Zuid Holland therefore registers the fifth-highest estimated share of jobs at risk in the
Netherlands, with the highest being Flevoland with 29.8% (very closely followed by North Holland with
29.6%) and the lowest being Groningen with 21.5%.
TOWARDS COVID-19 RECOVERY AND GREATER RESILIENCE IN ZUID-HOLLAND © OECD 202126
Figure 1.16. Share of jobs potentially at risk from COVID-19 containment measures
Source: (OECD, The territorial impact of COVID-19: Managing the crisis across levels of government , 2020)
An unprecedented economic and social shock
With a strong reliance on international trade and professional services, the Netherlands has been hit hard
by the COVID-19 pandemic. Sectors that account for 36% of the Dutch economy, including horticulture,
were directly affected by the lockdown, although sectors such as construction and retail trade could
continue subject to distancing measures (OECD, OECD Economic Outlook , 2020)
According to OECD estimates released in June and September 2020, all OECD countries are projected to
experience a deep recession in 2020. Newer projections from December 2020 (OECD, 2020) estimate
that vaccination campaigns, concerted health policies and government financial support, are expected to
lift global GDP by 4.2% in 2021 after a fall of 4.2% in 2020.
Analysis conducted in the Netherlands suggests that Zuid-Holland is among the least impacted provinces
in the country. This could be explained by the sectoral composition of the economy. Analysis by Rabobank
has found that regions that produce a lot of added value in sectors with relatively strong contraction (such
as catering, transport and storage, other business services and industry) are likely to shrink more as a
result of the COVID-19 crisis. In contrast, for regions with a lot of production in sectors with limited
shrinkage (such as healthcare, the agricultural sector and the government), shrinkage is likely to be lower
(Aalders & Raspe, 2020). For instance, the ‘Healthcare’ and ‘Government’ sector together represent 23%
of the economy of Zuid-Holland, while on average these sectors represent only 19% of the Dutch economy,
possibly explaining the lower impact in the region. The impact in terms of GDP for the region has been
evaluated around - 6% for 2020, with a slow recovery in 2021 (+1%). Data from the Dutch Employee
Insurance Agency highlights the different impact on employment between the regions and within the region
(Figure 1.17). It is estimated that Zuid-Holland is less affected by the crisis than other regions, and that
even though the economy will contract sharply, the contraction will remain lower than the contraction of
the Dutch economy as a whole (South-Holland, 2020). Forecasts have shown, for example, that the
economy of The Hague is expected to contract by 4.4%, as opposed to the national average of 5.2%.
TOWARDS COVID-19 RECOVERY AND GREATER RESILIENCE IN ZUID-HOLLAND © OECD 2021 27
Figure 1.17. Expected impact of the COVID-19 crisis on regional employment in 2020 by labour
market region in the Netherlands
Percentage of employees in sectors with large or very large shrinkage (left) and growth (right)
Source: (South-Holland, 2020)
At the same time, a survey of Techleap among 445 Dutch start-ups highlighted that 86% of firms surveyed
were expecting the financial impact of COVID-19 to become critical within 6 months (Techleap.nl, 2020).
In the horticulture sector, for example, the export value of flowers and plants decreased by over 30% in
March 2020 (and by 77% in the last week of March alone). The turnover of the transport sector decreased
by 1.5% in the first quarter of 2020 due to the shock on aviation services and on the port of Rotterdam.
Statistics Netherlands calculated that in the first quarter of 2020, the total transhipment was 9.3% lower
compared to the first quarter of 2019. While the port of Rotterdam expected a drop of 30% in throughput
in the second quarter of 2020, mainly due to its strong reliance on China, data now shows that total
transhipment was 9.1% lower in the first 6 months of 2020 compared to 2019. While this drop is directly
linked to the COVID-19 crisis, the activities of the port had already started to drop earlier due to the
transition to clean energy in the Netherlands and in Europe. Additional sectors such as retail and tourism
have also been badly affected. Finally, R&D is forecasted to decrease, which will undermine the efforts to
modernise the economy, and may endanger the regional collaboration that has been strengthened since
2016.
As in many regions, some groups are particularly jeopardised, such as young graduates and low skilled
workers who are more dependent on high-risk jobs such as flexible jobs or part-time jobs. The crisis is also
poised to exacerbate inequalities, with long-lasting consequences. Young graduates who are unable to
find a job will likely add to unemployment rates; and if companies cannot invest in R&D, productivity and
competitiveness are likely to fall, further dimming growth prospects.
… with a strong fiscal impact
Subnational government finance across OECD countries has been seriously eroded, with massive
pressure on expenditure and shrinking revenues, thus increasing deficits and debt. While the crisis has
put short-term pressure on health and social expenditures and on categories of revenue, it is in the medium
term that the strongest impact is to be expected. National governments, associations of local governments,
and individual entities have started to estimate the fiscal impact in the short and medium term, in order to
TOWARDS COVID-19 RECOVERY AND GREATER RESILIENCE IN ZUID-HOLLAND © OECD 202128
prepare and adjust budgets, and to design appropriate measures to support subnational finance (Box 1.2)
(OECD, The territorial impact of COVID-19: Managing the crisis across levels of government , 2020). In
the case of Rotterdam, the city estimates that loss of revenue since March 2020 due to the COVID-19
crisis exceeds EUR 130 million. In the city of The Hague, this amount ranges between EUR 80 million and
EUR 130 million.
Box 1.2. COVID-19’s fiscal impact on subnational government
In Austria, the COVID-19 crisis is strongly affecting state and municipal budgets. A 7%-12%
drop in state tax revenues is forecasted. At the municipal level, it is estimated that the crisis can
cost up to EUR 2 billion in 2020 because of additional spending needs. This corresponds to a
5%-11% loss in revenue compared to 2019.
In Finland, in April 2020, the Ministry of Finance estimated the cost and lost revenue effects of
COVID-19 to municipalities to be around EUR 1.6 – 2 billion for 2020 i.e. around 4% of total
municipal revenues.
In France, estimates from May 2020 indicate that lost revenue among subnational governments
could reach EUR 7.5 billion in 2020. This is split into a loss of EUR 3.2 billion for the
municipalities and their groupings, EUR 3.4 billion for the départements and EUR 0.9 billion for
the regions.
In Germany, many state governments have seen a sharp deterioration in their budgetary
performance in 2020, given falling revenues and rising expenditure. Data published by the
Federal Ministry of Finance in May indicated a loss of tax revenue about 11% for the Lander
and 15% for the municipalities compared to estimates made in November 2019. The local level
is especially affected by a 25% drop in local business tax receipts, a tax that represents 44% of
municipal tax revenues.
In Italy, the Association of Italian Municipalities (ANCI) developed three scenarios for the loss
of municipal revenues due to COVID-19 : i) A low risk scenario with a loss of revenue among
municipalities of about EUR 3.7 billion (down 9% compared to 2019), ii) A medium risk scenario,
with an estimated municipal revenue loss of about EUR 5.6 billion (a decrease of 14% from
2019), and iii) a high risk scenario estimating a loss of EUR 8 billion (a drop of almost 21% over
2019). Regional governments also face financial difficulties. Most of their expenditure is
concentrated on health (85% on average), which will increase. To this is added a drop in receipts
from the regional tax on productive output (IRAP), the regional surtax on the personal income
tax and the regional tax on vehicles.
In the United States, preliminary data from 46 states indicates a total state tax decline of 49%
in April 2020 compared to a year earlier. Personal income taxes declined 63%, sales taxes
dropped 15.8% and corporate income taxes fell 63%. Cities, towns and villages can expect to
face a USD 360 billion budget shortfall from 2020 through 2022, as two-thirds of city revenues
nationwide are vulnerable to immediate losses due to local economic decline. City budget
shortfalls are prevalent regardless of city size, but vary significantly by state. These losses could
lead to significant cuts in critical public safety services, parks and recreation, and pay and jobs
cuts. This could also affect infrastructure investment.
Source: (OECD, The territorial impact of COVID-19: Managing the crisis across levels of government , 2020)
TOWARDS COVID-19 RECOVERY AND GREATER RESILIENCE IN ZUID-HOLLAND © OECD 2021You can also read