Downtown Palm Harbor Retail Market Study - March 2018 - Pinellas County
←
→
Page content transcription
If your browser does not render page correctly, please read the page content below
Downtown Palm Harbor
Retail Market Study

March 2018
Downtown Palm Harbor Ӏ Retail Market Study

Table of Contents
Introduction............................................................................................. 2
    Purpose of Study ............................................................................................................................. 2
    Area Description.............................................................................................................................. 2
Comparable Downtown Best Practices ...................................................... 5
    Trail-Oriented Development ........................................................................................................... 5
    Comparable Communities .............................................................................................................. 5
Trends in Retail ...................................................................................... 17
    Macro-Level Trends....................................................................................................................... 17
    Local Trends .................................................................................................................................. 18
Competitive Retail Framework ................................................................ 23
    Trade Area..................................................................................................................................... 23
    Multi-Tenant Shopping Centers .................................................................................................... 23
    Big Box Distribution....................................................................................................................... 26
    Retail Development Activity .......................................................................................................... 26
Demographic Profile .............................................................................. 29
    Population ..................................................................................................................................... 29
    Households .................................................................................................................................... 31
    Tapestry Segmentation Analysis ................................................................................................... 34
    Residential Building Permits ......................................................................................................... 36
    Residential Development Activity ................................................................................................. 37
Employment Profile ................................................................................ 38
    Regional Annualized Employment Growth ................................................................................... 38
    Regional Annualized Wages by Industry ...................................................................................... 40
    Trade Area Employment Growth Trends ...................................................................................... 40
    Trade Area Commuting Patterns .................................................................................................. 43
    Employment Forecasts .................................................................................................................. 44
Expenditure Potential and Study Area Demand ........................................ 47
    Retail Gap Analysis........................................................................................................................ 47

                                                                                                                                                          0
j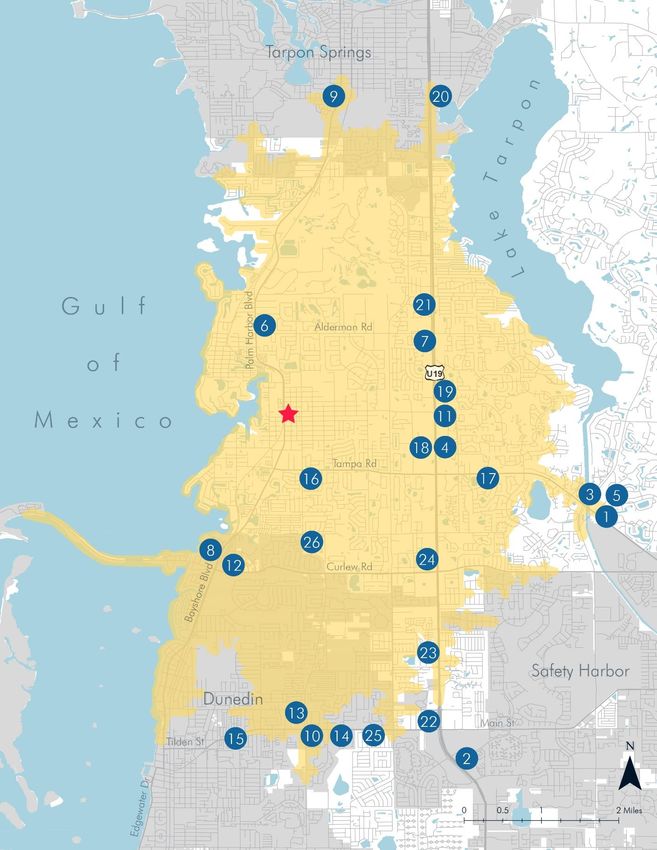
Downtown Palm Harbor Ӏ Retail Market Study

    Retail Demand Model (Medium) .................................................................................................. 48
    Downtown Palm Harbor Capture ................................................................................................. 50
Population and Household Growth and the Effect on Retail ...................... 52
    Comparison of Population and Housing Forecasts....................................................................... 52
    Comparison of Retail Demand Forecasts...................................................................................... 54
    Household Growth’s Effect on Retail Demand in Trade Area ...................................................... 57
    National Retailer Targets .............................................................................................................. 57
Conclusions and Considerations ............................................................ 60
    Downtown Palm Harbor Demand................................................................................................. 60
    Considerations and Challenges ..................................................................................................... 60
Appendix A: Supporting Retail Tables...................................................... 63
    Low Forecast ................................................................................................................................. 63
    Medium Forecast .......................................................................................................................... 69
    High Forecast ................................................................................................................................ 75
Appendix B: Survey Results ..................................................................... 81

                                                                                                                                                        1
j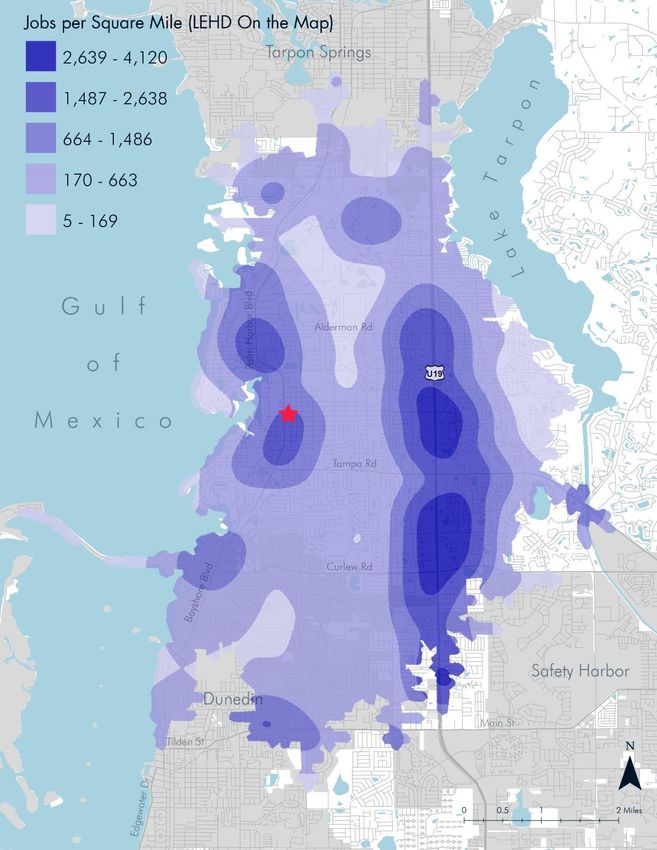
Downtown Palm Harbor Ӏ Retail Market Study

Introduction
Purpose of Study
This study is a retail market analysis that investigates potential ways to attract additional retail to the
Downtown Palm Harbor area. This study highlights existing inventory, identifies the unique attributes of the
area that are attractive to retailers, and explores future demand potential. The idea for the study drew from
community feedback that was obtained during the Downtown Palm Harbor Master Plan development
process.

The report structure will begin by highlighting the region and Downtown Palm Harbor area, and by
identifying comparable downtown best practices that are relevant to Palm Harbor. Next, retail trends will be
outlined and compared to the Downtown Palm Harbor trade area. A detailed demographic and
employment profile will then be presented
to paint the picture of current conditions in
the area and region. Finally, using the
previously established data points as a
basis for comparison and projection, the
report will look at development activity,
retail demand, and future growth and how
it will affect Downtown Palm Harbor. An
appendix outlines further raw data sets
and survey results from a polling of
Downtown Palm Harbor business owners.
                                              Source: catcherandtherye.com

Area Description
Regional Context
Palm Harbor is a census designated place that is part of unincorporated Pinellas County. It is roughly five
miles north of Dunedin and five miles south of Tarpon Springs between the Gulf of Mexico to the west and
Lake Tarpon to the east in the north part of the County, as seen in Map 1. Major corridors include several
north-south connections such as Alt US 19/Palm Harbor Boulevard, Omaha Street, Belcher Road, US 19,
as well as McMullen Booth Road and East Lake Road which is east of Palm Harbor. Major east-west
connections include Curlew Road on the south, Tampa Road, Nebraska Avenue, Alderman Road, and
Klosterman Road. Alt 19/Palm Harbor Boulevard had roughly 21,500 vehicles per day in 2016.

                                                                                                                2
j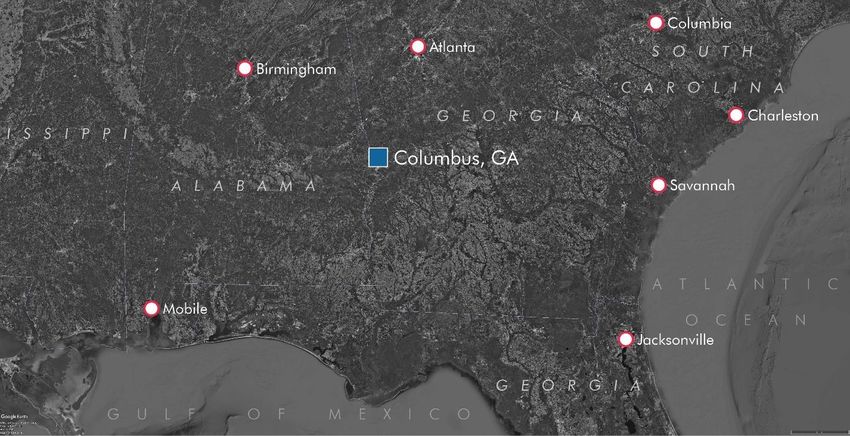
Downtown Palm Harbor Ӏ Retail Market Study

          Map 1: Pinellas County Region

Downtown Palm Harbor
The Downtown Palm Harbor Trade Area is roughly bounded by Indiana Avenue to the north, Omaha Street
to the east, Michigan Avenue to the south, and Alt 19/Palm Harbor Boulevard 8th Street to the west. Daily
volumes for major roadways in the study area vicinity include roughly 21,500 cars per day on Alt 19/Palm
Harbor Boulevard, 8,961 on Nebraska Avenue, and 7,855 on Omaha Street.
Identifying land use is a key component of understanding the fabric of any given area. Specific land uses
help to create a certain sense of place, which can be positive or negative. This sense of place derived from
land uses can be described as land use character, and some land uses can be described as having the
same character. The land use character in Downtown Palm Harbor is identified and grouped into six key

                                                                                                               3
j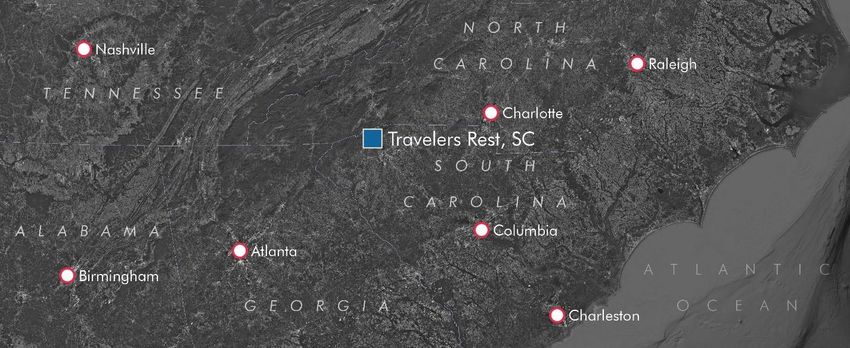
Downtown Palm Harbor Ӏ Retail Market Study
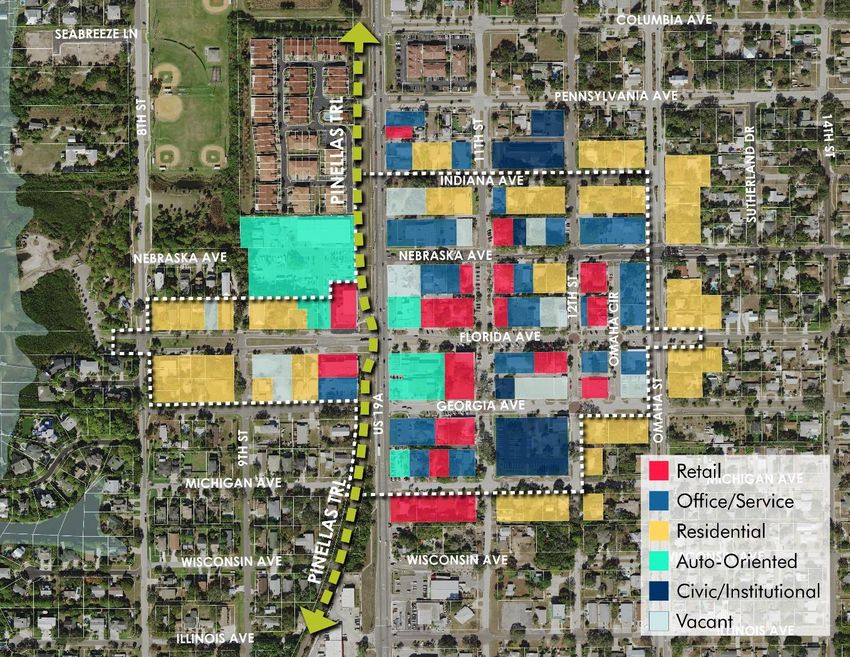
categories, seen in Map 2. To note, this map is showing land use character as identified and described by
this report, not the specific land uses identified by local zoning codes.
Looking closer at this land use character will help to give a deeper sense of the Downtown Palm Harbor
experience at a more granular level. For instance, this analysis shows us that retail options are scattered
throughout the downtown area, with somewhat of a focus along 11th street in between Nebraska Avenue
and Florida Avenue. The retail in the area primarily consists of local restaurants and bars with some
smaller boutique retail shops mixed in. These buildings are typically older and most of the restaurants
feature outdoor seating areas along the sidewalks. It would be more beneficial, and create a more
prominent node for retail, to aim to centralize any new retail uses that come to downtown. There is also a
good mix of office and service type uses. These consist of medical offices, lawyers, small businesses, etc.
Most of these buildings are also a bit older in character, many of which are older houses that have been
converted to businesses. Residential character areas are primarily located on the fringe of the downtown
area. One key point to note are the character areas that are auto-oriented in use. These areas, located
along Alt US 19 represent a variety of auto repair shops and service stations. The character of these
buildings and lots are not the most desirable when trying to cultivate a more vibrant downtown. They tend
to be uninviting to pedestrians to walk past and are undesirable for other retail businesses to locate next to.
Map 2: Downtown Palm Harbor, Land Use Character
4
j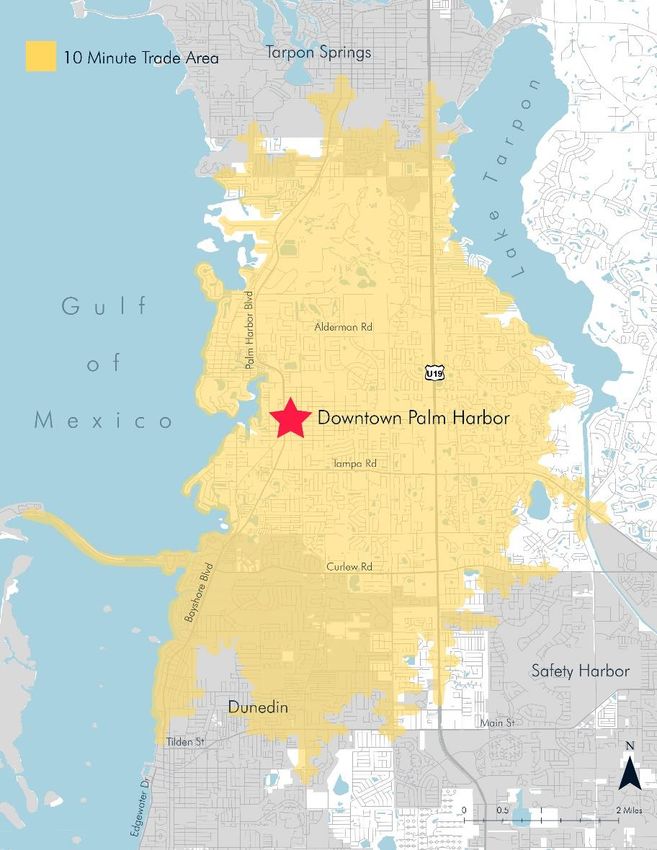
Downtown Palm Harbor Ӏ Retail Market Study

Comparable Downtown Best
Practices
Trail-Oriented Development
Downtown Palm Harbor is ideally situated along the Fred Marquis Pinellas Trail. Yet, due to a variety of
factors, it has not benefited from the presence of the trail to the degree experienced by Dunedin and
Tarpon Springs. Each of those communities have actively oriented their downtown planning, economic
development, and community design strategies to foster “trail-oriented development.” Like transit-oriented
development, trail-oriented development takes advantage of and leverages existing and future
infrastructure, such as trails, to help meet economic development, planning and placemaking goals.

According to the Urban Land Institute there is significant evidence of a correlation between access to
nonmotorized active transportation facilities, such as trails and greenways, and increased property values
in both urban and suburban markets. In fact, communities that leverage and enhance access to walking
and bicycling facilities, are helping initiate a win-win of mutually reinforcing private and public-sector
investment.

For instance, the value of properties within a block of the Indianapolis Cultural Trail have soared nearly
150 percent since 2008 and the value of properties near the Katy Trail in Dallas have increased 80
percent. Homes close to the Atlanta BeltLine have started selling within 24 hours; whereas, before the trail
project began, homes in the same area stayed on the market for two to three months. In Minneapolis,
every quarter-mile of proximity to an off-street bike facility raises the value of a home by an additional
$510.

Comparable Communities
Downtown Palm Harbor is positioned to leverage the presence of the Pinellas Trail to drive the economic
future of the commercial district. Four comparable communities profiled in this report have purposefully
and intentionally embraced trail-oriented development as a strategy to reposition and strengthen the
economic competitiveness of their downtown retail market. Comparable communities include: Dunedin,
and Tarpon Springs, Florida – both served by the Pinellas Trail; Travelers Rest, South Carolina – situated on
the Swamp Rabbit Trail; and Columbus, Georgia – positioned along the Chattahoochee RiverWalk.

Dunedin, FL
Sitting on Florida's Gulf Coast, the small city of Dunedin has a lot more going for it than just its quaint
downtown. The city was founded by Scottish families, and its name comes from the Scottish-Gaelic name
for Edinburgh, the capital of Scotland. The city is known for its annual Highland Games and Festival, which
is held in nearby Highland Park just a short drive from Dunedin's downtown. Also, located in Dunedin is
Honeymoon Island and Caladesi Island, frequently listed as one of the best beaches in America.

                                                                                                                5
j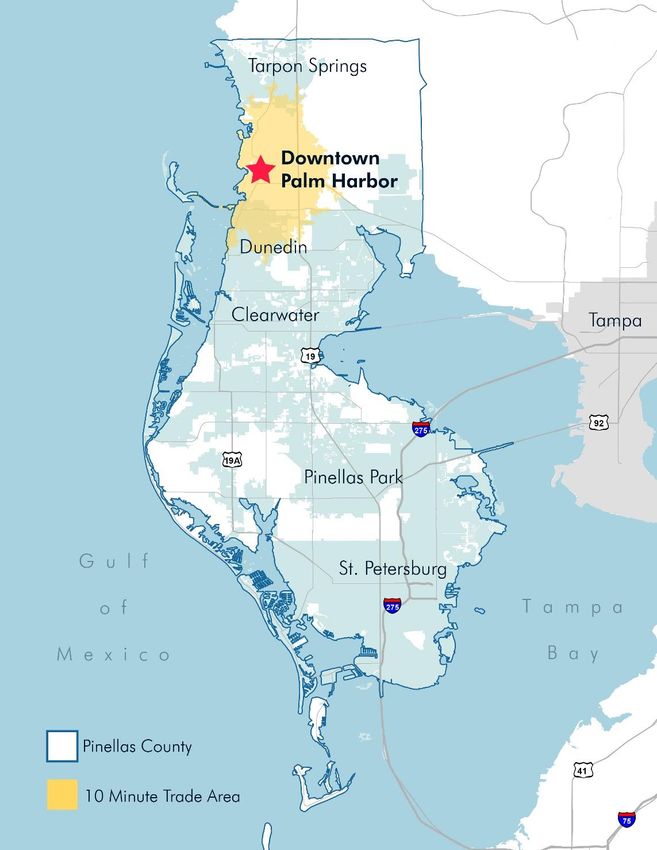
Downtown Palm Harbor Ӏ Retail Market Study

Map 3: Dunedin, Regional Context

The city’s downtown runs along Main Street between the Gulf of Mexico and Milwaukee Avenue. While
Main Street/Skinner Boulevard runs east and west, Broadway runs north and south and features many
businesses, particularly art galleries and home design stores. The intersection of these streets forms the
heart of the downtown. Main Street businesses include antique stores, clothing stores, and gift shops; along
with restaurants, taverns and nightclubs. Storefronts are generally continuous and only broken-up in a
couple of spots by driveways and parking. Additional shopping streets include Douglas Avenue, Highland
Avenue, and Virginia Lane. The regional position of Dunedin can be seen in Map 3.

Trail-Oriented Development
The Pinellas Trail runs north/south just a half block east of Broadway. The stretch of trail through Dunedin
is featured as one of the few locations where the trail is well lit at night and directly intersects with storefront
retailers. Several businesses in the area cater to trail users, including a coffee house located in a renovated
railroad boxcar, building upon the trail's railway past. The trail connects to Downtown Palm Harbor (five
miles or thirty minutes by bike) and Downtown Tarpon Springs (ten miles or one hour by bike).

Retail Area
Downtown Dunedin is generally defined by a five block-wide area, which also serves as the boundary for
the Downtown Community Redevelopment Area (CRA). The area includes 200,000+ square feet of retail
storefront retail. This represents approximately 13.8 percent of the City’s overall retail inventory.

Building Scale
Downtown buildings are generally between one and four stories. They vary in age, architectural style, and
overall character.

                                                                                                                       6
j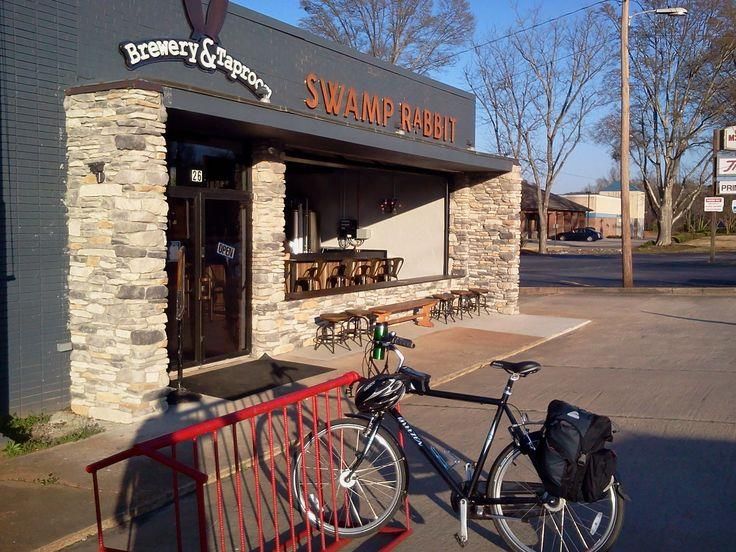
Downtown Palm Harbor Ӏ Retail Market Study

Use Mix
The use mix in Dunedin is predominantly unique (or
local), as opposed to “national” retailers.
Apparel/Furnishings and Other (AFO retail) comprise
the largest share of retail in the area at an estimated
55 percent of retail space. Eating and Drinking Places
(restaurants, taverns, nightclubs, etc.) comprise 40
percent of retail in the downtown and
Grocery/Convenience Retail makes up 5 percent.
Convenience uses appear to be somewhat under-
represented based on projected residential growth.

Occupancy and Rents
According to Lambert Advisors, in May 2017 retail
vacancies within the downtown were around 3 percent
with average base rents about 10 percent higher than
Pinellas County and the City overall.

Average downtown retail rents were approximately $23
per square foot, nearly $3 higher than that for both
Pinellas County and City of Dunedin, at about $20 per
square foot. Average asking rents are highest along
Main Street west of Douglas Avenue, between $16 and
$34 per square foot, with common area maintenance
(CAM) estimated at $8 per square foot. Further along
Main Street, within the downtown, rents generally range
from $15-20 per square foot with CAM estimated at $6
per square foot.

Public/Private Infrastructure
Two primary organizations serve as stewards of
Downtown Dunedin. These include the City’s formal
Community Redevelopment Agency (economic
development and planning) and the grassroots, not-
for-profit Downtown Dunedin Merchant Association
(promotion and marketing).

City of Dunedin Community Redevelopment Agency (1988)
The primary goal of the City’s Community
Redevelopment Agency is to guide private and public       Source: Destination Main Streets
initiatives for creating economic development,
improved physical characteristics, encourage investment in downtown Dunedin, improve the quality of life
for residents, and establish a framework for the proper evolution of the CRA District. High profile CRA
initiatives include the Downtown Master Plan, the Waterfront Corridor Plan, affordable housing, branding,
and the Downtown Building Grant Program.

Downtown Dunedin Merchant Association (1992)
The Downtown Dunedin Merchant Association is a membership-based private 501-C6 nonprofit
organization that promotes awareness of local and downtown businesses. The group targets visitors from
around Tampa Bay and elsewhere by advertising its members through a variety of traditional and online

                                                                                                            7
j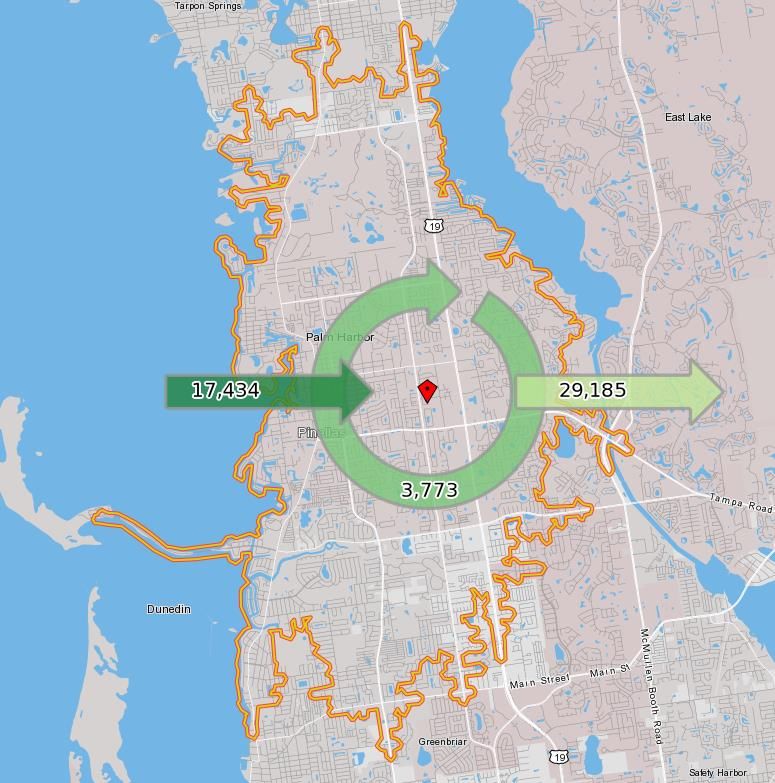
Downtown Palm Harbor Ӏ Retail Market Study

platforms. The association also produces a series of special events, including the annual Dunedin Mardi
Gras, Taste of Dunedin, Dunedin Wines The Blues, and a monthly Second Friday series.

Parking
Like most American downtowns, the core of Dunedin struggles to balance the needs of a walkable and
lively downtown with the easily accessible and convenient parking. There is a combination of on- and off-
street and structured parking within the downtown.

The debate over paid parking has grown into the city’s most contentious and divisive issue in decades. The
City launched a paid parking trial program utilizing kiosks, including on-street, within downtown in
accordance with recommendations of the Downtown Parking Plan. In December 2017, however, the City
Commission approved a revised Downtown Parking Plan recommending reverting back to free parking in
the downtown area. On-street parking on Main Street is free with three-hour time limits during the daytime.
Paid parking is now limited to the Douglas/Monroe parking garage, the Wood Street/Baptist Church Lot,
Marina Plaza Lot, and a level of the future Gateway garage. Payment in these locations is $1.50 per hour
and is required only during weekdays from 6pm to 10pm and all-day Saturday and Sunday. All other
areas are free with no time limits.

Programming
To build awareness and regularly attract visitors to the downtown, festivals and special events are generally
organized and led by the Downtown Dunedin Merchant Association with support from the City of Dunedin
and Pinellas County.

Tarpon Springs, FL
Tarpon Springs is located at the northern end of Pinellas County, five miles from Downtown Palm Harbor
via the Pinellas Trail (approximately one hour by bike). Tarpon Springs has two thriving activity centers:
Historic Downtown and the Sponge Docks. While located in proximity to one another they are independent
and distinct districts. The goal to physically connect the two has been a community planning and design
goal for decades. The regional position of Tarpon Springs can be seen in Map 4.
Map 4: Tarpon Springs, Regional Context

                                                                                                                8
j
Downtown Palm Harbor Ӏ Retail Market Study
Historic Downtown
Activity within Historic Downtown is generally
concentrated along Tarpon, Hibiscus, Safford, and Ring
Avenues. The area has grown into a retail destination
with art galleries, eclectic boutiques, home décor,
antiques, breweries, and restaurants, many still housed
in vintage 1900-era buildings. The former Train Depot
has been renovated and now serves as the City’s
Welcome Center and is maintained as a museum by
the Tarpon Springs Historical Society. The Pinellas Trail
winds through downtown, and intersects Tarpon
Avenue at Safford Avenue, bringing cyclists, walkers,
and outdoor enthusiasts to the area. In the past five
years, the City has made extensive investments in
infrastructure investments within the downtown,
including:
• Reconstructed Lemon Street and added
extensive landscaping
• Achieved jurisdiction of Tarpon Avenue from
the Florida Department of Transportation, and
embarked on a major streetscaping project
• Upgraded the Safford/Tarpon intersection in
tandem with Tarpon Avenue streetscape
• Completed the North Safford Recreation
Corridor to form a bike and pedestrian link
between downtown and the Sponge Docks
using the Pinellas Trail as a focal point.
Sponge Docks
Located parallel to the Anclote River, this assortment of
shops, restaurants, bakeries and other gathering places
have grown to become one of Florida’s most unique
attractions. This area is characterized by a small
working waterfront, and an assortment of destination
restaurants. The area is a mix of Greek heritage,
culture, conversation and sensitive scale. Beyond the
waterfront buildings, the area is supported by large
surface parking lots. Some poorly placed buildings
block important marine views. For the most part Source: Digital Photo Academy, Tarpon Springs
sidewalks are adequate for basic walking. Plans to add Merchant Association, pinsdady.com (respectively)
shade, street furniture and other amenities seek to create a more pedestrian-friendly environment.
As an anchor of the Greektown National Historic District, the Sponge Docks along Dodecanese Boulevard
have grown to become a significant regional attraction and is experiencing growth pressures that could
impact its character. A Special Area Plan for the Sponge Docks, along with designation as part of the CRA,
and a newly adopted form-based code are actions led by the City to manage the growth and encourage
compatible compact, pedestrian-oriented and mixed-use development.
9
jDowntown Palm Harbor Ӏ Retail Market Study
Trail-Oriented Development
Pinellas Trail also serves Downtown Tarpon Springs. The trail is recognized as one of that nation’s best
multi-use facilities. It’s length, connectivity to towns to the north and south, quality design, construction and
maintenance draws ever increasing numbers of people walking and biking to Tarpon Springs. However,
the portion of the trail through Tarpon Springs has not been maintained to the degree demonstrated by
Dunedin and wayfinding to key destinations is missing.
Recognizing opportunities for improvement, the City of Tarpon Springs commenced a series of strategic
initiatives that brought new investment to the downtown. The most significant project to date includes the
$1.2 million North Safford Avenue Recreation Corridor by leveraging the Pinellas Trail to connect
Downtown Tarpon Springs and the Sponge Docks. Opened in 2013, the bike and pedestrian
improvements include a fitness park with outdoor exercise equipment, redesigned dog park, kids’ splash
park, kayak/canoe launch, resurfacing a portion of the Pinellas Trail, and a pedestrian connection between
the redeveloped parks and trail via a wooden boardwalk. Streetscaping, landscaping, and facilities along
Safford Avenue were also upgraded.
Retail Area
Downtown Tarpons Springs covers approximately 227-acres along Pinellas Avenue between the Anclote
River on the north to Meres Boulevard on the south and includes the Lemon Street corridor. The Sponge
Docks and Historic Greektown District represents an additional 140 acres to the northwest.
Building Scale
Within the downtown, buildings are traditional one- and two-story main street buildings. Historic areas of
town generally have great block form, building orientation, and placement, all of which contribute to
improving walkability. Within Greektown and the Sponge Docks, historic buildings convey a distinctive
sense of place and ethnic heritage, with a mix of commercial, industrial, residential, and religion-based
buildings as well as boats. Many buildings are supported by surface parking.
Use Mix
The character and use mix in Historic Downtown and the Sponge Docks is vastly different. Historic
Downtown is quieter and includes a mix of stores operated by local merchants selling antiques, along with
places to eat and drink. Parking is generally, on-street and within individual small lots. The Sponge Docks
are a bit livelier and concentrated with a variety of visitor-oriented shops, Greek restaurants and bakeries,
and other gathering places. Vast surface parking breaks-up the connection of attractions.
Rents
Average downtown retail rents range between $12 and $16, slightly less than Pinellas County at $20 per
square foot. Office rents range from $8 to $16 per square foot, while flex space can demand between $12
and $30 per square foot.
Public/Private Infrastructure
City of Tarpon Springs Community Redevelopment Agency (2001)
The Tarpon Springs Community Redevelopment Agency (CRA) was established to help stimulate
redevelopment and revitalization, encourage economic growth, eliminate blight, create a sustainable
downtown and improve the attractiveness of the central business district. Primary initiatives include a
Special Area Plan for the downtown, including the Sponge Docks, that encourages redevelopment through
density transfers, a building façade grant initiative, and restaurant recruitment funding program. Other
strategic investments supporting downtown retail include streetscape and public realm improvements along
Lemon Street, Tarpon Avenue and the North Safford Recreation Corridor.
10
jDowntown Palm Harbor Ӏ Retail Market Study
Tarpon Springs Merchants Association
The Tarpon Springs Merchants Association is a membership-based nonprofit organization that promotes
awareness of businesses within downtown and at the Sponge Docks. The group operates a website and
various online platforms. The association also produces special events, including a Wine Walk and the
monthly “First Friday” series, an open-air, multi-block festival held in Historic Downtown.
Tarpon Springs Chamber of Commerce
The Tarpon Chamber of Commerce serves area visitors and businesses. The Chamber helps both new and
existing businesses. The group also organizes and produces many large scale special events within
Downtown, including the Annual Fine Arts Festival, the City’s Christmas Parade, and the Annual
Thanksgiving Arts & Crafts Show.
Parking
Within Historic Downtown free on-street parallel parking is provided along portions of select streets.
However, to accommodate the large numbers of visitors who arrive by car, vast areas of surface parking
remain and are also provided free of charge. To support downtown growth, the City of Tarpon Springs is
continuing to focus on public infrastructure by building a new municipal parking lot.
Supporting the Sponge Docks, parking is mostly accommodated by private surface lots which are available
for a fee. Daily parking rates range between $5 and $10 dollars. Limited free on-street parallel parking is
available along side streets and is often used by area workers rather than visitors.
Programming
To consistently attract visitors, both Historic Downtown and The Sponge Docks host a rotation of festivals
and special events that are generally organized and led by Tarpon Springs Merchants Association with
support from the City of Tarpon Springs and the Tarpon Springs Chamber of Commerce. One of the city’s
largest annual events is the winter Epiphany Celebration and procession through the Historic Downtown.
Additional signature events in Tarpon Springs include Oktoberfest, Snow Place Like Tarpon Springs,
Zombie Run, The Fine Arts Festival, Hippie Fest, Arts & Crafts festivals, Wine Walks and more.
Travelers Rest, SC
Named by Budget Traveler magazine one of “America's Coolest Small Towns” in 2014, Travelers Rest -
specifically its downtown and Main Street - has emerged as a major destination in the region for outdoor
recreation, dining, and entertainment. The regional position of Travelers Rest can be seen in Map 5.
Map 5: Travelers Rest, Regional Context
11
jDowntown Palm Harbor Ӏ Retail Market Study
Travelers Rest, South Carolina is a small city of almost 5,000 residents. It was first established as a stopover
for those making their way across the Blue Ridge Mountains and experienced little change for decades. In
recent years, Travelers Rest successfully transformed from a “Small Town to a Trail Town.” Along Main
Street, new restaurants, bakeries, shops and a seasonal farmers' market attract citizens and visitors.
The compact walkable downtown area, specifically Main Street, is defined by the Greenville Health System
(GHS) Swamp Rabbit Trail, a 13.5-mile bike and pedestrian corridor connecting Downtown Travelers Rest
to Downtown Greenville and other nearby destinations. The trail’s terminus extends 2.5 miles north of
Downtown Travelers Rest, however, the segment through downtown is the northernmost activity
center/anchor which many describe as “a park that happens to have a Main Street in the middle of it.”
Trail-Oriented Development
The accolades, success, and vibrancy of Main Street did not happen by chance. The transformation from a
once desolate thoroughfare into a bustling downtown has been the direct result of economic development
strategies, urban design considerations and targeted public investments designed to spur private
investment with a focus on leveraging the GHS Swamp Rabbit Trail. Over the course of 10-years these
investments include completion of streetscapes along Main Street, a community branding initiative, and
comprehensive wayfinding signage system.
Before completion of the GHS Swamp Rabbit Trail in 2010 and a $4.5 million investment to turn three
downtown blocks into a walkable retail and food and beverage stretch, Main Street Travelers Rest, aka U.S.
Highway 276, had dozens of vacant buildings. Downtown Travelers Rest has blossomed into a thriving
destination because of the trail and related investments designed around it. Downtown is nearly built out
with limited available property. With the goal of extending the success to adjacent areas, the City is looking
to deploy the same approach, including road and intersection improvements, bike paths, infill
development, streetscaping, and sidewalk improvements.
Public improvements to support Main Street’s success were pursued using a variety of tools including,
enhancement grants, hospitality tax, local accommodations tax, c-funds through the Greenville County
Transportation Committee, tax increment financing, and sponsorships/naming rights.
Retail Area
Downtown Travelers Rest is generally defined as a 1-mile segment of Main Street between W Road and Roe
Road, with the crossing of Main Street and McElhaney Road being the most important, most visible and
commanding the highest values in the downtown. It is no coincidence that this intersection is unofficially
viewed as the terminus of the Swamp Rabbit Trail and functions as a trailhead with adjacent merchants
serving the needs of trail users, such as Sunrift Adventures Outfitters.
With the goal of adding depth to the market and extending retail beyond Main Street, the City is advancing
a Poinsett Highway and Center Street Corridor Study. Initial recommendations suggest replicating many of
the successful strategies deployed along Main Street.
Building Scale
Buildings along Main Street are primarily one-story commercial structures. A few historic two-story buildings
are located sporadically along the corridor. Limited continuity in the urban fabric along the corridor, along
with gaps along the streetscape, offers a significant number of parcels ripe for redevelopment and
prepared to accommodate anticipated future growth.
Use Mix
Along Main Street, the retail mix includes restaurants, bakeries, local shops, and a seasonal farmers'
market. Many merchants cater to the needs of trail users including outfitters.
12
jDowntown Palm Harbor Ӏ Retail Market Study
Vacancy
According to the 2017 Travelers Rest Market Analysis &
Economic Development Plan, “Downtown Travelers Rest
continues to grow and thrive with extensive renovation
of buildings, new infill housing development, and
proposals for additional downtown revitalization.”
Additionally, the City of Travelers Rest desires to stay up
to date on its retail trends and growth.
Rents and Values
Rents have been impacted by the growth of more than
thirty new businesses along Main Street in the past two
years. Available data shows downtown rates around
$17 per square foot triple net lease (NNN) with
average CAM less than $3 per square foot.
Downtown property values have increased by 62%
since 2004 and retail/restaurant sales have
dramatically increased. This increase is due to private
property investments and the City’s Façade
Improvement Grant Program (10% of CDBG allocation
to provide up to $5,000 in reimbursable grants for
façade work).
According to the GHS Swamp Rabbit Trail Impact Study
(2012) individual merchant revenue generated from
trail users ranged between $50,000 and $400,000,
with the average around $110,000.
Public/Private Infrastructure
The transformation of Main Street is the direct result of
concerted efforts led by the Greater Travelers Rest
Chamber of Commerce, city officials, and private
citizens.
Parking
Free parallel on-street parking is provided along the
southernmost blocks along Main Street. Recent
revitalization and streetscape projects have looked to Source: VisitGreenvilleSC (VGSC),
paradisepointsc.com, Pinterest (respectively)
reduce the width of Main Street from four travel lanes
to two lanes and convert extra space to on-street parking (as it was before a previous widening project). In
addition to on-street parking, most downtown merchants accommodate patron parking with onsite surface
lots.
To support trail users and to augment onsite parking provided by nearby merchants, the city constructed an
80-space public surface lot on a former City owned school site. The lot cost $100,000 to build and opened
in October 2014. Three additional municipal surface lots offer parking for free. As of January 2015, there
were no plans to add more parking in downtown.
13
jDowntown Palm Harbor Ӏ Retail Market Study
Programming
The City of Travelers Rest, Greenville County, and the Travelers Rest Artists Alliance organize a variety of
annual and special events to animate downtown.
The Travelers Rest Artists Alliance was established with the goal of positioning the City as the premier "small
town" for the arts, entertainment, and culture in the Southeastern United States. Since its inception in 2012,
the Travelers Rest Artists Alliance (TRAA) has supported community creativity and engagement. The Art on
the Trails Festival is the group’s signature annual event.
Other events impacting downtown include: 5K on the Trails, a weekly farmers’ market, evening
entertainment along Main Street, and regular programming within the park.
Columbus, GA
The downtown area of Columbus, Georgia, which is referred to as Uptown, has undergone a remarkable
transformation over the past 25 years that has not only brought vitality, but also preserved the area’s
historic character. This transformation is the result of coordinated efforts and investments led by the City,
business leaders, and Columbus State University. Together they have built the Chattahoochee RiverWalk
Trail, a 22-mile walking and biking corridor along the Chattahoochee River that has become an anchor of
Uptown. As a result, the city has been listed by the League of American Bicyclists as one of the forty most
Bicycle Friendly Communities in the United States. The regional position of Columbus can be seen in Map
6.
Map 6: Columbus, Regional Context
Trail-Oriented Development
The Chattahoochee RiverWalk Trail was born as a combined sewer repair project. It grew from the need to
build a required service road to access the new underground sewage line. A Riverfront Committee at the
Greater Columbus Chamber of Commerce, along with Uptown Columbus Inc. is responsible for driving
the conversation that caused the City to use the required public infrastructure investments to meet the City’s
greater community planning, placemaking and economic development goals, with an emphasis on
Uptown. Construction began in 1989 and the first phase opened in 1992. The project was fully complete
14
jDowntown Palm Harbor Ӏ Retail Market Study
twenty years later. As with any roadway or highway,
the connected trail promoted economic development
within Uptown.
The initial phase of the project was funded by $20
million in Columbus Water Works bonds and $1
million each from the Aflac and Bradley-Turner
Foundations. Additional funding was generated by a
voter approved 1% local tax and augmented by a $20
million federal grant.
The success of the Chattahoochee RiverWalk Trail and
its impact on Uptown help to set the tone for the
continued investments in outdoor activities and
recreation. This includes the Chattahoochee
Whitewater Course - another amenity that was the
result of a diligent effort on the part of community, zip
line courses across the river, and a planned Columbus
Fall Line Trace Rails-to-Trails Project.
Size of Trail Area
Uptown is the central business district of Columbus.
Retail is generally concentrated along a 1-mile stretch
of Broadway between 9th Street and 13th Streets. To
the west is the Chattahoochee RiverWalk and recent
developments have started to extend the energy of
downtown east to 2nd Avenue.
Building Scale
Uptown is organized around a historic grid and is
generally walkable. Buildings are low-scale with the
exception being church spires, the courthouse, and the
Aflac headquarters. Buildings are generally Main
Street-style and adaptive former warehouse structures,
with the exception of mid-century government
buildings, along with new contemporary sporting, arts,
and performance venues.
Use Mix
The use mix within Uptown Columbus, particularly
along Broadway is dominated by places to eat and
drink, along with a few coffee shops, independent
apparel, and the Columbus State University Bookstore.
This area is animated at night by both the historic
Springer Opera House and the RiverCenter for the
Performing Arts. Additionally, Uptown is experiencing Source: HUB GA, Pinterest, Visit Columbus
(respectively)
the adaptive reuse of historic mill buildings as mixed-
use and residential developments.
Adjacent to Uptown Columbus is Whitewater Express, a rafting service on the Chattahoochee River. The
2.5-mile course is the longest urban whitewater rafting in the world, and has been ranked the world's best
15
jDowntown Palm Harbor Ӏ Retail Market Study
manmade whitewater course by USA Today. It also features the Blue Heron Adventure, a zip line course
connecting the Georgia and Alabama sides of the river. Both attractions are focused within Uptown.
Public/Private Infrastructure
Revitalization of Uptown is the result of decades of public/private partnerships and a combination of public,
private, and non-profit investments. This structure, along with the support of a consolidated City/County
government structure supported Columbus State and the development of its RiverPark Campus, the
development of the whitewater course, sustained support for museums and cultural amenities, and buildout
of the RiverWalk Trail.
In addition to the Columbus Consolidated Government, along with the Chamber of Commerce, leadership
within the central business district includes Uptown Columbus, Inc. and the Business Improvement District.
Uptown Columbus, Inc., a 501(c)(3) nonprofit organization, facilitates and coordinates economic
revitalization initiatives throughout the Central Business District, Riverfront and throughout Uptown. In
1999, the group championed the creation and management of the Business Improvement District (BID), a
501(c)(6) nonprofit organization. Property owners within the 47-block area pay a special assessment above
their regular property taxes. This assessment is collected by the Columbus Consolidated Government and
the City contracts with the BID to provide and manage services.
Parking
Parking within Uptown Columbus is accommodated through a combination of structured decks and surface
lots. The local transit agency manages municipal parking, including two parking garages, a surface lot,
and enforcement of on-street metered spaces within the area.
Along Broadway, parking is limited to two hours for the day on any given block. For streets other than
Broadway, drivers must move their vehicle from space to space within the posted time limit.
Programming
Uptown Columbus is the location for a variety of outdoor special events and recreation year-round. Unlike
other comparable communities, there is not a consistent advocate or set of organizers.
In addition to a variety of special events and festivals, the Columbus BID manages a team of
“Ambassadors,” better known as "Purple People", to patrol the streets of Uptown Columbus seven days a
week. They enhance public safety, serving as "eyes and ears" on the street, and the presence aids in overall
crime prevention.
The BID also manages a clean team that provides environmental maintenance services. The Clean Team
works seven days a week in the Central Business District on litter prevention and control, mechanical
sweeping, and pressure washing.
16
jDowntown Palm Harbor Ӏ Retail Market Study
Trends in Retail
Macro-Level Trends
An Evolving Market
Retail markets tend to experience more fluctuation than other real estate property types. While national
trends indicate retail market is “on the rise”, investment and development opportunities ranked the lowest
of all major sectors (Urban Land Institute, 2017). Performance of retail centers varies widely, depending on
product type and location. In fact, per an annual survey administered by Urban Land Institute for the
Emerging Trends in Real Estate report, retail located in a downtown or urban core location generates
strong confidence for developers, investors, and lenders largely due to higher than average lease rates and
low vacancies. Other retail sectors demonstrating strong performance include grocery anchored
neighborhood centers and lifestyle/entertainment centers. Two of the three top center types reflect a
movement towards mixed- or multi-use development patterns.
Excellent
It is very reasonable to expect
a strong return on investment. Urban/high street retail
Invest with confidence.
Good Lifestyle center
Some cases may differ, but Neighborhood center
in general, it’s a solid
investment. Outlet center
Fair
There are some concerns Regional mall
about investment in this
product type. Modest returns Power center
expected.
Source: ULI Emerging Trends in Real Estate Surveys
While retail has not fully rebounded from the 2007-2009 Recession, certain retail types are experiencing
more growth than others. Key retail sectors that are likely to drive development patterns in the coming
years include urban, main street, and community-focused centers. Urban footprint retail is not necessarily
restricted to luxury stores, as discount and department stores are more commonly seeking opportunities for
downtown or walkable locations. Many big box retailers are currently either going away or scaling down
their footprints to adapt. Demand for unconnected suburban power centers and regional indoor malls has
declined. However, pedestrian-friendly ‘lifestyle’ centers have been on the rise (Jones Lang LaSalle, 2016).
The Impact of E-Commerce
Online shopping has changed the face of retail across the country. Initially, the internet allowed retailers to
connect with their customers in different ways. It also encouraged the establishment of more specialty
17
jDowntown Palm Harbor Ӏ Retail Market Study
stores, typically requiring smaller footprints. Retail spaces and shopping centers have used design elements
to better convey brand and messaging that has been expanded through an online experience. It should be
noted that while the impact of e-commerce has directly affected retailers, it also plays a role in other sectors
like smaller-scale manufacturing, warehousing, and distribution.
Although online shopping has pulled some activity away from brick and mortar stores, it will not supplant
the need for these spaces. In fact, consumers are shopping for the best deals using both online and in-store
options. Partially due to the private nature of online shopping, customers are seeking an enhanced public
or community experience when buying at a store. This has influenced the popularity of pop-up stores,
higher-end dining options, concierge desks, and child play facilities. Physical store locations are better
embracing technology to provide a more personalized and connected experience.
Store Sizes are Shrinking
As noted above, largely due to advancements in online shopping and technology, retailers, including
traditionally big-box formats, are also seeking smaller footprint options. Many large stores, including
Target, Best Buy, and Ikea, have already started demonstrating this shift towards smaller buildings with a
more defined selection. This trend is addressing public desire to save time and increase efficiency through
smaller spaces and specialized sections.
Grocery Diversification
Not immune to the trends outlined above, the grocery store market is being penetrated by new players,
impacted by smaller footprints, and seeking specialization. Shoppers today are less likely to be loyal to a
particular store for food shopping, often visiting several to meet all of their needs. According to a survey in
2015, the average shopper visits 2.5 grocery stores at least fairly often. New grocery retailers are entering
many markets, offering potential anchors to community centers.
While the average grocery footprint has historically been between 40,000 and 50,000 square feet, many
grocery chains, including Trader Joes, ALDI, and Fresh Market, are focusing on smaller buildings
(~20,000 square feet) with more specialized items. Even traditionally larger grocers, including Kroger,
Harris Teeter, and Wegmans, are experimenting with micro-stores in certain markets.
Local Trends
Overview
This section presents retail performance measure trends including completions, net absorption, vacancy
and average rent per square foot. Retail performance in the submarket containing Downtown Palm Harbor
has been compared to the larger Tampa-St. Petersburg-Clearwater Market.
Retail performance trends are based on regional and submarket information provided by REIS, which
divides the Palm Harbor market into separate submarkets. Downtown Palm Harbor is located in the
Clearwater/N. Pinellas Submarket, which is bordered to the east by Old Tampa Bay, to the north by the
Pinellas and Pasco County boundary, to the south by State Road 688/Ulmerton Road, and to the west by
the Gulf of Mexico. A map of the submarket as defined by REIS can be seen in Map 7. The retail framework
analysis helps to provide more detailed performance metrics specific to Downtown Palm Harbor, Pinellas
County, and the Tampa-St. Petersburg-Clearwater MSA.
18
jDowntown Palm Harbor Ӏ Retail Market Study
Map 7: Clearwater/N. Pinellas Submarket
Source: REIS
Tampa Market Retail Performance Trends
As shown in Graph 1, from 2012 to 2017 (3Q), the multi-tenant retail vacancy rate in the Tampa-
Clearwater-St. Petersburg market gradually decreased from 11.7% to 10.2%. New retail space totaled
486,000 square feet. Net absorption totaled 1,099,000 square feet, equating to an oversupply of 613,000
square feet, or 122,600 square feet annually. Vacancy was lowest most recently, in the 3rd quarter of 2017
at 10.2%. 2016 was the only year where net absorption was lower than net delivery.
Graph 1: Retail Market Performance, Tampa-St. Petersburg Market, 2012-2017(3Q)
450,000 11.7% 11.3% 11.2% 12%
10.5% 10.8%
10.2%
400,000
10%
350,000
300,000 8%
Square Feet
Vacancy Rate
250,000
6%
200,000
150,000 4%
100,000
2%
50,000
0 0%
2012 2013 2014 2015 2016 2017(3Q)
Net Change in Inventory Net Absorption Vacancy Rate
Source: REIS; Kimley-Horn
19
jDowntown Palm Harbor Ӏ Retail Market Study
Clearwater/N. Pinellas Submarket Retail Performance Trends
The Clearwater/N. Pinellas Submarket Submarket, had approximately 9.1 million square feet of multi-
tenant retail space as of the 3rd quarter of 2017. As shown in Table 1, over 4.5 million square feet of space
was completed in the 1980s, making it the most active decade for retail development. The completed
inventory has gone down every decade since the 1980’s. Another 800,000+ square feet of multi-tenant
retail space has been completed since 2000.
Table 1: Inventory by Decade Completed,
Clearwater/N. Pinellas Submarket, 2017 (3Q)
Decade Inv entory % of
Completed ( Sq.F t.) Total
Before 1970 1,820,600 20.0%
1970's 1,183,390 13.0%
1980's 4,551,500 50.0%
1990's 728,240 8.0%
2000's 546,180 6.0%
After 2009 273,090 3.0%
Total 9,103,000 100.0%
Source: REIS;Kimley-Horn
Source: REIS; Kimley-Horn
The total completion and net absorption trends can be seen in Table 2. 2016 saw 407,000 square feet
added to the inventory, which was significantly higher than in any other year analyzed. Net absorption
totaled only 79,000 square feet in other years. 2016 was also the only year where absorption didn’t match
the supply, most likely do to the large influx of product that year. However, the supply was only
underutilized by 55,000 square feet, compared to the 407,000 that had been added that year.
Table 2: Completion and Net Absorption Trends,
Clearwater/N. Pinellas Submarket, 2012 - 2017 (3Q)
Net Change Net ( Ov er) /
Year in Inv entory Absorption Under Supply
2012 0 206,000 206,000
2013 70,000 231,000 161,000
2014 0 43,000 43,000
2015 9,000 267,000 258,000
2016 407,000 352,000 (55,000)
2017(3Q) 0 214,000 214,000
Total 486,000 1,313,000 827,000
Ann. Av g. 97,200 262,600 165,400
Source: REIS;Kimley-Horn
Source: REIS; Kimley-Horn
The end-of-year vacancy rate for retail space in the Clearwater/N. Pinellas Submarket was 11.8% in
2017(3Q). As shown in Graph 2, vacancy rates in the Submarket have steadily declined since 2014, where
they peaked at 14.6%, which was a year of negative net absorption.
20
jDowntown Palm Harbor Ӏ Retail Market Study
Graph 2: Retail Market Performance, Clearwater/N. Pinellas Submarket, 2012 - 2017 (3Q)
300,000 20%
12.4%
250,000 14.6%
13.7% 13.2% 13.2% 15%
Vacancy Rate
200,000 11.8%
150,000 10%
Square Feet
100,000
5%
50,000
0 0%
-50,000
-5%
-100,000
-150,000 -10%
2012 2013 2014 2015 2016 2017(3Q)
Net Change in Inventory Net Absorption Vacancy Rate
Source: REIS; Kimley-Horn
As shown in Graph 3, the Clearwater/N. Pinellas Submarket has followed a similar retail vacancy pattern
when compared to the larger Tampa-St. Petersburg Market, with the exception of 2014, which saw a spike
in vacancy rate in the submarket. Both geographies experienced overall declines between 2012 and
2017(3Q), coupled with a slight uptick in vacancy in 2014 and recovery by 2015. At 3Q 2017, the 11.8%
vacancy rate in the Clearwater/N. Pinellas Submarket was 1.6% higher than the larger market.
Graph 3: Comparison of Vacancy Rate Trends, 2012 – 2017(3Q)
18.0%
16.0% 14.6%
13.7%
13.2% 13.2%
14.0% 12.4%
11.8%
12.0%
Vacancy Rate
10.0% 11.7% 11.3% 11.2% 10.8%
10.5% 10.2%
8.0%
6.0%
Clearwater/N.Pinellas Submarket
4.0%
2.0% Tampa-St. Petersburg-Clearwater MSA
0.0%
2012 2013 2014 2015 2016 2017(3Q)
Source: REIS; Kimley-Horn
Average lease rates for multi-tenant retail spaces in the Submarket increased 9% from $14.51 in 2012 to
$16.07 in 2017(3Q) (Graph 4). The 2017(3Q) average of $16.07 was just slightly higher than the $15.89
for the larger market. The average rents for the Submarket and for the larger market are remarkably
similar over the years analyzed.
21
jDowntown Palm Harbor Ӏ Retail Market Study
Graph 4: Comparison of Rent/Sq.Ft. Trends, 2012 – 2017(3Q)
$16.50
$16.07
$15.87
$16.00
$15.89
Average Rent/Sq.Ft.
$15.50 $15.25 $15.69
$15.00 $14.73 $14.78
$14.51 $15.08
$14.50
$14.62
$14.41
$14.00 $14.28
Clearwater/N.Pinellas Submarket
$13.50
Tampa-St. Petersburg-Clearwater MSA
$13.00
2012 2013 2014 2015 2016 2017(3Q)
Source: REIS; Kimley-Horn
22
jDowntown Palm Harbor Ӏ Retail Market Study
Competitive Retail
Framework
This section outlines the framework of the current retail conditions related to Downtown Palm Harbor. This
includes defining and establishing a trade area, inventorying existing retail shopping centers, and
identifying key retail uses, such as big box stores, grocers, and pharmacies. The retail framework
established in this chapter will be vital piece in creating the foundation for projecting the future retail
demand for the Downtown Palm Harbor area.
Trade Area Map 8: Downtown Palm Harbor Trade Area
The Trade Area for Downtown
Palm Harbor is defined by the
10- minute drive times from the
downtown area, as reported by
ESRI Business Analyst. The Trade
Area is bordered on the west by
the Gulf of Mexico, to the east
generally by Lake Tarpon, to the
north general by the municipal
boundary of Tarpon Springs, and
to the south generally by Main
Street in Dunedin. Major corridors
within the Downtown Palm
Harbor Trade Area include
Alderman Road, Tampa Road,
Curlew Road, and Main Street to
the east and west, and Palm
Harbor Boulevard and US-19 to
the north and west. The trade
area can be seen in Map 8.
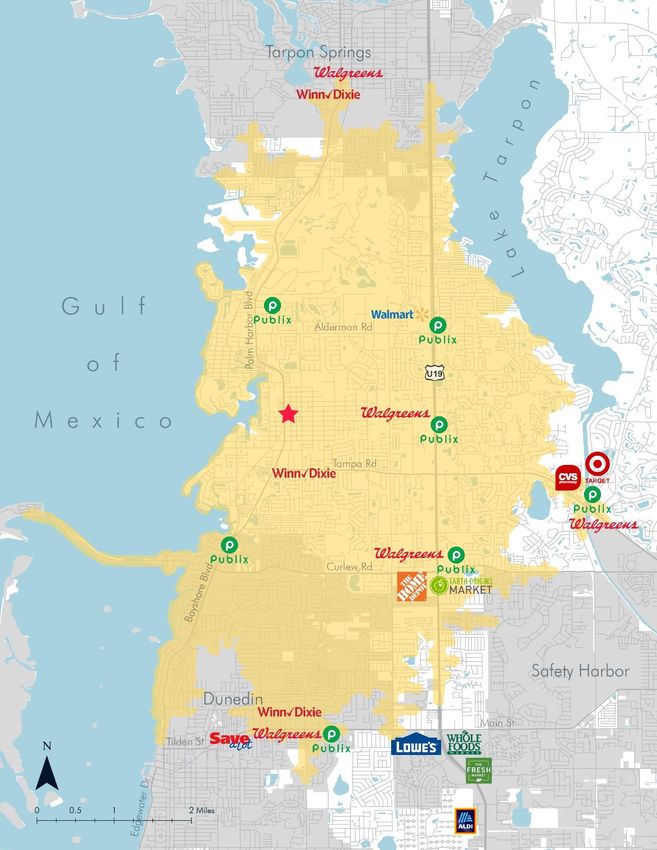
Multi-Tenant
Shopping
Centers
This section profiles competitive
shopping centers in Pinellas
County that are in or very near to the Downtown Palm Harbor Trade Area. There were 26 competitive
multi-tenant shopping centers identified for this analysis (Table 3). The oldest center is the Dunedin Plaza
Shopping Center, located in Dunedin, completed initially in 1969. The newest shopping center is a
community center in Palm Harbor called Coral Landings Shopping center, built originally in 1992. It’s
23
jDowntown Palm Harbor Ӏ Retail Market Study
worth noting that several of these shopping centers may have received renovations in more recent years,
the years below reflect the original build date.
Table 3: Competitive Retail Centers, Pinellas County, 2017
Map Year Leasable Area Vacancy Lease Rate/Sq.F t.
Key Dev elopment Name Address Jurisdiction Center Type Built Total Av ailable Rate Anchor Non- Anchor Key Tenants
Beall's, AMC Theater,
1 Woodlands Square 3130 Tampa Rd Oldsmar Community 1986 298,883 44,832 15.0% $9.75 $19.33 First National Bank
Dicks Sporting Goods,
Homegoods, Dollar
2 Countryside Centre 2547 Countryside Blvd Clearwater Community 1981 244,500 2,445 1.0% $15.29 $27.99 Tree, Party City
3 The Shoppes of Boot Ranch 300 E Lake Rd Palm Harbor Community 1990 229,188 0 0.0% $13.32 $26.29 Target, Publix, CVS
Coral Landings Shopping Publix, Ross Dress for
4 Center 33119 US Highway 19 Palm Harbor Community 1992 145,897 10,505 7.2% $19.33 $24.42 Less, Bealls
Pets and More,
5 East Lake Woodlands 3420 E Lake Rd Palm Harbor Community 1982 143,927 1,151 0.8% $15.21 $28.00 Hallmark
Community Center Subtotal 1,062,395 58,933 5.5% $13.85 $24.70
6 Crystal Beach Plaza 2870 Alt 19 Palm Harbor Neighborhood 1984 109,300 1,749 1.6% $17.32 $24.42 Publix
7 Alderman Plaza 35104 US Highway 19 Palm Harbor Neighborhood 1982 104,000 4,472 4.3% $17.69 $25.45 LA Fitness
Family Fitness, Bingo
8 Causeway Plaza 2650 Bayshore Blvd Dunedin Neighborhood 1968 103,279 0 0.0% $8.50 $10.18 Hall, Dollar General
9 Tarpon Plaza 700 S Pinellas Ave Tarpon Springs Neighborhood 1959 82,000 0 0.0% $9.74 $14.00 Sav-a-Lot, Dollar
10 Granada Plaza 1491 Main St Dunedin Neighborhood 1985 80,550 10,874 13.5% $9.21 $18.02 Publix
Highland Lakes Shopping Michales, Stein Mart,
11 Center 33507 US Highway 19 Palm Harbor Neighborhood 1979 79,094 2,452 3.1% $9.88 $22.00 Hallmark
12 Caladesi Shopping Center 902 Curlew Rd Dunedin Neighborhood 1974 73,996 4,662 6.3% $9.10 $17.00 Publix
13 Independence Square 1296 County Rd 1 Dunedin Neighborhood 1969 67,000 1,675 2.5% $7.41 $12.00 Winn-Dixie, CVS
Weathersfield Commons
14 Shopping Center 1681 Main St Dunedin Neighborhood 1989 64,138 21,101 32.9% $15.58 $17.25 Sweetbay Supermarket
Dunedin Plaza Shopping
15 Center 934 Patricia Ave Dunedin Neighborhood 1965 60,000 840 1.4% $8.52 $12.17 Sav-a-Lot
16 Sweet Bay Shopping Center 1326 Tampa Rd Palm Harbor Neighborhood 1986 56,056 0 0.0% $9.77 $14.23 Winn-Dixie
Harrs Surf Turf,
17 Shoppes at Cloverplace 3025 Tampa Rd Palm Harbor Neighborhood 1986 54,163 9,370 17.3% - $16.29 Positanos Restaurant
18 Palm Lakes II 32730 US Highway 19 Palm Harbor Neighborhood 1979 45,765 23,752 51.9% $9.81 $11.13
19 Sabal Ridge 33871 US Highway 19 Palm Harbor Neighborhood 1985 45,600 3,967 8.7% - $14.75 Carabbas, Blood One
20 Tarpon Olympic Plaza 40174 US Highway 19 Tarpon Springs Neighborhood 1988 45,500 9,191 20.2% - $10.21
21 Palm Harbor Shops 35801 US Highway 19 Palm Harbor Neighborhood 1986 42,684 10,927 25.6% - $12.75 Party City
22 Columbia Plaza 2340 State Rd 580 Clearwater Neighborhood 1981 23,000 3,427 14.9% - $16.77
23 Hodusa Plaza 28780 US Highway 19 Clearwater Neighborhood 1987 21,000 2,268 10.8% - $12.86 Skyline Chili
24 Curlew Plaza 30602 US Highway 19 Palm Harbor Neighborhood 1975 10,979 2,536 23.1% - $14.26
25 Community Plaza 2109 Main St Dunedin Neighborhood 1976 10,900 0 0.0% - $11.92
26 Country Woods Plaza 823 County Road 1 Palm Harbor Neighborhood 1986 10,600 1,813 17.1% - $11.29 Pizza Hut
Neighborhood Center Subtotal 1,189,604 115,076 9.7% $11.47 $16.42
Total/Av erage 2,251,999 174,010 7.7% $12.59 $20.33
Source: Kimley-Horn; REIS; LoopNet; Local Brokerage Firms
The 26 competitive centers have over 2.2 million square feet of multi-tenant retail space and range in size
from 10,000 to almost 300,000 square feet. The smaller centers with less than 50,000 square feet of
space are typically unanchored, offering only in-line spaces. The aggregate vacancy rate is 7.7%, with the
largest vacancies existing at Woodlands Square (44,832 square feet available) and Palm Lakes II (23,752
square feet available). Map 9 shows the shopping centers near the Trade Area and can be found on the
following page. The map key in Table 3 refers to the numbers listed on Map 9.
24
jYou can also read