Specialty Minerals and Metals
←
→
Page content transcription
If your browser does not render page correctly, please read the page content below
Specialty Minerals and Metals

                                                           Reg Spencer | Analyst | Canaccord Genuity (Australia) Ltd. | reg.spencer@canaccord.com.au | +61.2.9263.2701
    Australian Equity Research                             Larry Hill | Associate Analyst | Canaccord Genuity (Australia) Ltd. | larry.hill@canaccord.com.au | +61.2.9263.2745
    20 November 2016

                                                           Industry Overview

                                                           A flake's chance in cell: quantifying graphite
                                                           demand
                                                           As a follow up to Start me up - EV's and grid storage to drive lithium demand (18
                                                           May'16), in this report, we attempt to quantify the impact on demand for graphite from
                                                           the rapidly growing Lithium-ion battery ("Li-B") sector.
                                                           A major increase in installed Li-B capacity to 2025 is anticipated to drive a major
                                                           increase in demand for graphite: Based on our modelled growth in the Li-B market (and
                                                           certain assumptions for penetration rates for various battery chemistries), we estimate
                                                           total demand for graphite (natural + synthetic) from Li-B’s to increase from 140kt in
                                                           2015, to +1Mt in 2025, representing a CAGR of 23%.
                                                           However, demand growth for natural flake graphite in Li-Bs is reliant on a shift by
                                                           end users away from synthetic graphite: Our research suggests that 60% of Li-B anode
                                                           material is currently sourced from synthetic graphite. While the current preference for
                                                           synthetic appears driven by requirements for consistent purity and lower quality Chinese
                                                           graphite dominating global mined supply, cost savings of using flake versus synthetic
                                                           represent a significant opportunity in our view. If natural graphite can achieve and
                                                           maintain 60% market penetration by 2020, we estimate that annual demand could
                                                           increase by +660% to 792ktpa by 2025.
                                                           Traditional markets represent the largest market opportunity for natural graphite in
                                                           the medium term: Traditional graphite markets (ex-Li-Bs) accounted for an estimated
                                                           86% of demand for natural graphite in 2015. Looking forward, we see an opportunity for
                                                           natural flake to capture market share from synthetic/alternative carbon sources due to
                                                           improved product quality and cost advantages. We estimate that by 2020, demand for
                                                           flake graphite from these markets could exceed 776ktpa, representing a market share of
                                                           74% (vs Li-Bs at only 26%).
                                                           Everyone wants exposure to the Li-B market - the fact is the market isn't that
                                                           large...yet: While demand could increase significantly over the coming decade, this is
                                                           offset by the potential for a significant supply side (ex-China) response. We estimate
                                                           flake graphite demand from the Li-B market at 276kt by 2020, versus potential
                                                           production from ASX-listed graphite companies targeting the battery market of 440kt.
                                                           Longer term (by 2025), we estimate that global mined flake graphite supply would need
                                                           to increase by +350% to 1.7Mtpa to satisfy forecast demand from the Li-B market and
                                                           traditional applications.
                                                           Graphite prices: Our forecasts for a benchmark (95% TGC) graphite product call for
                                                           average "basket" prices of US$770-US$926/t between 2016-2025, compared to current
                                                           basket prices of US$750-850/t. We note that prices have fallen by 50-60% from their
                                                           highs in 2012, despite a ~40% reduction in mined output and evidence of increasing
                                                           demand from the both the Li-B and traditional markets.
                                                           CGAu Graphite coverage:
                                                           Syrah Resources (SYR:ASX | Target: A$5.30 from A$6.45 | Rating: SPEC BUY).

Canaccord Genuity is the global capital markets group of Canaccord Genuity Group Inc. (CF : TSX)
The recommendations and opinions expressed in this research report accurately reflect the research analyst's personal, independent and objective views about any and all
the companies and securities that are the subject of this report discussed herein.

For important information, please see the Important Disclosures beginning on page 65 of this document.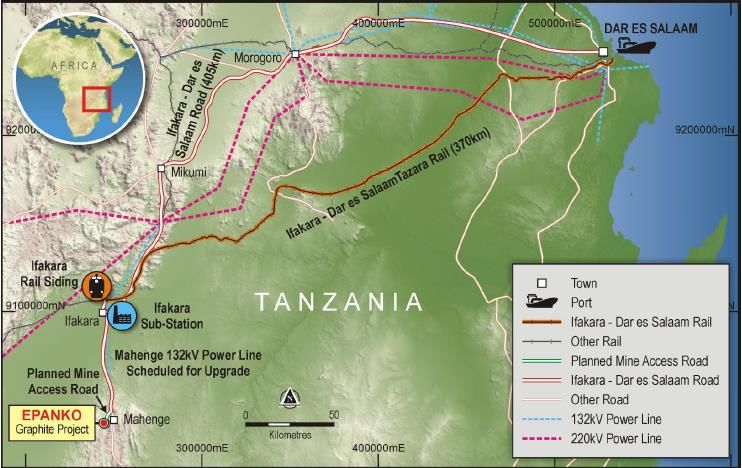
Specialty Minerals and Metals
Industry Overview
Investment Summary
Graphite is an essential raw material in Li-Bs – overall graphite demand could grow by
+730% to 2025…
Based on our research in Start me up – electric vehicles and grid storage to drive
lithium demand (18 May’16), we estimate that rapidly increasing sales of Electric
Vehicles (EVs) and continued development of the grid storage industry will drive a
+200% increase in installed Li-B manufacturing capacity to +250GWh by 2020.
Our research indicates an average “battery grade” graphite consumption ratio of
0.92kg/1kWh of Li-B energy capacity dependent on cathode chemistry used.
Based on our modelled growth in the Li-B market (and certain assumptions for
penetration rates for various battery chemistries), we estimate demand for
graphite (synthetic and flake) feedstock from Li-B’s to increase from 140kt in
2015, to +1Mt in 2025, representing a CAGR of 23%.
…but natural flake graphite has competition – opportunity for graphite miners in
battery anode materials is reliant upon a significant shift by end users away from
synthetic
Our research suggests that ~60% of Li-B anode material is sourced from synthetic
graphite, with the current preference for synthetic driven by a desire for consistent
product purity (essential in determining Li-B performance) and low quality Chinese
flake graphite dominating global mined supply. We understand that only 84kt
(from a total market of ~650kt) of natural graphite was used in Li-Bs in 2015.
That said, cost savings associated with Li-B anode material derived from flake
(versus higher priced synthetic) represent a material market opportunity in our
view (Li-B manufacturers continue to target aggressive reductions in battery
costs). If natural flake graphite can achieve a +5% YoY increase in penetration
from current levels of ~40%, to 60% from 2020, annual demand could increase to
792ktpa by 2025, giving natural flake graphite for Li-Bs a 39% share of what
could then be a ~2Mtpa global flake graphite market.
Traditional markets (as dull as they are…) still represent the largest market
opportunity for natural flake graphite in the medium term
Traditional markets for natural graphite comprise recarburisers (carbon additives
used in electric arc furnace [EAF] steel production), foundries, refractories and
other industrial applications (i.e. lubricants, friction products). Together, these
markets accounted for an estimated 86% (+500kt) of demand for natural graphite
in 2015. This compares with a total market share (across synthetic and natural) of
~90% or, 1.7Mt.
Key considerations for natural graphite to capture market share from synthetic
include consistent product purity and competitive costs. That said, our research
suggests a significant market opportunity for increased use of natural flake
graphite through a shift to increasing crude steel production from EAFs, and
displacement of lower quality amorphous graphite in the cast iron market. By
2020, we estimate that demand for natural graphite from traditional markets
could exceed 770kt (versus Li-Bs at ~275kt).
2
20 November 2016 2
Specialty Minerals and Metals
Industry Overview
Figure 1: Natural flake graphite – breakdown of forecast market share
100%
90%
80%
70% 31% 34% 36% 39%
22% 26% 29%
Market share
20% 21%
60% 20%
21%
50%
40%
30%
20% 38% 39% 40% 40% 41% 41% 40%
30% 35%
10% 21% 24%
0%
2015 2016 2017 2018 2019 2020 2021 2022 2023 2024 2025
Recarburisers Foundries Batteries Industrials Lubricants Other
Source: Company Reports, Canaccord Genuity estimates
The elephant in an already crowded room – everyone wants exposure to Li-Bs but the
market isn’t that large…yet
We note a number of aspiring graphite producers seeking to target the Li-B
market for their production plans – however, based on our estimates of possible
future demand, only 275kt of natural flake will be required by the Li-B sector by
2020. This compares with production from existing and potential new supply (as
per announced project timetables from various ASX-listed companies) of ~440kt.
Figure 2: Potential supply vs demand (Natural graphite)
2200
2000
1800
Natrual Graphite (kt)
1600
1400
1200
1000
800
600
400
200
0
2017 2018 2019 2020 2021 2022 2023 2024 2025
Fines 75um (200mesh) 150um (100mesh) 300um (50mesh)
Balama Existing Flake Existing Amorp Demand
Source: Company Reports, Canaccord Genuity estimates
We believe the most advanced of this group of companies is Syrah Resources
(SYR:ASX | Rated SPEC BUY), which plan to produce ~340ktpa of graphite
concentrate with first production expected in H2’17. Balama will be the largest
project of its kind ever built, and once at full production, will produce an average
of 25% of global mined output between 2017 and 2020.
In the longer term, we anticipate that the growth of the Li-B sector and potential
for natural flake to capture increased market share in traditional applications
could see demand increase sufficiently to support much of the planned
production being targeted by ASX-listed graphite companies. Our longer term
expectations are for the natural flake graphite market to increase in size by
+100% to ~800kt by 2020, and to +1.7Mt by 2025, representing a CAGR of 16%.
3
20 November 2016 3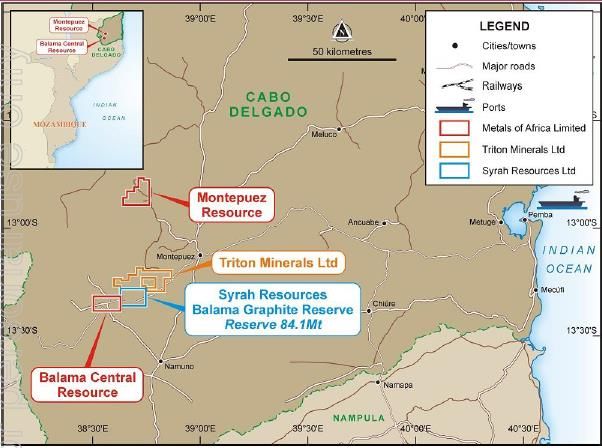
Specialty Minerals and Metals
Industry Overview
Unusual pricing environment – natural graphite prices falling vis-à-vis supply
reductions and rising demand
We have revised our graphite pricing assumptions across the various product size
fractions (Figure 3), which now calls for an average “basket price” between 2016-
2025 of US$770/t – US$926/t. Revisions represent an average 22% reduction
versus previous basket price assumptions.
In Figure 4, we highlight an unusual pricing dynamic currently evident in the flake
graphite market – despite global (i.e. Chinese) production falling by ~40%, and
evidence of increasing demand from both the Li-B sector and traditional markets,
graphite prices have fallen by 50-60%, suggesting that lower priced substitutes
are capturing market share.
Figure 3: Natural flake graphite basket pricing revisions Figure 4: Historical natural graphite production vs weighted avg
basket price
$1,200 1200
Av Weighted Basket Price (US$/t) FOB
Average Graphite Price (US$/t)
2400
Est. Graphite Production (kt)
$1,000 1000
2000
$800 800
1600
600
$600 1200
400 800
$400
200 400
$200
0 0
$0 '04 '05 '06 '07 '08 '09 '10 '11 '12 '13 '14 '15
2016 2017 2018 2019 2020 2021 2022 2023 2024 2025 Chinese Amorphous Chinese Flake
ROW Natural Weighted Price
New CGe Old CGe
Source: Company Reports, Canaccord Genuity estimates Source: Industrial Minerals, Benchmark Minerals
CG Graphite Coverage
Syrah Resources (SYR:ASX | Target: A$5.30 from A$6.45 | Rating: SPECULATIVE
BUY)
Appendix I – ASX-listed graphite company overview
Black Rock Mining (BTR:ASX | Not rated) – Mahnege Project, Tanzania
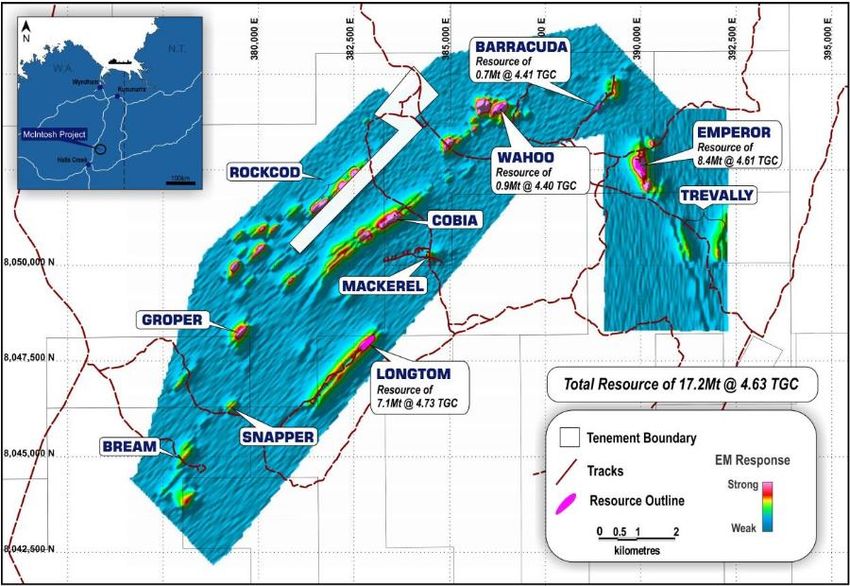
Hexagon Resources (HXG:ASX | Not rated) – McIntosh Project, Western Australia
Kibaran Resources (KNL:ASX | Not rated) – Epanko Project, Tanzania
Magnis Resources (MNS:ASX | Not rated) – Nachu Project, Tanzania
Metals of Africa (MTA:ASX | Not rated) – Montepuez Project, Mozambique
Volt Resources (VRC:ASX | Not rated) – Namangale Project, Tanzania
4
20 November 2016 4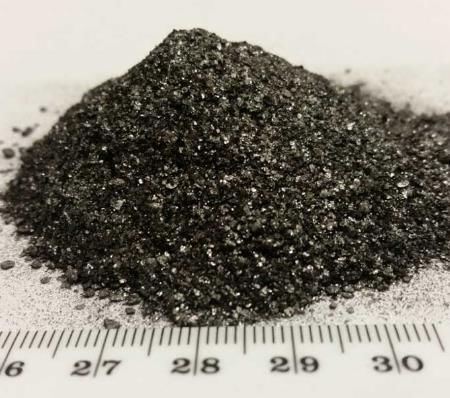
Specialty Minerals and Metals
                                                                                                                                   Industry Overview

                   Contents
                   Investment Summary ................................................................................................. 2
                   Contents ..................................................................................................................... 5
                   Graphite Fundamentals .............................................................................................. 7
                   WHAT IS GRAPHITE? ....................................................................................................... 7
                   SYNTHETIC VS NATURAL ................................................................................................. 7
                   NATURAL GRAPHITE – MAKING SENSE OF GRADES, FLAKE SIZE, AND PURITY ......... 9
                   GLOBAL RESOURCES .................................................................................................... 11
                   Market supply ........................................................................................................... 12
                   NATURAL GRAPHITE PRODUCTION DOMINATED BY CHINA ........................................ 12
                   OTHER KEY PRODUCTION SOURCES ........................................................................... 12
                   PROJECTED SUPPLY - CHINA’S DOMINANCE TO BE CHALLENGED BY HIGHER QUALITY
                     RESOURCES OUTISDE CHINA?................................................................................ 12
                   PROJECTED SUPPLY ...................................................................................................... 13
                   OTHER KEY CONSIDERATIONS ..................................................................................... 15
                   Market demand - overview ....................................................................................... 17
                   TRADITIONAL MARKETS THE MAIN SOURCE OF DEMAND; DEMAND GROWING FOR
                      BATTERIES BUT MARKET REMAINS COMPARATIVELY SMALL .............................. 17
                   SYNTHETIC DOMINATES BUT OPPORTUNITY FOR NATURAL TO INCREASE MARKET
                      SHARE ...................................................................................................................... 17
                   Demand analysis - Lithium-ion batteries .................................................................. 18
                   LITHIUM ION (Li-B’s) BATTERIES –A RECAP ................................................................. 18
                   SPHERICAL GRAPHITE – AN OVERVIEW ....................................................................... 19
                   SYNTHETIC VS NATURAL GRAPHITE ANODES – NATURAL NOW COMPETING ON A
                      PERFORMANCE BASIS ............................................................................................. 21
                   HOW MUCH GRAPHITE GOES INTO A LI-B? .................................................................. 22
                   QUANTIFYING GRAPHITE DEMAND FROM LI-B’s ......................................................... 23
                   Demand analysis – traditional markets ................................................................... 26
                   RECARBURISERS – AN OPPORTUNITY FOR NATURAL FLAKE BUT MARKET DOMINATED
                     BY ALTERNATIVE CARBONS .................................................................................... 26
                   CAST IRON RECARBURISERS........................................................................................ 29
                   REPLACING LOW QUALITY AMORPHOUS GRAPHITE IN TRADITIONAL MARKETS ...... 30
                   REPLACING LOW QUALITY INDUSTRIAL ANODES IN ALUMINUM INDUSTRY ............. 31
                   OTHER INDUSTRIAL MARKETS ..................................................................................... 32
                   Other graphite product markets ............................................................................... 33
                   EXPANDABLE GRAPHITE (50kt produced in 2015). .................................................... 33
                   Natural graphite demand – putting it all together .................................................... 35

                   5
20 November 2016                                                                                                                                        5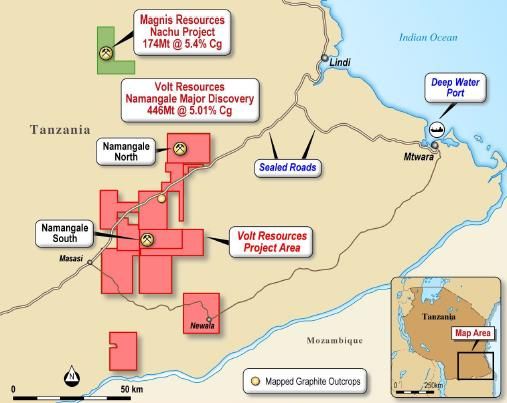
Specialty Minerals and Metals
                                                                                                                             Industry Overview

                   Supply vs Demand .................................................................................................... 37
                   SYR: THE ELEPHANT IN THE ROOM - SUPPLY COULD OUTPACE DEMAND TO 2020 37
                   EVERYONE WANTS EXPOSURE TO THE LI-B THEMATIC – FACT OF THE MATTER IS
                      DEMAND IS NOT YET THAT LARGE ......................................................................... 38
                   Key forecast risks ..................................................................................................... 39
                   Product Pricing & Forecasts ..................................................................................... 40
                   NATURAL FLAKE GRAPHITE PRICES STILL FALLING DESPITE LOWER SUPPLY AND
                     INCREASING DEMAND............................................................................................. 40
                   FALLING FEEDSTOCK COSTS FOR SYNTHETIC IMPACTING NATURAL FLAKE PRICES?41
                   OTHER PRICING INFLUENCES ...................................................................................... 42
                   ASX Listed Graphite Companies – Peer Comparison ............................................... 43
                   Company Updates .................................................................................................... 46
                   Syrah Resources Ltd (SYR:ASX) ................................................................................ 47
                   Appendix I - ASX Listed Graphite Companies ............................................................ 49
                   Black Rock Mining Ltd (BKT:ASX) ............................................................................. 50
                   Hexagon Resources Ltd (HXG:ASX)........................................................................... 53
                   Kibaran Resources Ltd (KNL:ASX) ............................................................................ 55
                   Magnis Resources Ltd (MNS:ASX) ............................................................................ 57
                   Metals of Africa Ltd (MTA:ASX) ................................................................................. 60
                   Volt Resources Ltd (VRC:ASX) ................................................................................... 62

                   6
20 November 2016                                                                                                                                 6
Specialty Minerals and Metals
Industry Overview
Graphite Fundamentals
WHAT IS GRAPHITE?
Graphite is the hexagonal crystalline form of carbon and occurs naturally as
disseminated crystal flakes in high-grade metamorphic rocks, as veins, and as
microcrystalline ‘amorphous’ graphite associated with metamorphosed coal
seams. Graphite sits in the middle phase of the three forms of carbon between
coal (amorphous carbon) at the lower end of carbon content, and diamond at the
higher end.
Graphite has many properties which lends itself to a number of different uses
across a broad range of product markets. These properties include lubrication,
reactivity, strength and resilience to high temperatures (for use in refractories).
More significantly, graphite has conductive properties (known as reversible
capacity) which makes it suitable for use as an anode material within Li-ion
batteries. Graphite is consumed as a number of different product types and can
be derived from both Natural and Synthetic sources. ‘
SYNTHETIC VS NATURAL
The global graphite market can be broken down into its two key primary sources,
Synthetic, and Natural. Based on an estimated total market size (2015) of
~1.85Mtpa, synthetic graphite represents ~65% of all graphite
production/consumption, with natural graphite comprising the balance of
~650ktpa (Figure 5).
Figure 5: "Family tree" of graphite products and estimated market share in 2015
Primary
0.48 Mtpa
Synthetic
1.2 Mtpa
Secondary
0.72 Mtpa
Graphite
Amorphous
Expandable
0.26 Mtpa
Natural Flake
Spherical
0.65 Mtpa 0.38 Mtpa
Vein
Graphene
Specialty Minerals and Metals
Industry Overview
charge in an anaerobic (oxygen depleted) environment. This simulates the
“mesophase” melting that occurs in the geological formation of natural graphite.
Within this intermediate process the carbon bonds within the lattice structure re-
orientate and cure to replicate natural graphite. The duration for this process can
be as long as 2-3 weeks due to controlled cooling requirements. Synthetic
graphite typically has fixed carbon levels of >99%, volatiles
Specialty Minerals and Metals
Industry Overview
duration) that were present as the deposit formed, gangue materials such as
ash, iron and sulphides can be ‘intercalated’ within the graphite flake
structure, which affects overall product purity. This impacts overall processing
costs (mostly through flotation reagent consumption) and the ability for
potential producers to place their product in higher end applications such as
feedstock to the lithium-ion battery sector.
Concentrate purities for further conversion to spherical graphite are typically
+95% TGC with the level of impurity intercalation a key determinant in the
costly and hazardous requirement for hydrofluoric acid leaching prior to
coating for a broad range of applications (see Spherical Graphite section
below). Our view is this will be a key determinant in a project’s ability to
provide reliable, comparable product that can displace synthetic graphite as
an anode material.
Vein Graphite (US$1,500/t) offer attractive project
features the difficulties of extraction through shallow shafts (water ingress,
ventilation, mining rate) present as likely barriers to any major increase to
supply over the short/medium term.
NATURAL GRAPHITE – MAKING SENSE OF GRADES, FLAKE SIZE, AND PURITY
In situ graphite content of an ore deposit is typically quoted as a percentage of
total graphitic carbon (%TGC). However, unlike most other metals and mineral
commodities, tonnes (size) and grades are not the only considerations when
assessing what constitutes an economic deposit.
Flake size and product purity are also other key considerations, which are a
geological feature inherent to the deformation of carbonaceous sediments such
as shales and sandstones within the deposit.
Ore bodies with higher in-situ grades (+10% TGC) such as those found in
Mozambique are usually associated with a finer flake distribution (i.e 180µm) are typical of those found in the
Paleoproterozoic Usagaran Belt within Tanzania, East Africa, albeit at a lower in-
situ grade (300 >48
Large >180 >80
Medium >106 >150
Small >75 >200
Fine
Specialty Minerals and Metals
Industry Overview
stages are likely as presented in Figure 11, to increase product purity for natural
flake ore bodies with a greater proportion of fine flake.
Figure 10: Graphite flake size and purity relationship
99.5% Mahenge
Concentrate Purity
99.0% Nachu
98.5%
(%TGC)
98.0% McIntosh
97.5% Balama
97.0%
96.5% Montepeuz Epanko
Namangale
96.0%
95.5%
0 50 100 150 200 250
Median Flake Size (um)
Source: Company Reports
Natural Graphite production methods
Mining of natural flake graphite is relatively straightforward through the extraction
of ore from sedimentary hosted or metamorphic (schist) deposits. Graphite is
quite friable (i.e. free digging) in nature with deposits typically requiring minimal
blasting.
Dependent on the morphology and weathering within the deposit, flake graphite
can be quite easily liberated from gangue (usually quartz, silica and feldspar)
using conventional crush>grind>float processes as indicated in Figure 11 below.
The end product is a high purity (+95% TGC) graphite concentrate.
The effect of head grade, expressed as % TGC is most apparent when determining
flotation circuit configuration and the quantity of material that will report to the
concentrate product (mass pull). Graphite is well suited to flotation due to being a
hydrophobic mineral (concentrate purities of +95% TGC can generally be achieved
without the need for reagents beyond high quality water and air).
One of the key features to assist aspiring graphite producers to displace current
natural graphite supply is achieving a concentrate purity of +97% TGC. Depending
on the metamorphic conditions (heat, pressure, duration) that were present as the
deposit was formed, gangue materials such as ash, iron and sulphides can be
‘intercalated’ within the graphite flake structure and can’t be removed without the
use of thermal/chemical purification.
10
20 November 2016 10Specialty Minerals and Metals
Industry Overview
Figure 11: Standard Processing Flowsheet for Natural Flake Graphite concentrate production
Source: Kibaran Resources
GLOBAL RESOURCES
The USGS estimates known global resources at +800Mt of recoverable graphite.
Figure 12 below shows East Africa to host the majority of known global graphite
resources, predominantly the large scale deposits in Mozambique.
Figure 12: Global resources by country (contained graphite)
45
40
Contained te Resources (Mt)
35
30
Mozambique x10
25
Madagascar
20
Tanzania
Australia
Sweden
15
USA
Malawi
Canada
10
Brazil
5
0
Source: SNL Mining
11
20 November 2016 11Specialty Minerals and Metals
Industry Overview
Market supply
NATURAL GRAPHITE PRODUCTION DOMINATED BY CHINA
Due to the opaque nature of the industry, updated production data is difficult to
obtain, but it is estimated that global flake graphite production was ~650kt in
2015. This was dominated by Chinese domestic production (~76%, Figure 13)
from operations mainly located in the Shandong, Heilongjiang and Jixi regions of
China. These operations are usually small in size and often prone to poor
environmental practices.
According to Benchmark Minerals (Figure 14), global production is estimated to
have decreased by 45% since 2013, mainly due to the supply of marginal, lower
quality Chinese amorphous production coming under pressure from influences
such as increasing government intervention (i.e. closure of mines), and plateauing
of demand from Chinese steel production.
Figure 13: Global flake graphite production by country (% global market at Figure 14: Historical flake graphite production
650kt)
Turkey, 5% Other, 5% 1200
Average Graphite Price (US$/t)
2400
Canada, 2%
Est. Graphite Production (kt)
1000
India, 4% 2000
China -
800
Amorphorus, 1600
Brazil, 9% 40%
600
1200
400 800
200 400
0 0
China - '04 '05 '06 '07 '08 '09 '10 '11 '12 '13 '14 '15
Flake, 36%
Chinese Amorphous Chinese Flake
ROW Natural Weighted Price
Source: USGS, Company Reports, Canaccord Genuity estimates Source: Industrial Minerals, USGS, Benchmark Minerals
OTHER KEY PRODUCTION SOURCES
Brazil: Two main companies dominate production - Nacional de Grafite (~70ktpa)
and Grafite de Brasil (~20ktpa). Brazil is endowed with ~2.5Mt reserves of
graphite mostly located in the province of Minas Gerais. Brazilian production is
unlikely to increase materially in the future (i.e. compete with other natural flake
sources) owing to the poor grade (Specialty Minerals and Metals
Industry Overview
Figure 15: China Natural Graphite production 2012A, 2015E Figure 16: Projected China Natural Graphite production
Operating 2012 2015E 500
Nautral Graphite Production (kt)
Province Type Mines Production Capacity (ktpa) Production
450
Hunan Amorphous 1 400 510 260
400
Heilongjiang Flake 9 170 280
Henan Flake 7 70 160 350
Shandong Flake 7 50 90 300
Shanxi Flake 2 30 60 240 250
Inner Mongolia Flake 2 30 54 200
Hubei Flake 2 22 22 150
Hebei Flake 1 8 10
100
Total 780 1186 500
50
0
2016 2017 2018 2019 2020 2021 2022 2023 2024 2025
China - Amorphous China - Flake
Source: Industrial Minerals, Roskill Source: Industrial Minerals, Canaccord Genuity Estimates
PROJECTED SUPPLY
Our research indicates that there are +20 natural flake graphite projects globally
(ex-China) which have had various levels of project feasibility completed on them
in the last 4 years (Figure 17). The largest and most advanced of these is Syrah
Resources’ 340ktpa Balama project, located in Mozambique, which is currently
anticipated to achieve first production in mid’17.
Between them, these projects represent a potential +1.7Mtpa of natural graphite
production (versus 2015 global production of ~650ktpa), requiring in excess of
US$2.6bn in capital.
Figure 17: Global development projects
Market Cap
($m Capital Cost Production
Study Date Type Property Country Reporting Company Ticker AUD/CAD) (US$m) LOM (ktpa)
29/05/15 DFS Balama Mozambique Syrah Resources Ltd.** SYR-AU 892 138 340
24/11/14 PEA Nicanda Hill Mozambique Triton Minerals TON-AU 33 110 300
31/03/16 DFS Nachu Tanzania Magnis Resources Ltd.* MNS-AU 272 269 240
01/09/15 PEA Duwi Malawi Sovereign Metals Ltd. SVM-AU 25 112 111
10/02/16 PEA Montepuez Mozambique Metals of Africa Ltd.* MTA-AU 42 166 100
02/12/15 PEA Oakdale Australia Oakdale Resources Ltd. OAR-AU 7 48 95
23/11/15 PFS Chilalo Tanzania Graphex Mining GPX-AU 18 74 69
02/06/15 DFS Uley Australia Valence Industries Ltd. VXL-AU 23 50 64
06/02/15 DFS Molo Madagascar Energizer Resources Inc. EGZ-CA 31 188 53
22/03/16 PEA Mahenge North Tanzania Black Rock Mining Ltd.* BKT-AU 45 57 52
25/09/15 DFS Lac Gueret Canada Mason Graphite Inc. LLG-CA 151 166 52
15/04/15 PEA McIntosh Australia Hexagon Resources Ltd.* HXG-AU 66 123 50
22/06/16 PEA Matawinie Canada Nouveau Monde Mining NOU-CA 17 144 50
08/08/14 DFS Lac Knife Canada Focus Graphite Inc. FMS-CA 12 166 44
24/06/14 PEA Bissett Creek Canada Northern Graphite Corp. NGC-CA 13 134 44
23/07/15 DFS Epanko Tanzania Kibaran Resources Ltd.* KNL-AU 41 78 44
01/06/15 PEA Albany Canada Zenyatta Ventures Ltd. ZEN-CA 54 411 30
27/11/15 PEA Coosa USA Alabama Graphite Corp. ALP-CA 15 43 15
19/09/16 PEA Campoona Australia Archer Exploration Ltd. AXE-AU 8 36 12
04/03/16 PEA Miller Canada Canada Carbon Inc. CCB-CA 25 44 2
12/10/16 Pre-PFS Namangale Tanzania Volt Resources* VRC-AU 66 TBC Q4'16 TBC Q4'16
TOTAL 1790 2558 1766
*See
Source: SNL Appendix
Mining; * See 1 for company
Appendix overview
1 for company overview ** See company update section
**See company update section
13
20 November 2016 13Specialty Minerals and Metals
Industry Overview
In our view, the viability of any new natural graphite projects will be largely
determined by the ability for any project’s production to disrupt markets currently
supplied by inferior amorphous graphite and pet coke products. This in itself will
be a function of product purity and costs for the end user.
Assuming new natural production can displace alternatives such as synthetic
graphite and products from the alternative carbons market, Figure 18 below
illustrates a potential (CGe) supply curve for the natural graphite market. This
sees production grow from ~650ktpa to 2Mtpa by 2025. Within this, we highlight
SYR:ASX’s Balama project, which is expected to be the largest of its kind in the
world once in production, producing an average of 25% of total global mine supply
between 2017 and 2020.
Key underlying assumptions include:
Falling Chinese production on account of inferior product quality versus
potential ex-China production
No major change to existing baseline production levels from outside China
From 2020, new supply is brought on in line with rising demand (see Market
Demand), with the sequence with which new projects are brought on line
determined by a ranking of individual project characteristics as detailed
below.
Figure 18: Forecast (CGe) potential supply curve
2200
2000
1800
1600
Natrual Graphite (kt)
1400
1200
1000
800
600
400
200
0
2017 2018 2019 2020 2021 2022 2023 2024 2025
Fines 75um (200mesh) 150um (100mesh) 300um (50mesh) Balama Existing Flake Existing Amorp
Source: Company Reports, Canaccord Genuity estimates
In assessing when new natural graphite supply is brought on-line, we have looked
at the following key project characteristics:
Deposit Size: we have considered only projects of meaningful size (>~1.0Mt of
contained graphite; Measured and Indicated category). Large deposit size
ensures economics of scale which will assist with placing production at the
lower end of the cost curve (this is key when attempting to displace
incumbent Chinese production).
Location: sovereign, legal, financing, logistics risk
Product Purity/Size Distribution: This is a key consideration as it will ultimately
dictate the operating cost of downstream purification for higher end
14
20 November 2016 14Specialty Minerals and Metals
Industry Overview
applications such as spherical graphite for lithium-ion batteries. In the advent
of an oversupplied market it is our view that products with higher
specifications will be at a distinct competitive advantage with regard to end
user requirements.
Offtake agreements: we consider binding agreements as key in helping attract
both equity and debt finance for new projects.
Stage of development: All other things being equal, the more advanced (i.e.
DFS vs PFS), the sooner the project could be developed.
Capital costs: This considers financing requirements, balance sheet and
quantum of capital expenditure. We estimate that global capital requirements
exceed combined market capitalisation by ~1.5x. With traditional project
finance a rarity in the natural graphite sector, a projects capex/market cap
ratio is a key determinant in the project being able to secure development
funding.
OTHER KEY CONSIDERATIONS
Battery anode supply chain
It is well acknowledged that the lithium ion battery industry contains a labyrinthine
array of suppliers and customers all featuring differing levels of integration along
the supply chain (see Figure 19). This is even more apparent within graphite
where substitute products (natural vs synthetic), additives (silicon influence) and
cathode chemistry (metal oxide blend) all influence the ultimate end use objective
(discharge performance vs safety aspects).
Figure 19: Anode Supply Chain
Source: Washington Post, Canaccord Genuity
Due to the critical performance that the anode plays relative to its low input cost
(~5% of total battery cost in US$/kWh terms) we view that the transition to natural
flake graphite will be progressive and have assumed this to peak at 60% of anode
material by 2020.
We note with interest the challenge for most ASX listed graphite developers to
progress product offtakes to binding status. We view that the recent period of
lowering feedstock prices for synthetic graphite have meant that anode
manufacturers are more willing to take time to qualify potential natural graphite
feedstock rather than commit to quantities and prices from one supplier.
15
20 November 2016 15Specialty Minerals and Metals
Industry Overview
Figure 20: Selected ASX Graphite Companies Offtake/Project Status.
400
Annual Flake Production (ktpa)
350
Construct
300
250
200
BFS
150
Pre-PFS DFS Pre-PFS
100
BFS PFS
50
0
SYR MNS HXG KNL MTA BKT VRC
Binding Internal Spherical Other Remainder
Source: Company Reports, Canaccord Genuity
In addition while the economics of integrating downstream to produce spherical
graphite are compelling (our SYR estimates indicate an un-risked 63% EBITDA
margin) we note that internalizing this capability is likely to prolong the product
qualification process which in turn could further delay securing offtake.
Market demand - overview
Key product markets for the graphite (synthetic and natural) market include:
Recarburisers – carbon additives used in steel and cast iron production as a
hardening agent
Foundries – production of metal castings (primarily cast iron)
Refractories – materials used in linings for furnaces, kilns and reactors
Lithium-ion batteries – use as an anode material
Other industrial markets - these include friction products (carbon brushes,
brake pads and hard metals) which utilize graphite’s superior wear properties,
lubricants, and other applications including metallurgical powders, foils and
gaskets.
Figure 21: Key product markets – synthetic vs natural graphite
Graphite
Synthetic Natural
Electrodes for
Flake Amorphous Vein
EAF’s
Recarburisers Recarburisers Refractories Friction products
Friction products Foundries Friction products Other
Batteries Batteries Foundries
Other Other
Source: Company Reports, Canaccord Genuity
16
20 November 2016 16Specialty Minerals and Metals
Industry Overview
TRADITIONAL MARKETS THE MAIN SOURCE OF DEMAND; DEMAND GROWING FOR
BATTERIES BUT MARKET REMAINS COMPARATIVELY SMALL
It is estimated that carbon additives (recarburisers), foundries and refractories
(i.e. traditional carbon market) dominate demand for both synthetic and natural
graphite with a total +90% of market share. Splitting out natural graphite,
recarburisers, refractories and foundries consume half (~80%, or ~500ktpa) of all
natural graphite produced.
The emergence of the lithium-ion battery sector has seen demand for graphite
(synthetic + natural) for use in battery anodes increase by an estimated ~40%
from 2014-2016 to ~200kt. However, we point out that compared with traditional
carbon markets, batteries represent only a relatively small proportion of the
market with a current estimated market share of 11%, of which US$10,000/t dependent on
application, with input energy the key cost driver. This is more likely to be in the
range of US$12,000 – 20,000/t to produce a product for the battery anode
market compared with ~US$7,000/t for coated natural flake as presented in
Figure 25.
We highlight in Figure 59 that falling energy costs have likely influenced the
demand for flake graphite over the last several years contributing to suppressed
pricing.
17
20 November 2016 17Specialty Minerals and Metals
Industry Overview
Figure 24: Comparison of Anode Materials for Li-ion batteries Figure 25: Cost Breakdown of Coated spherical graphite
Material Energy Life Power Safety Cost 7000
Synthetic Very Good Good Moderate Good Moderate
Natural Flake Very Good Moderate Moderate Moderate Very Good 6000
Meso Phase Moderate Very Good Very Good Very Good Moderate
Input Item US$/t
5000
Hard Carbon Moderate Very Good Very Good Very Good Moderate
Soft Carbon Moderate Good Very Good Very Good Good 4000
3000
2000
1000
0
coated margin coating
uncoated margin acid purification
spheronising flake
Source: The outlook for EVs and future potential demand for graphite Christoph Frey - Managing Director Source: Company Reports, Canaccord Genuity estimates
ProGraphite GmbH
That said, we highlight that the historic preference for the use of synthetic
graphite in key end markets appears to be driven by poor quality natural
production (high proportion of amorphous graphite), compounded by recent
decreases in Chinese production. On this basis, we acknowledge an
opportunity for higher quality flake production from outside China to capture
existing market share and/or incremental demand growth.
Demand analysis - Lithium-ion batteries
LITHIUM ION (Li-Bs) BATTERIES –A RECAP
In Start me up – electric vehicles and grid storage to drive lithium demand (18
May’16), we outlined the key principles of how Li-Bs work, and the raw materials
required for the various battery components. As a recap:
Li-Bs all contain a positive cathode, a negative anode, and an electrolyte which as
acts as the conductor of Li ions as they move back and forth between the
cathode and anode during charge and discharge cycles.
The cathode is manufactured from a lithium-metal oxide compound, while the
anode is manufactured from a porous carbon (graphite). Graphite used in the
anode is derived from both synthetic and natural sources, shaped into
spheres to improve density and hence energy storage characteristics (i.e.
tapping density). A larger proportion of synthetic graphite has historically been
used (ratio can vary widely depending on the specific battery chemistry
employed by the anode manufacturer’s preferences; we understand the
market in 2015 to be ~70% synthetic in use as anode material currently) due
to its more consistent purity characteristics.
18
20 November 2016 18Specialty Minerals and Metals
Industry Overview
Figure 26: Ionic flow in a Li-B
Source: Battery University
SPHERICAL GRAPHITE – AN OVERVIEW
Spherical graphite is the physically and chemically altered form of natural graphite
that is used in the manufacture of carbon anodes for use in Li-Bs. A contained
purity of 99.95% TGC is essential for battery use, which requires a graphite
feedstock grade of +95% TGC.
The conventional processing route for producing spherical graphite involves the
following key processing steps (Figure 27) and is explained in further detail below.
Figure 27: Process Flowsheet for Spherical Graphite Production from Mine Site (Red) to Spherical Plant (Blue)
Source: Company Reports, Canaccord Genuity
19
20 November 2016 19Specialty Minerals and Metals
Industry Overview
Milling: the natural flake feed (-100 US mesh or 150 µm) is milled to a
product size for spherodisation of d50 (50% passing). A jet milling reduces
particle size on a ratio of ~5:1.
Spherodisation: involves converting flat graphite particles into spheres,
thereby allowing the graphite to be more efficiently packed into any given
space (“tapping density”). This tapping density combined with high purity
levels are the key factors in being able to produce the high electrical
conductivity that is required for battery anodes. This proprietary process is
believed to again use jet milling technology to shape the natural graphite
particles. Depending on purity, flake size and the required dimensions of the
product, yields can be between 30-50%.
Figure 28: Microscopic image of natural flake graphite Figure 29: Microscope image of uncoated Graphite Spheroids
Source: Asbury Carbons Source: Magnis Resources
Recarburiser Briquettes: As part of the spherodisation process graphite fines
or “shavings” are produced with typical yields from spherical products of 30-
40% depending on the characteristics of the spheroids produced as well as
the size distribution of the feedstock. The residual material (shavings) can be
converted into high quality recarburisers briquettes via further
agglomeration/sintering.
Purification: Produced spherical graphite is upgraded from a feed purity of
~95% TGC to meet product specifications of ~99.95% TGC. This is usually via
leaching (using a ratio of hydrofluoric and hydrochloric acid) to remove
entrained impurities (such as ash and silica) that are intercalated within the
adjacent voids between the graphene layers. Leaching is a lower cost
purification step than alternative thermal treatment with the main input costs
being that of reagents at around US$200/t of treated graphite. A more
expensive (at US$700/t) route is thermal purification which however is less
restrictive in terms of environmental regulations. ).
Coating: The final step is coating in which a pitch impregnation process to
heat treat and coat the spherical graphite occurs. Coating reduces the surface
area of the particles, thereby increasing the long term capacity of the battery.
Due to the complexity and energy requirements of this process, coated
spherical graphite currently sells for around +US$10,000/t (coated with
synthetic graphite) and between US$7,000/t- US$10,000/t (coated with
amorphous graphite). This compares with uncoated product selling for
20
20 November 2016 20Specialty Minerals and Metals
Industry Overview
US$3,000/t -US$4,000/t. We understand the coating stage costs to be
around US$2000/t (~25% of processing costs as presented in Figure 25).
Classification: Once coating has occurred a producer will plan to split the
spherical graphite product into various size fractions as specified by the
anode customer. For example a d50 of 23µm for grid storage applications and
a d50 of 16µm and 10µm for use in EV/Hybrid vehicles and consumer
electronics are examples of particle size specifications.
SYNTHETIC VS NATURAL GRAPHITE ANODES – NATURAL NOW COMPETING ON A
PERFORMANCE BASIS
The ability to customize synthetic graphite is in direct contrast to the natural
variability of flake graphite, and perceived as a potential limitation to the broad
range use of lower cost spherical natural graphite in battery anodes. That said,
continual refinements to the production process have seen the performance of
spherical natural flake graphite improve to now be comparable with synthetic
graphite.
Figure 30 and 31 below compare the reversible capacity of natural graphite and
synthetic, with natural being >360mAh/g which approaches theoretical limits of
372mAh/g. This suggests that on a like for like purity basis, natural graphite can
compete with synthetic graphite in determining battery performance.
Figure 30: Reversible Capacity of Synthetic Graphite -363 Ah/kg Figure 31: Reversible Capacity of Natural Spherical Graphite
Source: Focus Graphite Source: Focus Graphite
A key limiting factor of battery performance is the formation of solid electrolyte
interface (SEI, Figure 32 & 33), which initially coats the graphite anode to offer
protection against solvent degradation (within the electrolyte) at higher voltages.
SEI is essentially formed on the graphite surface, hence the irreversible charge
loss on the first cycle will be dictated by the properties of the surface area that is
exposed to the electrolyte solution. These properties include particle size, coating
thickness, crystallographic structure and particle morphology (shaping etc).
21
20 November 2016 21Specialty Minerals and Metals
Industry Overview
Figure 32: Representation of Graphite Degradation Figure 33: Solid Electrolyte Interface at the Anode
Source: Norwegian University of Science and Technology Source: Norwegian University of Science and Technology
Each anode application will have specific material requirements which will
influence the preferred source of graphite (natural or synthetic). It should also be
noted that this is likely to influence the product qualification process (duration,
consistency, limits) that new sources of natural flake will encounter to take
market share from synthetically produced graphite.
Our research suggests that ~40% of ~100kt of anode material is derived from
spherical natural flake graphite. The remaining 60% is from a source of synthetic
graphite materials which will depend on the specific performance required (see
Figure 24). Early stage test work from a number of graphite companies indicates
that coated natural flake graphite products have comparable if not superior
discharge performance versus synthetic graphite.
HOW MUCH GRAPHITE GOES INTO A LI-B?
In Start me up – electric vehicles and grid storage to drive lithium demand we
investigated the composition of raw materials used in the various types of Li-B
(based on varying cathode chemistry, Figure 34).
Figure 34: Li-B variants based on cathode chemistry
Lithium Cobalt Lithium Manganese Lithium Iron Lithium Nickel Lithium Nickel Cobalt
Battery Chemistry Oxide Oxide Phosphate Manganese Cobalt Aluminium Oxide
Short Fom LCO LMO LFP NMC NCA
Specific Energy Excellent Good Fair Excellent Excellent
Specific Power Fair Good Excellent Excellent Good
Heat Capacity (J/g) 1100 820 300 850 950
Safety Fair Good Excellent Good Fair
Performance Good Fair Good Good Good
Life Span Fair Fair Excellent Good Good
Cost Good Good Good Good Fair
In use since 1991 1995 1996 2003 1999
Voltage 3.60V 3.70V 3.30V 3.60V 3.0V
Cycles 1000 700 2000 1500 500
Mobile Phones, Power tools, medical Large Scale (grid E-Bikes, EV's E-Bikes, EV's (range),
Applications
laptops, camera devices storage), Buses (performance) disposable
Source: Battery University
We have reviewed the material specification sheets of a number of established
battery manufacturers’ products to determine the bills of materials for Li-B types
as presented in Figure 36 below. This indicates that on average 0.92kg/kWh of
coated graphite is required in spherical natural flake or synthetic form. From this
work, we see that the non-nickel based cathode chemistries use the most
graphite with Lithium Cobalt Oxide (LCO), Lithium Manganese Oxide (LMO) and
Lithium Iron Phosphate (LFP) batteries requiring the most amount of graphite per
22
20 November 2016 22Specialty Minerals and Metals
Industry Overview
kWh versus Lithium Nickel Cobalt Aluminium Oxide (NCA) which only uses
0.66kg/kWh.
Figure 35: Bill of Materials for standardized Li-ion battery (contained graphite shown in kg/kWh).
8.00
7.00 1.16
0.95
6.00
kg per kWh
5.00
4.00
1.32 0.85 0.66
3.00
2.00
1.00
0.00
LCO LMO LFP NMC NCA
Graphite Lithium Carbonate Steel Nickel Managense Copper Cobalt Aluminium
Source: Company Reports, Canaccord Genuity, SAFT, LG Chemicals, BYD, Panasonic
QUANTIFYING GRAPHITE DEMAND FROM LI-B’s
Expectations for significant growth in the Li-B market driven by e-transport and grid
storage
Figure 36 below illustrates our modelled installed battery energy capacity from the
electric transport (EV’s, e-buses etc), grid storage, and electronic device markets
(for further detail, see Start me up – electric vehicles and grid storage to drive
lithium demand).
We anticipate that the electric vehicle/electric transport markets will be the key
driver of demand for Li-B’s, with an estimated CAGR of installed battery energy
capacity across the electric transport market of 24% to 2025, and a CAGR of 20%
across the entire Li-B sector.
Figure 36: Li-B energy requirements across Segments
800
700
Installed Energy (GWh)
600
500
400
300
200
100
0
2014 2015 2016 2017 2018 2019 2020 2021 2022 2023 2024 2025
E-Motorbikes E-Scooters E-Bikes Battery Electric Bus Electric Vehicle - Large
Electric Vehicle - Small Plug-In Vehicle Hybrid Vehicle Other Electrical Devices Personal Computing
Smart Phones Mobile Phones Stationary Residential
Source: Company Reports, Canaccord Genuity estimates
23
20 November 2016 23Specialty Minerals and Metals
Industry Overview
Based on the above, we estimate total battery capacity requirements of +250GWh
by 2020, representing a CAGR of 21% from 2015. To support this, we further
estimate an additional ~150GWh of battery manufacturing capacity will be
required by 2020 alone, in the absence of any material impacts of battery
recycling and/or adoption of new battery chemistries/technologies. This is
illustrated in Figure 37, which shows global announced/required battery
manufacturing capacity estimates to 2020.
Figure 37: Installed battery manufacturing capacity (GWh)
260
240
220
200
Installed Capacity (GWh)
180
160
140
120
100
80
60
40
20
0
2014 2015 2016 2017 2018 2019 2020
Samsung SDI LG Chem
BYD Telsa
Pansonic Optimium Nano
CATL Boston Power
Electrovaya Faraday
Damlier Additional China
Additional ex China Various Current Chinese
Gigafactory Output (GWh) Gigafactory Output (EV's only; GWh)
Source: Company Reports, Canaccord Genuity estimates
Not all Li-B’s are created equal – specific graphite demand for Li-B’s based on
battery chemistry
Our modelled forecasts for the growth in the e-transport and grid storage sectors
are based on the various Li-B battery chemistries as shown in Figures 35 and 36
above (i.e. different batteries are used in different applications). Based upon our
projected installed battery capacity, we have broken this down into projected
demand (in GWh of installed capacity) according to cathode chemistry (Figure 38).
Figure 38: Installed Battery Capacity by Cathode type
700
Installed Capacity (GWh)
600
500
400
300
200
100
0
2014 2015 2016 2017 2018 2019 2020 2021 2022 2023 2024 2025
LCO LMO LFP NMC NCA
Source: Company Reports, Canaccord Genuity estimates
24
20 November 2016 24Specialty Minerals and Metals
Industry Overview
Use of natural graphite in Li-B’s will depend on a significant shift away from
synthetic
Based upon our projections for Li-ion battery demand depending on the various
cathode chemistries and graphite raw material requirements, we have estimated
the required demand for natural flake graphite in Figure 39 below. This shows
that demand for flake graphite from the Li-B market could grow by a CAGR of 25%
from 2015 to 2025 to 792kt (from ~84kt).
Figure 39: Natural Flake Demand from the Li-ion battery market
900
800
Annual Demand (ktpa) 700
600
500
400
300
200
100
0
2015 2016 2017 2018 2019 2020 2021 2022 2023 2024 2025
Business as Usual 50% Base Case
Source: Canaccord Genuity estimates
As part of our projections, we have assumed a spherical graphite yield (from
natural flake feedstock) of 40% increasing to 50% by 2020 (based on an
assumption that production processes improve and higher volumes of higher
quality non-Chinese flake feedstock). Against this we present three scenarios
relating to the penetration rates of natural graphite as battery anode material;
Business as usual (40%): This projects a business as usual scenario whereby
Natural flake graphite only supplies 40% of all future battery anode material.
In this case we forecast natural graphite demand to double from ~80kt in
2015 to ~180ktpa in 2020 and to ~200ktpa by 2025, implying a CAGR of
20%.
Mid Case (50%): For comparison we have forecast the impact of 50% of
battery anode being from natural flake from 2016-2025. This implies a CAGR
of 23% to 2025 with 660kt of natural flake expected by this stage.
Base Case (60% from 2020): Under this scenario we assume that the cost
savings associated with using spherical graphite derived from natural flake
(~US$7/kg vs +US$10/kg) will translate to a rapid shift in preference away
from synthetic graphite. We also assume that as further test work validates
performance characteristics, acceptance of naturally sourced anode materials
will become more widespread. This is expected to translate to a 5% YoY
increase in natural flake use from 40% to 60% from 2020 onwards. Under our
base case, we forecast natural graphite demand to more than treble from
~80kt in 2015 to ~300ktpa in 2020 and to ~820ktpa by 2025, implying a
CAGR of 26%.
25
20 November 2016 25Specialty Minerals and Metals
Industry Overview
Demand analysis – traditional markets
Traditional markets for graphite include recarburisers (steel production), foundries
(metal casting), refractories, lubricants, and other industrial applications such as
friction products. Within these markets, we have identified four key opportunities
for increased demand for natural flake:
Adoption of electric arc furnaces in crude steel production.
Replacement of lower-quality recarburisers in cast iron production.
Replacement of lower-quality amorphous graphite in traditional markets
Replacement of lower-quality industrial anodes in aluminum smelting
RECARBURISERS – AN OPPORTUNITY FOR NATURAL FLAKE BUT MARKET
DOMINATED BY ALTERNATIVE CARBONS
Recarburisers are additives in the steel and cast iron production process that are
used to adjust carbon content and hardness properties. Recarburisers for steel
production and foundries currently account for an estimated ~31% of total
graphite (synthetic and natural) demand, and ~45% of demand for natural flake.
The recarburiser market is estimated at ~3Mtpa, of which 76% is attributed to
Gray Iron and Ductile Iron production, and 24% to electric arc furnace (EAF) steel
production (Figure 40). The supply of carbon products into this market is
dominated by Alternative Carbon sources including metallurgical coke, pet coke
and synthetic graphite, with ~195ktpa of natural graphite currently used (despite
recent falls in natural graphite prices).
Figure 40: Global recarburiser market breakdown Figure 41: Recarburiser market by carbon source
13%
Demand - Demand -
Ductile, EAF, 24% 4%
29% 4%
79%
Synthetic Natural Flake
Demand -
Gray, 47% Amorphorus Alternative Carbon
Source: Company reports, Canaccord Genuity estimates Source: Company reports, Canaccord Genuity estimates
In our view, these segments are likely to continue to be the foundation market for
natural flake graphite on the basis that it contains lower sulphur and other
impurities, and is expected to increase in use as regulatory and customer
requirements in these markets become more stringent.
26
20 November 2016 26Specialty Minerals and Metals
Industry Overview
Growth in EAF steel production a positive for natural graphite recarburisers
Global steel production is currently ~1.6Btpa, with global demand for steel directly
correlated with gross domestic product. China produces ~50% of world crude
steel, with an annual CAGR from 2000-2015 of 12%. This compares with global
(ex-China) CAGR’s of 2%.
Figure 42: Historical crude steel production profile 2000-2015 Figure 43: Global steel production – BOF vs EAF
1800
1600
BOF EAF
1400 26%
25% 26%
27%
1200
25% 32%
m tonnes
1000 33% 30%
31% 24%
800 29%
29%
600 34%
36%
38% 36%
400
200
0
2000 2001 2002 2003 2004 2005 2006 2007 2008 2009 2010 2011 2012 2013 2014 2015
Source: World Steel Association Source: World Steel Association
The global steel industry has undergone significant change over the past two
decades as steel production from EAFs has increased significantly (in volume
terms), driven by an increase in environmental regulations in the developed world
and the increased capacity to process recycled steel. Of the global crude steel
market, approximately 28% is now produced via EAF (6% in China), which has
increased by +80% in the last 10 years in absolute terms (Figure 43).
Due to the ability to use larger volumes of scrap steel, EAF offer several
advantages over basic oxygen furnaces (BOF) including:
Lower carbon emissions
Lower raw material requirements
Lower energy requirements
Lower capital intensity
While the use of graphite as a recarburiser in BOFs is limited (autogenous
oxidation and difficulties with furnace ignition using graphite), the growth of EAF
steel production offers a potential market opportunity for natural graphite. EAFs
require higher purity recarburisers, which gives natural graphite carbon additives
a clear advantage given superior purity levels (+95% TGC vs met coke at ~85%
TGC).
However, major shift from BOF to EAF not yet evident
Tighter environmental standards in China and around the world could provide
impetus for increased conversion to EAF (e.g. China’s commitment to cut CO2
emissions by 60-65% of GDP by 2030 as part of 2016 Paris Climate Agreement),
with other factors including increased supply of scrap/recycled steel and better
electric energy supplies.
However, we note that only 6% of steel production in China (representing 3%
share of global production) comes via EAF. A large-scale conversions of BOF to
EAF steel production in China does not yet appear evident, while on a global scale,
we note that the global market share of EAF steel production has remained largely
unchanged since 2010 (Figure 43).
27
20 November 2016 27You can also read